chapter 4: more on two- variable data. correlation and regression describe only linear...
TRANSCRIPT

Chapter 4: More on Two-Variable Data

Correlation and Regression • Describe only linear relationships• Are not resistant
One influential observation or incorrectly entered data point can greatly change these measures.
Extrapolation• Use of a regression line for prediction far
outside the domain• Such predictions are not generally accurate
2
4.2: Cautions about Correlation & Regression

Lurking Variable• Variable not among the explanatory or
response variables• May influence the interpretation of
relationships among those variables. Confounding Variable
• Two variables are confounded when their effects on a response variable cannot be distinguished from each other
• May be either explanatory variables or lurking variables 3
Cautions about Correlation & Regression cont.

Studies Using Averaged Data• Resist (don’t) applying results to individuals
Correlations usually too high when applied to individuals
Causation (cause & effect)
• Even a very strong association between two variables is not by itself good evidence that there is a cause-and-effect link High correlation DOES NOT imply causation
• Establishing CausationConduct a carefully designed experimentControl effects of possible lurking variables
4
Cautions about Correlation & Regression cont.

Homework: #’s 27, 28, 33, 36
Any questions on pg. 25-28 in additional notes packet
5
Section 4.2 Complete

Categorical Variables• Use counts or percentages that fall into various
categories• Organized into two-way tables
Two-way tables describe two categorical variablesRows make up one variable; columns make up
the other
6
Section 4.3: Relations in Categorical Data
One Variable with its categoriesSecond variable
Cat 1 Cat 2 Cat 3 Cat 4 TotalCat 1 X1-1 X1-2 X1-3 X1-4 Marginal
DistributionsCat 2 X2-1 X2-2 X2-3 X2-4
Total Marginal Distributions Total
Conditional Distributions will be created by taking these values and dividing by either one
of the Marginal Distributions

7
53751004
18.7%5375
1356 2239 1780
25.2% 41.7% 33.1%
(a) How many students do these data describe?
(b) What percent of these students smoke?
(c) Give the marginal distribution of parents’ smoking behavior, both in counts and in percents.

8
53751004
18.7%5375
1356 2239 1780
25.2% 41.7% 33.1%
(a) How many students do these data describe?
(b) What percent of these students smoke?
(c) Give the marginal distribution of parents’ smoking behavior, both in counts and in percents.
(d) Give the conditional distribution of parents’ smoking behavior given the student does not smoke.
116826.7%
4371
182341.7%
4371
138031.6%
4371
26.7% 41.7% 31.6%

9
Cold Neutral Hot
Hatched 16 38 75
Did not hatch
9 18 29
64%
36%
68%
32%
72%
28%

Refers to the reversal of the direction of a comparison or an association when data from several groups are combined to form a single group.• The principle behind this reversal is that of
weighted averages. Using a higher weight in one category for one group while the second group uses a second category to be its higher weight.
10
Simpson’s Paradox:

Upper Wabash Tech has two professional schools, business and law. Here are two-way tables of applicants to both schools, categorized by gender and admission decision.
A. Combine the data to make a single two-way table of gender by admission decision.
11
An Example of Simpson’s Paradox
Business LawAdmit Deny Admit Deny
Male 480 120 Male 10 90Female 180 20 Female 100 200
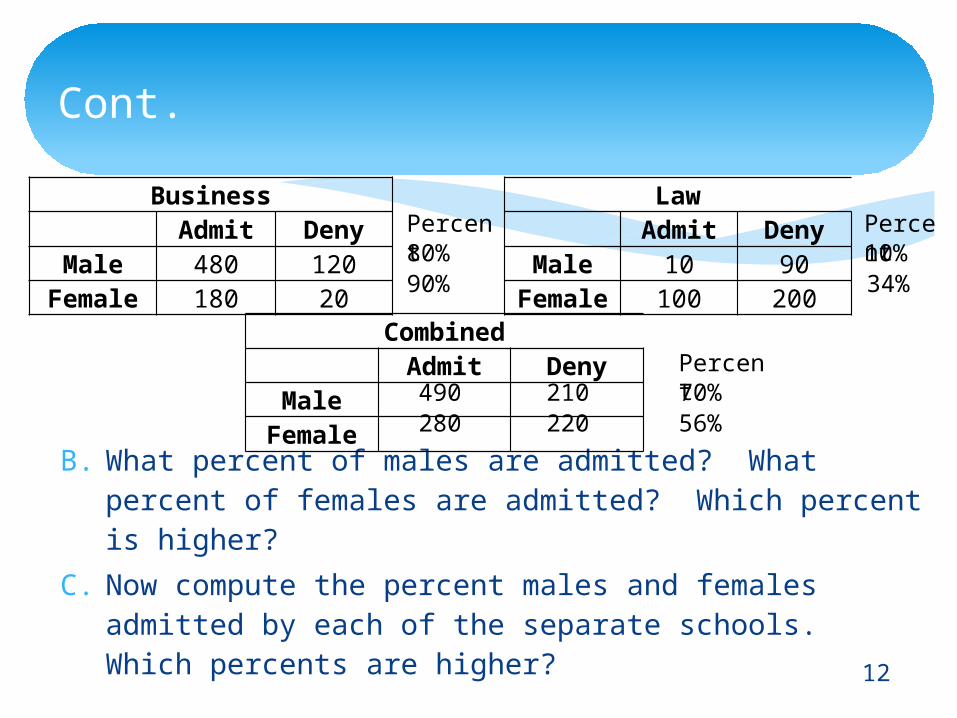
B. What percent of males are admitted? What percent of females are admitted? Which percent is higher?
C. Now compute the percent males and females admitted by each of the separate schools. Which percents are higher?
CombinedAdmit Deny
MaleFemale
12
Cont.
Business LawAdmit Deny Admit Deny
Male 480 120 Male 10 90Female 180 20 Female 100 200
490280
210220
70%Percent
56%
80%Percent
90%10%Percent
34%

D. Why is this occurring? Explain how it can happen that Wabash appears to favor males when each school individually favors females.
Ans: The business school accepts a higher percentage of students all together than the law school does. So when 86% of the males applied to the business school while only 40% of the females applied to the business school, more males got into Wabash university all together. This gives the appearance that Wabash favors males. This reversal of the direction of an association when data from several groups are combined to form a single group is know as Simpson’s Paradox.
13
Cont.
Homework: #’s 55, 59, 61, 62,
Any questions on pg. 29-32 in additional notes packet
14
Section 4.3 Complete

Chapter Review
15

16

17

18

19

Homework: #’s 79, 81, 83
Any questions on pg. 33-36 in additional notes packet
20
Chapter 4 Complete