chapter 4 measurement methods of integrated …bbs.hwrf.com.cn/downpcbe/chapter4 measurement...
TRANSCRIPT

Chapter 4
MEASUREMENT METHODS Emission and susceptibility of integrated circuits
Abstract: This chapter deals with measurement methods for characterizing the parasitic emission and immunity of integrated circuits. We detail most of the standard methods promoted by IEC 61967 for emission, namely the TEMIGTEM, the near-field scan, the Workbench Faraday Cage and the 1115051 conducted methods. Concerning susceptibility, we detail the Bulk Current Injection and Direct Power Injection methods from the IEC standard 62132. Furthermore, impulse immunity methods are also described, as well as on-chip measurement approaches for noise characterization.
Key words: RF emission; RF immunity; Impulse immunity; DPI; BCI; WBFC; TEM; GTEM; anechoic chamber; mode stirred chamber; near-field scan; probes; international standards; digital circuits; mixed signal; fast pulses; ESD; EFT; IEC 61967; IEC 62132; IEC 62215; Jitter
INTRODUCTION
Electromagnetic compatibility test setups at electronic system levels are defined in standards such as CISPR 25 (CISPR, 2002) for parasitic emission and ISO-11452 for susceptibility to electromagnetic interference. In many cases, integrated circuits are the cause of disturbances in electronic equipment. In recent years, there has been a strong demand for simple, reliable and standardized measurement methods focusing only on integrated circuits, that electronic system designers could use to:
Select components based on their low emission performance and high immunity to electromagnetic interference.
Define optimum filtering and decoupling components to be added to printed circuit boards. Optimize integrated circuit placement and routing, to fulfill EMC specifications at board level.
Evaluate the impact of integrated circuit redesign, technology shrink or package modification.
106 Measurement Methods
The International Electro-technical Commission, sub-committee 47A, working group 9 (Measurement methods for integrated circuits) has released two main standards, one for radio -frequency (RF) radiated and conducted emissions under project number IEC 61967 (IEC, 2001), and more recently a second one for RF immunity under project number IEC 62132 (IEC, 2003). The emission standard IEC 61967 has 6 parts:
Part 1 : General and definitions. Part 2: TEM-cell and wideband TEM-cell (radiated emission method). Part 3: Magnetic loop (radiated emission surface scan method). Part 4: 1 Bl150 B (differential conducted emission). Part 5: Workbench Faraday Cage (common mode conducted emission). Part 6: Magnetic probe (radiated emission in magnetic probe). The roadmap for standardization of the measurement methods related to
electromagnetic emission is shown in Table 4-1. It can be seen that four parts are completed, while the TEMIGTEM is at the Committee Draft for Voting (CDV) stage. The surface scan method should remain in at the technical report stage. In 2004, a new part has been introduced, related to the mode-stirred chamber.
Table 4-1. IEC 61967 - Measurement of Electromagnetic Emission up to 1GHz Standard Description 2000 2001 2002 2003 2004 2005 IEC Definitions Completed 61967-1 IEC TEMIGTEM Committee CDV Completed 61967-2 Cell draft IEC Surface Technical New 61967-3 Scan report prop.
>lGHz IEC 1/15052 Final draft Completed 61967-4 conducted for voting IEC WBFC Final draft Completed 61967-5 for voting IEC Magnetic Final draft Completed 61967-6 probe for voting IEC Mode stirred New 61967-7 ch. prop.
The immunity standard IEC 62132 (IEC, 2003) has 5 parts: Part 1 : General and definition. Part 2: TEM-cell and wideband TEM-cell (radiated immunity method). Part 3: BCI, bulk current injection method (conducted immunity). Part 4: DPI, direct RF injection method (conducted immuiity). Part 5: Workbench Faraday Cage (common mode conducted immunity method).

Measurement Methods 107
Some similarities with the previous standard may be noticed in the structure of the document. Also, the TEM cell method and the WBFC method have been proposed for both emission and susceptibility characterization. The roadmap for standardization s f susceptibility measurement methods (Table 4-2) is clearly shifted in time as compared to the emission roadmap. The most mature measurement method appears to be the WBFC approach, currently at the Committee Draft for Voting stage.
Table 4-2. IEC 62132 - Measurement of Electromagnetic Immunity up to 1GHz Standard Description 2000 200 1 2002 2003 2004 2005 IEC Definitions Committee 62132-1 Draft IEC TEM/GTEM New Committee 62132-2 Cell proposal Draft IEC Bulk current Committee 62132-3 injection Draft IEC Direct Committee 62 132-4 power Draft
Injection IEC WBFC Committee CDV 62132-5 Draft IEC Mode New 62132-6 Stirred ch. proposal
Recently, discussions have started on the establishment of a new standard proposal (IEC 62215) for the measurement of transient immunity to impulses, electrostatic discharge (ESD), Electrical Fast Transients (EFT) and electrical overstress (EOS).
This' chapter describes the following set of measurement techniques: the TEMIGTEM method, the near-field scan, the Workbench Faraday Cage, the 11150 SZ method, the bulk current injection, direct power injection and transient immunity methods, the anechoic chamber and on-chip measurement. Finally, recommendations regarding EMC test plans are provided, as well as some prospective and a conclusion.
2. TEMJGTEM METHOD
The Transverse Electromagnetic Mode (TEM) cell and its high-frequency variant - the Gigahertz TEM (GTEM) cell - are commonly used for measuring electromagnetic emissions radiated by an IC as well as for measuring IC immunity to electromagnetic fields. This measurement method is standardized as IEC 61967-2.

108 Measurement Methods
2.1 Description
The TEM cell (Fig. 4-1) is an expanded rectangular waveguide with an inner conductor called the septum, whose characteristic impedance is set to 50 Q and which is terminated by two tapered ends to connect 50 Q-adapted coaxial cables.
test I I
Figure 4-1. Picture and cross-sections of the TEM cell.
Eiectnc and Magne1.c fields a*c? perpendicular to the
wave propagation d;r%llon Z
Figure 4-2. Picture of the TEM mode propagating in free space.
Due to the shape of its cross section, a Transverse Electro-Magnetic (TEM) wave can propagate in the cell. The TEM mode (Fig. 4-2) is characterized by electric (E) and magnetic (H) fields that are in a plane perpendicular to the wave propagation direction. In this plane, electric and magnetic fields are also perpendicular to each other (Fig. 4-3).

Measurement Methods
Electric field
- -. - - - - Magnetic field
Q u r e 4-3 E-field and H-ficld distribution ('I'EM modc) in a cross-section of the TEM cell.
At low frequency, only the TEM mode can propagate in the cell. But as the frequency of the electromagnetic wave increases, higher order modes (TE for Transverse Electric modes and TM for Transverse Magnetic modes) become propagative in the central section of the cell, and spurious resonance phenomena appear in the cavity. The maximum frequency for the use of the TEM cell is set by the first resonance of the lowest higher order mode, which depends on the size and shape of the cell. Typical cell dimensions are given in Fig. 4-4, which corresponds to a I -GHz cut-off frequency.
Figure 4-4. Typical dimensions of a 1-GHz E M cell

Measurement Methods
f7lgure 4-5. Experimental setup for generating or measuring a TEM wavc with a known magnitude in the TBM cell.
From DC to the cell maximum frequency, the TEM mode has constant magnitude response as a function of frequency. Hence a known field can be generated in the TEM cell (Fig. 4-5), the strength of the electric field being given by Eq. (4-1) as follows:
where h is the height between the septum and the TEM cell outer wall, V,, is the magnitude of the voltage applied at the TEM cell input, P,, is the input power into the TEM cell, and Z(. is the characteristic impedance of the TEM cell (usually Z(. = 50 R).
Examples of electrical field calculations for varying power and height are provided in Appendix A. On the other hand, the field intensity inside the TEM cell can be deduced from the voltage or the power measured at the cell output, following Eq. (4-2).
where VoU, is the measurement output measurement output.
magnitude of the voltage measured at the TEM cell and P,,,, is the power measured at the TEM cell

Measurement Methods 111
2.2 IC emission measurement setup in the TEM cell
The aim of the TEM cell measurement standard is to quantify the global radiation from a component, at a short distance. To that purpose, the IC under test is mounted on a 10-cm square Printed Circuit Board (PCB) with four metal layers (Fig. 4-6). The chip under test is fixed alone over a ground layer on one side of the PCB, whereas power supply and other signals necessary to activate the IC are routed on the three other layers.
The test board is inserted in an aperture in the outer wall of the TEM cell with the chip inside the cell, so that the ground layer becomes a part of the wall, closes the ground shielding and isolates the integrated circuit from the outside world. One of the ports of the TEM cell is connected to a spectrum analyzer through an optional low-noise amplifier, while the other port is terminated with a 50 Q load (Fig. 4-7). A more detailed description of TEMIGTEM compatible board requirements is available in IEC 61967-2 standard.
Layer2 - power Laver3 -stanal
Figure 4-6. Description of the TEM-cell
IC Test Board \
compatible PCB.
Preamplifier (optional) AJ-q)=l+
50 Ohm Termination
Spectrum Analyzer TEM Cell or EM1 Receiver
Figure 4-7. TEM cell measurement setup.

112 Measurement Methods
As the IC is activated, its radiation excites the TEM mode that propagates toward the cell measurement output. The RF voltage measured - in dBpV - at the cell extremity is proportional to the electromagnetic emission spectrum of the component.
The coupling mechanism between IC radiation and the TEM mode has been investigated by Muccioli (1996). In the IC, pulsed currents flow through package pins, lead frames and bonding interconnectioiis that behave like electric and magnetic dipoles. As the IC is inserted in the TEM cell, some of these radiating elements are coupled with the TEM mode while others are not. In the example given in Fig. 4-8, IC current path is equivalent to the combination of a vertical loop and a horizontal loop. In the case of orientation A, the horizontal loop radiates a vertically polarized magnetic field that is orthogonal to the magnetic field distribution of the TEM mode in the cell (see Fig. 4-3). Hence, this radiation does not couple with the TEM mode. The magnetic field radiated by the vertical loop is collinear to the magnetic field distribution in the cell, so the TEM mode is excited by the radiation of this loop. As the IC is positioned in orientation B, neither the horizontal nor the vertical loop is coupled with the TEM mode. Therefore two emission measurements are usually performed to characterize accurately the radiations from an 1C: the first measurement is done with the test board mounted in an arbitrary orientation in the cell outer wall, then the second measurement is performed with the test board rotated 90 degrees from the orientation of the first measurement. However, the measurement standard stipulates that the four orientations should be investigated, and that only the spectrum with maximum amplitude should be considered.
I orientation A I
orientation B
Figure 4-8. Coupling mechanism between IC current paths and the TEM mode propagating in the ' E M ccll.

Measurement Methods
2.3 TEM cell measurement of the radiations from a microprocessor
The following section presents typical measurement results of the emissions from an IC. The component under test was a 16-bit microcontroller mounted on a TEMIGTEM compatible test board. The cell used for measurements was a Fischer TEM cell, with a cut-off frequency of 1 GHz, and with a septum-to-aperture spacing of 45 mm. Its output port was connected to an Advantest R3131 spectrum analyzer (9 kHz - 3 GHz) through a 30 dB amplifier (DC to 2 GHz). The resolution bandwidth (RBW) and video bandwidth (VBW) parameters were set to 10 kHz over the whole frequency range. The "max hold" function of the spectrum analyzer was enabled.
Two programs (OUTCLK and OUTCAPA as detailed in Table 4-3) were loaded in the EEPROM memory of the component.
Table 4-3. Brief description of the programs loaded into the microcontroller Program Description OUTCLK PPL active
Clock frequency set to 50 MHz Clock signal flowing out of the component through an I10 pin Other ports inactive
OUTCAPA PPL active Frequency set to 50 MHz Clock signal flowing out of the component through an I10 pin. 8-pin port terminated by capacitive loads Port A set as output Port A switching between values of Ox55 (01010101) and OxAA
TEM cell measurements were carried out in the frequency range 1 MHz - 1 GHz, for each program running into the microcontroller, and for two orientations of the test board, with a 90° rotation between the two orientations. The radiation spectra measured for the two programs (OUTCLK and OUTCAPA) with the same orientation of the microcontroller are compared in Fig. 4-9.
These results point out the importance of the program running into the component. Before performing TEM cell measurements, special attention has to be given to the choice of the operation test mode.
Fig. 4-10 shows the radiation spectra related to the OUTCLK program, for two perpendicular orientations of the microcontroller. These results clearly underline the orientation dependence; that is why two measurements with perpendicular orientations of the test board are required.

Measurement Methods
Amplitude (dBpV)
10.0 100.0
Frequency (MHz)
Figure 4-9 TEM cell measurement of the radiation from the microcontroller: same orientation, dlffercnt programs.
Amplitude ( d B N
10.0 100.0
Frequency (MHz)
Figure 4-10. TEM cell measurement of the radiation from a component: same program, different orientations.
Measurement Methods 115
2.4 The GTEM: a high-frequency variant of the TEM cell
The GTEM cell (Fig. 4-11) was designed to overcome the TEM cell frequency limitation. It consists of a tapered section of rectangular transmission line, with an offset and sloping septum plate. The septum is tapered so that the characteristic impedance is maintained to 50 C2 along the length of the cell. The wide extremity is terminated by a distributed resistive load that operates as a 50 Q load circuit at low frequency, and by pyramidal foam absorbers that attenuate the electromagnetic wave at high frequency. The narrow extremity is terminated by a 50 SZ -adapted coaxial connector.
foam absorber
50 Ohms resistive load 1
Spectrum Anal) or EM1 Receiver
Figure 4-11. Picture and cross-section of the GTEM cell
IC Test Board
a#&# o I I I I I I
Figure 4-12. GTEM cell measurement setup.
0000 0000 0000 a 0 0 GTEM Cell
Preamplifier (oplional)

116 Measurement Methods
The protocol for IC emission measurement in the GTEM cell (Fig. 4-12) is the same as for the TEM cell. But thanks to its matched termination and its tapered structure, the GTEM cell allows measurements up to frequencies of several GHz - typically 18 GHz.
As the test board is inserted into the cell outer wall, IC emissions locally excite several modes, not only the fundamental TEM, but also TE and TM modes (De Leo, 1991). These modes propagate toward the narrow extremity of the GTEM cell. As the dimension of the cross-section decreases, higher order modes cut off and transfer the power they carried to the fundamental mode. At the cell output, the TEM mode carries almost all the power radiated from the IC.
2.5 Correlating the results of measurements from different cells
Measuring the radiation from the same IC in TEM and GTEM cells should lead to identical results since the IC-to-septum spacing is similar. The correlation factor between two cells can be expressed as:
where Voul,Ifl (respectively Vou,,2fl) is the voltage spectrum measured at the output of the cell C, (respectively C2) and hl (respectively h2) is the height between the septum and the aperture in the outer wall of the cell C, (respectively C2).
The shift in emission levels between two sets of measurements performed with the same IC inserted successively in cells C, and C2 is given by:
The aperture position dedicated to ICs characterization in the GTEM cell has been adjusted to obtain an IC-to-septum spacing close to the one found in most TEM cells (i.e. 45 mm). Figure 4-13 shows the results of emission measurements from a 16-bit microcontroller. The IC was mounted in a TEMIGTEM compatible test board, and successively inserted in a Fischer TEM cell (with a septum-to-aperture spacing of 45 mm) and in the SAE aperture of a Schaffner GTEM 250.

Measurement Methods
Frequency (MHz)
Figure 4-13. Measurement of the radiation from a component in a TEM cell and in a GTEM.
Emission measurements were performed for the same orientation of the component, with the same program running into it, and with the same settings of the spectrum analyzer. As expected, the two plots are almost identical over the whole frequency range.
3. NEAR-FIELD SCAN
The near-field scanner was adapted to the problem of the integrated circuits by K. Slattery (1999), with a resolution high enough to map the fields above integrated circuit packages. Many research labs involved in the study of chip-level EMC are now using near-field scanners. Specific probes connected to a receiver measure the amplitude and phase of a selected component of the electromagnetic field radiated by the integrated circuit.
Measurement methods which determine the EM field by the use of a radio-frequency receiver may be classified in two main techniques. The direct technique involves a coaxial cable to connect the probe to the receiver as shown in Fig. 4-14.

11 8 Measurement Methods
to spectrum
Control unit
Figure 4-14. Example of a near-field scanner sctup
The second technique creates a perturbation by introducing a scatterer at the desired observation point, to enhance the spatial resolution and to reduce the parasitic coupling between the probe and the device under test. For improved sensitivity and spatial discrimination, the scattered signal is modulated and the receiver discriminates between the modulated and the parasitic signals (Garreau, 1992). Several kinds of modulation - mechanical, electrical and optical - are discussed and compared by Bolomey (2001).
In the case of electrical modulation, the low-frequency signal propagates through a high resistive metallic support to avoid additional perturbations. An optical fiber associated with a modulated light source can be used to reduce further the aforementioned risk of perturbation (Liang, 1997).
3.1 Scanner and positioning system
The mechanical positioning moves either the probe or the device over a planar surface. An example of a near-field scanner developed at ENSEEIHT, Toulouse, France, is shown in Fig. 4-15. The structure should present a minimum amount of reflective area to the test device. Absorbant material can be added and put on the metallic scanner supports and cables.
Displacement of the probe can be carried out according to rectangular or polar axes. The scanning surface needed for integrated circuit near-field measurements usually ranges from 2x2 cm up to 10xlOcm.
Measurement Methods 119
Figure 4-15. Near-field scanner and mechanical setup.
Probe p
Figure 4-16. Photograph of the spherical test setup at IETR Rennes, France.

120 Measurement Methods
The time required to move the single probe can be accelerated using a probe array. The probes are connected to a receiver through a switched combiner or a multiplexer.
To overcome the drawbacks of multiport connections, the signal in the selected channel is modulated which guarantees a good dynamic range. The modulation can be performed using a switched diode. Several available architectures using wired and wireless combiners are described in (Bolomey, 2001). A spherical near-field setup based on the electrical modulation is depicted in Fig. 4-16. Installed in an anechoic room, the system consists of an arch on which about 30 bipolarized probes of measurement are distributed. An electronic sweep of these probes makes it possible to reach, in real time, the radiation patterns. The full radiation sphere is then obtained thanks to a combination with an azimuth positioning.
3.2 Probes for near-field scanning
Near-field probes consist of small antennas mounted on scanning mechanism, and their electromagnetic properties enable to capture one particular component of the field: magnetic field Hx,Hy, Hz along the X,Y or Z axis, electrical field Ex,Ey, Ez along the X,Y or Z axis. The probes should:
Be highly sensitive to the desired field component. Reject all other undesired components. Feature a high spatial resolution. Not disturb the measured field. Simple and practical probes use the inner conductor of a 50 Q semi-rigid
coaxial cable. Fig. 4-17 shows a typical construction for monopole and dipole coaxial probes. The more popular one is the coaxial monopole antenna (Ez probe). The coupling between the probe and the device under test is mainly capacitive (Gao, 1998). This type of probe provides the measurement of the vertical component of the E field.
The probe size should match the spatial resolution. In practice, the loop size is close to 1 mm, to achieve an acceptable spatial resolution for the scan of integrated circuits. If the probe size is decreased, the amplitude of the received signal will be reduced and the signal-noise ratio will be lowered. For minimum disturbance, the inner conductor is cut in the same plane as for the outer coaxial conductor (Fig. 4-17). This geometry may reduce the intrusion of the probe but leads to a decreased sensitivity. In order to reduce parasitic currents that may flow on the outer part of the coaxial cable, a small shielding or absorbers may be added at the far end of the probe.

Measurement Melhods
To spectrum analyser
Integrated CIrC7llt
Ez Probe w~ th
External part of the rn~n~rnurn Coaxral cable Ez Probe antenna connected to ground
Insulutor
the Coax~al Very short cable acirng antenna to as an antenna tnlnlmlze
capaclhve couplrng
Ez Probe with enlarged plate
Enlarged ground plane to reduce parasltlc currents on the cable
Figure 4-1 7. Coaxial clcctric probe for Ez measurement.
Differential Differential Ez Probe Ex Probe
Grou
Flgure 4-18. Coaxial electric probes for Ex, Ez mcasurcmcnt using coaxial cables and planar conductors.
To measure the tangential field components, electrical dipoles can be used in a surface over a device. Fig. 4-18 shows examples of coaxial probes for EdEy measurement, in coaxial and planar technologies. Coaxial probes have been investigated by Budka (1996) for electric field measurement up to 18GHz. Loop probes are widely employed for magnetic field characterization (Kazama, 2002). The IEC 61967 standard (IEC, 2001) includes in its Part 3 a detailed presentation of radiated surface scan measurement methods, with some recommendations regarding the design and connection of magnetic probes. Fig. 4-19 gives an example of a near- field magnetic probe manufactured according to the standard.

122 Measurement Methods
1. Coaxial cable to spectrum analyzer
I Center conductor /
soldered to shield creating a small
I magnetic loop
Figure 4-19. Example of magnetic probe.
The current induced across the loop is proportional to the incident magnetic field that is normal to the loop plane, according to the following expression. Considering that the loop terminations are connected via a cable to the 50 L2 input impedance of the spectrum analyzer, the measured power P,,, is linearly dependent on the magnetic field present at the probe location.
The probes require a rigorous calibration procedure to obtain absolute field measurements. The link between the power P,&n dBm) and the magnetic field (dBA/m) may be established by measuring the near-field power above a simple 50 Q test structure and by comparing it to an absolute field H computed by 3D electromagnetic solvers.
The Probe Performance Factor (PPF) introduced in the following equation has a simple dependence versus frequency up to 1 GHz, as shown in Fig. 4-20 for a 2 mm magnetic loop.
It should be noticed that the measured field corresponds to an average taken over the surface of the probe. Furthermore, the resulting signal corresponds to a convolution of the electromagnetic field with the probe radiation pattern. The deconvolution is a mathematical operation that modifies the measured scan in order to eliminate the field modifications induced by the probe.

Measurement Methods
1 10 100 1000
Frequency (MHz)
Figure 4-20 l'robc pcrlbrmance factor dcpcndencc vs. firequency.
It is usually carried out for each (X, Y) coordinate of the scan, by dividing the measured field by the probe response. For a probe having a cross polarization component, the compensation becomes more complex (Bolomey, 2001). Whereas vector field determination requires the absolute measurement of two quantities (modulus and phase), the determination of field level for EMC application firstly requires the measurement of the modulus. Adding the phase information make it possible to extract the current orientation as well as the delay.
3.3 Integrated circuit emission
As a practical application, we present an investigation concerning the radiated emission of an ALTERA programmable device mounted on a leadless carrier fixed on a double-face printed circuit board.
The photographs in Fig. 4-21 show the metal layer on the top and bottom surfaces of the test board. The external components include a 5V regulator, filtering capacitors, and a RAM memory. The BNC connector feeds the board with a lOMHz clock signal with a rise time of 5ns and 50% duty cycle.
The near-field measurements were conducted using the ESlGELEC scanner (Baudry, 2004), with a 2.0 mm magnetic probe built with two adjacent coaxial cables. The probe orientation corresponds to the X axis of Fig. 4-22. The spectrum analyzer measures the difference between the two inner conductors of the coaxial cables thanks to the hybrid 180" coupler.

124 Measurement Methods
Upper side
I
I- ' I
Lower side
Figure 4-21. The test IC and its printed circuit board.
xinmrn
220hl.V~
Figure 4-22. Near-field maps (f=50 MHz, right 6220MHz) with probe oriented along the x- axis.
The scan reported in Fig. 4-22 was recorded at 50 MHz and 220 MHz, at an altitude h of 4.0 mm above the board ground plane, which corresponds to the reactive near-field zone (h<<A/2n). The resolution bandwidth (RBW) of the analyzer spectrum was set to 3 kHz. The gray scale gives the correspondence with the relative magnetic field intensity. One can see that the zone with maximum field is located above the integrated circuit (center of the scan), and correlates to the clock tracks (bottom left). The scan frequency of 50 MHz corresponds to the fifth harmonic of the clock signal, which contains significant energy in higher harmonics due to its square shape. The clock contribution at 220 MHz is significantly reduced, and the field is mainly concentrated around the IC package.

Measurement Methods
3.4 Discussion
Based on contact-less measurements, the near-field technique represents a valuable tool for investigating the electromagnetic interference produced by integrated circuits, both analog and digital. Regions with a strong magnetic field may be easily localized above the surface of the integrated circuit and the package. Due to the continued demand for miniaturization, improved spatial resolution and higher sensitivity will be required, leading to innovative probe designs that may embed filtering and amplification.
The main drawback of the near-field scan is the time required to complete each scan at each given frequency. A complete scan of all electric and magnetic contributions of the field for the 10 main harmonics of an integrated circuit would require several days of measurement. Isotropic probes combined with parallel measurement setups may reduce the duration to several hours.
4. 11150 &2 CONDUCTED METHOD
A very useful method for evaluating integrated circuits is to measure the conducted noise currents on each pin. One method of doing this (IEC, 2001) is to place a small resistance in series with the pin and measure the voltage dropped across this resistance (Fig. 4-23). Since most emissions problems related to chip designs begin with noise that is conducted out of the chip package via the pins, this measurement can be a particularly good indicator of how well the chip will perform in a real product. The test set-up for 110s is given in Fig. 4-24. A combination of resistance and capacitance introduces an equivalent load of 150 Q.
1 Package , I
1 / Die ofthe I 1 VSS lead integrated
Printed circuit circuit board ground
Probingpoint for the spectrum analyzer
Figure 4-23. 1/150 Q Conducted mode measurement method.

Measurement Methods
; Impedance ) rnatchina network !
+ Gnd 1 I I
Figure 4-24. Test setup for 110 conducted noise measurement (According to IEC 61967-4).
This test configuration corresponds to a general case but may be adapted depending on the device under test and the application. In the case of an IC with a huge number of pins, a selection should be made to keep the probing points reasonable, as the test boards must include for each test pin supplementary resistance, capacitance as well as high quality connector such as SMA or SMB.
In order to obtain a high degree of repeatability in the conducted measurements and comparison emission performances of ICs mounted on different printed circuit test boards, guidance is given in the standard for the choice of the PCB material and dielectric. The standard also recommends the use of a ground plane on the board, and describes how to implement the DUT with multiple ground and supply. For high power ICs, the 1 R probe is replaced by a O.1Q resistance, or split among the return current paths.
5. WORKBENCH FARADAY CAGE
The Workbench Faraday Cage is a standard method for carrying out conducted RF immunity measurements (IEC, 2003) in a compact manner, without requiring large anechoic rooms and high power RF sources. The WBFC method may also be used for conducted emission measurements, as described in (IEC, 2001).

Measurement Methods 127
Printed circuit / bourd rack : IOrm
IC conductor:^ : Imm
Figure 4-25. Test board example and associated conductor dimensions.
The rationale for conducted EMC measurement stems from the fact that the root cause of RF emission is often the die of the integrated circuit which by means of on-chip and on-PCB coupling paths radiates into the "free- space". Here the rationale of the effectiveness of the antenna applies: the lower the frequency, the larger the antenna needs to be. The IC die dimensions of 5 mm would correspond to an optimum resonant frequency of 16 GHz (Fig. 4-25). The correspondence between resonant frequency and physical dimensions is reported in Table 4-4.
Table 4-4. Optimum antenna effect Frequency 1 MHz 10 MHz 100 MHz 1 GHz 10 GHz Wavelength h 300 m 30 m 3 m 30 cm 3 cm Optimum 75 m 7.5 m 75 cm 7.5 cm 7.5 mm antenna (U4) Physical Long cable Cable Large PCB PCB track Package lead
In case of RF emission testing, a measurement antenna can be used to pick up the electromagnetic field which is then represented on a spectrum analyzer. By means of passive coupling and decoupling networks (CDN), the whole interaction path between the root disturbance source and the input of the measurement receiver can be defined. As passive networks are reciprocal, the same setup can also be used for RF immunity measurements.
Various groups and individuals have been involved with common mode impedance measurements in Switzerland, Germany, Japan, and the Netherlands. All results show a broad distribution of this common-mode impedance which could vary as a function of frequency between less than one to several kilo-f.2.
128 Measurement Methods
Table 4-5. Common-mode impedance requirements for coupling and decoupling networks . - . - (CDN Frequency band 150 KHz - 26 MHz 26 MHz - 1000 MHz Common-mode impedance 150 L2 +I- 20 $2 150 R +60/-45 L2
Nevertheless, from all these measurements, the median value found was 150 0 with rather thigh tolerances. For the sake of reproducibility, the tolerances need to be low.
5.1 Scope of applicability of the WBFC method
Before going any further, the reader should be aware that the scope of this method is restricted to electronic products that will be connected to external wiring. It is not a suitable measuring method for small wireless appliances! Nevertheless, the method will apply for those cases where the wires and cables connected to the sources and victims are much longer than the largest dimension of the integrated circuit. The minimum frequency of the range used will be determined by the maximum length of wire connected to that port.
The size of the cage has been set to 0.5 x 0.35 x 0.15 m and will therefore show specific resonances with respect to these dimensions. The formulation for the resonant frequency of the WBFC depends on its physical dimensions W, L and H as follows (Eq. 4-5):
where f,,=frequency (Hz) EO= absolute permittivity (8.85 x lo-'' F/m) &= relative permittivity (Air= 1 .O) ,&= permeability 4n x 1 o - ~ H/m pr= relative permeability (Air= 1 .O) m, n, p=modes (integer 0,1,2.. .) L= length of WBFC (m) W= width of WBFC (m) H= height of WBFC (m)

Measurement Methods 129
However, due to the common-mode loaded PCB placed in the cage during normal use, the quality of these resonances will be poor and restricted to a few frequencies only, above 1 GHz. By applying Eq. (4-5), we find 1.13 GHz, 1.24 GHz, 1.35 GHz, etc.
5.2 Concept of the workbench Faraday Cage method
In Fig. 4-26, a simple test setup is given. In general, an IC on a PCB has 2, 3 or more connections e.g. input, output and supply. In the drawing of Fig. 4-27, only 2 ports are considered. A normalized disturbance source (In case of RF immunity measurements), will determine the RF currents and RF voltages at the product being tested.
When the two ports both represent an impedance of 150 i2 in common- mode, then the voltage at the device UcO, will be half the source voltage of the disturbance source. The link between the electric field E and the device potential UcO, is given by Eq. (4-6).
The support height is typically 30 mm for IC measurements. The common-mode current I,,, will distribute itself over the DUT surface with a current density distribution J,,, which will result in local H-fields for which formulae from Biot and Savart can be applied (Eq. 4-7). For an infinite number of ports, the current would be no more than double.
On the contrary, the E-field between the PCB containing the IC and the ground reference plane (GRP) will diminish as the common-mode voltage would, under this condition, decrease to zero. The schematic diagram of the connection between the DUT and the external equipments is given in Fig. 4- 28, showing the DUT, the ferrite rings, the connection cables, the filters in the Faraday Cage wall and the external equipments used to supply and monitor the DUT.

130 Measurement Methods
Figure 4-26. The device under test inside the Workbench Faraday Cage (WBFC).

Measurement Methods
Typ load + e g LF Spectrum analyzer, TDMA, Voltmeter
I I
Workbench Faraday Cage
m= Ferrlte rlngs
R = 100 Ohm reslstor (metal fllm), C = 20nF 0 = Coaxlal feed -through
F = Fllter In Faraday Cage wall
- - Coupl~ng/DecoupImg network
Figure 4-28 Schematic diagram of thc conncction bctwecn thc DUT and the external cquipmcnts.
5.3 Power matching
Power matching consists in finding the optimum way to transfer the power of the source to the victim. Poor power matching corresponds to the case where the device under test handles a very small fraction of the power generated by the radio frequency source.
Figure 4-29. Thc dcvice under test on its test board is equivalent to an impedance Zc.

132 Measurement Methods
Flgure 4-30. Variation of the current dclivcrcd by the apparatus for varying frequency and common-mode tcrmination.
Let us have a closer look into the common-mode behavior of the circuit under test. The common-mode impedance Z, is the equivalent load seen by the radio-frequency generator, as illustrated in Fig. 4-29.
The impedance is strongly dependant on the generator frequency. Z, may also vary according to the loading conditions of the IC ports. In Fig. 4-30, the current Icom delivered by the apparatus to a two-port test-board is simulated for a wide range of frequency, for varying common-mode termination R,,,.
Power matching occurs when the variations in the current delivered to the test board are almost independent of the injected frequency. As can be seen from simulations, the common-mode can be stabilized best when using a common-mode termination Rout of 150 Q.
5.4 Coupling decoupling networks
The function of the Coupling/Decoupling network (CDN) is to couple the RF signal to the device under test, while being transparent for the functional signal, as illustrated in Fig. 4-3 1.

Measurement Methods
IJndesired 1 1 1 Functional coupling
\ signal
Figure 4-31. CouplingIDecoupling network used to couple the desired signal with the radio- frequency source.
coupling to coupling to unscreened cable(s) screened cable@)
Figure 4-32. Coupling to cables.
Typically a directivity of 40 dB is required from a CDN. The typical insertion loss of a CDN is less than 5 dB. When impedance ratio transformers are used (rather than series resistance transformers), even negative insertion loss values can be obtained.
With non-shielded wires (Fig. 4-32 left), the RF coupling is distributed equally over all the wires, independently of their function. Resistances of N.lOO Q are applied in series with 22 nF capacitors. With shielded cables (Fig. 4-32 right), RF coupling with the shield is done by means of a 100 Q resistance in series with a 22 nF DC-blocking capacitance. To maintain a common-mode impedance of 150 Q, the center of the test board ports is located at 30 mm above the ground plane.

Measuvement Methods
5.5 Measurements
With the workbench measurement technique, the RF emission spectrum from an 1C applied on a standard test board can be measured from 150 kHz to 1 GHz. These measurements are usually repeated for the various modes of operation of the IC to be tested. Furthermore, similar to the TEM cell method, the EMC test board shall be measured in four orientations, by turning the board over 90 degrees each time. In Fig. 4-33, the max-hold RF emission amplitude as function of frequency is recorded from O.lMHz to I GHz.
Emission level ( ~ B P V )
Frequency (Hz)
Figure 4-33. Conducted measurement using WBFC.
To determine the RF immunity of a digital device, various parameters can be observed. In the example shown in Fig. 4-34, the jitter on the IC's program cycle is measured as function of the disturbance signal carrier frequency.
Similar to the RF emission test using the WBFC method, the EMC test board shall be measured in four orientations, by turning the board over 90 degrees each time. In this figure, the maximum jitter as function of frequency is recorded for the various orientations. Different jitter responses can be observed depending on the program cycle.

Measurement Melhods
Jitter (ns)
Frequency (MHz)
Figure 4-34. Jitter measurement using the WBFC mcthod.
5.6 Discussion
In contrast to techniques such as TEMIGTEM cell, near-field scanning and the DPI, BCI method, the whole application plays a dominant role in the results obtained. Moreover, as RF emission would diminish in a TEM cell measurement, e.g. by placing a copper hood over the IC which is soldered to the reference layer, the RF emission results with the WBFC technique are hardly affected by such a measure as di/dt through the 1C's pins and the currents through the PCB remain unaffected.
With RF emission measurements, other than the peak RF emission level obtained by a max-hold function, the duration of these peaks becomes relevant as spread spectrum clocks are often used with digital designs or frequency hopping with digital RF modulation formats.
A simple reduction of the measurement bandwidth of the spectrum analyzer or RF measurement receiver to a bandwidth beneath the hopping format or spread spectrum will reveal this information at the cost of measurement time without the used of dedicated measurement equipment.
Setting the requirements is not that simple as they will be determined by what needs to be protected; narrowband RF broadcast, sensitive analog base- band signals or micro-powered broadband logic. Guidance is absent or at best insufficient in the formal standards as this topic is too broad and too open !
With RF immunity measurements, the response of the device has to be observed. Here too, the broad variety of responses means that nearly
136 Measurement Methods
everything can be measured, but what is relevant? Responses like audio break-through, similar to the Moire-patterns on a display panel are well known. But simple responses like; supply current fluctuations, DC or base- band gain, a port's output frequency, duty cycle and jitter are easy to detect and measure before a device or product hangs in a real error condition. Lengthy measurement schemes where e.g. Bit-Error-Rate (BER) has to be measured as a function of the disturbance signal's frequency may be necessary but before bit errors occur, jitter will occur on these signals.
Due to the well-defined common-mode impedance conditions, the reproducibility of WBFC measurements is good and the cost for a measurement setup is low. Measurement techniques as defined by the WBFC method can be used to characterize the device emission (IEC 61967- 5 ) and immunity (IEC 621 32-5).
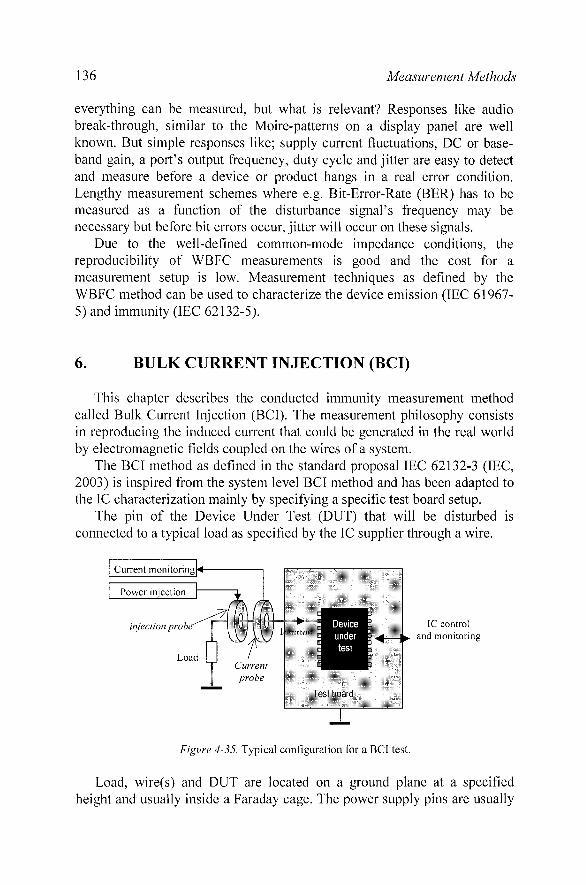
6. BULK CURRENT INJECTION (BCI)
This chapter describes the conducted immunity measurement method called Bulk Current Injection (BCI). The measurement philosophy consists in reproducing the induced current that could be generated in the real world by electromagnetic fields coupled on the wires of a system.
The BCI method as defined in the standard proposal IEC 62132-3 (IEC, 2003) is inspired from the system level BCI method and has been adapted to the IC characterization mainly by specifying a specific test board setup.
The pin of the Device Under Test (DUT) that will be disturbed is connected to a typical load as specified by the IC supplier
Load I Current
through a wire.
IC control and monitoring
Figure 4-35. Typical configuration f'or a BCI test.
Load, wire(s) and DUT are located on a ground plane at a specified height and usually inside a Faraday cage. The power supply pins are usually

Measurement Methods 137
connected to power supply using filters, for example LSIN equipment (Line Stabilizer Impedance Network) - even if the common LSIN only offers a valid frequency range up to 100 MHz).
In any case, the power supply should not be disturbed by the RF signal. The R F disturbance is then injected into the DUT using an injection probe. The measurement probe monitors the level of injected current. The probe position could differ from one customer specification to another. Several 1C pins could be disturbed at the same time, if the injection probe surrounds the wires connected to these pins. Fig. 4-35 illustrates a typical configuration for a BCI test.
6.1 Calibration of the RF injection system
In accordance with IEC 62132-3, the required power from the RF generator is determined during the calibration of the injection probe. The purpose of this calibration is to determine the power level required at the signal generator to reach a defined current level on the 50 a-adapted load.
The current level curve, depending on the frequency, is defined in the EMC specification associated with the device under test. This calibration is done in Continuous Wave (CW) mode, which means that the RF disturbance is equal to a pure sinusoidal waveform on the whole frequency range (commonly DC to 400MHz). The setup is shown in the Fig. 4-36. A schematized diagram of the setup is given in Fig. 4-37.
Figure 4-36. Calibration sctup for the RF injection probe.

138 Measurement Methods
Figure 4-37. Schematized diagram of the calibration setup for the RF injection probe.
--
Figure 4-38. Picture of a calibration setup for the RF injection probe.
The two 50 Q loads, the attenuator, the current probe and the calibration fixture are connected with 50 Q-adapted cables if necessary. An attenuator (30 dB in this example) is required to protect the 50 Q-adapted serial current probe from the high current produced by the RF injection probe. The calibration fixture is used as a 50 Q-adapted load (Fig. 4-38).
The calibration process should be performed for each current limit to take into account the non-linear behavior of the hardware used for the RF disturbance generation (injection probe, amplifier, generator). The calibration procedure produces a plot of the forward current required to inject 200 mA in the reference load of 50 Q, as a function of frequency (Fig. 4-39).

Measurement Methods
Forward Power (W)
1 MHz 10 MHz 100 MHz 1 GHz
Frequency
Figure 4-39. Forward current vs. frequency used for probe calibration at 200 mA.
I lnpctlon Probe Measurement Prabe I
r -
ink
Wattmeter I I I lnjeded Current
.........................................................
Figure 4-40. BCI measurement test setup
6.2 Measurement setup
The BCI measurement test setup is described in Fig. 4-40. Although not explicitly required in the standard, the BCI test measurement should be performed inside a Faraday cage. The main justification of this precaution is the measurement repeatability. Inside a Faraday cage, the position of the ground plane is correctly defined, as well as the position of the different elements (probes, cables, DUT). Furthermore, the influence of external EM fields (FM band, cell phones, etc.) is minimized.

140 Measurement Methods
Depending on the EMC specification required by the customer, many configurations could be tested: for example, the injection could be performed only on the power supply wire, or on the power supply wire with the ground wire, or on a complete harness (supply wires with additional wires for signals).
6.3 Disturbance
The signal used as the RF disturbance in this test could either be: A continuous sinusoidal signal (CW) A continuous sinusoidal signal with AM modulation (AM)
Usually, the modulation signal is a sinusoidal waveform with a frequency of 1kHz. The modulation factor m is often fixed at 80%. For ICs, the test method uses a constant peak level for both CW and AM signals as shown in the following figure. The relationship between the peak level for the CW and the AM signals is given by Eq. (4-9):
For m = 0.8 (i.e. SO%), the relationship becomes:
For the AM disturbance with a modulation factor equal to SO%, the signal level at the generator is decreased by 5.1 dB in comparison with a CW disturbance.
Figure 4-41. Relationship between CW and AM signals.

Measurement Methods 141
At each step, the DUT should be exposed to the disturbance during a fixed time called dwell time. This dwell time should be at least greater than the minimum response time of the DUT. In any case, the dwell time should not be less than Is.
6.4 Algorithm for BCI measurement
The calibration procedure gives information about the injected power required for generating a specified current at a given frequency, but on a standard 50 Q load. Replacing these two 50 SZ-adapted loads by an IC will change the equivalent input impedance and therefore the current generated inside the wire during the BCI test. The RF current induced in the wire could be higher if the input impedance of the IC is lower than 50 Q, or lower if the input impedance of the IC is higher.
That is why when operating the BCI method, we have to monitor the injected current. With a high input impedance DUT, the injected power limit could be increased by the k factor. In automotive applications, k varies from 1 to 4 depending on the device under test.
The measurement algorithm is illustrated in the flow graph of Fig. 4-42. For each frequency, the RF disturbance level is increased step by step until one of the conditions is attained: the current limit has been reached, or the DUT has failed. For reducing the test time, the initial power level at the following frequency point may be set for example 6dB lower than the previous one.
Where DUT is OK
No
Increase P
Yes
Save current &
Figure 4-42. Flowchart for BCI measurement.

Measurement Methods
6.5 Failure criterion detection
For immunity tests, the failure criterion is difficult to define. Today, no universal failure criterion has been highlighted for any type of 1C. The failure criterion is relative to an electrical measurement such as current or voltage on a selected pin. Many criteria could be used such as: jitter on a digital signal, undesired activation of an 110, Reset of a microcontroller, etc.
REMOTE E N R B L E
L O C R L
f " " " " ' 0 F a l i e d o f 9 4 0 sweeps Tes t passed
F a i l i f some po in ts (2 ) o u t s i d e mask(01 no F
Figure 4-43. Screenshot of an oscilloscope uscd for cnvclopc detection
Usually, the failure criterion is detected by using the mask function of an oscilloscope as shown in Fig. 4-43. This method is particularly convenient for automated testing. If the signal is detected outside the mask (defined by a tolerance factor in time and amplitude from the wave without disturbance), the oscilloscope sends a flag signal to the control software, which stops the injection power increase.
6.6 PCB and hardware setup
Up to now, no distinction has been made between the I S 0 standard and the IEC standard listed in the introduction.

Measuvement Methods 143
Figure 4-44. IS0 BCI setup.
Figure 4-45. IEC BCI setup dedicated to IC.
The IS0 standard (Fig. 4-44) is applicable for electronic systems while the IEC standard is dedicated to single components (Fig. 4-45).The example shown here concerns a physical interface for LIN bus communication widely used in automotive applications.
6.7 BCI test results
Fig. 4-46 and Fig. 4-47 give results related to BCI measurements performed on a test chip. On the first graph, the bold line corresponds to the current limit required by the customer; the gray line corresponds to the injected current measured by the current probe.

Measurement Methods
Injected current did not reach the limit
Figure 4-46. BCI current measurement example showing weaknesses around 200 MHz.
This graph should be interpreted with special care, as there is no direct relation between a current level lower than the target limit and the device failure. The injected power is represented in Fig. 4-47. The dotted line corresponds to the calibrated power (power needed to inject 34 dBmA into the calibration setup), the gray curve traces the forward power measured during the BCI test on the bidirectional coupler. In this graph, there is also no direct relation between a power level lower than the target limit and the device failure.
Figure 4-47. Same BCI measurement regarding power

Measurement Methods 145
In the control software setup from Freescale Semiconductors, the failure appears in the current curve as black crosses at the corresponding frequency. Below 100 MHz, we can observe than either the current limit (Fig. 4-46) or the power limit (Fig. 4-47) has been reached, without any DUT failure (No cross in this frequency range for Fig. 4-46). The DUT is not susceptible at this frequency range. Near 200 MHz, none of these limits have been reached as the DUT has failed. Consequently, the DUT is not immune from 150 MHz to 350 MHz.
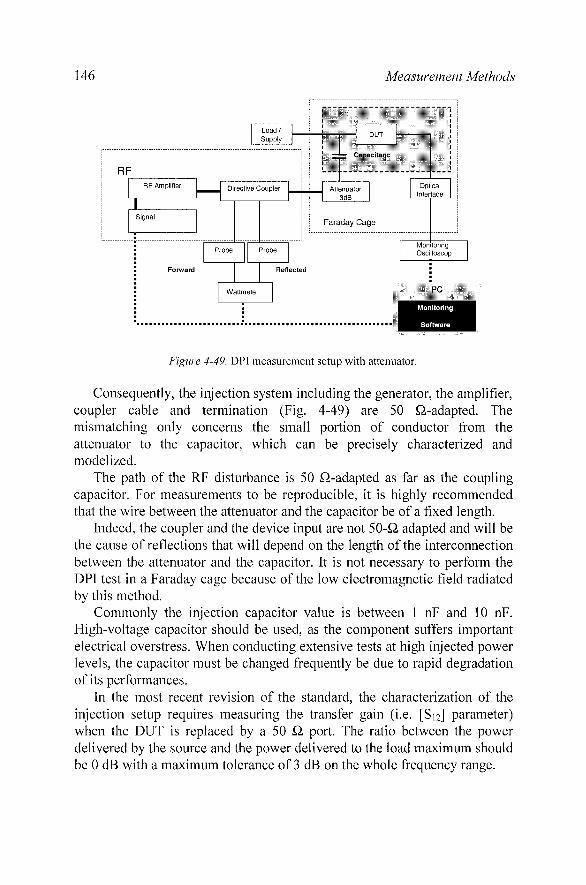
7. DIRECT POWER INJECTION (DPI)
In the case of Direct Power Injection (IEC 62132-4), the RF disturbance is injected on the pin of the component through a decoupling block as shown on Fig. 4-48. Usually the DC block is realized by a capacitor with or without a serial resistor.
The RF disturbance is monitored through the directional coupler by measuring the forward power and the reflected power. To reduce the reflection effects, it is strongly recommended that the setup be built with 50 Q cable and 50 Q-adapted printed circuit board tracks, so that the injection path is 50 L2 almost all the way from the RF generator to the DUT. However, the DUT impedance is strongly dependent on frequency, therefore creating reflections and resonant effects. To avoid taking into account the cable effects, an optional attenuator (commonly 3 or 6 dB) may be inserted just before the capacitor, which features a 50 Q-input impedance.
Figure 4-48, Typical Ilardwarc setup for DPI test.
Measurement Melhods
figure 4-49, DPI measurement setup with attcnuator.
Consequently, the injection system including the generator, the amplifier, coupler cable and termination (Fig. 4-49) are 50 SZ-adapted. The mismatching only concerns the small portion of conductor from the attenuator to the capacitor, which can be precisely characterized and modelized.
The path of the RF disturbance is 50 Q-adapted as far as the coupling capacitor. For measurements to be reproducible, it is highly recommended that the wire between the attenuator and the capacitor be of a fixed length.
Indeed, the coupler and the device input are not 50-52 adapted and will be the cause of reflections that will depend on the length of the interconnection between the attenuator and the capacitor. It is not necessary to perform the DPI test in a Faraday cage because of the low electromagnetic field radiated by this method.
Commonly the injection capacitor value is between 1 nF and 10 nF. High-voltage capacitor should be used, as the component suffers important electrical overstress. When conducting extensive tests at high injected power levels, the capacitor must be changed frequently be due to rapid degradation of its performances.
In the most recent revision of the standard, the characterization of the injection setup requires measuring the transfer gain (i.e. [SI2] parameter) when the DUT is replaced by a 50 Q port. The ratio between the power delivered by the source and the power delivered to the load maximum should be 0 dB with a maximum tolerance of 3 dB on the whole frequency range.

Measurement Methods
7.1 Algorithm for the DPI measurement
The measurement algorithm for DPI is simpler than for the BCI (Fig. 4- 50) because we only monitor the power injected on the DUT thanks to the directional coupler. The calibration procedure is useful to determine the impedance of the path between the coupler and the DUT and therefore to quantify the exact power received by the DUT.
To reduce the test time, it is often accepted that the first level of power is not fixed to 0, but fixed to Pli,,,i, - x dBm, where x is the margin in power.
No
Increase P A
Yes
Figure 4-50. Flowchart for DPI measurement.
The DPI flowchart is simpler than the flowchart of the BCI. In this case, for each frequency step, the power is increased up to the power limit given in the customer specification or up to a failure of the device. To reduce the test time, the initial power level at the following frequency could be set for example at 6 dB less than the previous one, therefore reducing the iteration of the power loop.
The RF disturbance signal is a sinusoidal waveform from DC to lGHz CW or AM (1 KHz with 80% for the modulation factor). The usual power limit is 1 W or 30 dBm. The level could reach 5 W (36 dBm) for specific applications.

Measurement Methods
7.2 DPI test results
Typical test results for DPI are illustrated in Fig. 4-51. The test was performed on a test vehicle for a LIN interface. The blue curve corresponds to the maximum current injected without creating a failure in the DUT. We can therefore observe that this DUT presents two weaknesses at 10 MHz and 90 MHz.
Current (dBmA) Current limit
10 100
Freq. (MHz)
Figure 4-51, Example of DPI result on a IAN interface circuit.
The DPI method is more appropriate for the IC. The difficulty of these methods appears when the number of pin to be tested becomes relatively high. As these tests are costly and time consuming, an alternative may consist to pre-select a reduced set of test pins rather than to test each pin.
8. TRANSIENT IMMUNITY OF INTEGRATED CIRCUITS
This section describes the transient immunity environment and the test methodologies being used or developed to evaluate the transient immunity performance of integrated circuits (ICs). While the transient environments and test methodologies at the product level are well-defined and understood, the equivalent environment and methodology for ICs is undefined.
As a result, work is in progress with the IEC and elsewhere to define a transient immunity environment and test method that is suitable for the evaluation of 1Cs. Both the application of product level test methods to ICs and the development of emerging 1C-specific test methods is discussed.

Measurement Methods 149
8.1 Motivation
One reason for investigating IC immunity to impulse waveforms is that the transient immunity tends to decrease (Fig. 4-52) as technology progresses, as observed by Camp (2004). Reasons might be the decreased noise margins, the clock frequency increase or the integrated circuit complexity increase.
Pulse amplitude
(KV)
Figure 4-52. Immunity to transients tends to decrease with computer generation (From Camp, 2004).
Several transient noises may be considered at IC level. The most common one is the electrostatic discharge (ESD) that may attain several KV (Kilo-Volt) in a few nanoseconds, with a general shape similar to that of Fig. 4-53.
The ESD may be provoked by human contact to electronic devices, as well as electrical contact with other hardware. An extensive discussion on the ESD modeling is provided in chapter 5. An example of electrical fast transients (EFT), is given in Fig. 4-54, with a rise time of 5 ns and a 5 KHz repetition rate. The inputloutput interfaces of the integrated circuit contain specific structures which may handle the ESD and EFT pulses, and may dissipate the injected parasitic energy without destroying the component. Some of these structures are discussed by Wang (2002).

Measurement Methods
Electrostatic
> I I
Time (ns) 10.0 20.0 30.0
Figure 4-53. Typical aspect of an ESD pulse.
Figure 4-54. Electrical Fast Transient.
8.2 Coupling Path
8.2.1 Effect of Transient Pulse
We consider here the coupling path between the points of application of the transient and the device to be stressed. Either by common impedance, mutual coupling or capacitive coupling, the transient event will propagate toward the possible points of entry: inputs, outputs, peripheral (V,,,) and/or core ground (Vssc), peripheral (Vddx) and/ or core supply (VddC) or via substrate (Vssls). The high-pass nature of the coupling path results from the fact that the derivative of the wave-shape is of the utmost importance, as recalled by Eq. (4-1 1).
~kind, ,ced = L . dil dt

Measuvem ent Methods
Voltage
c)
High energy needed to change the
needed to change the logic state
logic state
Figure 4-55. The energy needed to alter the logic value is reduccd during transitions.
The consequences of the transient on the device operation are illustrated in Fig. 4-55. If the pulse amplitude is high enough, a parasitic glitch appears that alters the signal to an erroneous 1 (Fig. 4-55-a). The symmetrical situation happens in Fig. 4-55-c where an erroneous 0 is provoked by the pulse. An increased sensitivity to transient may also be observed during the normal signal transition (rise edge in Fig. 4-55-b, fall edge in Fig. 4-55-d).
8.3 Transient Immunity environment
The transient immunity environment applicable to electrical and electronic products is currently specified only at the level of the final product. The applicable environment is usually a country-specific legal or regulatory requirement but is often a less formal requirement of the target market. Regardless of the source of the applicable transient immunity environment, it is almost always referenced to an existing international standard.
8.3.1 Product level
The product level transient immunity environment can be divided into three discrete areas: consumer and industrial; automotive; and military and aerospace. This division is driven by the differences in the operational electromagnetic environment for the three discrete application areas.
The characteristics of the electromagnetic environment that influence transient immunity can be found in many national and international standards. For the purpose of this chapter, the focus will be on international standards.

152 Measurement Methods
The transient immunity environment for consumer and industrial electrical and electronic products is defined as the electrical fast transient (EFT) as defined in IEC 61000-4-4. The EFT immunity environment for automotive electrical and electronic products is defined IS0 7637-2. These standard test methods are performed by the OEM designer to meet product specifications and regulatory requirements. The military and aerospace environments typically do not define a transient requirement.
8.3.2 Integrated circuit level
For integrated circuits, the transient environment is currently undefined by national or international standards. While environments for products are based on the typical electromagnetic environment for the location of use and, to some extent, the capabilities of the user (home vs. business), the environment for ICs is dictated by the design of the final product. Even for a particular application and environment, the possible implementation choices and their effects on EMC performance make IC level environment standardization impractical. Even so, efforts continue to identify an appropriate IC level transient environment or environments.
In the absence of a reliable IC level transient environment, semiconductor users tend to specify compliance of the IC with the product level environment. While this methodology identifies the worst case environment, these levels are almost never actually seen at the IC pins. Power supply, data filtering and the design of the printed circuit board (PCB) will attenuate the transient levels. As a result, care must be taken when applying product level environments to ICs in order to prevent over- design and unjustified cost.
8.4 Integrated Circuit Test Methods
As in the case of the integrated circuit transient immunity environment, standardized transient immunity test methods for integrated circuits do not yet exist. Work is currently in progress within IEC Technical Committee 47 (TC47) on semiconductors to create a family of transient immunity test methods (IEC 6221 5) for integrated circuits.
Table 4-6. Proposed standards for integrated circuit impulse immunity measurement Standard Description Stage in 2005 IEC 62215-1 Definitions New proposal IEC 622 15-2 Impulse immunity method (low voltage) New proposal IEC 622 15-3 Electrical Fast Transients (EFT), New proposal
Electrostatic Discharge (ESD) immunity (high voltage)
Measurement Methods 153
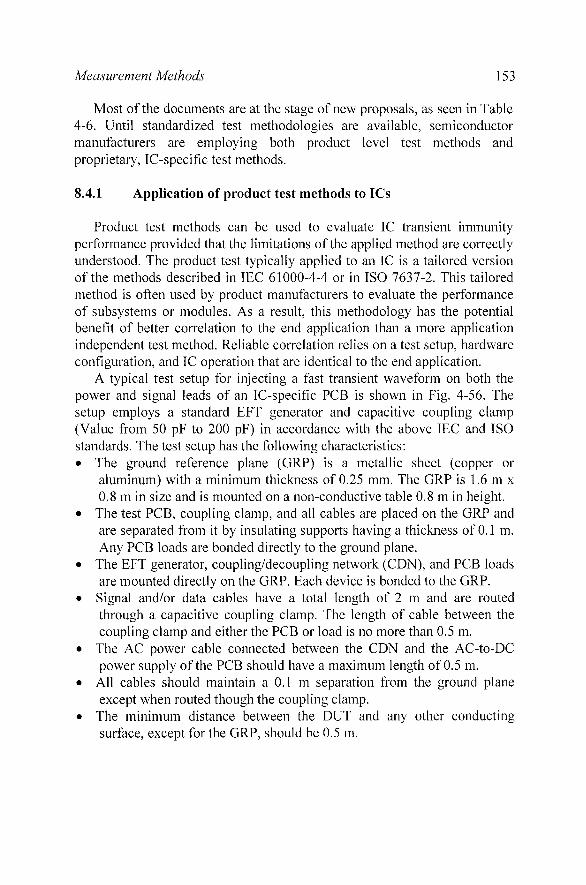
Most of the documents are at the stage of new proposals, as seen in Table 4-6. Until standardized test methodologies are available, semiconductor manufacturers are employing both product level test methods and proprietary, IC-specific test methods.
8.4.1 Application of product test methods to ICs
Product test methods can be used to evaluate IC transient immunity performance provided that the limitations of the applied method are correctly understood. The product test typically applied to an IC is a tailored version of the methods described in IEC 61000-4-4 or in IS0 7637-2. This tailored method is often used by product manufacturers to evaluate the performance of subsystems or modules. As a result, this methodology has the potential benefit of better correlation to the end application than a more application independent test method. Reliable correlation relies on a test setup, hardware configuration, and IC operation that are identical to the end application.
A typical test setup for injecting a fast transient waveform on both the power and signal leads of an IC-specific PCB is shown in Fig. 4-56. The setup employs a standard EFT generator and capacitive coupling clamp (Value from 50 pF to 200 pF) in accordance with the above IEC and IS0 standards. The test setup has the following characteristics:
The ground reference plane (GRP) is a metallic sheet (copper or aluminum) with a minimum thickness of 0.25 mm. The GRP is 1.6 m x 0.8 m in size and is mounted on a non-conductive table 0.8 m in height.
The test PCB, coupling clamp, and all cables are placed on the GRP and are separated from it by insulating supports having a thickness of 0.1 m. Any PCB loads are bonded directly to the ground plane.
The EFT generator, coupling/decoupling network (CDN), and PCB loads are mounted directly on the GRP. Each device is bonded to the GRP. Signal and/or data cables have a total length of 2 m and are routed through a capacitive coupling clamp. The length of cable between the coupling clamp and either the PCB or load is no more than 0.5 m.
The AC power cable connected between the CDN and the AC-to-DC power supply of the PCB should have a maximum length of 0.5 m.
All cables should maintain a 0.1 m separation from the ground plane except when routed though the coupling clamp.
The minimum distance between the DUT and any other conducting surface, except for the GRP, should be 0.5 m.

Measurement Methods
Figure 4-56. PCB EFT test setup, top vicw (not to scale).
The disturbance signal is typically the same as used for the end product. Reduced transient voltage levels may be used depending on the performance characteristics of the device under test (DUT).
8.4.2 Test Procedure
The generic test procedure for fast transient immunity testing is described by the flowchart shown in Fig. 4-57. The procedure is implemented for each desired transient injection point or location and is valid for ICs, PCBs or end products. After selecting the initial transient polarity and setting the EFT generator to the lowest desired setting, the transient is applied for a period of 60 seconds. The test data, including the immunity performance class as described by the governing standard, is recorded. The appropriate action is then taken based on the last data point: increment the voltage, change the polarity, or end the test.
Note that not all DUT fail conditions require taking the DUT fail path. If the DUT is still operable, the test may continue with higher voltage levels in order to determine the level of the more severe performance classes.

Measurement Methods
Positive
Increment vEFT1
Figure 4-57. Flowchart for fast transient immunity testing.
8.4.3 Failure criteria and monitoring
The failure criteria will vary depending on the IC type, IC functionality, and the impact of the PCB on monitoring and detecting performance degradation. The ability to monitor for the failure criteria will depend on the functionality of the PCB with respect to enabling the detection and reporting of performance degradation.
8.4.4 Test PCB
For this test methodology, the DUT is an IC installed on a PCB with a connected cable harness or harnesses. Options for the PCB include: an actual product PCB, a generic IC demonstration or evaluation PCB, or an application independent PCB for EMC evaluation purposes such as those defined in IEC 61967 (IEC, 2001) or IEC 62132 (IEC, 2003). The choice of PCB type and the resulting test applicability is shown in Table 4-7.
Table 4-7. Test PCB type selection guide PCB Application Product, application specific Simulate product application performance Generic, application dependent Simulate generic application performance EMC, application independent Isolate IC performance

156 Measurement Methods
Table 4-8. Test PCB type selection guide Test type Power supply type Product, application specific As in actual application Generic, application dependent On PCB recommended. Off PCB allows easy
change of power supply impact. EMC, application independent Off PCB required.
The IC-specific PCB should either contain its own AC-to-DC power supply or, if not present, a standard AC-to-DC power supply should be provided. The location of the power supply is driven by intent of the test as described in Table 4-8.
8.4.5 Considerations in the application of product level test methods
Using product level transient immunity test methods to evaluate the performance of ICs has real benefits as well as important limitations. Benefits include understanding the impact of PCB and subsystem design choices on IC transient immunity performance, demonstrating IC transient immunity performance in a typical or generic application, illustrating the proper application of EMC techniques, and, if correlation to system EMC performance has been established, optimizing the subsystem design or bill of materials.
The limitations in the application of product level test methods to ICs occur in two mains areas: correlation to system or end product EMC performance; and isolating the EMC performance characteristics of the IC from the PCB and connected power supply and cables. The ease of correlation to product level performance is affected by the similarity of the test setup to the actual application.
With good similarity and sufficient history in designing and testing a particular product type, reasonable correlation can be achieved. The issues associated with such correlation are not discussed herein.
Isolating the IC EMC performance is hindered by many issues. The primary issue is that the actual IC performance is naturally masked by the characteristics of the PCB schematic (including EM1 control components and pin loading), PCB layout, and connected cables. Even in the absence of any specific EM1 controls, the injected transient immunity test waveform will be modified by parasitic capacitances and inductances by the time it reaches the IC pins.
This leads to the second major issue in isolating IC performance: PCB design differences. PCB layout is critical to IC transient immunity performance. Even for PCBs with the same schematics, seemingly minor differences in layout can result in large variations in measured performance.

Measurement Methods 157
As a result, the comparison of data for ICs in different packages is often not practical since different packages require different layouts. This also applies to the comparison of different IC manufacturers unless devices have identical package pinout and functionality. In these cases, PCB differences can be minimized provided that care is taken to produce boards of minimal schematic and layout difference.
In addition, monitoring the injected voltage and current at a single IC pin or all IC pins during a test can be difficult if not impossible. While successful measurements will explicitly describe the susceptibility waveforms, this information has limited usefulness. Reproducing the transients measured at the IC pins of one PCB at the pins of a different 1C on a different PCB is not practical.
8.5 Emerging IC test methods
The IEC's TC 47 is in the process of developing a family of transient immunity test methods for integrated circuits. The intent of IC EMC test methods is to extract the EMC performance of the IC without it being unduly affected by the PCB and any connected cables. Isolating the IC EMC performance requires the use of an application independent PCB with sufficient design control to ensure maximum similarity of both the PCB schematic and layout. An example of an application independent EMC PCB is described in both IEC 61 967-1 and IEC 62132-1. Other examples can be found in the other parts of these standards.
Figure 4-58. Pin injection test setup (top view)

158 Measurement Methods
Emerging IC transient immunity test methodologies focus on one of two injection strategies: pin injection, and reference injection. The pin injection strategy couples the output of a transient generator to each individual pin of the 1C in turn. The reference injection strategy applies the transient between either a local and remote reference or between different IC ground pins.
8.5.1 Pin injection measurement setup
The pin injection test strategy evaluates the performance of each individual IC pin when subjected to a specified transient waveform. Both positive and negative polarity transients, referenced to IC ground (typically VSS or VEE), are applied. The basic test setup is shown in Figs. 4-58 and 4- 59. The test setup shows the DUT installed on a PCB designed in accordance with both IEC 61967-1 and JEC 62132-1. The test setup has the following characteristics:
The ground reference plane (GRP) is a metallic sheet (copper or aluminum) with a minimum thickness of 0.25 mm. The GRP is 1.6 m x 0.8 m in size and is mounted on a non-conductive table 0.8 m in height.
The test PCB is separated from the GRP plane by an insulating support having a thickness of 0.1 m.
The chassis of the EFT generator and power supply are bonded to the ground plane.
All cables should maintain a 0.1 m separation from the ground plane. The minimum distance between the DUT and any other conducting surface, except for the ground plane, should be 0.5 m. All connections should be as short as possible.
EFT Generator Coax Cable EFT Probe
0 000 000 - 000 000 000 000
\
\/ 0- r(
I. DC Power Wires
I Test PCBf
EFT Generator EFT Probe
Reference 000 000 000
Connect~on
A'
Ground Reference Plane ( G R P ) ~
Figure 4-59. Pin injection test setup (side view)

Measurement Methods
Probe
Capacitance (C): Discrete or PCB
Probe
Coaxial Probe connection to
reference EFT generator
Figure 4-60. Example EFT pin injection probe.
The EFT probe shown in Fig. 4-60 is connected directly to the coaxial high voltage output of the EFT generator. The probe is constructed of a series capacitor and a metallic probe. The value of the series capacitance should be such that it does not significantly load any pin of the DUT. It is recommended that pins be tested in high-impedance or input mode where possible so that the DC blocking capacitance value is not critical to the DUT functionality. For output pins, the DC block capacitance should not exceed 10% of the rated capacitive load to prevent excessive degradation of the output waveform. The DC block capacitor can be realized using discrete components or embedded PCB structures. The test PCB is mounted in a non- conductive fixture that provides stability. The test fixture also provides the ability to position and hold the probe in contact with an individual IC pin or, in the case of a leadless package such as ball grid array (BGA), an individual PCB test point.
Power
Attenuator (optional)
Generator
Figure 4-61, Example EFT injection circuit implemented on a PCB.
160 Measurement Methods
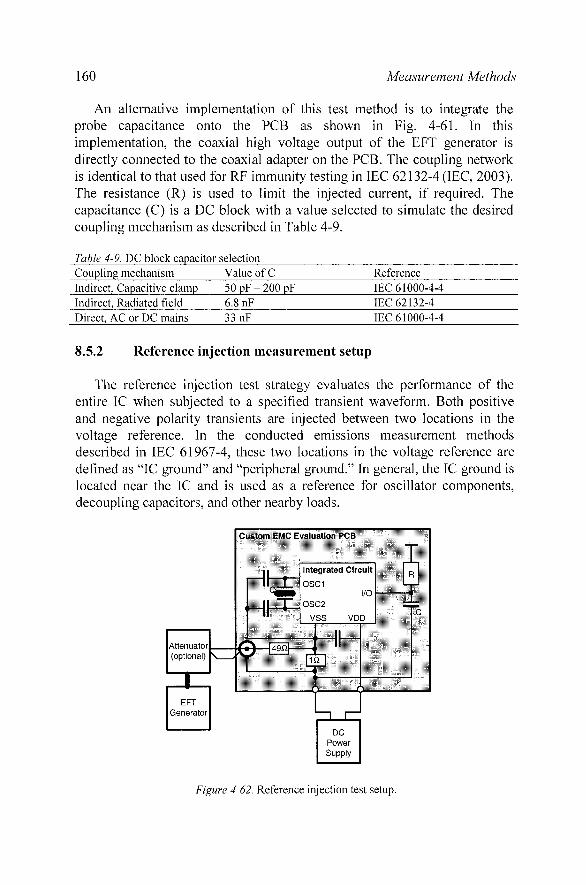
An alternative implementation of this test method is to integrate the probe capacitance onto the PCB as shown in Fig. 4-61. In this implementation, the coaxial high voltage output of the EFT generator is directly connected to the coaxial adapter on the PCB. The coupling network is identical to that used for RF immunity testing in IEC 62132-4 (IEC, 2003). The resistance (R) is used to limit the injected current, if required. The capacitance (C) is a DC block with a value selected to simulate the desired coupling mechanism as described in Table 4-9.
Table 4-9. DC block capacitor selection Coupling mechanism Value of C Reference Indirect, Capacitive clamp 50 pF - 200 pF IEC 6 1000-4-4 Indirect, Radiated field 6.8 nF IEC 62 132-4 Ilirect, AC or IIC mains 33 nF IEC 6 1000-4-4
8.5.2 Reference injection measurement setup
The reference injection test strategy evaluates the performance of the entire IC when subjected to a specified transient waveform. Both positive and negative polarity transients are injected between two locations in the voltage reference. In the conducted emissions measurement methods described in IEC 61967-4, these two locations in the voltage reference are defined as "IC ground" and "peripheral ground." In general, the IC ground is located near the IC and is used as a reference for oscillator components, decoupling capacitors, and other nearby loads.
Attenuator (optional)
Generator w Power
Figure 4-62. Reference injection test setup.

Measurement Methods 161
The peripheral ground is remote from the IC and is used as a reference for cables or distant loads. Injecting the transient signal between these two locations will cause current flow in each IC pin connected to the peripheral ground. This test simulates the condition where a transient couples to connected cable bundles.
An alternate use of this method is to inject the transient between VSS pins from different power domains (i.e. - digital VSS and analog VSS). An example of this use has been documented by Fiori (2004).
The basic test setup is shown in Fig. 4-62. The test setup is the same as for the DPI injection method. The test setup shows the DUT installed on a custom EMC evaluation PCB generally designed in accordance with IEC 621 32-4 or IEC 61967-4.
8.5.3 Disturbance
The disturbance signal is typically the same as used for the end product. Reduced transient voltage levels may be used depending on the performance characteristics of the device under test (DUT).
8.5.4 Test Procedure
The test procedure will be driven by the functionality of the DUT but is generally similar to the equivalent end product test method.
8.5.5 Failure criteria and monitoring
Once again, the failure criteria will vary depending on the IC type, IC functionality, and the impact of the PCB on monitoring and detecting performance degradation. In the case of application-independent IC EMC evaluation, utilizing a customized IC EMC test board provides the ability to monitor the DUT to produce the most detailed failure description. Using the evaluation of a microcontroller as an example, specialized code and a rigorous microcontroller- or computer-based monitoring system allow the detection and reporting of self-recoverable or "soft" errors in real time. These types of errors can be difficult or impossible to detect in an application or when using only visual indications of susceptibility.
8.5.6 Test PCB
For the pin injection test methodology, the DUT is an IC that can be installed on any type of PCB: an actual product PCB, a generic IC demonstration or evaluation PCB, or an application independent PCB for
162 Measurement Methods
EMC evaluation purposes such as those defined in IEC 61967-1 or IEC 62132-1. However, this test method is typically performed using an application independent PCB designed specifically for EMC testing. This type of PCB is used in order to better control the loading of each DUT pin. This results in data that allows more reliability when comparing the performance of different ICs.
For the reference injection test methodology, an application independent PCB designed specifically for EMC testing is required.
8.5.7 Synchronized Impulse Immunity
Testing against impulses is commonly done in a stochastic manner as most EMC-testing related impulse generators (ESD, EFT, etc.) cannot be synchronized or triggered with high accuracy. A series of pulses is applied to a product or device and after that series of pulses it is determined whether the product or device is still working satisfactorily i.e. meeting its expectations.
When a signal level exceeds the specified logic signal condition due to induced impulses, nothing may happen as long as the logic threshold voltage is not exceeded and the duration of the pulse lasts long enough for the logic to react.
T~rne-w~ndow durmg which Output the gale IS very sens~st~ve Voltage ,
Input gl~fch Fluctuabon of the
output
Figure 4-63. A small change in the "gray window" result in a significant changc in the output.
With nanometer CMOS technologies featuring a logic gate switching delay in the region of 20 - 50 ps (90nm CMOS), virtually all impulse events may be considered as threats for the integrated circuits. In addition to the above, during a transition of a logic signal, the signal passes the defined logic levels into a grey area where a decision threshold window occurs. In that window, typically less than 100 mV, a change of the input will result in a change of the output of that logic cell, as illustrated in Fig. 4-63.

Measurement Methods 163
The equivalent gain of the logic cell in its transition region is very high. Considering a functional signal slope of e.g. 100 ps with a swing of 1.8 V, the time window where the gate is very sensitive to a glitch is around 6 ps. Outside this specific time window, the amplitude needed to induce a logic glitch is very close to VDD/2. When the clock is running at 200 MHz (TPeriod = 5 ns), the likelihood of hitting the sensitive up-going transition window will be about 0,1% i.e. 1000 pulses are necessary to hit it statistically only once.
When only 50 impulses are applied to the product (IEC 61000-4-2 requirement) the likelihood of hitting it once at its most sensitive window is unlikely and even when 10000 pulses are applied statistics indicate 10 sensitive occurrences i.e. the lowest disturbance level is found to upset the device. With higher impulse amplitudes, more reactions may have been caused but information about what is caused or when is ultimately lacking.
8.5.7.1 Proposed Approach To find sensitive time slots in a program cycle, a new impulse immunity
test method has been defined by which the impulse is applied to the device in a defined way and at a (pre-) defined moment in time (fully synchronized). The impulse has to be coupled onto the device via various pins; 110, reset, oscillator, V,,,, Vddx in a defined manner without affecting the functional signal (too much).
A prerequisite is that the program cycle duration with the device to be tested is constant and not determined by any data content. To indicate the completion of a program loop, a dedicated port pin (bit) shall be assigned. The program loop complete toggling bit, together with the device clock and a measurement system available signal will set a trigger condition. With this fixed trigger condition signal, a delay generator is triggered for which a delay can be set from ns to ms with a 10 ps incremental step size. As such, the program cycle can be sliced into 10 ps intervals and at each step, the impulse can be applied (taking into account the systematic delay of the equipment and circuits involved).
From the device under test, the program cycle duration is measured and compared to the duration of a non-disturbed cycle by means of a Time Domain Modulation Analysis (jitter analysis). Due to the induced pulse somewhere during the program cycle, the overall program cycle is affected to become shorter or longer, determined by:
The polarity of the impulse (+I-). The amplitude of the impulse. The rise time of the impulse. The duration of the impulse. The delay i.e. the moment in the program loop i.e. code running.

Measurement Methods
Impulse
Power SUPPI U
Figure 4-64. Impulse coupling onto the ground pin(s) of an IC
8.5.7.2 Impulse coupling onto the device For the coupling onto the supply and ground, a network has been defined
which represents a series resistance of 1 SZ in parallel to 10 pH inductor (to by-pass the DC current). As such, hardly any IR-drop (Current-Resistance- drop) results from the coupling network as the impedance of the inductance at DC can be m a . Between the 50 SZ generator output and the I SZ load an RF transformer is used with a 1:4 ratio to minimize RF losses (Fig. 4-64). In series towards the RF transformer, a 2 fi resistor is used such that the total load impedance will be 3 SZ.
Together with the RF transformer ratio, a 48 CI load is presented at the output of the impulse generator. Using this technique has resulted in a broadband coupling network with a bandwidth over 1 GHz (-3dB) I .
For coupling onto the 110 and other pins, a coupling network shall be used which is functionally transparent, has high directivity towards the pin connected and minimal extra load to that pin. Various attempts have been implemented but ultimately an RF equivalence of the telephone fork circuit has been found most suitable, again with minimal losses. To achieve high directivity, the load condition of the fork has to be made equal to the pin's impedance i.e. the load will be pin-determined.
I To benefit from this response, the coupling network has to be placed as close as possible to the relevant pins of the IC

Measurement Methods 165
When the fork is used with an input, a signal 40 dB lower is coupled to the input pin rather than to the signal source. Also with an output pin, the same directivity performance can be met. With pins like the oscillator pins, reset input pins, etc. the 1 C2 coupling network can be used in series with the timing capacitor at the reset pin (either to V,, or Vdd), the two capacitors to "ground" with a Pierce oscillator application, etc. Again, this coupling measure will not have a significant effect on the functionality.
8.5.7.3 Complexity With high-density interfaces (HDI) one has to be selective concerning the
number of pins chosen to apply the impulses to, as otherwise the total test time would become unacceptably long. With a different core-versus- peripheral supply voltage, all the separate supply and ground pins have to be chosen; minimally 4 or 3.
When the device has one common Vss, the number of pins to inject is reduced from 4 to 3. With IIOs, only a few non-redundant pins shall be selected and only those which are likely to be exposed to external impulses. Other pins, like the oscillator and the reset pin are unlikely to be directly exposed to external impulses but the technique may be applied to investigate the impulse susceptibility of their pins.
Multiplying the number of variables leads to an excessive test time: For example 10 pins to be tested. Various codes. Various impulse conditions. Most synchronous processors act on the rising edge of the clock. As
such, the most susceptible window occurs during the rise time of the clock, with some skew. The rise time window is commonly short compared to the clock cycle e.g. 1:10 or less. Program cycles should be kept short to allow reliable reading with a time domain analyzer as the response "error" that is sought can be only a few ns.
Short series of measurements will already indicate the root cause of the immunity problem: oscillator, PLL, level-shifter, program counter, etc.
8.5.7.4 Results During the development of the measurement method, various products
were tested from simple logic gates to microcontrollers and DSPs. In Fig. 4- 65, the jitter is given for a microcontroller. When no impulses are applied or when the pulse is injected before or after the clock edges, the system jitter is of the order of 1 ns.
However in sensitive time windows, the jitter increases to 3 ns, with the amplitude, rise time and impulse duration given here.
Measuvemenl Methods
Time
Pulse 4 >I
.) \ Time
4.0
3.5
3.0
2.5 jitter [nsl 2 o
1.5
1 .o
0.5
0.0 0.5 0.0 0.5 1.0 1.5 2.0 2.5 3.0 3.5
Delay
Figure 4-65. Measured jitter vs. impulse delay for a microcontroller.
Program
loop l - - - - -7 t Peak to Peak Jitter [ns]
Pop Set Push Push Inc ClrC Mov Sub Pop Pop Clr A B A A R O A A A A
Figure 4-66. TDMA response from a microcontroller as function of the codes running

Measurement Methods 167
In this example, these sensitive windows occur during communication between the core and the peripheral cells while toggling the program loop bit. Using this approach, the most sensitive time windows can be identified and re-used for targeted immunity analysis.
The time slots with high jitter are program-code dependent, as seen in Fig. 4-66. Consequently, the sensitive slots only apply for one specific microcontroller at one specific port, running a fixed set of code instructions. Altering one of these parameters may affect the overall response.
8.6 Discussion
In this section, the fast transient immunity environment and the test methodologies being used or developed to evaluate the transient immunity performance of integrated circuits (ICs) were presented. While every attempt has been made to provide relevant information and guidance, the final form of the standardized IC test method or methods may differ significantly from the information provided herein. In fact, it is expected that work currently in progress by the IEC and others will either refine or diverge from the methods presented in the development of appropriate IC fast transient immunity test methods.
Impulse immunity testing is a time-consuming test methodology. The synchronized approach has the advantage that the exact time window of the program loop where the highest sensitivity occurs can be retrieved.
The coupling method used is applicable to all IC pins as it is supply- current independent. The repeatability of the test method with respect to the detection of the time window and the amount of jitter resulting has proven to be very good.
9. EMISSION AND IMMUNITY TESTS IN ANECHOIC CHAMBER
According to some electronics equipment EMC standards, emission measurement may be carried out taking into account the contribution of far- field radiation coming from electronic circuits. With specific setup arrangements, these measurement approaches may be applied to integrated circuit characterization. This chapter describes the basic ideas beyond far- field emission, possible setup for emission/immunity measurement in anechoic chambers and reverberating chambers.

Measurement Methods
9.1 Par-field emission from ICs
Generally speaking, far-field emission coming from ICs is due to the combination of radiation of printed board tracks, package lead and bonding, as ICs do not radiate directly except in extremely high frequencies. A typical cross-section of a printed-circuit board is given in Fig. 4-67.
Circuit load \ Track
Bondrng & lead arrungement
Package
~onzponenr Ground Ground
connectron plane (EM1 Source,
Ground ' connection
Figtire 4-67. Cross-section of a typical printed-circuit board
Far-field emission depends on the five main parameters: the spectrum figure of the EM1 source at component level, the bonding arrangement, the track length, the circuit load and the EM1 wavelength. We can distinguish two cases: the low frequency case when the minimum wavelengthil,,,, of interest in the EM1 spectrum is much larger than the track length Lo (Eq. 4- 12). In the high frequency case, the minimum wavelength/2,,,,, of interest in the EM1 spectrum is much smaller than the track length Lo (Eq. 4-1 3) .
Low frequency assumption: Amin >> Lo (4- 1 2)
High frequency assumption: ,Imi, << Lo (4- 13)
With a wide wavelength compared to the lead and bonding length, emission is mainly due to PCB tracks. According to the low frequency behavior and assigning load values matched with characteristic track impedance, circuit emission is similar either to magnetic or to electric dipoles. Assuming the condition of perfect conductivity and a ground plane of infinite size, we can apply image theory in order to determine the far-field emission of a magnetic dipole with surface equal to ZhL,, or an electric dipole with height 2h respectively. Radiation is restricted here to a half- infinite free space above the ground plane.

Measurement Methods
Maximum magneticjeld \ ....... c".""'
amplitude ..' :
Figure 4-68. Radiation of a current loop
Considering a current ~ ( o ) flowing through the loop of length L , and height 2h, the maximum magnetic field is generated on half-circle patterns perpendicular to the ground plane as shown in Fig. 4-68.
Simple formulations exist to compute the E, H contribution in nearlfar- field conditions, from the elementary current dipole characteristics (See Chapter 3 "Fundamentals and theory").
The 1C and PCB under test may be considered as a series of current dipoles with specific space orientation, from which the far EM field may be computed.
9.2 Measurement of electric far-field due to ICs
Far electric field measurement may be carried out by means of the experiment facility shown in Fig. 4-69. The circuit under test is fixed on a rectangular aperture at the outer side of a shielded box.
Shielded box
Figure 4-69. Mcasurcment setup applicable at device level

170 Measurement Methods
The ground plane of the DUT must be electrically connected to the shielded box all around the test board. A shielded box is used to avoid any parasitic emission coming from the circuit backside. A battery placed inside the box supplies the device under test. The DUT data bus preferably uses optical links with the control test bench to avoid parasitic emission from the cables.
Normally, far-field measurements require that location ro of the wide band-receiving antenna must be greater than the wavelength. The typical distance is 1 m to 3 m. The maximum electrical field emission specified by international standards is around 40 dBpV/m (100 pV/m), which corresponds to the sensitivity level of usual broadcasting receivers.
9.3 Emission measurement in anechoic chamber
An anechoic chamber consists of a shielded chamber with electromagnetic absorbing pyramids at the walls and ceiling inner side. Normally, EMC standards do not require absorbing material in the ground plane area. In that case the chamber is called "semi-anechoic". As illustrated in Fig. 4-70, the device under test stands on a moving plate situated at a height hO above the ground, and distance do from the antenna. The plate moves the DUT in order to determine the angle for peak emission.
Pyramidal absorbers avoid any reflection on chamber walls, thus reproducing propagation conditions similar to those obtained in free space. However, the absorbers exhibit a low cut-off frequency governed by the size and characteristics of absorbing pyramids, which is typically 100 MHz.
Shield . a Absorbing ram ids
Floor 'Ground plane
Figure 4-70. Setup for dcvicc emission measurement in anechoic chamber.

Measurement Methods 171
The distance do between DUT and the antenna depends on the size of the chamber, with a typical value of 1 meter for integrated circuits. The measurement may be performed with a log antenna (dipole array) between 300 MHz and 1 GHz and with a double ridge horn antenna between 1 GHz and 10 GHz, according to (CISPR, 2002)
9.4 Radiation immunity test on ICs
Let us consider a test board submitted to an electromagnetic wave (Fig. 4-70). The coupling effects at board and IC levels are governed by the coupled line theory as summarized in Fig. 4-71. An incoming electromagnetic field at track level is due to the interaction between the plane wave and the shielded box itself.
The resulting normal electric field E,' and tangential magnetic field Hr components induce a parasitic current represented by a source I. and a parasitic voltage represented by the voltage source Eo .
Figure 4-71. Test board illuminated by an electromagnetic wave.
l<e.srslrve load
Adu'irroncrlp~~rc~meter\ due to /rack rndrctunce
and ccpcriance
Voltcrge ut componen~ rnpur
or oulput porl
Figure 4-72. Thc incident EM field induces a parasitic current and voltage on the PCB track.

172 Measurement Methods
Assuming sine wave excitation and a wavelength much larger than the physical dimensions of the tracks, the voltage and current sources may related to the incident electromagnetic field with the following equations:
In Eq. (4-1 5), C,, corresponds to per-unit-length capacitance of the track, LO the track length, and h the oxide thickness between the conductor and the ground. Equations (4-14) and (4-15) show that coupling strength increases with the frequency.
At high' frequencies, coupling is enhanced by resonance phenomena, especially when the load at the left end of the track behaves as a short circuit. Furthermore, the resulting electromagnetic field depends on the plane wave incidence and polarization, and the formulation for EO and I0 cannot be expressed in a simple way.
9.5 Immunity test in anechoic chamber
Faults at IC level usually appear when the incoming electric field rises from 10 V/m to 1000 Vlm. Extensive susceptibility measurement published by Hoad (2004) have shown that the field amplitude needed to provoke failure in personal computer motherboards was increased with frequency from 1 to 10 GHz (Fig. 4-73). Worth of interest, the new generations of PCB were significantly less susceptible than older versions.
Very high field levels are very difficult to obtain in open space. Furthermore, such emission levels are prohibited by international regulations, due to significant interference with radio-communications. This context involves performing radiated immunity tests inside a shielded room with absorbing walls in order to obtain propagation like that provided in free space. Fig. 4-74 shows an anechoic chamber facility used to perform this type of experiment.
A high power radio-frequency source placed outside the chamber feeds a wide frequency-band transmitting antenna placed inside the shielded volume. Usually, the distance r, between this antenna and the DUT ranges between 1 to 3 meters.

Measurement Methods
/.'reoueficv l i m ~ l for
Figure 4-73. Susceptibility trends with interference frequency (Hoad, 2004).
RF source
Figure 4-74. Cross-section of an anechoic chamber
The normal or faulty signal issuing from the DUT is observed by means of an optical link between the output port of the DUT and the measurement equipments located outside the room.
The testing procedure as described in the EMC standard requires two- step, one for field calibration and the other for the test itself. Field calibration without the DUT consists in adjusting the RF power in order to obtain the expected electric field amplitude in the DUT area. The electric field is measured by means of a sensor at a few locations recorded within specified areas close to the DUT. EMC standards recommend that the field deviation should not exceed 6 dB around the average amplitude.

174 Measurement Methods
The test is then performed on the device. For each given frequency, the DUT is moved using a rotating plate in order to check for any possible fault. If no fault is detected in all possible orientations, the RF power is increased until a fault is provoked, or the power limit is attained.
To explore the whole radiation pattern, the DUT must be mounted on the top and on one side of the shielded box. Immunity measurements in anechoic chambers are time-consuming and may require very powerful sources. Power amplifiers between 100 W and 1000 W are usually needed to investigate integrated circuit immunity to radio-frequencies.
9.6 Immunity and emission tests in reverberation chamber
The use of mode stirred reverberating chamber may be extended to immunity and emission tests on integrated circuits. A reverberation chamber works like an oversized electromagnetic cavity, and consists of a shielded chamber with highly conductive walls without absorbing material. Assuming a perfectly rectangular cavity with dimension a, b, d, such a cavity produces electromagnetic field resonance at frequencies f,,, predicted by Eq. (4- 16):
In this expression, c corresponds to the speed of light in vacuum, while the integer parameters m, n, p, characterize the resonance modes. When excited at their corresponding frequency, standing waves merge within the cavity and the field behaves as a sinusoidal wave distribution. When the wavelength is much smaller than the chamber's dimensions, many wave reflections occur on the walls and the radiation pattern of the field inside some parts of the chamber becomes isotropic.
However, in order to obtain a uniform electromagnetic field with a random distribution, a stirrer with high conductive paddles is moved in the room at an appropriate location. Fig. 4-75 shows a few of the details of the configuration of the reverberating chamber for immunity test on ICs. To avoid direct coupling to the DUT, the exciting antenna is oriented toward a corner of the shielded room.
As previously mentioned, the test board is mounted on a shielded box and placed on a table a few wavelengths away from the walls and the ground floor conductive plane.

Measuvemenl Methods
Shielded
Modes stlrrer
Output data
Figure 4-75. Mode-stirred reverberating chamber
A battery inside the shield box supplies the IC, while the output data is sent outside the chamber through an optical link.
The immunity test is conducted as follows: for each given frequency, the power at the transmitting antenna is adjusted according to the calibration. When moving the stirrer up 360°, amplitude and polarization at DUT location change randomly. The stirrer rotating speed is usually slow (Around 1 turnlsecond). Higher rotating speeds may shorten the test procedure as the probability of exposing the DUT to the worst case conditions may be increased.
The calibration procedure consists in measuring electrical field amplitude with a small 3D electric probe. Nine points representing the corners and center of a rectangular shaped volume within the room produce data for 27 fields with amplitude uncertainty linked to the position of the stirrer. The standard deviation of the collected data must be within a 3 dB deviation.
It should be noticed that immunity tests carried out in a reverberation chamber produce field strength amplitude reaching 100 Vlm or more with reduced incident power at the transmitting antenna (between I and 10 W). The reason for this field efficiency is the high quality factor as a consequence of multiple field resonance effects in the cavity.
Emission measurement may also be performed in a reverberation chamber. In this case, radiated field amplitude is deduced from the power collected at the receiving antenna. Experiment facilities are similar to those presented previously, except that a spectrum analyzer replaces the power amplifier, and holds the maximum field amplitude, as the stirrer is moving.

Measurement Methods
11 I07105 12:34:49 REF 70 dBpV ATT 0 dB A-Wrile @_Blank 5dBI I . a , , , , . . . .
, , , a , MARKER I 146.4 MHz 62.25 dBpV
, , , , , , , , , , 0
RBW 120 1
VBW 3000
SWP 0.4 s LL
START 30 MHz STOP 1000 MHz
Figure 4-76. Stirred mode chambcr uscd to mcasure radiated emission of a clock device.
The emission tests presented in Fig. 4-76 concern a digital clock mounted on a small PCB. The DUT was placed inside the anechoic room on a rotating table, one meter above the ground plane. Receiving wide-band antenna was stand at a 3-meter distance from the DUT. A biconical antenna was used for frequency within 30 to 300 MHz, and a log-periodic antenna covered the frequencies 300 MHz to 1 GHz. The measured spectrum do not comply with the EN 55022 standard which fixes the emission limit to 40 dBpV/m from 30 MHz to 230 MHz.
Susceptibility measurements reported in Fig. 4-77 were obtained as follow: for each frequency, power at transmitting antenna was increasing until reaching a fault at the output of the digital circuit under test. The observed error was an erroneous change of the logical state. The electric field amplitude corresponding to the triggering of a fault was put on the vertical axis of the graph. In the figure, the solid line corresponds to susceptibility level recorded in anechoic room within frequency range 450 MHz to 1 GHz, while the doted line is deduced from test performed in modes stirred reverberation chamber with stirrer full rotation. These curves show similar shape: the most critical susceptibility occurs at frequency close to 500 MHz which fits with the resonance of PCB tracks connected at the IC inputs. Above 500 MHz, improved immunity may be explained by the combination of propagation phenomena on PCB tracks with respect to the wavelength, and filtering effects due to parasitic capacitance at package and circuit level.

Measurement Methods
A n W o b chamber - Revarbemtion chamber
Figure 4-77. Logic circuit susceptibility to RF interference in anechoic and reverberating chambers.
9.7 Discussion
Characterization of ICs in terms of far-field emission and radiated immunity may be carried out using anechoic chambers in order to determine the electromagnetic field as would be found in free space. However, anechoic chambers require costly equipments that must include absorbing materials and wide frequency-range power amplifiers. An alternative way consists in using a reverberation chamber which may significantly reduce the amplifier cost. Similar experimental results have been obtained in anechoic or mode stirred chamber, both from and emission and susceptibility point of view.
10. ON-CHIP MEASUREMENT
Different on-chip techniques may be used to characterize EMC noise sources within ICs, which may give valuable information on the current peak amplitude, flow within the power network and coupling to other parts of the integrated circuit. In the past few years, there has been a strong interest in finding alternatives to complex, expensive and inaccurate off-chip measurements, by measuring internal signals with non-invasive on-chip methods featuring time-domain accuracy the order of a few pico-seconds (PSI.

178 Measurement Methods
Soumyanath (I 999) proposed a non-intrusive time-domain method, based on a rail-to-rail comparator. The calibration required a complex external setup with limited timing resolution. Makie-Fukuda (1996) proposed a method based on voltage-comparator, from which the noise amplitude and rms voltage could be extracted. As MOS transistors have a maximum operating frequency above 30GHz in deep submicron technology, on-chip oscilloscopes for sampling very high bandwidth signals can be designed (Zheng, 2003; Vrignon, 2005), which give valuable information on the internal current flow and from which the parasitic emission of the entire circuit may be derived.
10.1 On-chip Oscilloscope
One of the most efficient approaches is based on an on-chip sample-and- hold circuit that directly probes the voltage fluctuation at a location within the circuit. The schematic diagram of the sampling sensor is reported in the Fig. 4-78. An external signal Synchro is used to trigger the parasitic phenomenon, which is sampled, amplified and exported off-chip.
The sampling cycle is repeated for varying delays, externally controlled by Vanalog, until the waveform is reconstructed, just as a sampling oscilloscope would do.
The targeted phenomenon is a core switching, which induces a power supply line fluctuation on both the VDD and Vss interconnects. Four probes sample the voltage at both ends of two resistors RvDD and Rvss in series on the supply lines. The resistors have small values to limit the voltage drop that would influence the current measurements. The current is extracted from the voltage drop over the shunt resistors RDD and Rss.
r\ Amplifier
Delay Samplin
Synchro Sample
Vdd-Block
IC Core
Figure 4-78. Principles of the on-chip sampling of core current.

Measurement Methods
Storage F T
: .............a . : 2
AT1 A'Q AT3 AT4 V p.j p: &...* +*' : i . . . :
Synchro . : . . r/ . ?C\ / . b T
Reconstructed Waveform
T
Sampling
Figure 4-79. Reconstruction of the original current waveform.
1r-7 137 JJ . T
The probing sequence is detailed in Fig. 4-79. Each time the Synchro signal rises, a current peak appears which creates fluctuations on the supply lines. Concurrently, the sampling signal is delayed by Ati. This delay is linearly dependent on the externally controlled voltage Vanalog. At the active edge of sampling, the voltage value is sampled and stored in a small capacitor that acts as an analog memory for several hundred nanoseconds. The captured analog signal is copied by the follower that regenerates the signal to an external analog-to-digital converter.
The repetition of this procedure for a set of different values of Vanalog leads to a reconstruction of the fluctuation, within the limits of frequency and temporal resolution of the sensor.
Delay (ns)
50
40
30
20
10
0
o 03 1 1 ,5 2 Vanalog (V)
Figure 4-80. Delay cell characterization vs. Vanalog voltage control.

Measuvemenl Methods
Figure 4-81. Implementation of an on-chip sampling oscilloscope
Current (A)
0,12
0,l 0,08 0.06 0,04 0,02
0 -0,02 -0,04 -0,06
0 5 10 15 20 25 30
Time (ns)
figure 4-82. On-chip sampling of the core current on VDD supply lines.
Fig. 4-80 shows the delay dependence versus Vanalog for the on-chip sampling delay cell, featuring a good linearity. Fig. 4-81 shows the layout of the 4-probe sampling sensor in 0.18pm CMOS technology. The 4 samplers and the source-follower amplifier layouts fit in a silicon surface of 60oPm2. Fig. 4-82 demonstrates the use of the on-chip sensor for the measurement of current flow during active clock edges on a logic core. The current peak corresponds to the synchronous switching of around 10,000 inverters and logic gates.
The VIID line supplies a 2.5 V voltage. The current generates a fluctuation of the long line due to a combination of resistive, capacitive and inductive effects. A damped oscillation can be noticed, which indicates the presence of an inductance effect.

Measurement Methods 18 1
In the first 3 nanoseconds, a current up to 100 mA is observed in the case of a standard logic core (Core 1). The current is reduced to 60 mA for the same core with on-chip decoupling capacitance (Core 2).
Table 4-10. On-chip sampling performances vs. technology Techno-logy Band-width Observability Voltage Time Sensor size
resolution resolution 0.7 pm 4 GHz 1 ns to 30 ns 5 mV 5 DS lo4 um2 0.35 pm 8 GHz 1 ns to 100 ns 5 mV 5 i s 2500 pm2 0.18 pm 10 GHz 1 ns to 300 ns 5 mV 5 Ps 600 pm2 90 nm 14 GHz 1 ns to 500 ns 5 mV 5 ps 400 pm2
The system performances improve with technology scale-down, in terms of bandwidth and precision (Table 4-10). Silicon area also decreases with progress in integration. Furthermore, the system can be easily adapted to any CMOS technology. In 0.18pm CMOS process, the system featured a 20 GHz bandwidth and a resolution close to 5 mV, well suited to internal core current characterization, as well as substrate noise evaluation.
11. EMC TEST PLAN FOR INTEGRATED CIRCUITS
Still very rare some years ago, EMC specifications have become common elements of global IC specifications submitted by electronic system designers to IC manufacturers. The EMC specification usually covers parasitic emission and immunity levels that the component should comply to. Most EMC specifications are based on international standards such as IEC 61967 and IEC 62132. These specifications recommend methods to be used and give the associated required levels for meeting EMC automotive requirements. These generic specifications may not be fully applicable to any given component. In that case, a detailed conditions test and test setup are described in an additional specific document named Integrated Circuit EMC Test Plan.
11.1 Standard Emission Levels
A detailed classification of emission levels is part of the IEC 61967-4 standard, which applies for conducted noise measurement. The overall envelope of the spectrum must remain lower than a specified limit, such as the one shown in Fig. 4-83. Up to three different slope families of emission amplitudes have been specified: a 0 dB per decade amplitude line [A=84 dBpV, B=78 dBpV, etc.], a slope at -20 dB per decade defined by numbers ("1" crosses 1MHz at 120 dBpV, "1 0" crosses 1 MHz at 60 dBpV, "20" crosses 1 MHz at 0 dBpV), and a slope at -40 dB per decade.

182 Measurement Methods
lOOKHz 1 MHz lOMHz lOOMHz lGHz
Frequency
Figure 4-83. Slopes for emission envelope as defined in IEC 61967-4.
Emission level (dB/~v)
1 10 100 1000 10000
Frequency (MHz)
Figure 4-84. IC conducted emission levels specified for automotive applications.

Measurement Methods
Emission level (dBlrV)
10 100 1000 10000
Frequency (MHz)
Figure 4-85. Maximum emission levels specified in TEM cell.
Emlss~on level BCI (dBmA)
50
40
30
20
10
1 10 100 1000 10000
Frequency (MHz)
Emission level DPI (dBm)
10 100 1000 10000
Frequency (MHz)
Figure 4-86. IC susceptibility levels using BCI (up) and DPI method (down).

184 Measurement Methods
The vertical distance between each slope is 6 dB. The maximum emission level is usually specified by the IC customer, and may be described with one, two or three slopes depending on the application and requirements. Accordingly, the emission level can consist of up to three digits, such as "B4b" in Fig. 4-83. Each digit represents one of the slopes illustrated in the figure. Theses maximum emission levels are a standardized way of communicating maximum emission levels unambiguously. Emission limits given in some specification for automotive applications (Marot, 2004) are presented in the following way (Fig. 4-84). Level 1 corresponding to a very low level of 6 dBpV is required for low cost application with minimum on- board decoupling capacitance, and usually for 2-layer printed circuits.
Automotive equipment manufacturers design low-cost electronic boards using ICs that must comply with radiated noise limitations as low as 10 dBpV (Level 1 in Fig. 4-85). However, most 16-bit ICs exhibit 20-30 dBpV peak noise in TEM cell, which require further on-board filtering and decoupling.
11.2 Immunity Levels
The bulk-current-injection (BCI) standard defines a method for measuring the IC immunity via inductive coupling. Disturbances are induced on wires via a magnetic probe. Limits are given in dBmA, as detailed in Fig. 4-86. A level of 46 dBmA in BCI is usually required for low-cost automotive applications (Marot, 2005). The DPI standard defines a method for measuring the IC immunity via capacitive coupling. Limits proposed in EMC specifications are provided in dBm (dB milli-watt) scale, as illustrated in Fig. 4-86. An immunity level of 30 dBmA is often required for ICs to be mounted in low-cost embedded electronics for automotive applications.
12. DISCUSSION AND CONCLUSION
The main characteristics of the standardized emission measurement methods are listed in Table 4-11. All measurement methods are applicable from 150 KHz to 1 GHz, except the GTEM cell method that can extend the upper frequency to 18 GHz. The TEMJGTEM cell approach relies on a specific board with severe constraints concerning the dimensions, layers and placement of the DUT and its external components. The other methods require much less specific boards, like the 1/150 S2 method that requires discrete components and SMA connectors, or the WBFC method for which the test board can be placed in the measurement chamber just as it is.

Measurement Methods 185
Table 4-1 1. Comparison between emission measurement methods Item IEC 61967-2 IEC 61967-3 IEC 61967-5 IEC 61967-6
TEMJGTEM 111 50Q WBFC Magnetic Probe Frequency range 150 KHz-1/18 150 KHz-1 GHz 1 SO KHz-I GHz 1 SO KHz-1 GHz
GHz Measurement E/H from IC Differential and Common-mode Differential and
common-mode conducted common-mode emission emission emission
Single pin No Yes No Yes measurement Test board Specific, Added R,C, Application Long tracks
constraints SMA connectors board
As for the emission methods, the target frequency range for all these proposals is 150 KHz-1 GHz, except for the GTEM cell that may create incident fields up to 18 GHz. The BCI method generates parasitic current on cables that are directly connected to the DUT.
This method is an adapted version of the BCI standard for characterizing equipment susceptibility. The DPI method injects parasitic over-voltage as close as possible to the IC pin by capacitor coupling. As the IC input impedance is not 50 S2-adapted, the main drawback of the method is the cable resonance and the needs to make the distinction between the forward, reflected and transmitted RF power.
Table 4-12. Comparison between susceptibility measurement methods Item IEC 62132-2 IEC 62132-3 IEC 62132-4 IEC 62 132-5
TEM Frequency 150 KHz- range 1/18 GHz Injection E/H mechanism illuminating
the IC
Single pin No measurement Test board Specific
constraints
BCI DPI 150 KHz-1 150 KHz-1 GHz GHz Parasitic current Parasitic over-voltage on cables injected on an IC pin connected to the through a capacitor IC Yes No
Cables R,C, SMA con. for connected to the each injection point Dl JT
WBFC 150 KHz-1 GHz
Power injected on an IC pin through a wire loaded with 100 c2 Yes
Application board
The WBFC approach consists in injecting power on an IC pin through a wire loaded with 100 S2, an approach which features some similarities to both BCI and DPI methods. Novel measurement methods have recently been proposed which deal with impulse immunity to electrostatic discharge, electrical fast transients and electrical overstress. These methods are strongly supported by consumer electronics manufacturers and automotive equipment designers.

REFERENCES
Measurement Methods
Baudry, D., Bouchelouk, L., Louis, A. and Mazari, B., 2004, Near-field complete characterization of components radiated emissions, Proceedings of EMC Compo 04, Angers, France.
Bolomey, J. C., Gardiol, F. E., 2001, Engineering applications of the modulated scatterer technique, Artech House.
Budka, T. P., Waclawik, S. D., Rebeiz, M., 1996, A coaxial 0.5-18 GHz near electric field measurement system for planar microwave circuits using integrated probes", IEEE Transactions on Microwave, Technology and Techniques, 44(12): 2 174-2 184.
Camp, M., Gerth, H., Garbe, H., Haase, H., 2004, Predicting the breakdown behavior of microcontrollers under EMPIUWB impact using a statistical analysis, IEEE Transaction on Electromagnetic Compatibility, 46(3): 368-379.
CISPR 25, 2002, Radio disturbance characteristics for the protection of receivers used on board vehicles, boats, and on devices - Limits and methods of measurement; httn:lIwww.cisnr.org.
De Leo, R., Rozzi, T., Svara, C., and Zappelli, L., 1991, Rigorous analysis of the GTEM cell, IEEE Transactions on Microwave Theory and Techniques, 39(3): 448-500.
Fiori, F., and Musolino, F., 2004, A New Technique for the Measurement of IC Susceptibility to Electrical Fast Transients, 2004 International Symposium on Electromagnetic Compatibility, Eindhoven, The Netherlands.
Gao, Y., Wolff, I., 1998, Miniature electric near-field probes for measuring 3-D Fields in planar microwave circuits, IEEE Transactions on Microwave, Technology and Techniques, 46(7): 907-9 13.
Garreau, P., Van't Kloster, K., and Bolomey, J.C., 1992, Modulated scattering calibration procedure for a 2D array", proceedings of IEEE AP-S conference, Chicago, pp. 30-45.
Hoad, R., Carter, N. J., Herke, D., Watkins, S. P., 2004, Trends in EM susceptibility of IT equipment, IEEE Transaction on Electromagnetic Compatibility, 46(3): 390-395.
IEC 6 1967, 200 1, Integrated Circuits, measurement of electromagnetic emissions, 1 50 kHz to 1 GHz, IEC standard; www.iec.ch.
IEC 62132, 2003, Characterization of integrated circuits electromagnetic immunity, IEC standard; www.iec.ch.
Kazama, S., Arai, K. I., 2002, Adjacent Electric Field and Magnetic Field Distribution", IEEE International Symposium on EMC, Minneapolis, USA, pp. 395-400.
Liang, W., Hygate, G. Nye, J. F., Gentle, D. G. Cook, R. J., 1997, A probe for making near- field measurements with minimal disturbance: the optically modulated scatterer", IEEE Transaction on Antenna and Propagation, 45(5): 772-780.
Makie-Fukuda, K., Anbo, T., Tsukada, T., Matsura, T., and Hotta, M., 1996, Voltage- comparator-based measurement of equivalently sampled substrate noise waveforms in mixed-signal integrated circuits, IEEE Journal of Solid-state Circuits, 31(5): 726-73 1.
Marot, C., 2004, EMC IC measurements in design for automotive electronic unit, Proceedings of EMC Europe 2004, Eindhoven.
Marot, C., 2005, EMC measurement relation between IC and system in automotive application, Workshop EMC for ICs, EMC Zurich 2005.
Muccioli, J. P., North, T. M. and Slattery, K. P, 1996, Investigation of the theoretical basis for using a 1 GHz TEM cell to evaluate the radiated emissions from ICs, IEEE International Symposium on Electromagnetic Compatibility, USA.
Slattery, K. P., Neal, J., Cui, W., 1999, Near-field measurements of VLSI devices, IEEE Transaction on Electromagnetic Compatibility, 41(4): 374-384.

Measurement Methods 187
Soumyanath, K., Borkar, S., Zhou, C., and Bloechel, B. A,, 1999, Accurate on-chip interconnect evaluation: a time-domain technique, IEEE Journal of Solid-state Circuits, 34(5): 623-63 1.
Vrignon, B., Ben Dhia, S., Lamoureux, E., and Sicard, E. 2005, Characterization and modeling of parasitic emission in deep submicron CMOS", IEEE transaction on EMC, 47(2): 382-387.
Wang, A.Z.H., 2002, On-Chip ESD protection for Integrated Circuits, An IC Design Perspective, Kluwer Academic Publishers, ISBN 0-7923-7647-1.
Zheng, Y., and Shephard, K. L., 2003, On-chip oscilloscopes for noninvasive time-domain measurement of waveforms in digital integrated circuits, IEEE Transactions on VLSI Systems, 11: 336-344.