chapter 4: inhibition of friend virus induced...
TRANSCRIPT

CCHHAAPPTTEERR 44:: IINNHHIIBBIITTIIOONN OOFF FFRRIIEENNDD VVIIRRUUSS
IINNDDUUCCEEDD EERRYYTTHHRROOLLEEUUKKEEMMIIAA IINN MMIICCEE BBYY
PPHHYYLLLLAANNTTHHUUSS AAMMAARRUUSS,, BBEERRBBEERRIINNEE,, CCUURRCCUUMMIINN
AANNDD PPIICCRROOLLIIVV
TTAABBLLEE OOFF CCOONNTTEENNTTSS
44..11.. IINNTTRROODDUUCCTTIIOONN
44..22.. MMAATTEERRIIAALLSS AANNDD MMEETTHHOODDSS
44..22..11.. AAnniimmaallss
44..22..22.. FFrriieenndd MMuurriinnee lleeuukkeemmiiaa VViirruuss ((FFMMuuLLvv))
44..22..33.. IInndduuccttiioonn ooff eerryytthhrroolleeuukkeemmiiaa bbyy FFMMuuLLvv
44..22..44.. IInnhhiibbiittiioonn ooff FFrriieenndd vviirruuss iinndduucceedd eerryytthhrroolleeuukkeemmiiaa iinn mmiiccee bbyy PPhhyyllllaanntthhuuss aammaarruuss,,
BBeerrbbeerriinnee,, CCuurrccuummiinn aanndd PPiiccrroolliivv
44..33.. RREESSUULLTTSS
44..44.. DDIISSCCUUSSSSIIOONN

68
4.1. INTRODUCTION
The viral infections are linked to at least 15% of all malignant tumors
in humans (Butel, 2000). The understanding of causative role of viruses in
cancer and the mechanisms by which viruses mediates the transformation
of infected cells are very essential in order to study the viral pathogenesis.
The erythroleukemia induced by FMuLv is one of the best animal models
available to study the stepwise leukemia progression due to the
reproducibility of the sequential genetic mutations leading to transformation
of infected erythroblasts (Ben-David and Bernstein, 1991; Ruscetti, 1999;
Lee et al, 2003). The infection with FMuLv is used usually as the retrovirus
infection model for searching the potential of a medicinal preparation or
establishing a new treatment method (Zhang et al, 2004). The transformed
murine erythroleukemia cells (MEL) isolated from Friend virus infected mice
provided a versatile system to study the sequences of events taking place
during the differentiation of erythroblasts and also for the study of
erythropoietin mediated signaling cascade in vitro (Ney and D’Andrea,
2000). It could be possible that non-toxic antiviral agents may be useful in
the inhibition of virally induced carcinogenesis. In the present chapter we
evaluated the inhibitory role of Phyllanthus amarus, Berberine, Curcumin
and Picroliv on FMuLv induced erythroleukemia and we also determined the
possible mechanism by which these compounds inhibited the progression of
leukemia.
4.2. MATERIALS AND METHODS
4.2.1. Animals:
BALB/c mice were used in the present study
4.2.2. Friend Murine leukemia Virus (FMuLv):
The erythroleukemic cell line (Clone B) was a gift by Dr. Ben-David,
Canada. It was grown in DMEM with 10% FCS. The supernatant of the
confluent bottle contains the FMuLv. The supernatant was centrifuged and
the clear portion was aliquoted and stored at -200C till use.
69
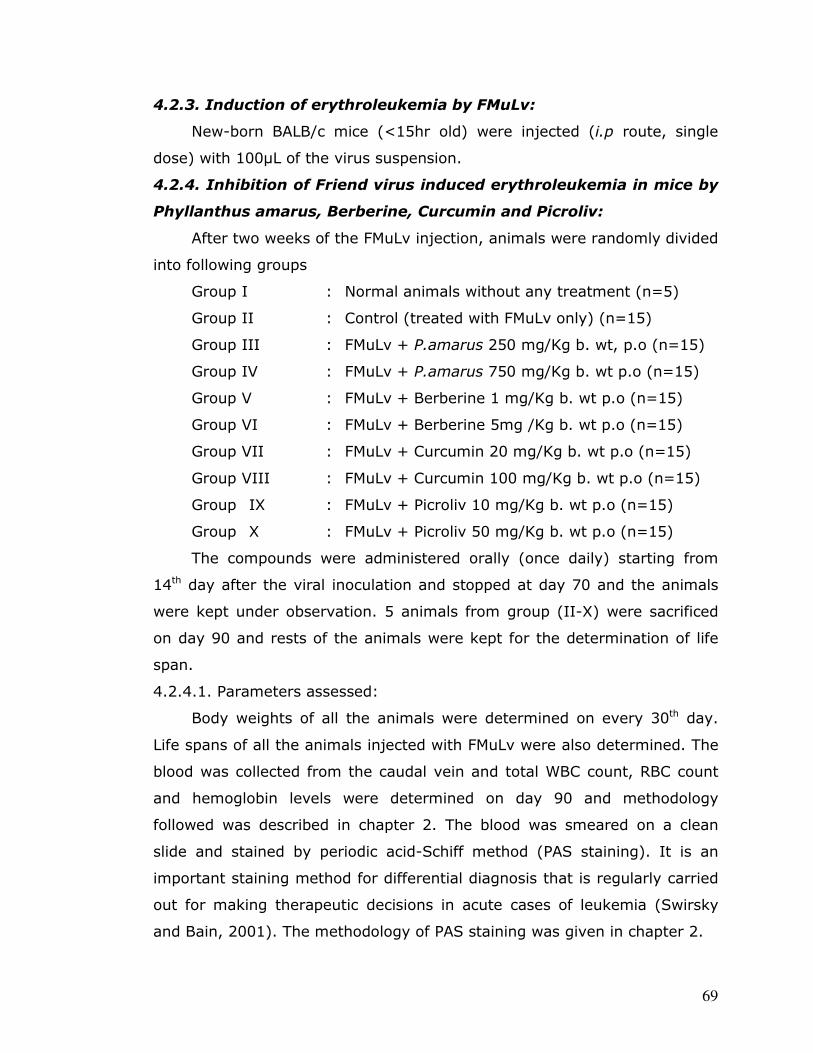
4.2.3. Induction of erythroleukemia by FMuLv:
New-born BALB/c mice (<15hr old) were injected (i.p route, single
dose) with 100µL of the virus suspension.
4.2.4. Inhibition of Friend virus induced erythroleukemia in mice by
Phyllanthus amarus, Berberine, Curcumin and Picroliv:
After two weeks of the FMuLv injection, animals were randomly divided
into following groups
Group I : Normal animals without any treatment (n=5)
Group II : Control (treated with FMuLv only) (n=15)
Group III : FMuLv + P.amarus 250 mg/Kg b. wt, p.o (n=15)
Group IV : FMuLv + P.amarus 750 mg/Kg b. wt p.o (n=15)
Group V : FMuLv + Berberine 1 mg/Kg b. wt p.o (n=15)
Group VI : FMuLv + Berberine 5mg /Kg b. wt p.o (n=15)
Group VII : FMuLv + Curcumin 20 mg/Kg b. wt p.o (n=15)
Group VIII : FMuLv + Curcumin 100 mg/Kg b. wt p.o (n=15)
Group IX : FMuLv + Picroliv 10 mg/Kg b. wt p.o (n=15)
Group X : FMuLv + Picroliv 50 mg/Kg b. wt p.o (n=15)
The compounds were administered orally (once daily) starting from
14th day after the viral inoculation and stopped at day 70 and the animals
were kept under observation. 5 animals from group (II-X) were sacrificed
on day 90 and rests of the animals were kept for the determination of life
span.
4.2.4.1. Parameters assessed:
Body weights of all the animals were determined on every 30th day.
Life spans of all the animals injected with FMuLv were also determined. The
blood was collected from the caudal vein and total WBC count, RBC count
and hemoglobin levels were determined on day 90 and methodology
followed was described in chapter 2. The blood was smeared on a clean
slide and stained by periodic acid-Schiff method (PAS staining). It is an
important staining method for differential diagnosis that is regularly carried
out for making therapeutic decisions in acute cases of leukemia (Swirsky
and Bain, 2001). The methodology of PAS staining was given in chapter 2.

70
Biochemical parameters:
The serum uric acid levels were estimated as described in section
2.2.6.9.
Histopathological analysis:
Animals were sacrificed at day 90 after viral inoculation and the liver
and the spleen were excised, washed in ice cold normal saline. A portion of
these organs were fixed in 10% buffered formalin and sections were made.
The sections were stained with hematoxylin-eosin method and observed
under a microscope.
Analysis of gene expression:
Isolation of RNA from the tissue:
Isolation of RNA from tissue follows the method of Chomczynski and
Sacchi (1987; 2006).
100mg of the spleen from higher dose treated group was minced and
homogenized in 1mL of denaturing solution (Guanidinium thiocyanate 4M,
25mM sodium citrate, pH 7.0, 0.1M β-mercaptoethanol, prepared in DEPC
treated de-ionized water). The contents were transferred into a
polypropylene tube and 0.1mL of 2M sodium acetate (pH 4.0) was added
and contents were mixed well by inverting the tube. After the mixing 1.0mL
of water saturated phenol was added to each tube and the contents were
mixed well. This was followed by the addition of 0.2mL of chloroform-
isoamyl alcohol (49:1) and the mixture was kept at -200C for 5 min. The
contents in the each tube were centrifuged at 12000 rpm for 30 min at 40C.
The aqueous phase was transferred into a new vial and mixed with 1.0mL of
isopropanol and placed again at -200C for 1 hr. The vials were centrifuged
again at 12000 rpm for 20 min at 40C and the supernatant was discarded
from each vial. The pellet so obtained was dissolved in 300µL of denaturing
solution and mixed with 500µL of isopropanol again. Further the mixture
was kept at -200C for 30 min. The vials were centrifuged at 12000 rpm for
30 min at 40C and the supernatant was discarded. The pellet was
resuspended in 1mL of 75% ethanol, the contents were vortexed for few
seconds and incubated at room temperature for 15 min. The mixture was

71
centrifuged again at 12000 rpm for 10 min at 40C and the supernatant was
discarded. The pellet was air dried. Finally dissolved the pellet in 100µL of
DEPC water and stored at-700C. The RNA isolated was used for the
preparation of cDNA.
Preparation of cDNA:
The cDNA was prepared from RNA by RT-PCR as described below.
10µL of the RNA sample was taken and it was denatured at 950C for 5min.
Preparation of the reaction mixture for RT-PCR:
Reagents Quantity per sample
---------------------------------------------------------------------------
10X PCR buffer 2 µL
25mM MgCl2 2 µL
10mM dNTPs 2 µL
Oligo dT 1 µL
RNase inhibitor 1 µL
AMV RT 1 µL
DEPC water 7 µL
---------------------------------------------------------------------------
Total 16 µL
The contents were centrifuged and 5µL of denatured RNA sample was
added. The mixture was vortexed and centrifuged and cDNA was
synthesized using a mini thermocycler.
Reverse transcription reaction:
The reaction mixture was incubated at the following temperatures and
time by using a thermocycler.
Temperature Time
420C 60 minutes
920C 5 minutes
40C 5 minutes

72
After the reaction contents vials were stored at -700C.
The cDNA prepared by the above described protocol was used for the
analysis of expression of the following genes. Their primer sequences and
expected product size are given below.
Primer sequence and product size of genes:
Name of the gene with primer sequence Product size
p53
Forward 5’CGGAGGTCGTGAGACGCTG3’ 205
Reverse 3’CACATGTACTTGTAGTGGATGGTGG5’
Bcl-2
Forward 5’CAGCTGCACCTGACGCCCTT3’ 235
Reverse 3’CCCAGCCTCCGTTATCCTGGA5’
P45NFE2 (nuclear factor erythroid 2)
Forward 5’CCTGAAAGGTTGCAGGAATC3’ 454
Reverse 3’CCCAATGTCCAGGAGAGCTA5’
Erythropoietin (Epo)
Forward 5’CCTCCCAGTCCTCTGTGCT3’ 444
Reverse 3’CGGAAGAGCTTGCAGAAAGT5’
Interferon-gamma receptor (IFN-γR)
Forward 5’GTTAAAGCCAGGGTTGGACA3’ 395
Reverse 3’CATCTCGGCATACAGCAAATTCTTGT5’
Raf-1
Forward 5’CCAGAGTGCTGTGCAGTGTT3’ 448
Reverse 3’TGTTGAAAGTGAAGGCATGG5’
Erk-1
Forward 5’GCACGACCACACTGGCTTTC3’ 512
Reverse 3’GATCAACTCCTTCAGCCGCTC5’

73
GAPDH (Glyceraldehyde 3 phosphate
dehydrogenase)
Forward 5’TGCTGGCGCTGAGTACGTCGT3’ 557
Reverse 3’GTGGAGGAGTGGGTGTCGCTG5’
Amplification of cDNA by RT-PCR for the analysis of the expression of genes
during the progression of leukemia:
Reagents Quantity per sample
---------------------------------------------------------------------------
10X PCR buffer 2.0 µL
25mM MgCl2 0.4 µL
10mM dNTPs 0.4 µL
Primer (forward and reverse) 2.0+2.0 µL
Taq DNA polymerase 0.1µL
Molecular biology grade water 11.1 µL
---------------------------------------------------------------------------
Total 18µL
The contents were vortexed and centrifuged and 2µL of the cDNA
was added. (The cDNA was diluted 1:1 and from the diluted cDNA
preparation 2µL was taken for the RT-PCR analysis).
The following PCR reaction profile was followed in the minicycler
940C - 2min
940C - 1min
550C - 1min 39 cycles
720C - 1min
720C - 10min
100C - Hold for 10min

74
8µL of the amplified sample was subject to electrophoresis in an
agarose gel (1.5%) containing 0.5µg/mL ethidium bromide at 70v for 2 hrs
in TE buffer (10mM Tris HCl and 1mM EDTA, pH 10.0).
4.3. RESULTS
The injection of FMuLv to new- born BALB/c mice did not produce any
initial mortality. By the 120th day after viral inoculation 9 out of the 10
animals in the control group were died. The administration of P.amarus,
Berberine, Curcumin and Picroliv significantly enhanced the life span of
erythroleukemia harboring animals. The survival rate of leukemia bearing
animals treated with P.amarus, Berberine, Curcumin and Picroliv were given
in Table 4.1. The control animals showed the symptoms of anemia starting
from 30th day after the FMuLv injection. There was a decrease in the body
weight of all the animals injected with FMuLv when compared to the normal
animals. The changes in body weight at different time intervals were given
in Table 4.2. On day 30, the control animals recorded a body weight 13.39
± 1.86 g while normal animals had a body weight of 22.64 ± 2.01 g. The
treatment of compounds increased the body weight in all the groups with
respect to the control group. The hemoglobin content also showed a
decreased value indicating the persistence of anemia in FMuLv treated
animals. The control animals had a very low level of Hb which was 8.11 ±
1.07 g/dL on day 90. The Hb value below 7 is regarded as anemic condition.
The treatment of compounds has been shown to increase the Hb levels. Out
of the different concentrations of compounds studied here Curcumin at dose
of 100 mg/Kg b. wt elevated the Hb levels to 18.07 ± 1.90 g/dL which was
very close to the normal range (22.10 ± 0.83). The Hb levels of other
groups were shown in Table 4.3. The RBC count showed a slight decrease in
control animals. The results of the RBC count and WBC count were shown in
Table 4.3. The slides prepared from all the animals after PAS staining
showed typical leukemic cells in red colour. The positive PAS staining
confirmed the induction of leukemia by FMuLv. However the treatment
P.amarus, Berberine, Curcumin and Picroliv was effective in decreasing the
number of PAS stain positive cells when compared to the control animals.
75
A picture of PAS stain positive blood smear is given in Figure 4.1a-c. The
blood smears also showed RBCs with deficiency in the hemoglobin content.
This was mainly because of the anemic condition induced by the FMuLv.
The serum uric acid levels increased in all the leukemia bearing
animals. In control groups it was elevated to 11.68 ± 1.47 mg/dL where as
the normal levels of uric acid in serum was 2.94 ± 0.82. The treatment of
P.amarus, Berberine, Curcumin and Picroliv was found to decrease the
elevated uric acid levels. The results were given in Table 4.4.
The animals were sacrificed on 90th day. Gross necropsy was
performed. The necropsy of the control animal was shown in Figure 4.1d.
The spleen of the control animals showed massive enlargement in size and
shape. The average weight of the spleen was 1.98 ± 0.12 where as that of
the normal mice was 0.30 ± 0.002. The treatment with P.amarus, Berberine,
Curcumin and Picroliv was found to decrease the spleen weight as described
in Table 4.4. The morphology of the control spleen and spleen treated with
these compounds were given in Figure 4.1e-i.
Histopathological analysis of the liver showed normal architecture in all
the groups. The portal areas, sinusoidal spaces, Kupffer cells and central
venous system appeared normal. The spleen from the control animals
showed hyperplastic lymphoid follicles. Subcapsular sinus and sinusoidal
spaces were filled with pleomorphic round or oval cells having the features
of blast cells. Many degenerating cells and mitotic cells were also present.
Focal areas of hemorrhage and necrosis were present. The sections showed
massive leukemic cell infiltration to sinusoidal spaces. The treated groups
also showed similar histopathological architecture. But when compared with
control group these pathological changes were of little extent. The numbers
of infiltrating leukemic cells into the sinusoidal space were less in number.
The number of mitotic cells was low. It could be concluded that the
compounds were more effective in decreasing the progression of leukemia.
The micrographs of the sections were shown in Figure 4.2.
The results of gene expression analysis were as follows.

76
The antiapoptotic gene Bcl-2 was over expressed in control groups and
none of the treated group showed any expression indicating that all the
compounds inhibited the expression of Bcl-2. Lane 1 represents molecular
weight marker. Lane 2 represents a band corresponding to 235 base pairs
indicated expression of Bcl-2 in the control sample. No expression of Bcl-2
was seen any of the treated groups (lane 3-6). The lane 7 represents
GAPDH and lane 8 represents the positive control of Bcl-2 (Figure 4.3a).
The tumor suppressor gene p53 was completely lost in the control
groups (lane 2). The entire treated group showed the expression of p53 and
rate of expression varies between the groups as seen from the bands with
different intensities (lane 4-7) (Figure 4.3b).
The expression of erythropoietin, a hematopoietic cytokine which
regulate erythrocyte production was found to be expressed in all the groups
and more expression was found in the control group. The compounds were
not effective in completely suppressing the expression of erythropoietin
(Figure 4.3c).
p45NFE2, a negative regulator of erythroid differentiation shows a
complete loss in control group. In Curcumin, Berberine and Picroliv treated
group no expression of p45NFE2 was observed. But in P.amarus 750 mg/kg b.
wt treated group p45NFE2 was expressed as seen from a band with a light
intensity (lane 6) (Figure 4.3d).
Raf-1 and Erk-1 was present in all the groups but the rate of
expression was high in control groups.Raf-1/ERK-1 pathway play an active
role in the FMuLv induced transformation. The treated groups showed an
expression of various intensities (Figure 4.4a-b).
The interferon gamma receptor expression, which is essential for the
binding of interferon and interferon mediated signaling was high in control
groups. But the expression in treated group was low as compared to the
control groups (Figure 4.4c).
4.4. DISCUSSION
Perhaps one of the best animal tumor models to study the multi-stage
nature of cancer is Friend virus induced erythroleukemia. The

77
erythroleukemia falls under the category of acute myeloid leukemia (AML).
According to French-American-British (FAB) system of AML is classified as
M1-M6 and erythroleukemia is M6 subtype. The induction and progression
of erythroleukemias by Friend virus are mainly due to the ability of
proviruses to activate the cellular proto-oncogenes or inactivate the tumor
suppressor genes. In the present study we found that all the four
compounds tested in the study were able to inhibit the progression of the
leukemia. All the animals were developed the leukemia and the treatment
of these compounds increased the life span of leukemia harboring animals.
There was reduction in the anemic condition in these treated groups. All the
animals in the control group died by 120th day where as in treated groups
the percentages of survival were high.
The elevated uric acid level in control group was mainly because of the
increased purine metabolism in leukemic condition. Histopathological
analysis of the spleen revealed that all the animals had developed the
leukemia, but in treated group induction was rather low.
The gene expression analysis supports the inhibition of
erythroleukemia by P.amarus, Berberine, Curcumin and Picroliv. Molecular
analysis has shown that p53 mutations are an important event responsible
for the immortalization of FMuLv induced erythroleukemia. Studies have
shown that germ line deficiency in p53 accelerates the growth and survival
rate of transformed erythroleukemia cells in culture (Wong et al, 1999). In
the present study there was a complete loss of p53 in control group where
as in treated group showed the expression of p53.
Up-regulation of antiapoptotic gene, Bcl-2 was observed in most of the
FMuLv induced erythroleukemias. In the present investigation we found that
the expression of Bcl-2 was down regulated in all the treated group. It was
reported that Bcl-2 over expression was occurred during the progression
stage of erythroleukemia. So it could be concluded that P.amarus, Berberine,
Curcumin and Picroliv may acts in the progression stage of leukemia
progression.

78
The expression of p45NFE2 is tissue specific and restricted to
erythrocytes, mast cells and megakaryocytes. P45NFE2 which is a negative
regulator of erythroid proliferation is generally lost during the progression of
erythroleukemia. In the present study there was a complete loss of
expression of p45NFE2 was observed in all the groups with the exception of
P.amarus treated group. The treatment of P.amarus has been shown to
induce the expression of p45NFE2. So it can be presumed that by inducing
the expression of p45NFE2, a negative regulator of erythroid proliferation,
P.amarus inhibited the induction of leukemia.
The binding of Epo to its receptor (EpoR), a member of the cytokine
receptor superfamily, initiates a signal cascade which includes
phosphorylation of EpoR, activation of JAK2 and STAT5, activation of PI3
kinase, and activation of the ras/raf/MAPK pathways (Erickson-miller et al,
2000). The expression of erythropoietin (Epo) in large majority of FMuLv
induced erythroleukemic cell lines establishes an autocrine loop resulting
constitutive activation of a signal transduction cascade mediated by Epo
receptor which confers a selective growth advantage to these
erythroleukemic cells both in vitro as well as in vivo (Howard et al, 1996;
Lee et al, 2003). In the present investigation the Epo expression was
observed in all the groups. But the intensity of band was high in control
group as compared to the treated groups. None of the compounds were
found to be effective for completely inhibiting the expression of Epo gene.
The binding of Epo to its receptor has been shown to induce the
expression of Raf-1/MAPK pathway. Raf-1/MAPK pathway can transduce
signals from cell surface to the nucleus. The FMuLv has been shown to
induce constitutive induction of this pathway. In the present study all the
groups showed the expression of Raf-1 with highest expression being in the
control group. When the band intensities were compared, Curcumin at a
concentration of 100 mg/kg b.wt was found to suppress the expression of
Raf-1 to a greater extent.
Similar type of results was observed with the expression of Erk-1. The
signaling cascade involving the Raf, MEK (mitogen-activated protein (MAP)

79
or extracellular signal regulated (ERK) kinase) and ERK families of kinases
is among the best characterized pathways downstream of Ras. This
signaling module couples receptor-mediated activation of Ras to
cytoplasmic and nuclear events, leading to phosphorylation of key structural
and regulatory components (Berman and Cobb, 2001; Chang and Karin,
2001; Yoon and Seger, 2006). Moreover in human leukemia samples, both
MEKs and ERKs are often hyperphosphorylated and activated, suggesting a
causal relationship between stimulation of the Ras-ERK pathway and
tumorogenesis (Milella et al, 2003). The Erk-1 which is also known as
MAPK-3 is over expressed in Friend leukemia. Though the expression was
found in all the groups the intensity of the expression varies and treatment
with these compounds were found to suppress the expression of Erk-1.
There have been several reports on the activation of Erk-2 or MAPK-1 in
Friend virus induced erythroleukemia.
The IFN-γR was expressed in all the group with highest expression in
the control group. The infection with virus results in IFN production and
action of IFN was mediated via its receptor. It can be presumed that the
over expression of IFN-γR in control groups may be due to increased viral
load in these animals.
The study clearly showed that all the compounds were effective in the
inhibition of progression of FMuLv induced leukemia.
Figure 4.1: PAS staining blood smear, necropsy of leukemia
harboring animals, morphology of the spleen
(a) PAS staining of blood smear from normal mice (without any
treatment)
(b) PAS stain positive leukemic blood smear
(c) PAS stain positive leukemic blood smear with blue nuclei
(d) Necropsy of erythroleukemia harboring animal (at day 90)
(e) Comparative morphological picture of the spleen from a leukemic
and normal animal
(f) Spleen of P.amarus treated group
(g) Spleen of Curcumin treated group
(h) Spleen of Picroliv treated group
(i) Spleen of Berberine treated group


Figure 4.2: Histopathology of the spleen at day 90 after viral
inoculation:
(a) Control group (virus alone)
(b) Treated with P.amarus 750mg/Kg B.wt
(c) Treated with Curcumin 100mg/Kg B.wt
(d) Treated with Picroliv 50mg/Kg B.wt
(e) Treated with Berberine 5mg/Kg B.wt
(f) Normal group (without any treatment)


Figure 4.3: Expression of genes during the progression of
leukemia:
(a) Expression of Bcl-2
Lane 1: Molecular weight marker (100bp)
Lane 2: Control with Bcl-2 expression (235bp)
Lane 3: Treated with P.amarus 750mg/Kg B.wt
Lane 4: Treated with Curcumin 100mg/Kg B.wt
Lane 5: Treated with Picroliv 50mg/Kg B.wt
Lane 6: Treated with Berberine 5mg/Kg B.wt
Lane 7: GAPDH (557bp)
Lane 8: Positive control for Bcl-2 (235bp)
(b) Expression of p53
Lane 1: Molecular weight marker (100bp)
Lane 2: Control without p53 expression
Lane 3: Treated with P.amarus 750mg/Kg B.wt (205bp)
Lane 4: Treated with Curcumin 100mg/Kg B.wt (205bp)
Lane 5: Treated with Picroliv 50mg/Kg B.wt (205bp)
Lane 6: Treated with Berberine 5mg/Kg B.wt (205bp)
Lane 7: GAPDH (557bp)
Lane 8: Positive control for p53 (205bp)
(c) Expression of erythropoietin (Epo)
Lane 1: Molecular weight marker (100bp)
Lane 2: Control with Epo expression (4448bp)
Lane 3: Treated with P.amarus 750mg/Kg B.wt (444bp)
Lane 4: Treated with Curcumin 100mg/Kg B.wt (444bp)
Lane 5: Treated with Picroliv 50mg/Kg B.wt (444bp)
Lane 6: Treated with Berberine 5mg/Kg B.wt (444bp)
Lane 7: GAPDH (557bp)
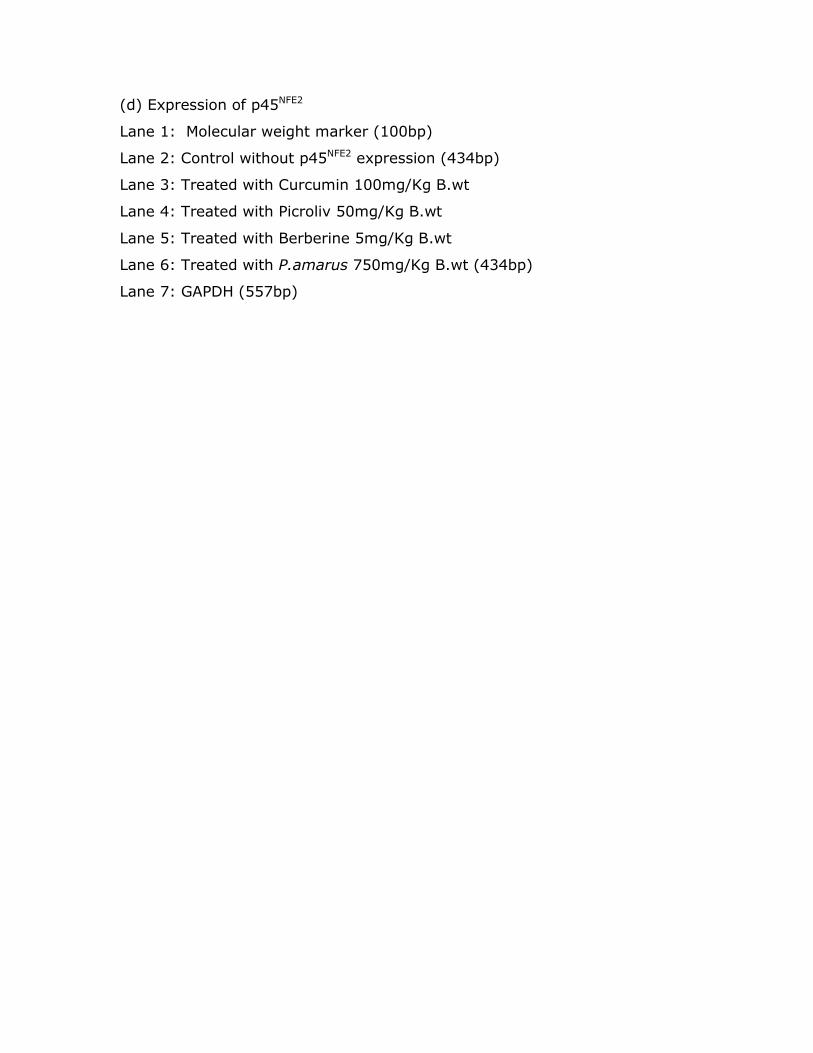
(d) Expression of p45NFE2
Lane 1: Molecular weight marker (100bp)
Lane 2: Control without p45NFE2 expression (434bp)
Lane 3: Treated with Curcumin 100mg/Kg B.wt
Lane 4: Treated with Picroliv 50mg/Kg B.wt
Lane 5: Treated with Berberine 5mg/Kg B.wt
Lane 6: Treated with P.amarus 750mg/Kg B.wt (434bp)
Lane 7: GAPDH (557bp)

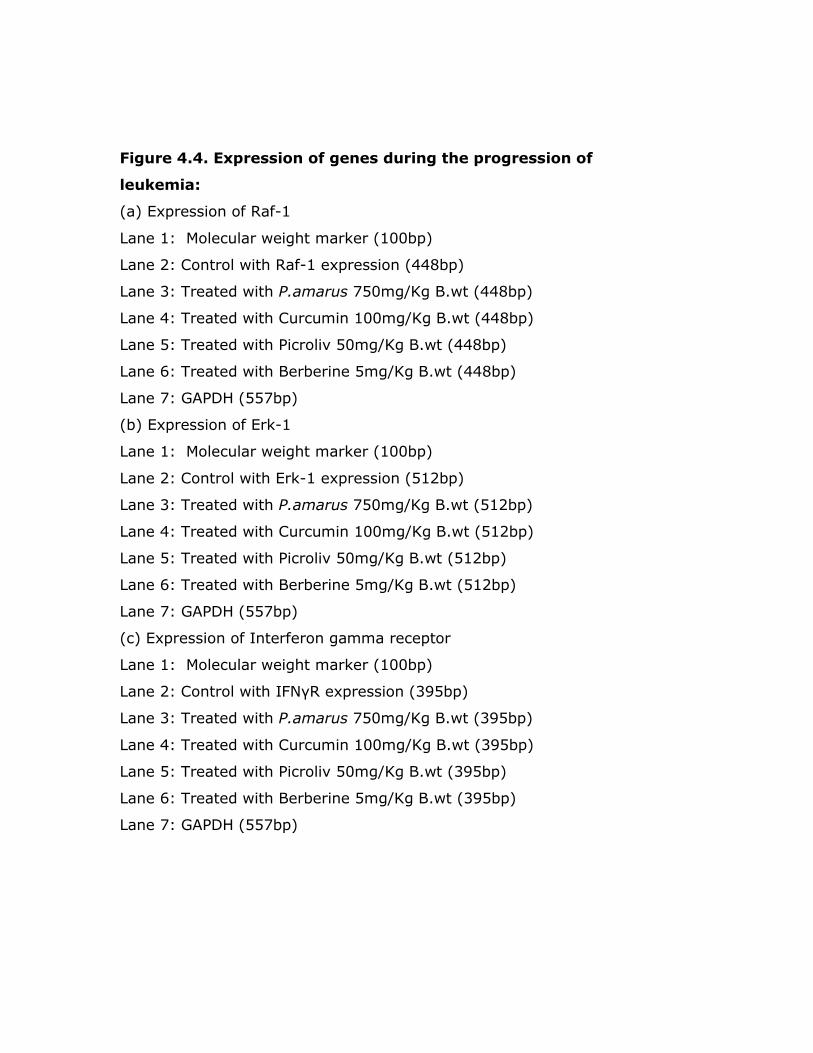
Figure 4.4. Expression of genes during the progression of
leukemia:
(a) Expression of Raf-1
Lane 1: Molecular weight marker (100bp)
Lane 2: Control with Raf-1 expression (448bp)
Lane 3: Treated with P.amarus 750mg/Kg B.wt (448bp)
Lane 4: Treated with Curcumin 100mg/Kg B.wt (448bp)
Lane 5: Treated with Picroliv 50mg/Kg B.wt (448bp)
Lane 6: Treated with Berberine 5mg/Kg B.wt (448bp)
Lane 7: GAPDH (557bp)
(b) Expression of Erk-1
Lane 1: Molecular weight marker (100bp)
Lane 2: Control with Erk-1 expression (512bp)
Lane 3: Treated with P.amarus 750mg/Kg B.wt (512bp)
Lane 4: Treated with Curcumin 100mg/Kg B.wt (512bp)
Lane 5: Treated with Picroliv 50mg/Kg B.wt (512bp)
Lane 6: Treated with Berberine 5mg/Kg B.wt (512bp)
Lane 7: GAPDH (557bp)
(c) Expression of Interferon gamma receptor
Lane 1: Molecular weight marker (100bp)
Lane 2: Control with IFNγR expression (395bp)
Lane 3: Treated with P.amarus 750mg/Kg B.wt (395bp)
Lane 4: Treated with Curcumin 100mg/Kg B.wt (395bp)
Lane 5: Treated with Picroliv 50mg/Kg B.wt (395bp)
Lane 6: Treated with Berberine 5mg/Kg B.wt (395bp)
Lane 7: GAPDH (557bp)

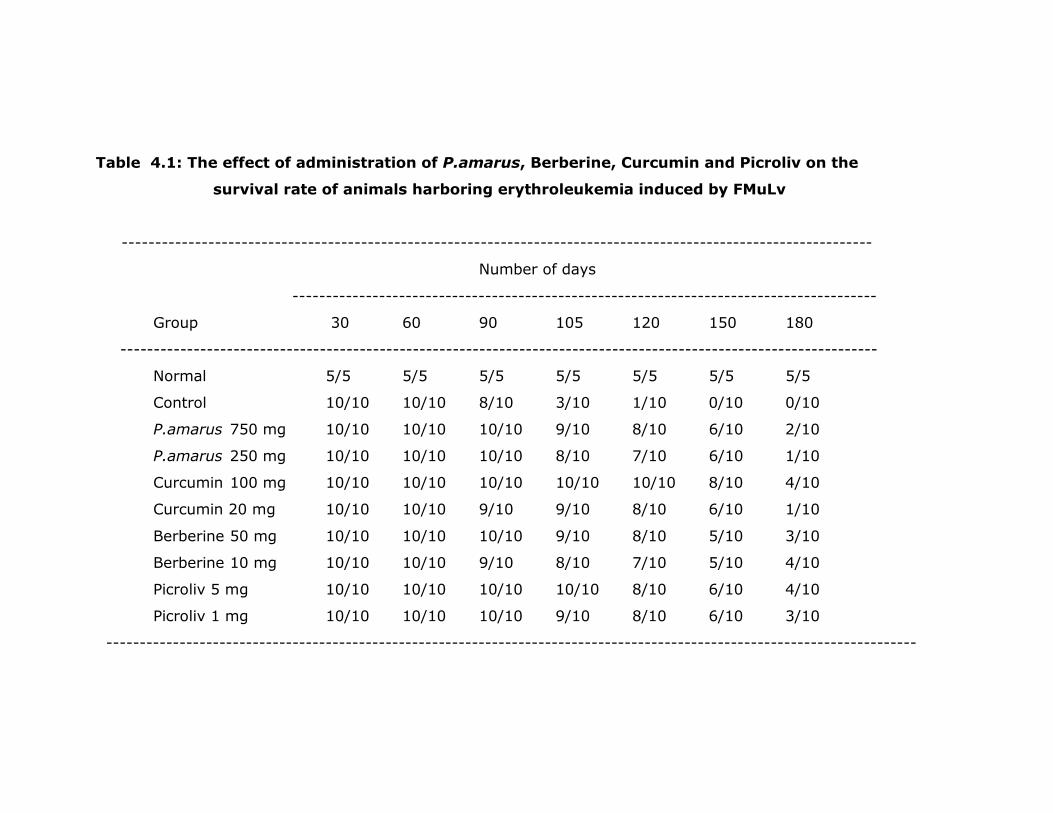
Table 4.1: The effect of administration of P.amarus, Berberine, Curcumin and Picroliv on the
survival rate of animals harboring erythroleukemia induced by FMuLv
-----------------------------------------------------------------------------------------------------------------
Number of days
----------------------------------------------------------------------------------------
Group 30 60 90 105 120 150 180
------------------------------------------------------------------------------------------------------------------
Normal 5/5 5/5 5/5 5/5 5/5 5/5 5/5
Control 10/10 10/10 8/10 3/10 1/10 0/10 0/10
P.amarus 750 mg 10/10 10/10 10/10 9/10 8/10 6/10 2/10
P.amarus 250 mg 10/10 10/10 10/10 8/10 7/10 6/10 1/10
Curcumin 100 mg 10/10 10/10 10/10 10/10 10/10 8/10 4/10
Curcumin 20 mg 10/10 10/10 9/10 9/10 8/10 6/10 1/10
Berberine 50 mg 10/10 10/10 10/10 9/10 8/10 5/10 3/10
Berberine 10 mg 10/10 10/10 9/10 8/10 7/10 5/10 4/10
Picroliv 5 mg 10/10 10/10 10/10 10/10 8/10 6/10 4/10
Picroliv 1 mg 10/10 10/10 10/10 9/10 8/10 6/10 3/10
--------------------------------------------------------------------------------------------------------------------------

Table 4.2: The effect of administration of P.amarus, Berberine, Curcumin and Picroliv on the body
weight of animals harboring erythroleukemia induced by FMuLv
-----------------------------------------------------------------------------------------------------------------------
Days
--------------------------------------------------------------------------------------------
Group 30 60 90 120 150
----------------------------------------------------------------------------------------------------------------------
Normal 22.64 ± 2.01 28.38 ± 0.76 34.56 ± 1.25 37.70 ± 1.48 41.68 ±1.54
Control 13.39 ± 1.86a 16.72 ± 1.81
c 20.16 ± 1.81
c ---- ----
P.amarus 750 mg 17.81 ± 2.35b 19.47 ± 2.57 22.76 ± 2.14 26.06 ± 1.86 29.87 ± 1.98
P.amarus 250 mg 15.98 ± 2.70a 17.96 ± 3.13 20.15 ± 3.53 22.14 ± 3.48 24.83 ± 3.15
Curcumin 100 mg 17.30 ± 2.64b 20.31 ± 3.01
b 23.44 ± 3.02
b 25.94 ± 2.79 28.66 ± 2.65
Curcumin 20 mg 17.76 ± 1.98b 19.02 ± 2.42 21.36 ± 2.63
a 23.38 ± 2.48 26.59 ± 2.18
Berberine 5 mg 17.57 ± 1.44b 20.02 ± 1.59
a 23.83 ± 2.05
b 26.57 ± 2.19 29.58 ± 2.06
Berberine 1 mg 18.88 ± 1.97b 22.02 ± 2.47
b 23.83 ± 2.05
b 26.57 ± 2.19 29.58 ± 2.06
Picroliv 50 mg 15.39 ± 1.88c 18.08 ± 1.73 20.94 ± 1.89 24.10 ± 2.32 27.38 ± 2.05
Picroliv 10 mg 16.12 ± 2.21b 18.64 ± 2.33 21.11 ± 2.50
a 23.60 ± 2.92 25.90 ± 2.66
----------------------------------------------------------------------------------------------------------------------
Values are expressed as mean ± S.D. a= * p<0.05, b= ** p<0.01, c=***p<0.001

Table 4.3: The effect of administration of P.amarus, Berberine, Curcumin and Picroliv on the Hemoglobin
content, RBC count and total WBC count of animals harboring erythroleukemia induced by FMuLv
(on day 90)
--------------------------------------------------------------------------------------------------------------------
Group Hb level (g/dL) RBC count (x106/µL) WBC count (mm3)
--------------------------------------------------------------------------------------------------------------------
Normal 22.10 ± 0.83 5.02 ± 0.59 9600 ± 234
Control 8.11 ± 1.07*** 3.01 ± 0.54*** 11380 ± 321
P.amarus 750 mg 15.57 ± 1.12*** 3.98 ± 0.87 8900 ± 223
P.amarus 250 mg 15.06 ± 1.30*** 3.65 ± 0.43 9360 ± 225
Curcumin 100 mg 18.07 ± 1.90*** 4.13 ± 0.98 9500 ± 298
Curcumin 20 mg 16.18 ± 1.92*** 3.98 ± 0.67 9700 ± 307
Berberine 5 mg 13.29 ± 1.50*** 3.55 ± 0.32 8300 ± 228
Berberine 1 mg 12.86 ± 2.14*** 3.54 ± 0.56 8600 ± 178
Picroliv 50 mg 14.31 ± 2.24*** 3.87 ± 0.87 9100 ± 275
Picroliv 10 mg 13.22 ± 2.62*** 3.93 ± 0.60 9150 ± 248
-------------------------------------------------------------------------------------------------------------------
Values are expressed as mean ± S.D. ***p<0.001 (ANOVA followed by Dunnet’s test)

Table 4.4: The effect of administration of P.amarus, Berberine, Curcumin and Picroliv
on the spleen weight of animals harboring erythroleukemia induced by FMuLv
-------------------------------------------------------------------------------------------------------------------
Group Spleen weight (in g) Serum uric acid levels (mg/dL)
(on day 90) (on day 90)
--------------------------------------------------------------------------------------------------------------------
Normal 0.30 ± 0.002 2.94 ± 0.82
Control 1.98 ± 0.120*** 11.68 ± 1.47***
P.amarus 750 mg 0.54 ± 0.008*** 5.87 ± 1.05***
P.amarus 250 mg 0.55 ± 0.004*** 5.88 ± 0.98***
Curcumin 100 mg 0.49 ± 0.003*** 4.18 ± 1.10***
Curcumin 20 mg 0.50 ± 0.007*** 4.34 ± 0.67***
Berberine 5 mg 0.68 ± 0.004*** 6.01 ± 1.38***
Berberine 1 mg 0.72 ± 0.009*** 6.32 ± 1.65***
Picroliv 50 mg 0.59 ± 0.006*** 5.21 ± 0.78***
Picroliv 10 mg 0.62 ± 0.007*** 5.28 ± 1.12***
-----------------------------------------------------------------------------------------------------------------------
Values are expressed as mean ± S.D. ***p<0.001 (ANOVA followed by Dunnet’s test)