metformin-induced inhibition of mtor and ras · metformin-induced inhibition of mtor and ras 3...
TRANSCRIPT
Metformin-induced inhibition of mTOR and RAS
1
Mechanism of Metformin-dependent Inhibition of mTOR
and Ras Activity in Pancreatic Cancer: Role of Sp Transcription Factors
Vijayalekshmi Nair1, Sandeep Sreevalsan
1, Riyaz Basha
2,3, Maen Abdelrahim
2,3, Ala Abudayyeh
4,
Aline Rodrigues Hoffman5 and Stephen Safe
1,6
1
Department of Veterinary Physiology and Pharmacology, 4466 TAMU, Texas A&M University,
College Station, TX 77843
2
Cancer Research Institute, M.D. Anderson Cancer Center-Orlando, 110 Bonnie Loch Ct., Orlando, FL
32806
3 Baylor College of Medicine, One Baylor Plaza, Houston, TX 77030
4
Department of Emergency Medicine, M.D. Anderson Cancer Center, 1400 Pressler St., Unit # 1465,
Houston, TX 77030 5 Department of Veterinary Pathobiology, 4467 TAMU, Texas A&M University, College Station, TX
77843 6
Institute of Biosciences and Technology, 2121 W. Holcombe Blvd., Texas A&M Health Sciences
Center, Houston, TX 77030
Running Title: Metformin-induced inhibition of mTOR and RAS
Corresponding Author: Stephen Safe, Department of Veterinary Physiology and Pharmacology, Texas A & M University, 4466 TAMU, College Station, TX 77843-4466 USA, Tel 979-845-5988/ Fax: 979-
862-4929, Email: [email protected]
Keywords: Metformin, Sp transcription factors, IGFR downregulation, mTOR downregulation, Ras
inhibition
CAPSULE Background: Metformin inhibits pancreatic
cancer cell and tumor growth and downregulated Sp transcription factors.
Results: Inhibition of mTOR and Ras signaling
by metformin is due to decreased expression of Sp-regulated insulin-like growth factor-1 receptor
(IGF-1R) and epidermal growth factor receptor
(EGFR), respectively.
Conclusions: Metformin-induced downregulation of Sp proteins affects multiple pro-oncogenic
pathways.
Significance: These results identify important metformin-induced anticancer activities.
ABSTRACT
The antidiabetic drug metformin exhibits
both chemopreventive and chemotherapeutic
activity for multiple cancers including
pancreatic cancer; however, the underlying
mechanism of action of metformin is unclear.
A recent study showed that metformin
downregulated specificity protein (Sp)
transcription factors (TFs) Sp1, Sp3 and Sp4 in
pancreatic cancer cells and tumors and this was
accompanied by downregulation of several pro-
oncogenic Sp-regulated genes. Treatment with
metformin or downregulation of Sp TFs by
RNAi also inhibits two major pro-oncogenic
pathways in pancreatic cancer cells, namely
mTOR signaling and epidermal growth factor
(EGFR)-dependent activation of Ras.
Metformin and Sp knockdown by RNAi
decreased expression of the insulin-like growth
Metformin-induced inhibition of mTOR and RAS
2
factor-1 receptor (IGF-1R) resulting in
inhibition of mTOR signaling. Ras activity was
also decreased by metformin and Sp
knockdown of EGFR, another Sp-regulated
gene. Thus, the antineoplastic activities of
metformin in pancreatic cancer are due, in
part, to downregulation of Sp TFs and Sp-
regulated IGF-1R and EGFR which in turn
result in inhibition of mTOR and Ras signaling,
respectively.
INTRODUCTION The anti-diabetic drug metformin has been
successfully used for treatment of type II diabetes
and there is increasing evidence that metformin is an anticancer agent that exhibits both
chemopreventive and chemotherapeutic activities
(1-4). It has been shown that cancer rates in diabetics using metformin are lower than in
patients using other insulin sensitizing agents (2,5-
12). In one report, the overall survival of type II diabetic patients with colorectal cancer was 76.9
months for individuals treated with metformin
compared to 56.9 months for those receiving other
diabetic medications and this represented a 30% improvement in overall survival (6). A comparable
study in pancreatic cancer patients showed that
diabetics using metformin had a 32% lower risk of death and longer overall survival than diabetics
using other drugs (10). This latter paper
recommended using metformin as a supplemental
therapy for treatment of pancreatic cancer patients (10).
The potential clinical applications for
metformin in cancer chemotherapy also stems from reports on the anticancer activities of this
drug in cancer cells in culture and in in vivo
models (1-4,13-28). Metformin inhibits growth and induces apoptosis and other antineoplastic
responses in multiple cancer cell lines and this is
accompanied by modulation of different pathways
and genes. Several studies demonstrate that
metformin activates AMPK which results in the inhibition of the mTOR signaling pathway and
downstream effects (15-20,22-25) and this
compliments one of the proposed mechanisms of
action of metformin as an antidiabetic drug (29,30).
Studies in this laboratory reported a novel
mechanism of action for metformin in pancreatic
cancer cells. This involved downregulation of
specificity protein (Sp) transcription factors Sp1, Sp3 and Sp4 and pro-oncogenic Sp-regulated
genes such as bcl2, fatty acid synthase (FAS),
survivin, vascular endothelial growth factor
(VEGF) and VEGF receptor 1 (VEGFR1) (31). The anticancer activities of metformin are also
similar to that observed after knockdown of Sp1 or
all three Sp proteins by RNA interference in cancer cells and this includes growth inhibition,
induction of apoptosis, reversal of epithelial to
mesenchyumal transition (EMT) and decreased migration/ invasion (32-36). Metformin also
inhibits NFB, decreases cyclin D1 and ErbB2 in cancer cell lines (13,20,27,28), and these gene
products are also decreased after Sp1, Sp3 and Sp4
silencing by RNAi or by other drugs that downregulate Sp proteins (32-36). However, the
relationship between metformin-induced
downregulation of Sp1, Sp3 and Sp4 and
modulation of mTOR signaling has not been reported, except that total mTOR protein
expression was unaffected by silencing of Sp
transcription factors in pancreatic cancer cells (31).
Results of this study demonstrate novel
findings indicating that metformin-induced antineoplastic activities are primarily due to
downregulation of Sp1, Sp3 and Sp4 transcription
factors (TFs) in pancreatic cancer cells. Firstly,
treatment with metformin or silencing Sp transcription factors by RNAi downregulated
insulin-like growth factor-1 receptor (IGF-1R)
which in turn inhibited activation of mTOR. Secondly, treatment with metformin or silencing
Sp transcription factors by RNAi decreased
epidermal growth factor receptor (EGFR) expression resulting in inhibition of Ras activity
which is regulated by EGFR in pancreatic cancer
cells (37,38). Thus, we know show for the first
time that metformin-dependent inhibition of both mTOR signaling and Ras activity is due to
downregulation of Sp transcription factors in
pancreatic cancer.
EXPERIMENTAL PROCEDURES
Cell lines, antibodies, and reagents ─ Human Panc1 pancreatic cancer cells were purchased from
American Type Culture Collection (Manassas,
VA). Panc28 and L3.6pL pancreatic cancer cells
Metformin-induced inhibition of mTOR and RAS
3
which express Ras mutation were provided by The
University of Texas M.D. Anderson Cancer Center. All three cell lines were maintained in
DMEM/F-12 (Sigma, St. Louis, MO)
supplemented with 0.22% sodium bicarbonate,
0.022% bovine serum albumin, 5% fetal bovine serum, and 10 ml/l of 100X antibiotic, antimycotic
solution (Sigma) at 37C in the presence of 5% CO2. Sp1 antibody was purchased from Millipore
(Temecula, CA); Sp3 and Sp4 antibodies were purchased from Santa Cruz Biotech (Santa Cruz,
CA). Fatty acid synthase (FAS), Ras, p-mTOR,
mTOR, p4EBP, 4EBP, S6 ribosomal protein and
phospho S6 ribosomal protein were purchased from (Cell Signalling Technology, Danvers, MA).
Metformin was purchased from Calbiochem
(EMD Millipore, Billerica, MA). Chemiluminescence reagents (Immobilon
Western) for western blot imaging were purchased
from Millipore (Billerica, MA). Active Ras
detection assay kit was purchased from (Cell Signaling Technology, MA). Nuclear and
cytoplasmic extraction kit was purchased from
(Thermo Scientific, Pittsburgh, PA). Cell proliferation assay ─ Panc28 and L3.6pL
pancreatic cancer cells (3 x 10⁴ per well) were
seeded in 12-well plates with 2.5% charcoal-
stripped FBS and allowed to attach for 24 hr and treated with different concentrations of NVP-
BEZ235, a Dual PI3K/mTOR Inhibitor. Cells were
then trypsinized and counted after 24 and 48 hr using a Coulter Z1 cell counter. Each experiment
was determined in triplicate, and results are
expressed as mean SE for each set of experiments.
Nuclear and cytoplasmic extraction and western blot ─ Panc28 and L3.6pL cells (3 x 10
5)
per well were seeded in DMEM/ Ham's F-12
medium in six-well plates. After 24 hr, cells were
treated with different concentrations of metformin. Nuclear and cytoplasmic contents were extracted
using Nuclear and Cytoplasmic Extraction kit
(Thermo Scientific, Pittsburgh, PA) according to
manufacturer’s protocol. Cells were lysed using high-salt lysis buffer containing 50 mmol/l N-2-
hydroxyethylpiperazine-NꞋ-2-ethanesulfonic acid,
0.5 mol/l sodium chloride, 1.5 mmol/l magnesium chloride, 1 mmol/l ethyleneglycol-
bis(aminoethylether)-tetraacetic acid, 10%
(vol/vol) glycerol, 1% Triton X-100 and protease inhibitor cocktail, 1:1000 (Sigma). Lysates were
collected and vortexed every 15 min for 1 hr,
centrifuged at 20,000 x g for 10 min at 4C and quantified with Bradford reagent. Western blot
analysis was carried out by separating the proteins by sodium dodecyl sulphate-polyacrylamide gel
(SDS- PAGE) at 120V for 4 hr. Proteins were then
transferred onto polyvinylidene difluoride (PVDF) membranes (Biorad, Hercules, CA) by wet
electroblotting, and membranes were blocked with
5% milk in TBST buffer containing 1.576 g/l Tris, 8.776 g/l sodium chloride and 0.5 ml/l Tween 20.
The PVDF membranes were then probed with
primary antibodies, followed by incubation with
horseradish peroxidase-conjugated secondary antibodies. Immobilon western
chemiluminescence substrates (Millipore,
Billerica, MA) were used to develop the membrane and images were captured on a Kodak
4000 MM Pro image station.
siRNA interference assay ─ Panc28, Panc1
and L3.6pL pancreatic cancer cells were seeded (1 × 10
5 per well) in six-well plates in DMEM/Ham's
F-12 medium supplemented with 2.5% charcoal-
stripped FBS without antibiotic and left to attach
for 24 hr. Knockdown of Sp1, Sp3 and Sp4 along with iLamin as control was carried out using
Lipofectamine 2000 reagent according to the
manufacturer's instructions and as previously described (35). Small inhibitory RNAs were
prepared by (Sigma-Aldrich, St. Louis, MO).
Active Ras detection assay ─ Pancreatic
cancer cells (Panc28 and L3.6pL) (3 x 10⁵) per
well were seeded in Dulbecco’s modified Eagle’s
medium/Ham’s F-12 medium in six-well plates.
After 24 hr, cells were treated with or without metformin (15 mM) for 36 hr. Cells were
harvested under non-denaturing conditions and
rinsed with ice cold PBS. Cells were lysed using
lysis buffer. Affinity precipitation of active Ras was performed using active Ras detection assay kit
according to manufacturer’s protocol. Cell lysates
(500 g) were treated with GTP or GDP to activate or inactivate Ras which act as a positive
and negative control, respectively. The lysates were then incubated with GST-Raf1-RBD fusion
protein in glutathione resin. The eluted samples
were electrophoresed and immunoblotted using Ras mouse monoclonal antibody.
Orthotopic nude mice study and
immunohistochemical staining ─ Male athymic
nude mice (NCI-nu) (at least 4 per treatment

Metformin-induced inhibition of mTOR and RAS
4
group) were injected with suspensions of L3.6pL
cells consisting of single cells with >90% viability directly into the pancreas as previously described
(31,32). Mice were treated (orally) with vehicle
(control) or 250 mg/kg metformin daily and
sacrificed 4 - 5 weeks after injection and body weights were recorded. Primary tumors in the
pancreas were excised, measured and weighed.
For immunohistochemistry, tumor tissue specimens were fixed in 10% formaldehyde
embedded in paraffin and sectioned into 3 - 5 mm
thick slices. In this study, we used slides generated from orthotopic tumor model (31). Slides were
deparaffinized with xylene, dehydrated with
alcohol, and rinsed with distilled water. After
antigen retrieval, sections were incubated with following primary antibodies: anti-p-mTOR
antibody (1:500, Cell signaling, 2971), anti-IGF1R
antibody (1:100, Cell signaling, 3027), overnight
at 4C. Slides were then incubated with
horseradish peroxidase-conjugated secondary antibody (30 min) and large volume HRP polymer
(45 min) for sections incubated with p-mTOR and
IGF1R primary antibody, respectively. The substrate DAB was added followed by
hematoxylin counter-staining. After dehydration,
the slides were soaked in xylene for 3 - 5 min. Immunostaining of IGF1 receptor was carried out
using Lab vision autostainer (Thermo Scientific,
Pittsburgh, PA). Sections from normal pancreas
were used as positive control. The negative control sections were incubated with antibody dilution
buffer without primary antibody.
RESULTS
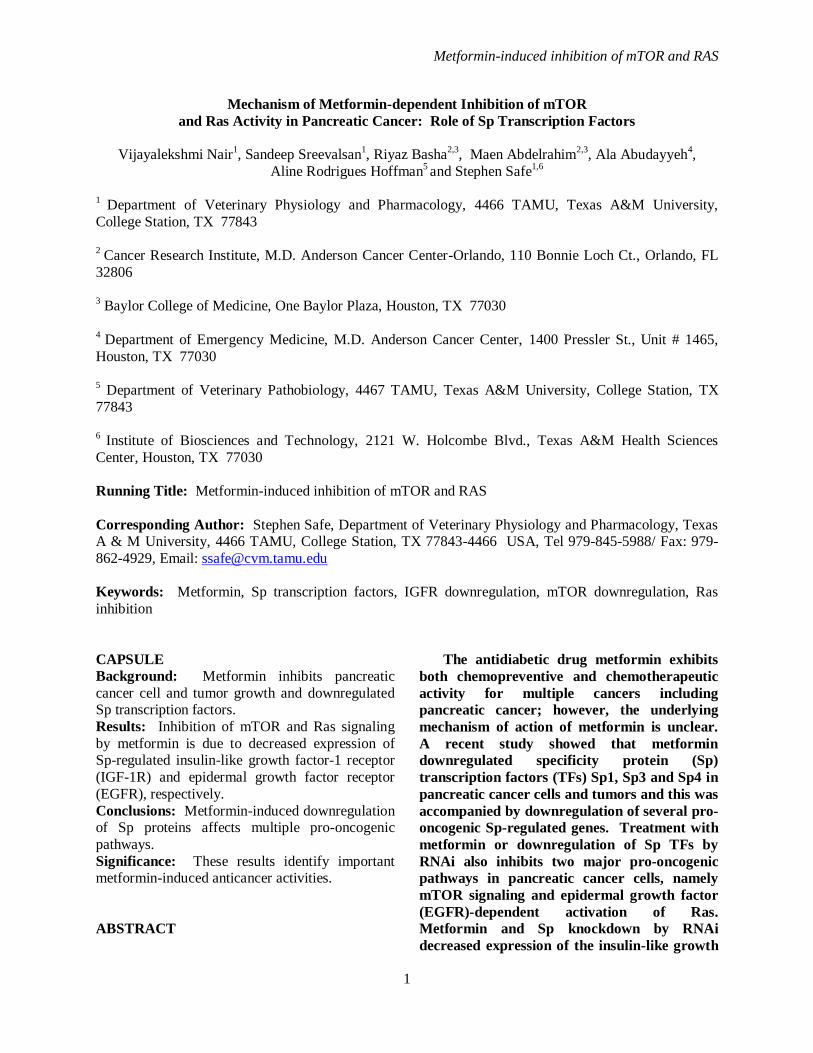
Metformin and Sp downregulation inhibit
mTOR signaling ─ Figure 1A shows that NVP-
BE235, an mTOR and PI3 kinase inhibitor, also decreases proliferation of Panc28 and L3.6pL
cells. Similar results were observed after
treatment with 15 mM metformin, and L3.6pL
cells were more sensitive than Panc28 cells to the growth inhibitory effects of both compounds.
Treatment of Panc28 and L3.6pL cells with 50 nM
NVP-BE235 decreased activation (phosphorylation) of both mTOR and AKT and 5 -
20 mM metformin also inhibited phosphorylation
of mTOR and AKT (Fig. 1B), demonstrating that like NVP-BE235, metformin blocks mTOR
signaling in pancreatic cancer cells. Similar results
were observed in Panc1 cells; however, in this cell
line metformin also decreased total mTOR and
Akt protein levels (Suppl. Fig. 1A). Immunostaining of pancreatic tumors and normal
pancreatic tissue from an orthotopic mouse model
using L3.6pL cells (31) also showed that the
enhanced staining of phospho-mTOR in tumors was decreased in pancreatic tumors from mice
treated with metformin (Fig. 1C). Moreover,
western blot analysis showed that phospho-AKT and phospho-mTOR decreased in tumors from
mice treated with metformin compared to vehicle
treated mice (Fig. 1D). The lack of a significant decrease in phospho-mTOR was due to a single
animal outlier.
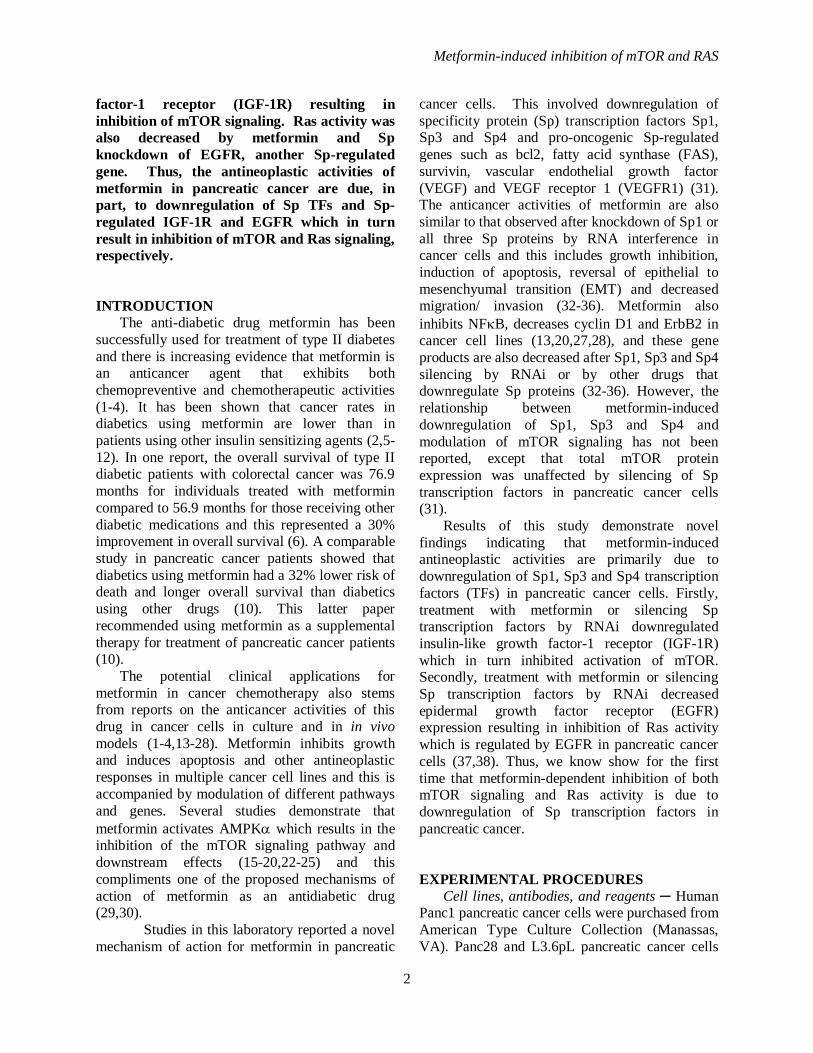
Knockdown of Sp transcription factors by
RNAi did not decrease expression of mTOR protein in pancreatic cancer cells (31); however,
there is evidence from RNAi studies that Sp TFs
regulate activation of kinases such as AKT (39) and, therefore, we further investigated the effects
of Sp silencing on inhibition of mTOR and
downstream kinases. Figure 2A shows that in Panc28 cells transfected with oligonucleotides
targeting Sp1 (iSp1), Sp3 (iSp3) and Sp4 (iSp4),
there was specific knockdown of the individual Sp
proteins as previously described (35) and this was accompanied by decreased expression of phospho-
mTOR and AKT but not total mTOR and AKT
proteins. A similar approach was used for L3.6pL cells (Fig. 2B) and silencing of Sp1, Sp3 and Sp4
also decreased phosphorylated mTOR and AKT
indicating that all three Sp transcription factors
regulated activation of both kinases. There was some variability in these responses and this was
due, in part, to the efficiency of Sp1, Sp3 and Sp4
knockdown. A comparison of the effects of metformin with Sp silencing showed that both
treatments decreased activation (phosphorylation)
of mTOR-regulated S6RP and 4EBP gene products in Panc28 (Fig. 2C), L3.6pL (Fig. 2D),
and Panc1 (Fig. 2E) cells. Metformin decreased
activation of mTOR and mTOR-regulated genes in
all 3 cell lines; however, there were some concentration-dependent differences in these
effects. These results suggest that metformin-
induced downregulation of Sp1, Sp3 and Sp4 plays a role in inhibiting activation of the mTOR
pathway.
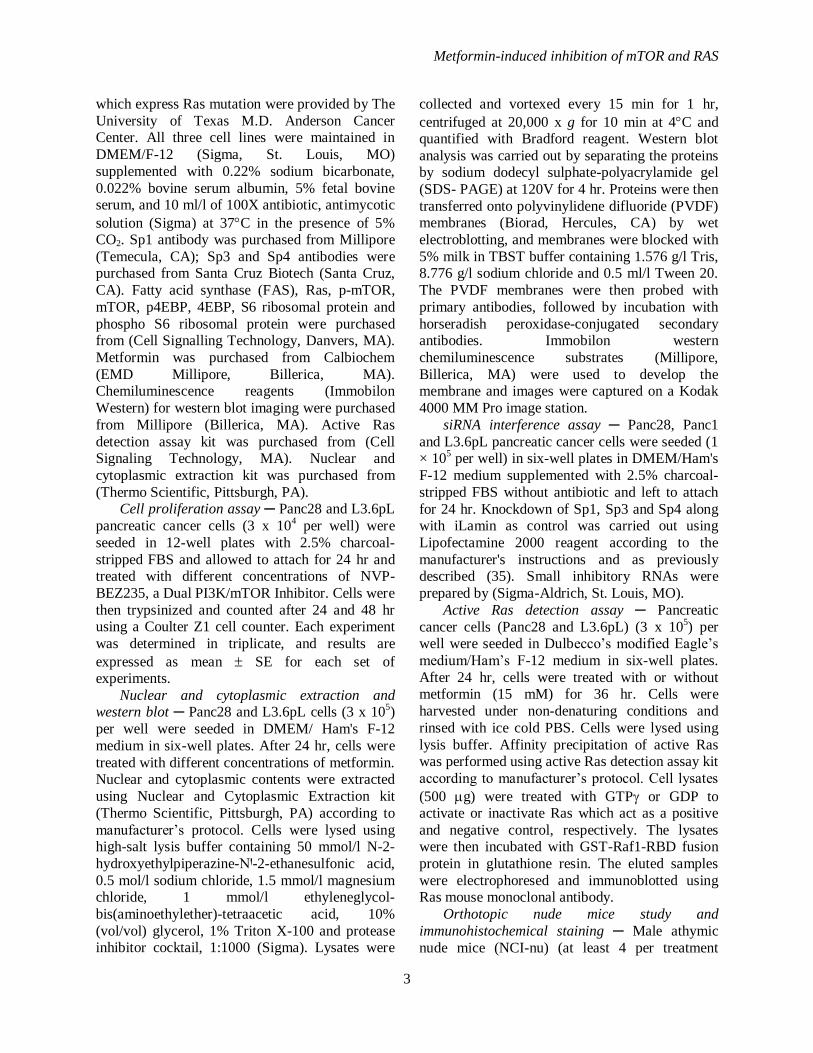
Metformin and Sp downregulation inhibit lipogenic genes ─ mTOR activation is also
important for lipogenesis and enhances cleavage
Metformin-induced inhibition of mTOR and RAS
5
of sterol regulatory element binding protein
1(SREBP-1) to give the cleaved (active) transcription factor SREBP-1c which in turn
regulates expression of fatty acid synthase (FAS)
(40-42). Treatment of Panc28 cells with
metformin decreases SREBP-1c expression in both nuclear and cytosolic fractions (Fig. 3A).
Similar results were observed in L3.6pL cells (Fig.
3B); however, the concentration-dependent decrease in pSREBP-1c was also cell context-
dependent. It has been previously reported that
both SREBP-1c and FAS are Sp1-regulated genes in breast and colon cancer cells (43) and silencing
of Sp1, Sp3, Sp4 or all 3 proteins
combined(iSp1/3/4) in Panc28 and L3.6pL
decreased expression of phosphorylated SREBP-1c, whereas total SREBP-1c expression was not
significantly decreased by the treatments (Fig.
3C). The results suggest that in pancreatic cancer cells, SREBP-1c is not directly regulated by Sp
transcription factors and the observed decrease in
phospho-SREBP-1c is due to inactivation of mTOR by Sp silencing (Figs. 2A and 2B). FAS
protein expression is also decreased by metformin
in pancreatic and other cancer cell lines (43) and
we observed that silencing of Sp transcription factors in Panc28 and L3.6pL (Fig. 3D) cells also
decreased FAS expression. Thus, the decreased
expression of FAS by metformin is due to both direct effects from the loss of Sp proteins and also
by decreased activation of SREBP due to
inhibition of mTOR. Knockdown of Sp1, Sp3 or
Sp4 alone or in combination also induced PARP cleavage, a marker of apoptosis.
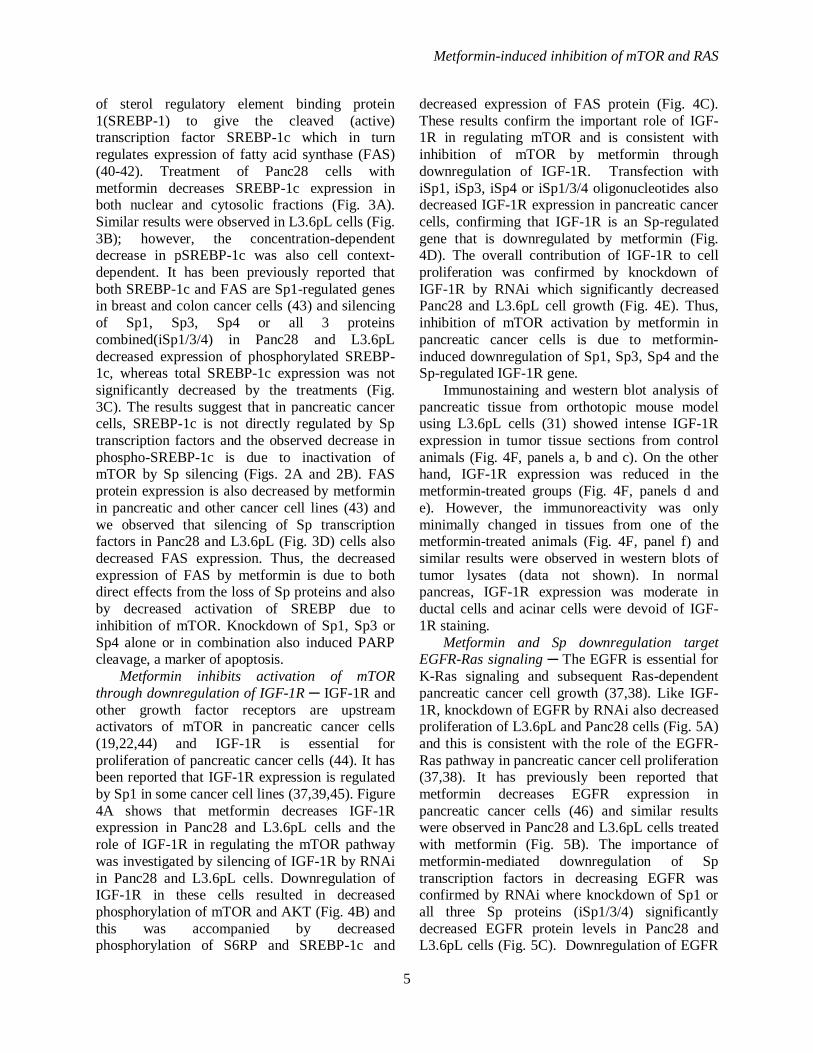
Metformin inhibits activation of mTOR
through downregulation of IGF-1R ─ IGF-1R and
other growth factor receptors are upstream activators of mTOR in pancreatic cancer cells
(19,22,44) and IGF-1R is essential for
proliferation of pancreatic cancer cells (44). It has been reported that IGF-1R expression is regulated
by Sp1 in some cancer cell lines (37,39,45). Figure
4A shows that metformin decreases IGF-1R expression in Panc28 and L3.6pL cells and the
role of IGF-1R in regulating the mTOR pathway
was investigated by silencing of IGF-1R by RNAi
in Panc28 and L3.6pL cells. Downregulation of IGF-1R in these cells resulted in decreased
phosphorylation of mTOR and AKT (Fig. 4B) and
this was accompanied by decreased phosphorylation of S6RP and SREBP-1c and
decreased expression of FAS protein (Fig. 4C).
These results confirm the important role of IGF-1R in regulating mTOR and is consistent with
inhibition of mTOR by metformin through
downregulation of IGF-1R. Transfection with
iSp1, iSp3, iSp4 or iSp1/3/4 oligonucleotides also decreased IGF-1R expression in pancreatic cancer
cells, confirming that IGF-1R is an Sp-regulated
gene that is downregulated by metformin (Fig. 4D). The overall contribution of IGF-1R to cell
proliferation was confirmed by knockdown of
IGF-1R by RNAi which significantly decreased Panc28 and L3.6pL cell growth (Fig. 4E). Thus,
inhibition of mTOR activation by metformin in
pancreatic cancer cells is due to metformin-
induced downregulation of Sp1, Sp3, Sp4 and the Sp-regulated IGF-1R gene.
Immunostaining and western blot analysis of
pancreatic tissue from orthotopic mouse model using L3.6pL cells (31) showed intense IGF-1R
expression in tumor tissue sections from control
animals (Fig. 4F, panels a, b and c). On the other hand, IGF-1R expression was reduced in the
metformin-treated groups (Fig. 4F, panels d and
e). However, the immunoreactivity was only
minimally changed in tissues from one of the metformin-treated animals (Fig. 4F, panel f) and
similar results were observed in western blots of
tumor lysates (data not shown). In normal pancreas, IGF-1R expression was moderate in
ductal cells and acinar cells were devoid of IGF-
1R staining.
Metformin and Sp downregulation target EGFR-Ras signaling ─ The EGFR is essential for
K-Ras signaling and subsequent Ras-dependent
pancreatic cancer cell growth (37,38). Like IGF-
1R, knockdown of EGFR by RNAi also decreased proliferation of L3.6pL and Panc28 cells (Fig. 5A)
and this is consistent with the role of the EGFR-
Ras pathway in pancreatic cancer cell proliferation (37,38). It has previously been reported that
metformin decreases EGFR expression in
pancreatic cancer cells (46) and similar results were observed in Panc28 and L3.6pL cells treated
with metformin (Fig. 5B). The importance of
metformin-mediated downregulation of Sp
transcription factors in decreasing EGFR was confirmed by RNAi where knockdown of Sp1 or
all three Sp proteins (iSp1/3/4) significantly
decreased EGFR protein levels in Panc28 and L3.6pL cells (Fig. 5C). Downregulation of EGFR

Metformin-induced inhibition of mTOR and RAS
6
by Sp knockdown was not observed in cells
transfected with iSp4 and silencing Sp3 decreased EGFR only in L3.6pL cells, showing that Sp1 is
the major regulator of EGFR expression and this
has been reported in other cancer cell lines
(39,47). The effects of metformin and Sp silencing on
Ras activity was determined using an active Ras
detection assay and treatment of Panc28 and L3.6pL cells with metformin or transfection of
these cells with iSp1/3/4 (combined) decreased
active Ras GTP levels (Fig. 5D) and similar results were observed after silencing EGFR (iEGFR) by
RNAi in Panc28 and L3.6pL cells (Fig. 5E). Thus,
metformin-induced downregulation of Sp1, Sp3,
Sp4 and Sp-regulated IGF-1R and EGFR genes resulted in inhibition of both the mTOR and Ras
pathways in pancreatic cancer cells and metformin
also decreased IGF-1R and EGFR expression in pancreatic tumors from an orthotopic mouse
model.
Metformin-induced downregulation of Sp transcription factors in pancreatic cancer cells was
dependent on induction of mitogen-activated
protein kinase phosphatase 1 (MKP1) and MKP5
and this response was blocked by the phosphatase inhibitor sodium orthovanadate (SOV) (31).
Results in Figure 6A show that SOV also blocks
metformin-mediated inhibition of mTOR and Akt phosphorylation and also phosphorylation of
4EBP and S6RP (Fig. 6B) in Panc28 and L3.6pL
cells. These results confirm that an important
underlying mechanism of action of metformin in pancreatic cancer cells was due to downregulation
of Sp transcription factors, and the Sp-regulated
IGF-1R and EGFR genes which results in the inhibition of mTOR and Ras pathways as
illustrated in Figure 6C.
DISCUSSION
Pancreatic cancer is a highly aggressive
disease which is not readily detected in its early
stages and the 1- and 5-year overall survival rates are 26 and 6%, respectively (48). Improvements in
pancreatic cancer patient survival will depend on
development of reliable biomarkers for early stage disease and on improved therapies for treating
patients with early and late stage disease.
Pancreatic tumors are complex and heterogeneous and typically express activated pro-oncogenic
factors including Ras and receptor tyrosine kinases
and mutations of tumor suppressor genes. Recent
studies report that diabetic cancer patients that take metformin exhibit improved outcomes
compared to patients taking other antidiabetic
drugs (10) and this has spurred interest in possible
clinical applications of metformin for cancer therapy. One of the hallmarks of metformin action
is associated with inhibition of the mTOR
signaling in both cancer and non-cancer tissues and cells (15-20,22-25). For example, metformin
inhibited constitutive and induced activation of
mTOR in several pancreatic cancer cell lines and the inhibitory effects were higher in cells grown in
normal 5 mM glucose compared to cells cultured
in 25 mM glucose (19,23,24). It has also been
reported that metformin suppresses the IGF-1R and mTOR signaling in pancreatic cancer cells and
this contributes to the antineoplastic activity of
this agent (19). Treatment of pancreatic cancer cells with
metformin downregulates expression of Sp1, Sp3,
Sp4 and pro-oncogenic Sp-regulated genes including cyclin D1, bcl2, survivin, VEGF and its
receptor 1 (31). The importance of targeting Sp
transcription factors in pancreatic cancer was
confirmed by knockdown of Sp1 which resulted in inhibition of growth and invasion and induction of
apoptosis (49). Moreover, high Sp1 expression in
pancreatic tumors is a prognostic factor for decreased pancreatic cancer patient survival (50).
It has also been reported that knockdown of Sp1,
Sp3 and Sp4 also decreased expression of receptor
tyrosine kinases and phosphorylation of other kinases such as Akt (39) and in this study we
initially investigated the role of metformin-
induced downregulation of Sp transcription factors on the mTOR pathway. In this study and others, a
range of relatively high concentrations (5 – 20
mM) of metformin are often used; however, many of the same responses are observed at lower
concentrations when treatment times are extended
(data not shown).
Metformin inhibited phosphorylation of mTOR and Akt in Panc28 and L3.6pL cells (Fig.
1B) and this was accompanied by decreased
activation of downstream kinases (S6RP and 4EBP) (Fig. 2C and 2D) and decreased formation
of the cleaved (and activated) form of SREBP
(Figs. 3A-3B). These results confirm that metformin inhibits mTOR signaling as previously
observed in other studies (40-42). However,
Metformin-induced inhibition of mTOR and RAS
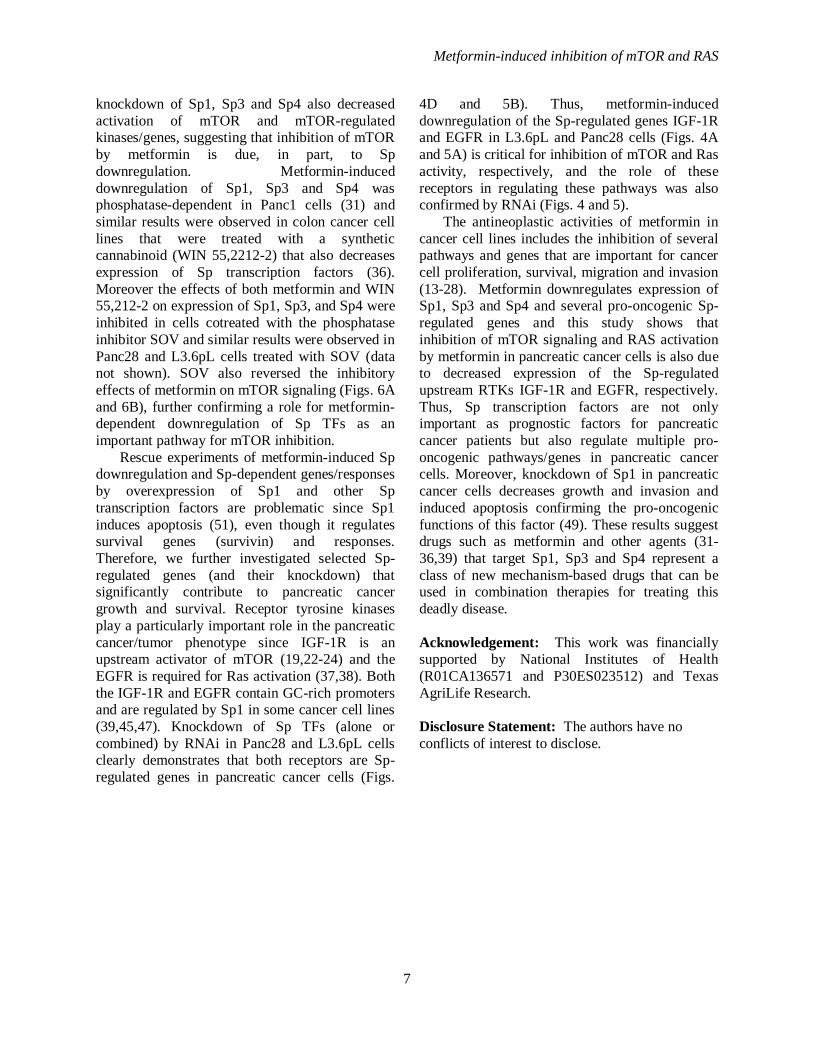
7
knockdown of Sp1, Sp3 and Sp4 also decreased
activation of mTOR and mTOR-regulated kinases/genes, suggesting that inhibition of mTOR
by metformin is due, in part, to Sp
downregulation. Metformin-induced
downregulation of Sp1, Sp3 and Sp4 was phosphatase-dependent in Panc1 cells (31) and
similar results were observed in colon cancer cell
lines that were treated with a synthetic cannabinoid (WIN 55,2212-2) that also decreases
expression of Sp transcription factors (36).
Moreover the effects of both metformin and WIN 55,212-2 on expression of Sp1, Sp3, and Sp4 were
inhibited in cells cotreated with the phosphatase
inhibitor SOV and similar results were observed in
Panc28 and L3.6pL cells treated with SOV (data not shown). SOV also reversed the inhibitory
effects of metformin on mTOR signaling (Figs. 6A
and 6B), further confirming a role for metformin-dependent downregulation of Sp TFs as an
important pathway for mTOR inhibition.
Rescue experiments of metformin-induced Sp downregulation and Sp-dependent genes/responses
by overexpression of Sp1 and other Sp
transcription factors are problematic since Sp1
induces apoptosis (51), even though it regulates survival genes (survivin) and responses.
Therefore, we further investigated selected Sp-
regulated genes (and their knockdown) that significantly contribute to pancreatic cancer
growth and survival. Receptor tyrosine kinases
play a particularly important role in the pancreatic
cancer/tumor phenotype since IGF-1R is an upstream activator of mTOR (19,22-24) and the
EGFR is required for Ras activation (37,38). Both
the IGF-1R and EGFR contain GC-rich promoters and are regulated by Sp1 in some cancer cell lines
(39,45,47). Knockdown of Sp TFs (alone or
combined) by RNAi in Panc28 and L3.6pL cells clearly demonstrates that both receptors are Sp-
regulated genes in pancreatic cancer cells (Figs.
4D and 5B). Thus, metformin-induced
downregulation of the Sp-regulated genes IGF-1R and EGFR in L3.6pL and Panc28 cells (Figs. 4A
and 5A) is critical for inhibition of mTOR and Ras
activity, respectively, and the role of these
receptors in regulating these pathways was also confirmed by RNAi (Figs. 4 and 5).
The antineoplastic activities of metformin in
cancer cell lines includes the inhibition of several pathways and genes that are important for cancer
cell proliferation, survival, migration and invasion
(13-28). Metformin downregulates expression of Sp1, Sp3 and Sp4 and several pro-oncogenic Sp-
regulated genes and this study shows that
inhibition of mTOR signaling and RAS activation
by metformin in pancreatic cancer cells is also due to decreased expression of the Sp-regulated
upstream RTKs IGF-1R and EGFR, respectively.
Thus, Sp transcription factors are not only important as prognostic factors for pancreatic
cancer patients but also regulate multiple pro-
oncogenic pathways/genes in pancreatic cancer cells. Moreover, knockdown of Sp1 in pancreatic
cancer cells decreases growth and invasion and
induced apoptosis confirming the pro-oncogenic
functions of this factor (49). These results suggest drugs such as metformin and other agents (31-
36,39) that target Sp1, Sp3 and Sp4 represent a
class of new mechanism-based drugs that can be used in combination therapies for treating this
deadly disease.
Acknowledgement: This work was financially supported by National Institutes of Health
(R01CA136571 and P30ES023512) and Texas
AgriLife Research.
Disclosure Statement: The authors have no
conflicts of interest to disclose.

Metformin-induced inhibition of mTOR and RAS
8
REFERENCES
1. Pollak, M. (2010) Metformin and other biguanides in oncology: advancing the research
agenda. Cancer Prev Res 3, 1060-1065
2. Ben Sahra, I., Le Marchand-Brustel, Y., Tanti, J. F., and Bost, F. (2010) Metformin in
cancer therapy: a new perspective for an old antidiabetic drug? Mol Cancer Ther 9, 1092-
1099
3. Engelman, J. A., and Cantley, L. C. (2010) Chemoprevention meets glucose control.
Cancer Prev Res 3, 1049-1052
4. Dowling, R. J., Niraula, S., Stambolic, V., and Goodwin, P. J. (2012) Metformin in
cancer: translational challenges. J Mol Endocrinol 48, 12-0007
5. Evans, J. M., Donnelly, L. A., Emslie-Smith, A. M., Alessi, D. R., and Morris, A. D.
(2005) Metformin and reduced risk of cancer in diabetic patients. BMJ 330, 1304-1305
6. Garrett, C. R., Hassabo, H. M., Bhadkamkar, N. A., Wen, S., Baladandayuthapani, V.,
Kee, B. K., Eng, C., and Hassan, M. M. (2012) Survival advantage observed with the use
of metformin in patients with type II diabetes and colorectal cancer. Br J Cancer 106,
1374-1378
7. Jiralerspong, S., Palla, S. L., Giordano, S. H., Meric-Bernstam, F., Liedtke, C., Barnett,
C. M., Hsu, L., Hung, M. C., Hortobagyi, G. N., and Gonzalez-Angulo, A. M. (2009)
Metformin and pathologic complete responses to neoadjuvant chemotherapy in diabetic
patients with breast cancer. J Clin Oncol 27, 3297-3302
8. Libby, G., Donnelly, L. A., Donnan, P. T., Alessi, D. R., Morris, A. D., and Evans, J. M.
(2009) New users of metformin are at low risk of incident cancer: a cohort study among
people with type 2 diabetes. Diabetes Care 32, 1620-1625
9. Murtola, T. J., Tammela, T. L., Lahtela, J., and Auvinen, A. (2008) Antidiabetic
medication and prostate cancer risk: a population-based case-control study. Am J
Epidemiol 168, 925-931
10. Sadeghi, N., Abbruzzese, J. L., Yeung, S. C., Hassan, M., and Li, D. (2012) Metformin
use is associated with better survival of diabetic patients with pancreatic cancer. Clin
Cancer Res 18, 2905-2912
11. Spillane, S., Bennett, K., Sharp, L., and Barron, T. I. (2013) A cohort study of metformin
exposure and survival in patients with stage I-III colorectal cancer. Cancer Epidemiol
Biomarkers Prev 22, 1364-1373
12. Wright, J. L., and Stanford, J. L. (2009) Metformin use and prostate cancer in Caucasian
men: results from a population-based case-control study. Cancer Causes Control 20,
1617-1622
13. Ben Sahra, I., Laurent, K., Loubat, A., Giorgetti-Peraldi, S., Colosetti, P., Auberger, P.,
Tanti, J. F., Le Marchand-Brustel, Y., and Bost, F. (2008) The antidiabetic drug
metformin exerts an antitumoral effect in vitro and in vivo through a decrease of cyclin
D1 level. Oncogene 27, 3576-3586
14. Ben Sahra, I., Regazzetti, C., Robert, G., Laurent, K., Le Marchand-Brustel, Y.,
Auberger, P., Tanti, J. F., Giorgetti-Peraldi, S., and Bost, F. (2011) Metformin,
independent of AMPK, induces mTOR inhibition and cell-cycle arrest through REDD1.
Cancer Res 71, 4366-4372
15. Buzzai, M., Jones, R. G., Amaravadi, R. K., Lum, J. J., DeBerardinis, R. J., Zhao, F.,
Viollet, B., and Thompson, C. B. (2007) Systemic treatment with the antidiabetic drug

Metformin-induced inhibition of mTOR and RAS
9
metformin selectively impairs p53-deficient tumor cell growth. Cancer Res 67, 6745-
6752
16. Cerezo, M., Tichet, M., Abbe, P., Ohanna, M., Lehraiki, A., Rouaud, F., Allegra, M.,
Giacchero, D., Bahadoran, P., Bertolotto, C., Tartare-Deckert, S., Ballotti, R., and
Rocchi, S. (2013) Metformin blocks melanoma invasion and metastasis development in
AMPK/p53-dependent manner. Mol Cancer Ther 12, 1605-1615
17. Gotlieb, W. H., Saumet, J., Beauchamp, M. C., Gu, J., Lau, S., Pollak, M. N., and
Bruchim, I. (2008) In vitro metformin anti-neoplastic activity in epithelial ovarian cancer.
Gynecol Oncol 110, 246-250
18. Gou, S., Cui, P., Li, X., Shi, P., Liu, T., and Wang, C. (2013) Low concentrations of
metformin selectively inhibit CD133(+) cell proliferation in pancreatic cancer and have
anticancer action. PLoS One 8
19. Karnevi, E., Said, K., Andersson, R., and Rosendahl, A. H. (2013) Metformin-mediated
growth inhibition involves suppression of the IGF-I receptor signalling pathway in
human pancreatic cancer cells. BMC Cancer 13, 1471-2407
20. Kim, H. G., Hien, T. T., Han, E. H., Hwang, Y. P., Choi, J. H., Kang, K. W., Kwon, K. I.,
Kim, B. H., Kim, S. K., Song, G. Y., Jeong, T. C., and Jeong, H. G. (2011) Metformin
inhibits P-glycoprotein expression via the NF-kappaB pathway and CRE transcriptional
activity through AMPK activation. Br J Pharmacol 162, 1096-1108
21. Kisfalvi, K., Eibl, G., Sinnett-Smith, J., and Rozengurt, E. (2009) Metformin disrupts
crosstalk between G protein-coupled receptor and insulin receptor signaling systems and
inhibits pancreatic cancer growth. Cancer Res 69, 6539-6545
22. Rozengurt, E., Sinnett-Smith, J., and Kisfalvi, K. (2010) Crosstalk between
insulin/insulin-like growth factor-1 receptors and G protein-coupled receptor signaling
systems: a novel target for the antidiabetic drug metformin in pancreatic cancer. Clinical
Cancer Research 16, 2505-2511
23. Sinnett-Smith, J., Kisfalvi, K., Kui, R., and Rozengurt, E. (2013) Metformin inhibition of
mTORC1 activation, DNA synthesis and proliferation in pancreatic cancer cells:
dependence on glucose concentration and role of AMPK. Biochem Biophys Res Commun
430, 352-357
24. Soares, H. P., Ni, Y., Kisfalvi, K., Sinnett-Smith, J., and Rozengurt, E. (2013) Different
patterns of Akt and ERK feedback activation in response to rapamycin, active-site mTOR
inhibitors and metformin in pancreatic cancer cells. PLoS One 8, 21
25. Storozhuk, Y., Hopmans, S. N., Sanli, T., Barron, C., Tsiani, E., Cutz, J. C., Pond, G.,
Wright, J., Singh, G., and Tsakiridis, T. (2013) Metformin inhibits growth and enhances
radiation response of non-small cell lung cancer (NSCLC) through ATM and AMPK. Br
J Cancer 108, 2021-2032
26. Tan, B. K., Adya, R., Chen, J., Lehnert, H., Sant Cassia, L. J., and Randeva, H. S. (2011)
Metformin treatment exerts antiinvasive and antimetastatic effects in human endometrial
carcinoma cells. J Clin Endocrinol Metab 96, 808-816
27. Yasmeen, A., Beauchamp, M. C., Piura, E., Segal, E., Pollak, M., and Gotlieb, W. H.
(2011) Induction of apoptosis by metformin in epithelial ovarian cancer: involvement of
the Bcl-2 family proteins. Gynecol Oncol 121, 492-498
28. Zhuang, Y., and Miskimins, W. K. (2011) Metformin induces both caspase-dependent
and poly(ADP-ribose) polymerase-dependent cell death in breast cancer cells. Mol
Cancer Res 9, 603-615
Metformin-induced inhibition of mTOR and RAS
10
29. Shaw, R. J., Lamia, K. A., Vasquez, D., Koo, S. H., Bardeesy, N., Depinho, R. A.,
Montminy, M., and Cantley, L. C. (2005) The kinase LKB1 mediates glucose
homeostasis in liver and therapeutic effects of metformin. Science 310, 1642-1646
30. Zou, M. H., Kirkpatrick, S. S., Davis, B. J., Nelson, J. S., Wiles, W. G. t., Schlattner, U.,
Neumann, D., Brownlee, M., Freeman, M. B., and Goldman, M. H. (2004) Activation of
the AMP-activated protein kinase by the anti-diabetic drug metformin in vivo. Role of
mitochondrial reactive nitrogen species. J Biol Chem 279, 43940-43951
31. Nair, V., Pathi, S., Jutooru, I., Sreevalsan, S., Basha, R., Abdelrahim, M., Samudio, I.,
and Safe, S. (2013) Metformin inhibits pancreatic cancer cell and tumor growth and
downregulates Sp transcription factors. Carcinogenesis 34, 2870-2879
32. Abdelrahim, M., Baker, C. H., Abbruzzese, J. L., Sheikh-Hamad, D., Liu, S., Cho, S. D.,
Yoon, K., and Safe, S. (2007) Regulation of vascular endothelial growth factor receptor-1
expression by specificity proteins 1, 3, and 4 in pancreatic cancer cells. Cancer Res 67,
3286-3294
33. Abdelrahim, M., Smith, R., 3rd, Burghardt, R., and Safe, S. (2004) Role of Sp proteins in
regulation of vascular endothelial growth factor expression and proliferation of pancreatic
cancer cells. Cancer Res 64, 6740-6749
34. Jutooru, I., Chadalapaka, G., Abdelrahim, M., Basha, M. R., Samudio, I., Konopleva, M.,
Andreeff, M., and Safe, S. (2010) Methyl 2-cyano-3,12-dioxooleana-1,9-dien-28-oate
decreases specificity protein transcription factors and inhibits pancreatic tumor growth:
role of microRNA-27a. Mol Pharmacol 78, 226-236
35. Jutooru, I., Chadalapaka, G., Lei, P., and Safe, S. (2010) Inhibition of NFkappaB and
pancreatic cancer cell and tumor growth by curcumin is dependent on specificity protein
down-regulation. J Biol Chem 285, 25332-25344
36. Sreevalsan, S., and Safe, S. (2013) The cannabinoid WIN 55,212-2 decreases specificity
protein transcription factors and the oncogenic cap protein eIF4E in colon cancer cells.
Mol Cancer Ther 12, 2483-2493
37. Ardito, C. M., Gruner, B. M., Takeuchi, K. K., Lubeseder-Martellato, C., Teichmann, N.,
Mazur, P. K., Delgiorno, K. E., Carpenter, E. S., Halbrook, C. J., Hall, J. C., Pal, D.,
Briel, T., Herner, A., Trajkovic-Arsic, M., Sipos, B., Liou, G. Y., Storz, P., Murray, N.
R., Threadgill, D. W., Sibilia, M., Washington, M. K., Wilson, C. L., Schmid, R. M.,
Raines, E. W., Crawford, H. C., and Siveke, J. T. (2012) EGF receptor is required for
KRAS-induced pancreatic tumorigenesis. Cancer Cell 22, 304-317
38. Navas, C., Hernandez-Porras, I., Schuhmacher, A. J., Sibilia, M., Guerra, C., and
Barbacid, M. (2012) EGF receptor signaling is essential for k-ras oncogene-driven
pancreatic ductal adenocarcinoma. Cancer Cell 22, 318-330
39. Chadalapaka, G., Jutooru, I., Burghardt, R., and Safe, S. (2010) Drugs that target
specificity proteins downregulate epidermal growth factor receptor in bladder cancer
cells. Mol Cancer Res 8, 739-750
40. Furuta, E., Pai, S. K., Zhan, R., Bandyopadhyay, S., Watabe, M., Mo, Y. Y., Hirota, S.,
Hosobe, S., Tsukada, T., Miura, K., Kamada, S., Saito, K., Iiizumi, M., Liu, W., Ericsson,
J., and Watabe, K. (2008) Fatty acid synthase gene is up-regulated by hypoxia via
activation of Akt and sterol regulatory element binding protein-1. Cancer Res 68, 1003-
1011
Metformin-induced inhibition of mTOR and RAS
11
41. Owen, J. L., Zhang, Y., Bae, S. H., Farooqi, M. S., Liang, G., Hammer, R. E., Goldstein,
J. L., and Brown, M. S. (2012) Insulin stimulation of SREBP-1c processing in transgenic
rat hepatocytes requires p70 S6-kinase. Proc Natl Acad Sci U S A 109, 16184-16189
42. Porstmann, T., Santos, C. R., Griffiths, B., Cully, M., Wu, M., Leevers, S., Griffiths, J.
R., Chung, Y. L., and Schulze, A. (2008) SREBP activity is regulated by mTORC1 and
contributes to Akt-dependent cell growth. Cell Metab 8, 224-236
43. Lu, S., and Archer, M. C. (2010) Sp1 coordinately regulates de novo lipogenesis and
proliferation in cancer cells. Int J Cancer 126, 416-425
44. Bergmann, U., Funatomi, H., Yokoyama, M., Beger, H. G., and Korc, M. (1995) Insulin-
like growth factor I overexpression in human pancreatic cancer: evidence for autocrine
and paracrine roles. Cancer Res 55, 2007-2011
45. Beitner-Johnson, D., Werner, H., Roberts, C. T., Jr., and LeRoith, D. (1995) Regulation
of insulin-like growth factor I receptor gene expression by Sp1: physical and functional
interactions of Sp1 at GC boxes and at a CT element. Mol Endocrinol 9, 1147-1156
46. Wang, L. W., Li, Z. S., Zou, D. W., Jin, Z. D., Gao, J., and Xu, G. M. (2008) Metformin
induces apoptosis of pancreatic cancer cells. World J Gastroenterol 14, 7192-7198
47. Johnson, A. C., Ishii, S., Jinno, Y., Pastan, I., and Merlino, G. T. (1988) Epidermal
growth factor receptor gene promoter. Deletion analysis and identification of nuclear
protein binding sites. J Biol Chem 263, 5693-5699
48. (2011) Cancer Facts & Figures 2011. American Cancer Society., Atlanta
49. Jutooru, I., Guthrie, A. S., Chadalapaka, G., Pathi, S., Kim, K., Burghardt, R., Jin, U. H.,
and Safe, S. (2014) Mechanism of action of phenethylisothiocyanate and other reactive
oxygen species-inducing anticancer agents. Mol Cell Biol 34, 2382-2395
50. Jiang, N. Y., Woda, B. A., Banner, B. F., Whalen, G. F., Dresser, K. A., and Lu, D.
(2008) Sp1, a new biomarker that identifies a subset of aggressive pancreatic ductal
adenocarcinoma. Cancer Epidemiol Biomarkers Prev 17, 1648-1652
51. Deniaud, E., Baguet, J., Mathieu, A. L., Pages, G., Marvel, J., and Leverrier, Y. (2006)
Overexpression of Sp1 transcription factor induces apoptosis. Oncogene 25, 7096-7105
Metformin-induced inhibition of mTOR and RAS
12
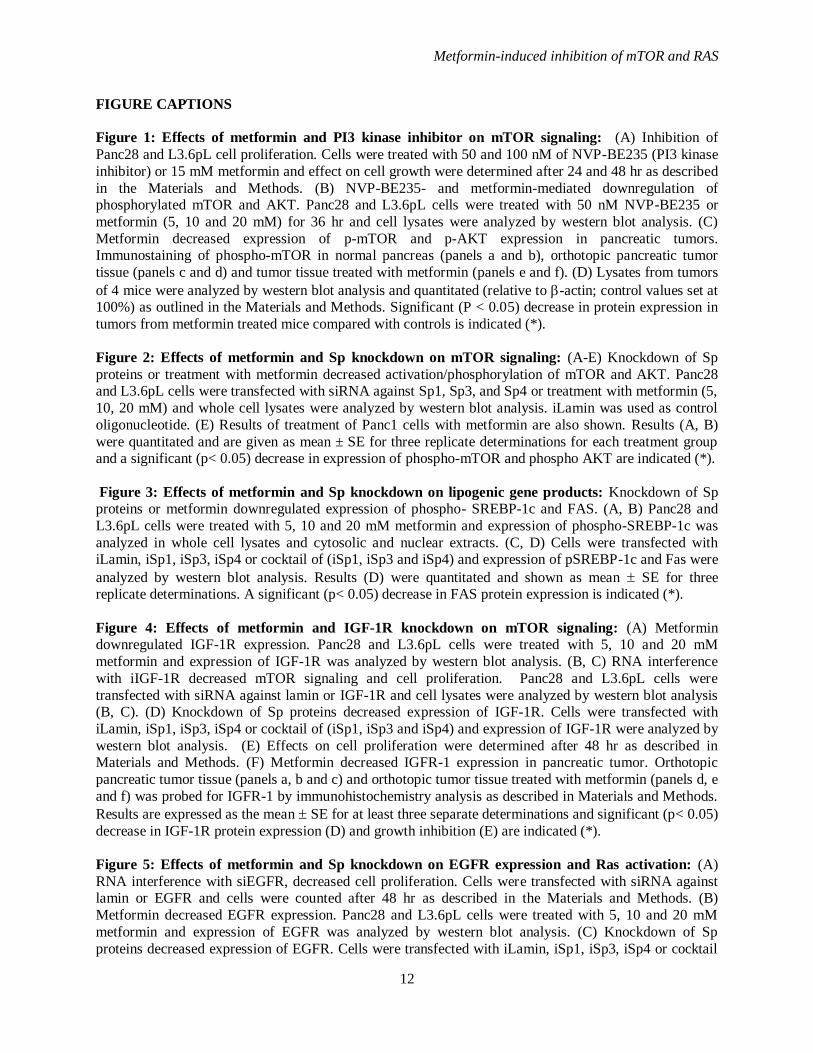
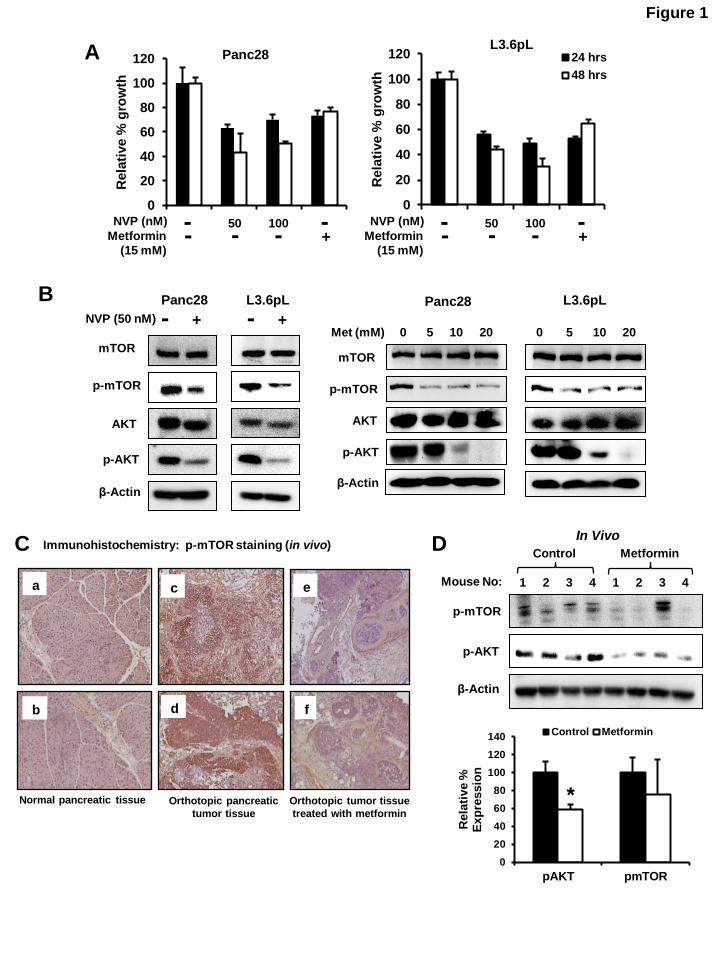
FIGURE CAPTIONS Figure 1: Effects of metformin and PI3 kinase inhibitor on mTOR signaling: (A) Inhibition of
Panc28 and L3.6pL cell proliferation. Cells were treated with 50 and 100 nM of NVP-BE235 (PI3 kinase
inhibitor) or 15 mM metformin and effect on cell growth were determined after 24 and 48 hr as described
in the Materials and Methods. (B) NVP-BE235- and metformin-mediated downregulation of phosphorylated mTOR and AKT. Panc28 and L3.6pL cells were treated with 50 nM NVP-BE235 or
metformin (5, 10 and 20 mM) for 36 hr and cell lysates were analyzed by western blot analysis. (C)
Metformin decreased expression of p-mTOR and p-AKT expression in pancreatic tumors. Immunostaining of phospho-mTOR in normal pancreas (panels a and b), orthotopic pancreatic tumor
tissue (panels c and d) and tumor tissue treated with metformin (panels e and f). (D) Lysates from tumors
of 4 mice were analyzed by western blot analysis and quantitated (relative to -actin; control values set at 100%) as outlined in the Materials and Methods. Significant (P < 0.05) decrease in protein expression in
tumors from metformin treated mice compared with controls is indicated (*).
Figure 2: Effects of metformin and Sp knockdown on mTOR signaling: (A-E) Knockdown of Sp
proteins or treatment with metformin decreased activation/phosphorylation of mTOR and AKT. Panc28 and L3.6pL cells were transfected with siRNA against Sp1, Sp3, and Sp4 or treatment with metformin (5,
10, 20 mM) and whole cell lysates were analyzed by western blot analysis. iLamin was used as control
oligonucleotide. (E) Results of treatment of Panc1 cells with metformin are also shown. Results (A, B)
were quantitated and are given as mean ± SE for three replicate determinations for each treatment group and a significant (p< 0.05) decrease in expression of phospho-mTOR and phospho AKT are indicated (*).
Figure 3: Effects of metformin and Sp knockdown on lipogenic gene products: Knockdown of Sp proteins or metformin downregulated expression of phospho- SREBP-1c and FAS. (A, B) Panc28 and
L3.6pL cells were treated with 5, 10 and 20 mM metformin and expression of phospho-SREBP-1c was
analyzed in whole cell lysates and cytosolic and nuclear extracts. (C, D) Cells were transfected with iLamin, iSp1, iSp3, iSp4 or cocktail of (iSp1, iSp3 and iSp4) and expression of pSREBP-1c and Fas were
analyzed by western blot analysis. Results (D) were quantitated and shown as mean SE for three replicate determinations. A significant (p< 0.05) decrease in FAS protein expression is indicated (*).
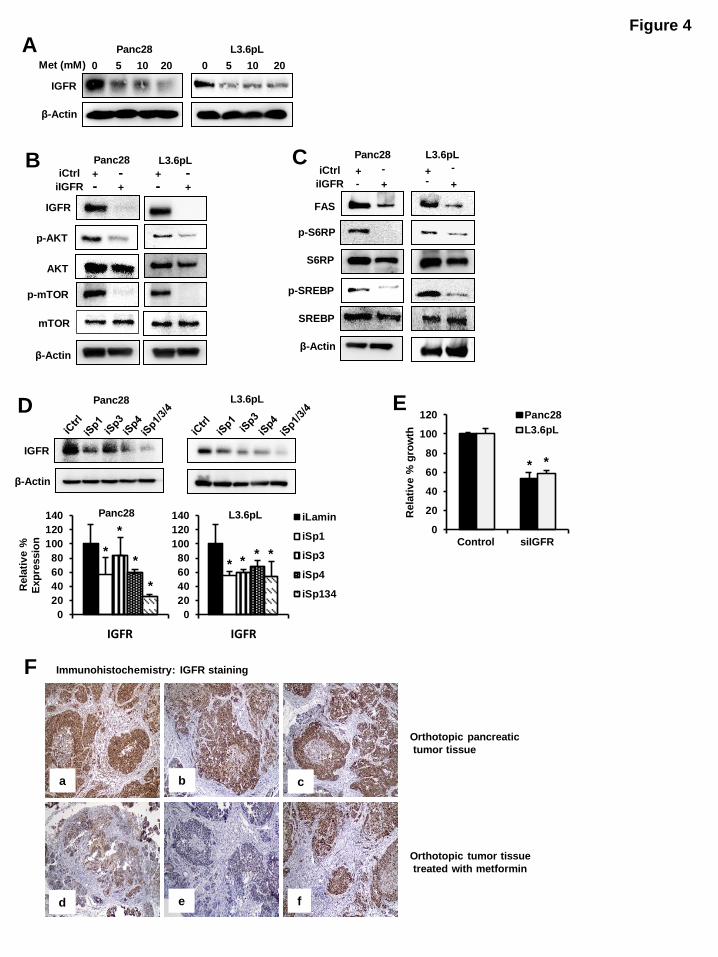
Figure 4: Effects of metformin and IGF-1R knockdown on mTOR signaling: (A) Metformin downregulated IGF-1R expression. Panc28 and L3.6pL cells were treated with 5, 10 and 20 mM
metformin and expression of IGF-1R was analyzed by western blot analysis. (B, C) RNA interference
with iIGF-1R decreased mTOR signaling and cell proliferation. Panc28 and L3.6pL cells were
transfected with siRNA against lamin or IGF-1R and cell lysates were analyzed by western blot analysis (B, C). (D) Knockdown of Sp proteins decreased expression of IGF-1R. Cells were transfected with
iLamin, iSp1, iSp3, iSp4 or cocktail of (iSp1, iSp3 and iSp4) and expression of IGF-1R were analyzed by
western blot analysis. (E) Effects on cell proliferation were determined after 48 hr as described in Materials and Methods. (F) Metformin decreased IGFR-1 expression in pancreatic tumor. Orthotopic
pancreatic tumor tissue (panels a, b and c) and orthotopic tumor tissue treated with metformin (panels d, e
and f) was probed for IGFR-1 by immunohistochemistry analysis as described in Materials and Methods.
Results are expressed as the mean SE for at least three separate determinations and significant (p< 0.05)
decrease in IGF-1R protein expression (D) and growth inhibition (E) are indicated (*).
Figure 5: Effects of metformin and Sp knockdown on EGFR expression and Ras activation: (A)
RNA interference with siEGFR, decreased cell proliferation. Cells were transfected with siRNA against lamin or EGFR and cells were counted after 48 hr as described in the Materials and Methods. (B)
Metformin decreased EGFR expression. Panc28 and L3.6pL cells were treated with 5, 10 and 20 mM
metformin and expression of EGFR was analyzed by western blot analysis. (C) Knockdown of Sp
proteins decreased expression of EGFR. Cells were transfected with iLamin, iSp1, iSp3, iSp4 or cocktail
Metformin-induced inhibition of mTOR and RAS
13
of (iSp1, iSp3 and iSp4) and expression of EGFR were analyzed by western blot analysis. (D, E)
Metformin or knockdown of Sp proteins and EGFR decreased levels of active Ras (Ras GTP). Panc28 and L3.6pL cells were treated with or without metformin or transfected with small inhibitory RNA for
lamin or Sp (cocktail of iSp1, iSp3, iSp4) (D) or (iEGFR) (E). Levels of RasGTP were determined using
active Ras detection assay. GTP or GDP act as positive and negative controls, respectively. Activated
Ras was quantified and normalized to total Ras levels. Results are expressed as the mean SE for at least three separate determinations and significant (p< 0.05) growth inhibition (A), decrease in EGFR
expression (C) and decreased Ras activity (D) are indicated (*).
Figure 6: Role of phosphatases in metformin mediated downregulation of mTOR signaling: (A, B)
Phosphatase inhibitor reversed metformin-mediated downregulation of mTOR signaling. Panc28 and
L3.6pL cells were pretreated with phosphatase inhibitor, sodium orthovanadate (SOV) (20 M) for 45 min followed by treatment with 15 mM of metformin for 36 hr and whole cell lysates were analyzed by western blots. (C) Proposed mechanism of action of metformin in pancreatic cancer.
0
20
40
60
80
100
120
Rela
tive %
gro
wth
Figure 1
A
0
20
40
60
80
100
120
Rela
tive %
gro
wth
L3.6pL 24 hrs
48 hrs
Panc28
B
mTOR
p-mTOR
AKT
p-AKT
β-Actin
Met (mM) 0 5 10 20
Panc28
0 5 10 20
L3.6pL
NVP (nM)
Metformin
(15 mM) - -
- - + 50 100 - NVP (nM)
Metformin
(15 mM) - -
- - + 50 100 -
L3.6pL Panc28
p-mTOR
p-AKT
mTOR
β-Actin
AKT
NVP (50 nM) - + - +
C Immunohistochemistry: p-mTOR staining (in vivo)
Normal pancreatic tissue Orthotopic pancreatic
tumor tissue
Orthotopic tumor tissue
treated with metformin
a
b
c e
d f
β-Actin
p-AKT
1 2 3 4 1 2 3 4
Control Metformin
Mouse No:
p-mTOR
D
0
20
40
60
80
100
120
140
pAKT pmTOR
Rela
tive %
E
xp
ressio
n
Control Metformin
*
In Vivo

Figure 2 Panc28 A
iL iSp1 iSp3 iSp4
Sp1
Sp3
Sp4
β-Actin
iL iSp1 iSp3 iSp4
p-mTOR
mTOR
p-AKT
AKT
β-Actin
Quantification
0
20
40
60
80
100
120
140
160
p-mTOR mTOR p-AKT AKT
Rela
tiv
e %
Exp
ressio
n
Panc28
iLamin
iSp1
iSp3
iSp4* *
* * *
L3.6pL B
β-Actin
iL iSp1 iSp3 iSp4
Sp1
Sp4 p-mTOR
mTOR
p-AKT
AKT
iL iSp1 iSp3 iSp4
β-Actin
Quantification
0
20
40
60
80
100
120
140
p-mTOR mTOR p-AKT AKT
Rela
tiv
e %
Exp
ressio
n
L3.6pL
iLamin
iSp1
iSp3
iSp4
Sp3 * * *
* * *
p-mTOR
p-AKT
p-S6RP
p-4EBP
S6RP
4EBP AKT
mTOR
Panc1
β-Actin β-Actin
Met (mM) 0 5 10 Met (mM) 0 5 10 E
C
β-Actin
Met (mM) 0 5 10 20 iL iSp1 iSp3 iSp4
Panc28
S6RP
p-S6RP
4EBP
p-4EBP
1 0.90 0.91 1 1 1.25 1 1.29
1 0.40 0.19 0.07 1 0.80 0.61 0.38
1 1.12 1.15 1.13 1 1.08 1.05 1.14
1 0.59 0.38 0.25 1 0.76 0.11 0.02
1 1.02 1.08 1.03 1 0.81 0.85 0.95
iL iSp1 iSp3 iSp4 Met (mM) 0 5 10 20
L3.6pL D
β-Actin
S6RP
p-S6RP
4EBP
p-4EBP
1 0.83 0.19 0.10 1 0.45 0.34 0.55
1 0.93 0.99 1.01 1 1.15 1.02 1.13
1 0.73 0.75 0.50 1 0.77 0.79 0.78
1 0.96 1.06 1.04 1 1.03 1.15 1.08
1 0.95 0.97 1.11 1 0.99 0.97 1.20
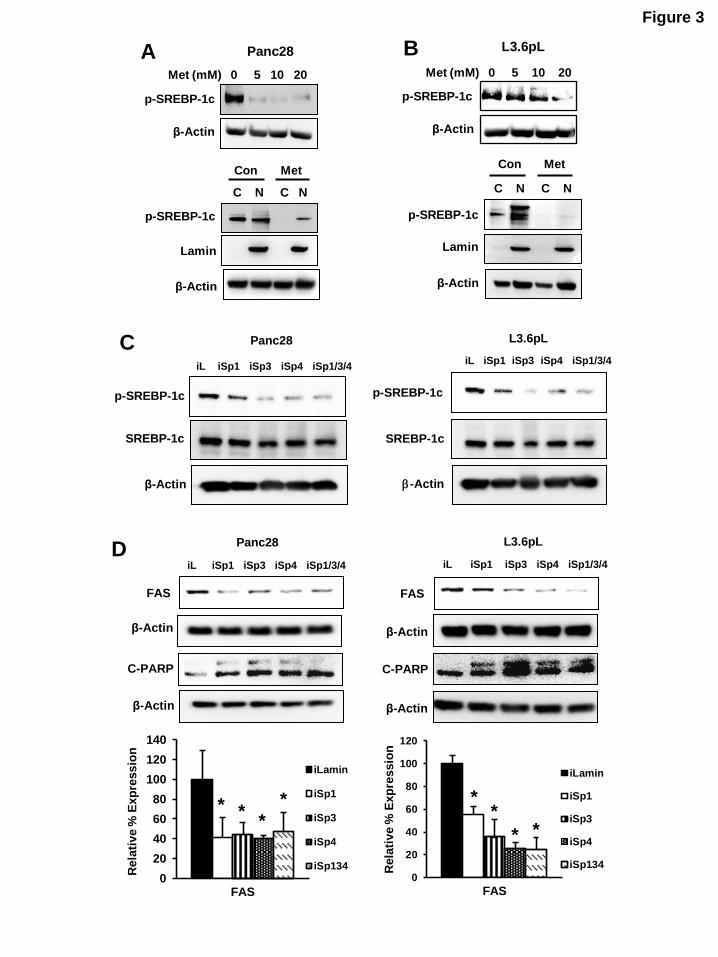
Figure 3
β-Actin
Met (mM) 0 5 10 20
L3.6pL
p-SREBP-1c
C N C N
p-SREBP-1c
β-Actin
Con Met
Lamin
B A
p-SREBP-1c
β-Actin
Met (mM) 0 5 10 20
Panc28
p-SREBP-1c
C N C N
β-Actin
Con Met
Lamin
FAS
β-Actin
iL iSp1 iSp3 iSp4 iSp1/3/4
L3.6pL Panc28
iL iSp1 iSp3 iSp4 iSp1/3/4
FAS
β-Actin
0
20
40
60
80
100
120
140
Rela
tive %
Exp
ressio
n
FAS
iLamin
iSp1
iSp3
iSp4
iSp134
* * *
*
0
20
40
60
80
100
120
Rela
tive %
Exp
ressio
n
FAS
iLamin
iSp1
iSp3
iSp4
iSp134
* *
* *
D
p-SREBP-1c
SREBP-1c
iL iSp1 iSp3 iSp4 iSp1/3/4
β-Actin
iL iSp1 iSp3 iSp4 iSp1/3/4
p-SREBP-1c
SREBP-1c
-Actin
C L3.6pL Panc28
C-PARP C-PARP
β-Actin β-Actin
0 5 10 20
L3.6pL
β-Actin
IGFR
Met (mM) 0 5 10 20
Panc28 A Figure 4
Panc28
β-Actin
IGFR
D L3.6pL
0
20
40
60
80
100
120
140
IGFR
L3.6pL iLamin
iSp1
iSp3
iSp4
iSp134
0
20
40
60
80
100
120
140
Rela
tiv
e %
Exp
ressio
n
IGFR
Panc28
*
*
*
*
* * * *
p-S6RP
p-SREBP
S6RP
β-Actin
SREBP
Panc28 L3.6pL
FAS
C iCtrl
iIGFR
- +
- +
- + - +
L3.6pL
p-mTOR
IGFR
β-Actin
mTOR
Panc28 B
p-AKT
AKT
iCtrl
iIGFR
- +
- +
- +
- +
0
20
40
60
80
100
120R
ela
tiv
e %
gro
wth
Panc28
L3.6pL
E
* *
siIGFR Control
Immunohistochemistry: IGFR staining
Orthotopic pancreatic
tumor tissue
Orthotopic tumor tissue
treated with metformin
a b c
d e f
F

Figure 5
B
β-Actin
EGFR
Met (mM) 0 5 10 20
Panc28
0 5 10 20
L3.6pL
β-Actin
EGFR
Met (mM)
L3.6pLPanc28
β-Actin
EGFR
0
50
100
150
EGFR
L3.6pL iLamin
iSp1
iSp3
iSp4
iSp134
0
50
100
150
EGFR
Panc28
C
Rela
tiv
e %
exp
ressio
n
Rela
tiv
e %
exp
ressio
n
0
50
100
150R
ela
tive %
g
row
th
Panc28L3.6pL
A
siEGFRControl
0
50
100
150
200
0
50
100
150
200
250
GST
Ras GTP
L3.6pLPanc28
Rela
tiv
e e
xp
ressio
n
of
Ras
GT
P
Rela
tiv
e e
xp
ressio
n
of
Ras
GT
P
Total Ras
GST
Ras GTP
Total Ras
D
Ras GTP
iCtrl
iSp1/3/4
GST
L3.6pLPanc28
Total Ras
-+- +
-+- +
EGFR
β-Actin
L3.6pLPanc28
iCtrl
iEGFR
Ras GTP
GST
L3.6pLPanc28
Total Ras
E-+
- +-+
- +iCtrl
iEGFR
-+- +
-+- +
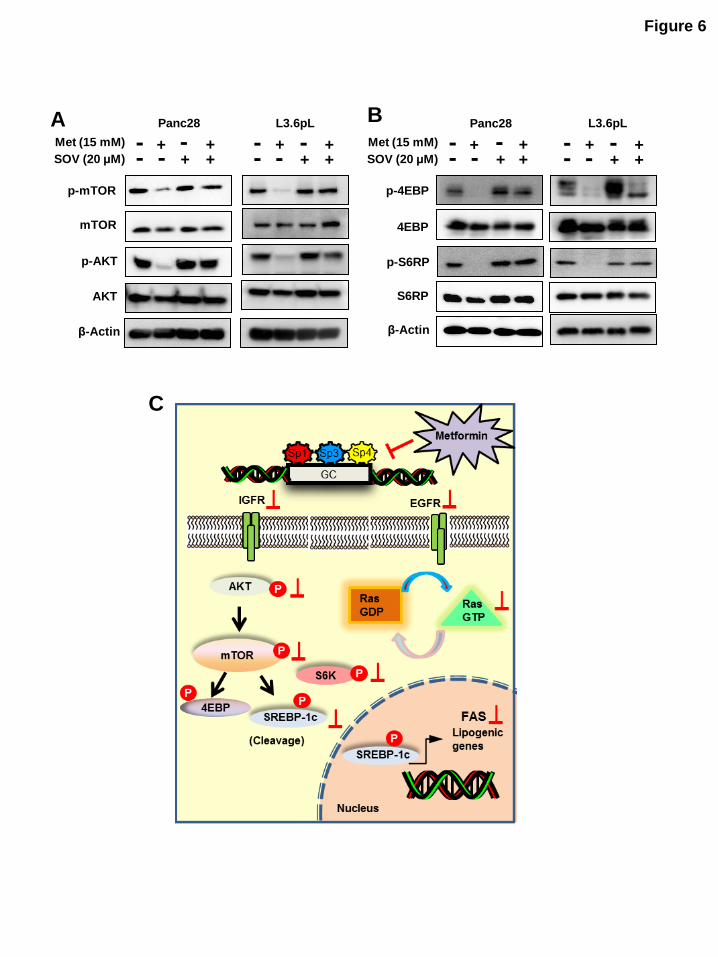
Figure 6
C
Panc28 L3.6pL
p-mTOR
mTOR
p-AKT
AKT
β-Actin
A Met (15 mM)
SOV (20 μM) - +
- + - - +
+ + - +
- - +
+ - Met (15 mM)
SOV (20 μM)
S6RP
4EBP
p-4EBP
p-S6RP
Panc28 L3.6pL B
β-Actin
- + - +
- - +
+ + - +
- - +
+ -