chapter 4 heavy trucks - center for transportation...
TRANSCRIPT

2016 VEHICLE TECHNOLOGIES CHAPTER 4 MARKET REPORT 113 HEAVY TRUCKS
CHAPTER 4
HEAVY TRUCKS
Page
Contents What Types of Trucks Are in Each Truck Class? ........................................................................... 115 Heaviest Trucks Consume an Average of 6.5 Gallons per Thousand Ton-Miles ......................... 116 United States Accounts for 63% of Medium/Heavy Truck Production in North America ........... 117 Medium and Heavy Truck Assembly Plants Are Located throughout the United States ............ 118 Few Medium/Heavy Trucks Are Imported from Outside North America ................................... 119 Class 3 Truck Sales Have Increased by 33% from 2012 to 2016 .................................................. 120 Class 4-7 Truck Sales Increased by 38% from 2012 to 2016 ........................................................ 121 Class 8 Truck Sales Decreased 23% from 2015 to 2016 .............................................................. 122 Diesel Engine Use Declines 70% for Class 4 Trucks and Increases 4% for Class 6 Trucks ............ 123 Many Heavy Truck Manufacturers Supply Their Own Diesel Engines ......................................... 124 Cummins Leads Heavy Truck Diesel Engine Market .................................................................... 125 Combination Trucks Average Almost 62,000 Miles per Year ...................................................... 126 Study Conducted of Class 8 Trucks at Steady Speed on Flat Terrain ........................................... 127 Roadway Grade Affects Fuel Economy of Class 8 Trucks ............................................................ 128 Idle Fuel Consumption Varies by Type of Truck .......................................................................... 129 Truck Stop Electrification Reduces Idle Fuel Consumption ......................................................... 130 SuperTruck Project Exceeds 12 Miles per Gallon ........................................................................ 131

CHAPTER 4 2016 VEHICLE TECHNOLOGIES HEAVY TRUCKS 114 MARKET REPORT
This page intentionally left blank.
2016 VEHICLE TECHNOLOGIES CHAPTER 4 MARKET REPORT 115 HEAVY TRUCKS
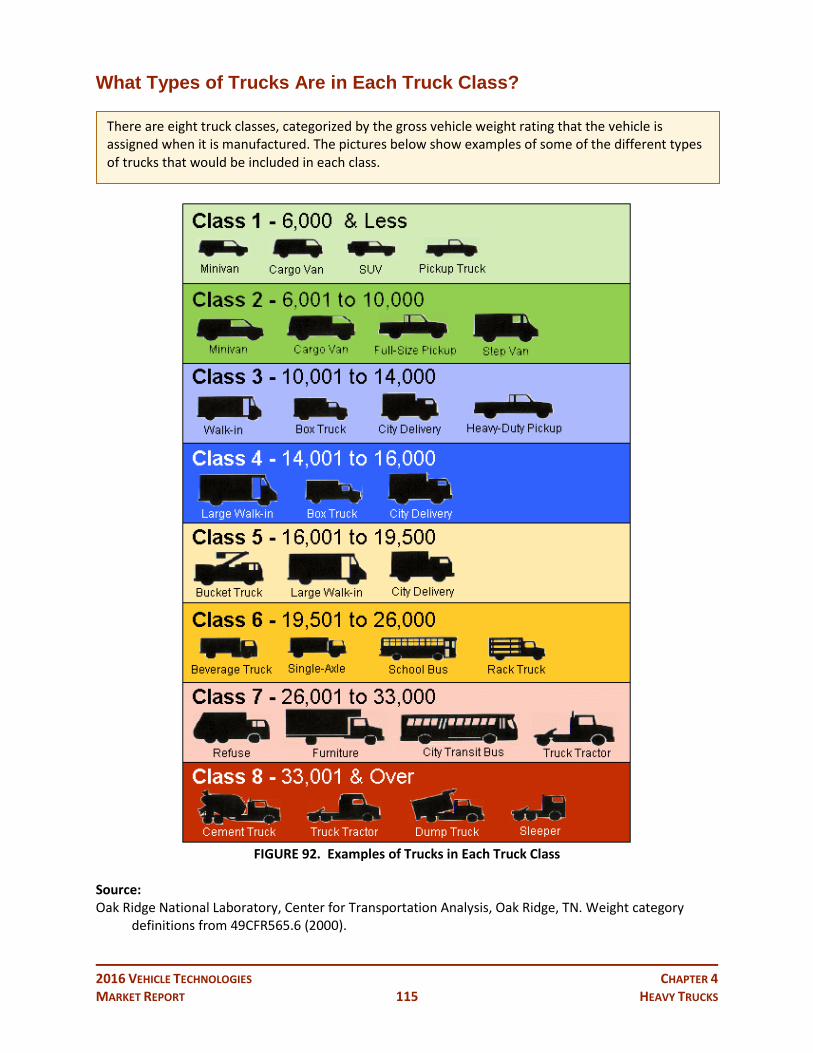
What Types of Trucks Are in Each Truck Class?
FIGURE 92. Examples of Trucks in Each Truck Class
Source: Oak Ridge National Laboratory, Center for Transportation Analysis, Oak Ridge, TN. Weight category
definitions from 49CFR565.6 (2000).
There are eight truck classes, categorized by the gross vehicle weight rating that the vehicle is assigned when it is manufactured. The pictures below show examples of some of the different types of trucks that would be included in each class.

CHAPTER 4 2016 VEHICLE TECHNOLOGIES HEAVY TRUCKS 116 MARKET REPORT
Heaviest Trucks Consume an Average of 6.5 Gallons per Thousand Ton-Miles
TABLE 26. Typical Weights and Fuel Use by Truck Class
Class Applications
Gross Weight Range
(lb)
Empty Weight Range
(lb)
Typical Payload Capacity
Max (lb)
Typical Fuel
Economy Range in
2007 (mpg)
Typical Fuel
Consumed (gallons per
thousand ton-miles)
1c Cars only 3,200 -6,000
2,400 - 5,000
250 -1,000 25-33 69.0
1t Minivans, Small SUVs, Small Pickups
4,000 -6,000
3,200 - 4,500
250 - 1,500 20-25 58.8
2a Large SUVs, Standard Pickups 6,001 -8,500
4,500 - 6,000
250 - 2,500 20-21 38.5
2b Large Pickups, Utility Van, Multi-Purpose, Mini-Bus, Step Van
8,501 -10,000
5,000 - 6,300 3,700 10-15 38.5
3 Utility Van, Multi-Purpose, Mini-Bus, Step Van
10,001 -14,000
7,650 - 8,750 5,250 8-13 33.3
4 City Delivery, Parcel Delivery, Large Walk-In, Bucket, Landscaping
14,001 -16,000
7,650 - 8,750 7,250 7-12 23.8
5 City Delivery, Parcel Delivery, Large Walk-In, Bucket, Landscaping
16,001 -19,500
9,500 - 10,800 8,700 6-12 25.6
6 City Delivery, School Bus, Large Walk-In, Bucket
19,501 -26,000
11,500 - 14,500 11,500 5-12 20.4
7
City Bus, Furniture, Refrigerated, Refuse, Fuel Tanker, Dump, Tow, Concrete, Fire Engine, Tractor-Trailer
26,001 -33,000
11,500 - 14,500 18,500 4-8 18.2
8a Straight Trucks, e.g., Dump, Refuse, Concrete, Furniture, City Bus, Tow, Fire Engine
33,001 -80,000
20,000 - 34,000
20,000 - 50,000 2.5-6 8.7
8b
Combination Trucks, e.g., Tractor-Trailer: Van, Refrigerated, Bulk Tanker, Flat Bed
33,001 -80,000
23,500 - 34,000
40,000 - 54,000 4-7.5 6.5
Source: The National Academies, Technologies and Approaches to Reducing the Fuel Consumption of Medium-
and Heavy-Duty Vehicles, 2010. http://www.nap.edu/catalog.php?record_id=12845
There are eight truck classes, categorized by the gross vehicle weight rating (GVWR) that the vehicle is assigned when it is manufactured. Cars and small pickups, vans, and sport-utility vehicles (SUVs) are shown here for comparison. Two truck classes are further subdivided into “a” and “b” designations. Class 2a and 2b are subdivided based on GVWR. Class 8a and 8b are subdivided based on the truck design (straight truck vs. combination truck).

2016 VEHICLE TECHNOLOGIES CHAPTER 4 MARKET REPORT 117 HEAVY TRUCKS
United States Accounts for 63% of Medium/Heavy Truck Production in North America
TABLE 27. North American Production of Medium and Heavy Trucks by Manufacturer, 2015
Manufacturer
Thousands of Trucks U.S. Share
of Total United States Mexico Canada Total
Ford 75.3 0.0 0.0 75.3 100% Freightliner & Western Star 77.8 93.3 0.0 171.1 45% Kenworth 37.5 15.8 14.3 67.6 55% Volvo 38.7 0.2 0.0 38.9 99% Peterbilt 32.9 0.0 0.0 32.9 100% Mack 27.0 0.0 0.0 27.0 100% International 18.2 39.1 0.0 57.3 32% Hino 9.5 0.5 0.0 10.0 95% Isuzu 5.0 0.0 0.0 5.0 100% Blue Diamond 0.0 7.7 0.0 7.7 0% Dina Camiones 0.0 1.4 0.0 1.4 0% FCA 0.0 18.5 0.0 18.5 0% MAN 0.0 1.2 0.0 1.2 0% Total 321.9 177.7 14.3 513.9 63%
Note: Includes truck Classes 4 through 8. Source: Ward’s Automotive Group. http://wardsauto.com
Nearly 322,000 medium/heavy trucks (Classes 4-8) were produced in the United States in 2015, which is 63% of North American production. Mexico also produced a large number of trucks (35%). The top two producers, Freightliner and Ford, made both medium and heavy trucks. FCA produced medium trucks in Mexico only. Kenworth was the only manufacturer of medium/heavy trucks in Canada.

CHAPTER 4 2016 VEHICLE TECHNOLOGIES HEAVY TRUCKS 118 MARKET REPORT
Medium and Heavy Truck Assembly Plants Are Located throughout the United States
FIGURE 93. Medium and Heavy Truck Manufacturing Plants by Location, 2016
Note: Includes truck Classes 4 through 8. Source: Ward’s Automotive Group. http://wardsauto.com
There are seven major manufacturers of Class 7 and 8 trucks in the United States–Freightliner/Western Star, Hino, International, Kenworth, Mack, Peterbilt and Volvo. Two of those, Freightliner and International, also manufacture medium trucks (Classes 4-6), along with Ford, Isuzu, and Sprinter/Daimler. Thomas and NEOPLAN manufacture buses. Most of the manufacturing plants are in the Eastern third of the United States. In 2015, Ford moved the production of medium trucks back to the United States from Mexico.

2016 VEHICLE TECHNOLOGIES CHAPTER 4 MARKET REPORT 119 HEAVY TRUCKS
Few Medium/Heavy Trucks Are Imported from Outside North America
FIGURE 94. Share of Medium and Heavy Trucks Imported from Outside North America, 1980-2016
FIGURE 95. Medium and Heavy Trucks Sold by Source and Weight Class, 2016
Source: Ward’s Automotive Group. http://wardsauto.com
Sales of Class 4-8 trucks are overwhelmingly vehicles that are made in North America. Almost 40% of Class 4 trucks and 11% of Class 5 trucks were imported from outside of North America in 2016. There were no imported Class 6, 7, or 8 trucks sold. Historically the import truck market share peaked in 1987 at 7.1% and after much volatility the overall import share was 3.4% in 2016.
CHAPTER 4 2016 VEHICLE TECHNOLOGIES HEAVY TRUCKS 120 MARKET REPORT
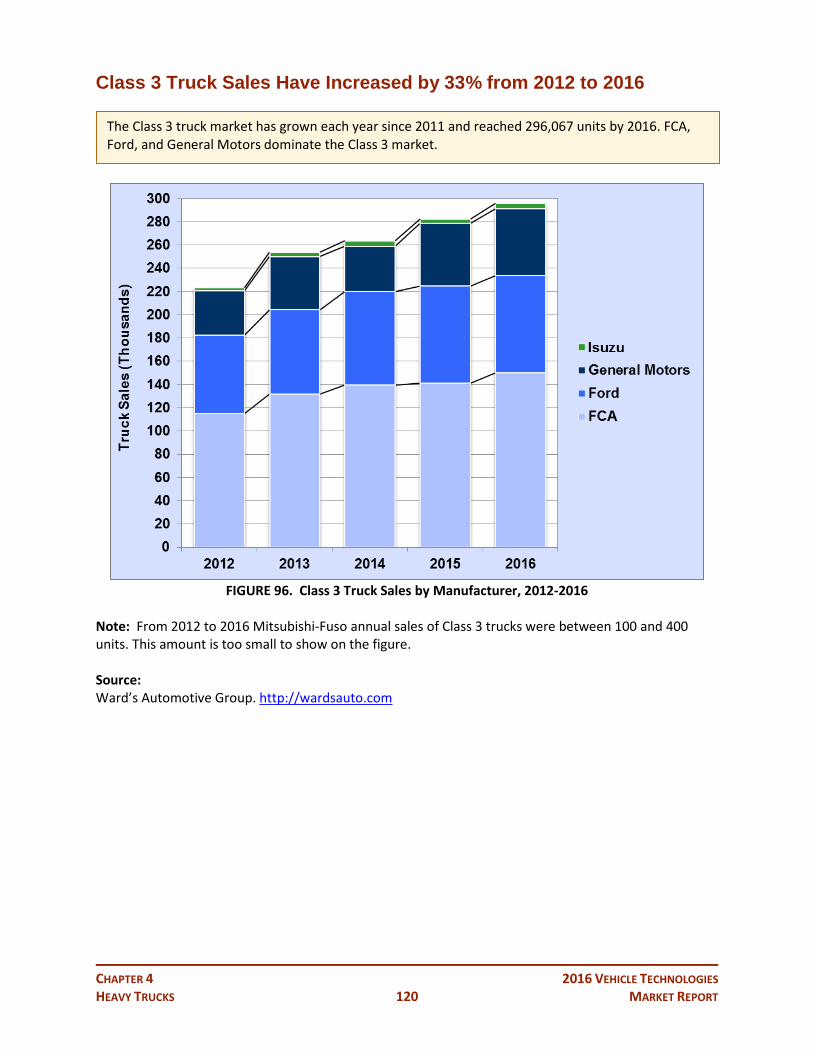
Class 3 Truck Sales Have Increased by 33% from 2012 to 2016
FIGURE 96. Class 3 Truck Sales by Manufacturer, 2012-2016
Note: From 2012 to 2016 Mitsubishi-Fuso annual sales of Class 3 trucks were between 100 and 400 units. This amount is too small to show on the figure. Source: Ward’s Automotive Group. http://wardsauto.com
The Class 3 truck market has grown each year since 2011 and reached 296,067 units by 2016. FCA, Ford, and General Motors dominate the Class 3 market.

2016 VEHICLE TECHNOLOGIES CHAPTER 4 MARKET REPORT 121 HEAVY TRUCKS
Class 4-7 Truck Sales Increased by 38% from 2012 to 2016
FIGURE 97. Class 4-7 Truck Sales by Manufacturer, 2012-2016
Note: From 2011 to 2013 UD and GM trucks sold 1,000 units or less annually. This amount is too small to show on the figure. Source: Ward’s Automotive Group. http://wardsauto.com
The Class 4 truck market has grown to over 208,000 units in 2016. Many of the manufacturers doubled their sales of Class 4-7 trucks from 2012 to 2016, including Hino, FCA, Ford, Isuzu and Kenworth. The only manufacturers with declining sales in this period were International and Mitsubishi-Fuso.

CHAPTER 4 2016 VEHICLE TECHNOLOGIES HEAVY TRUCKS 122 MARKET REPORT
Class 8 Truck Sales Decreased 23% from 2015 to 2016
FIGURE 98. Class 8 Truck Sales by Manufacturer, 2012-2016 Note: From 2012 to 2016 sales of Class 8 trucks by “other” manufacturers were about 100 units annually. This amount is too small to show on the figure. Source: Ward’s Automotive Group. http://wardsauto.com
Class 8 truck sales had grown to almost 249,000 units in 2015—the highest in the five-year period. The market shares by manufacturer were relatively steady from 2012 to 2016, with Freightliner gaining, International losing, and all the rest staying nearly the same. The decline in Class 8 sales from 2015 to 2016 was the largest decline in the five-year period at 23%.

2016 VEHICLE TECHNOLOGIES CHAPTER 4 MARKET REPORT 123 HEAVY TRUCKS
Diesel Engine Use Declines 70% for Class 4 Trucks and Increases 4% for Class 6 Trucks
FIGURE 99. Share of Diesel Truck Sales by Class, 2011 and 2015
Note: These shares were derived using factory sales of trucks. Source: Ward’s Automotive Group. http://wardsauto.com
Although Class 8 trucks are nearly always 100% diesel trucks, Classes 3-7 often vary in gasoline to diesel sales shares from one year to another. In 2011, when truck sales of all classes were low, Classes 4, 5, and 6 each had more than 80% diesel sales share. By 2015, the diesel share of Class 6 trucks was 98%, Class 5 trucks held steady at 80%, and Class 4 fell to 24%. The only class to increase diesel sales share from 2011 to 2015 was Class 6.

CHAPTER 4 2016 VEHICLE TECHNOLOGIES HEAVY TRUCKS 124 MARKET REPORT
Many Heavy Truck Manufacturers Supply Their Own Diesel Engines
TABLE 28. Diesel Engine Suppliers by Manufacturer, 2015 Make Engine Manufacturer Share Freightliner Cummins 58.7% Detroit Diesel 40.9% Mercedes Benz 0.4% Total 100.0% Hino Hino 100.0% International Cummins 65.6% Navistar 34.4% Total 100.0% Kenworth Cummins 59.7% PACCAR 40.3% Total 100.0% Mack Cummins 6.2% Mack 93.8% Total 100.0% Peterbilt Cummins 57.6% PACCAR 42.4% Total 100.0% Volvo Cummins 7.9% Volvo 92.1% Total 100.0% Western Star Cummins 22.2% Detroit Diesel 77.6% Mercedes Benz 0.2% Total 100.0% Other Cummins 100.0%
Note: International’s parent company is Navistar. Kenworth’s and Peterbilt’s parent company is PACCAR. Source: Ward’s Automotive Group. http://wardsauto.com
Though many medium and heavy truck manufacturers (Classes 4-8) also manufacture their own engines, others purchase engines from engine manufacturers. Cummins supplies diesel engines for Freightliner, International, Kenworth, Mack, Peterbilt, Volvo, and Western Star. Hino builds its own diesel engines.

2016 VEHICLE TECHNOLOGIES CHAPTER 4 MARKET REPORT 125 HEAVY TRUCKS
Cummins Leads Heavy Truck Diesel Engine Market
FIGURE 100. Diesel Engine Manufacturers Market Share, 2011 and 2015
Source: Ward’s Automotive Group. http://wardsauto.com
Cummins held just over 40% of the heavy truck diesel engine market over the last five years. Navistar held a 20% market share in 2011, but declined to under 3% of the market in 2015.

CHAPTER 4 2016 VEHICLE TECHNOLOGIES HEAVY TRUCKS 126 MARKET REPORT
Combination Trucks Average Almost 62,000 Miles per Year
FIGURE 101. Vehicle-Miles of Travel and Fuel Economy for Heavy Truck Population, 2011-2015
Note: A combination truck is a truck-tractor that is used in combination with one or more trailers. A single-unit truck is a truck on a single frame, such as a dump truck or utility truck. Source: U.S. Department of Transportation, Federal Highway Administration, Highway Statistics 2015, Table
VM-1, 2017. http://www.fhwa.dot.gov/policyinformation/statistics/2015
According to the latest Federal Highway Administration estimates, the average miles traveled per truck was almost 62,000 miles for a combination truck in 2015, down from over 68,000 miles in 2013. Because heavy truck duty-cycles vary, these averages have large standard deviations. Heavy single-unit trucks (above 10,000 lb and having at least six tires) were driven significantly fewer miles, because they are typically driven locally. The average fuel economy of single-unit trucks was 7.4 miles per gallon (mpg) in 2015 while the combination truck fuel economy was 5.9 mpg. The combination trucks typically have larger engines to carry heavier loads than the single-unit trucks.

2016 VEHICLE TECHNOLOGIES CHAPTER 4 MARKET REPORT 127 HEAVY TRUCKS
Study Conducted of Class 8 Trucks at Steady Speed on Flat Terrain
TABLE 29. Fuel Efficiency of Class 8 Trucks by Vehicle Weight Range on Flat Terrain at 65 mph Loaded Weight
Range of Tested Trucks
(Pounds)
Average Weight
(Pounds)
Distance Traveled (Miles)
Diesel Fuel
Consumed (Gallons)
Fuel Efficiency (Miles per
Gallon)
Fuel Efficiency (Ton-miles per Gallon)
Average Speed (mph)
20,000-30,000 21,222 51.4 5.4 9.5 101 65.0 30,000-40,000 34,285 505.9 53.0 9.5 164 65.0 40,000-50,000 44,911 537.8 58.7 9.2 206 65.0 50,000-60,000 55,468 541.2 63.3 8.6 237 64.9 60,000-70,000 66,558 1,356.9 171.9 7.9 263 65.0 70,000-80,000 73,248 1,363.1 172.3 7.9 290 65.0
FIGURE 102. Fuel Efficiency of Class 8 Trucks by Vehicle Weight Range on Flat Terrain at 65 mph
Note: Ton-miles per gallon calculated as average weight multiplied by miles per gallon. Source: Franzese, Oscar, Effect of Weight and Roadway Grade on the Fuel Economy of Class-8 Freight Trucks,
Oak Ridge National Laboratory, ORNL/TM-2011/471, October 2011. http://cta.ornl.gov/cta/Publications/Reports/ORNL_TM_2011_471.pdf
A study conducted by Oak Ridge National Laboratory outfitted Class 8 trucks with monitoring equipment which tracked the weight, speed, and fuel efficiency of the truck along with the global position of the truck. Using only data where the roadway grade was 1% to -1% grade (flat terrain) the study showed the difference in fuel efficiency for different truck weights at the speed of 65 miles per hour (mph).
CHAPTER 4 2016 VEHICLE TECHNOLOGIES HEAVY TRUCKS 128 MARKET REPORT
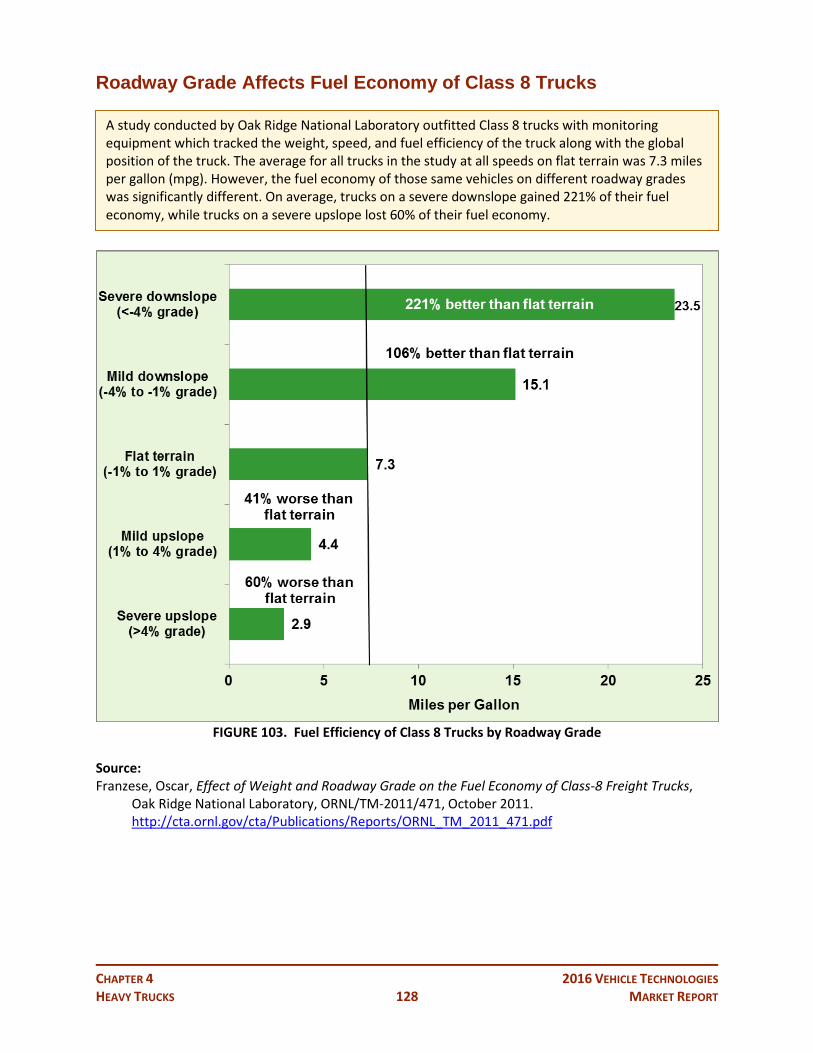
Roadway Grade Affects Fuel Economy of Class 8 Trucks
FIGURE 103. Fuel Efficiency of Class 8 Trucks by Roadway Grade
Source: Franzese, Oscar, Effect of Weight and Roadway Grade on the Fuel Economy of Class-8 Freight Trucks,
Oak Ridge National Laboratory, ORNL/TM-2011/471, October 2011. http://cta.ornl.gov/cta/Publications/Reports/ORNL_TM_2011_471.pdf
A study conducted by Oak Ridge National Laboratory outfitted Class 8 trucks with monitoring equipment which tracked the weight, speed, and fuel efficiency of the truck along with the global position of the truck. The average for all trucks in the study at all speeds on flat terrain was 7.3 miles per gallon (mpg). However, the fuel economy of those same vehicles on different roadway grades was significantly different. On average, trucks on a severe downslope gained 221% of their fuel economy, while trucks on a severe upslope lost 60% of their fuel economy.

2016 VEHICLE TECHNOLOGIES CHAPTER 4 MARKET REPORT 129 HEAVY TRUCKS
Idle Fuel Consumption Varies by Type of Truck
FIGURE 104. Fuel Consumption at Idle for Selected Gasoline and Diesel Vehicles
Note: Data may not be directly comparable among vehicle types. Argonne National Laboratory compiled the data from several different studies. See the Idling Reduction Savings Calculator for information on the individual studies. Source: Argonne National Laboratory, Idling Reduction Savings Calculator, accessed March 2017. http://www.anl.gov/sites/anl.gov/files/idling_worksheet.pdf,
Based on a worksheet developed by Argonne National Laboratory, the idle fuel consumption rate for selected gasoline and diesel vehicles with no load (no use of accessories such as air conditioners, fans, etc.) varies widely. These data were collected from a variety of studies, thus some of the data may not be directly comparable. In general, the transit bus consumed the most fuel while idling – nearly 1 gallon per hour (gal/hr). The gasoline medium heavy truck category with a gross vehicle weight (GVW) of 19,700-26,000 lb consumed more fuel at idle than the diesel medium heavy truck category at 23,000-33,000 lb GVW. By comparison, a compact sedan using diesel or gasoline uses less than 0.2 gal/hr when idling.

CHAPTER 4 2016 VEHICLE TECHNOLOGIES HEAVY TRUCKS 130 MARKET REPORT
Truck Stop Electrification Reduces Idle Fuel Consumption
FIGURE 105. Map of Truck Stop Electrification Sites, 2017
TABLE 30. Number of Truck Stop Electrification Sites by State, 2017
State Number of Sites State
Number of Sites
Alabama 1 Missouri 2 Arizona 2 Montana 1 Arkansas 3 Nebraska 2 California 7 New Jersey 2 Colorado 2 New Mexico 2 Delaware 2 New York 4 Florida 2 North Carolina 2 Georgia 5 Ohio 6 Illinois 1 Oregon 5 Iowa 1 Pennsylvania 6 Kansas 1 South Carolina 3 Kentucky 1 Tennessee 7 Louisiana 2 Texas 16 Maine 1 Utah 4 Maryland 1 Virginia 3 Michigan 2 Washington 4 Minnesota 1 Wyoming 2 Mississippi 1 Total 106
Source: Alternative Fuels and Advanced Vehicles Data Center. (Data through 2/28/17). http://www.afdc.energy.gov/afdc/tse_locator
The U.S. Department of Transportation mandates that truckers rest for 10 hours after driving for 11 hours, during which time they often park at truck stops idling the engines to provide heating, cooling and use of electrical appliances. Electrification at truck stops allows truckers to “plug-in” vehicles to operate the necessary systems without idling the engine. There are currently 106 publicly accessible electrification sites across the nation. Some of these sites require special equipment to be installed on the truck and others do not. Presently, four companies equip electrification sites: Shorepower, CabAire, American Idle, and IdleAir.

2016 VEHICLE TECHNOLOGIES CHAPTER 4 MARKET REPORT 131 HEAVY TRUCKS
SuperTruck Project Exceeds 12 Miles per Gallon
Photo by Jim Park.
FIGURE 106. Changes in Fuel Economy and Freight Efficiency for the SuperTruck Project, September 2016
Source: Heavy Duty Trucking, Truckinginfo.com, “Volvo’s Supertruck Demonstrates the Art of the Possible,”
November 2016.
The U.S. Department of Energy partnered with industry to explore fuel economy improvements for class 8 trucks. In September 2015, the Volvo Trucks, USA, team announced that their fully-loaded class 8 truck achieved a fuel economy of more than 12 miles per gallon, which was a 70% increase in fuel economy and an 88% gain in freight efficiency in testing against a 2009 baseline truck.
CHAPTER 4 2016 VEHICLE TECHNOLOGIES HEAVY TRUCKS 132 MARKET REPORT
This page intentionally left blank.