chapter 3 studies on stub and short...
TRANSCRIPT

30
CHAPTER 3
STUDIES ON STUB AND SHORT COLUMNS
3.1 GENERAL
The design of light gauge steel hollow members in-filled with
ordinary concrete are normally carried out on the basis of provisions
prescribed by different codes of practices. Due to huge variations in the
properties of the in-filled concrete and the complexity in the interaction that
occurs between the concrete and the outer shell, it frequently makes an
uneconomical design of members and systems completely on theoretical
basis. Also when adequate analytical design procedures are not available for
the member or composites, the testing of the components are recommended.
The behaviour of composite columns and beams can often be ascertained
experimentally and suitable modifications can be incorporated, wherever
necessary.
Current design theories assume full bond between the steel shell
and the concrete core to simplify the determination of the ultimate moment of
resistance. However, in reality slippage at the steel-concrete interface is
inevitable after the tensile cracking of the core concrete. For a better
understanding of the complex interface behaviour, experimental and
analytical investigations are more effective. Push out resistance tests on
concrete are used to determine the bond slip characteristics between outer
steel shell and in-filled concrete through the load versus slip response, which
can also be used to evaluate the overall performance of the concrete-filled

31
steel sections. A better understanding is needed on the force transfer
mechanism between steel and concrete when large rotations and buckling
occur.
In the present investigation, a series of experiments were carried
out to study the behaviour of hollow, PCC in-filled and three varieties of
SFRC in-filled stub, short, medium columns and beams with emphasizes on
the ultimate strength, ductility, axial deformations, lateral deflections and
post failure strength reserve in elastic as well as in the plastic ranges with a
focus on the bond between steel and concrete. An effort has also been made
to compare the experimental and theoretical results with the results obtained
using numerical models.
Out of eighty eight specimens prepared for the experimental study,
seventy eight tests are conducted on columns and ten tests are conducted on
beams. The columns are subjected to axial load and uni-axial and bi-axial
eccentric loads. The beams are subjected to one third point loads about its
major and minor axes. The effects of provision of the in-fill, the eccentricity
of the load, the flat width to thickness ratio and the slenderness ratio on the
load carrying capacities of the columns and beams are studied.
3.2 MATERIAL CHRACTERISTICS
3.2.1 Steel Section
The hollow sections were made from light gauge steel sheets,
continuously welded at the middle along its length. The light gauge steel
sections are shown in Figure 3.1. The size of the steel sections are 100 mm ×
50 mm and 2 mm thick.

32
i) Specimens ii) Cleaning for oil, Grease and grit
Figure 3.1 Test specimens
In order to determine the actual material properties, three steel
coupons were cut from all the four faces of these sections and tested to failure
under tension as per ASTM-A370 specification. Figure 3.2 shows the details
of the specimen for the tension coupons. The test set up is shown in
Figure 3.3. The yield strength of the light gauge steel is determined either by
the offset method or the strain under load method. Offset method is used
generally for gradual yielding steel and it is used to calculate the yield
strength of the material. In the offset method, the yield strength is the stress
corresponding to the intersection of the stress-strain curve and a line parallel
to the initial straight-line portion offset by a specified strain. The offset is
usually specified as 0.2 percent. The typical stress-strain behaviour of the
tensile coupon test is shown in Figure 3.4.
From the tests, the following average values were obtained. Yield
stress fy = 270 N/mm2, Ultimate stress fu = 410 N/mm
2, Elongation = 13%
and the Modulus of Elasticity = 2.05 × 10⁵
N/mm2. To prevent the local
buckling failure of the specimens, the allowable B/t ratio of the steel hollow

33
sections to be used is given by B/t ≤ 52 (235/fy) ½
, as prescribed by
Eurocode4 -1994. The specimens maximum B/t ratio is 46 and the value of
52 (235/fy) ½
for the test specimens are 48.51, hence the chosen sections
satisfy the above requirements and therefore all the specimens can be
classified as compact sections.
Figure 3.2 Details of tension coupons
Figure 3.3 Test set up for tension coupons

34
0
100
200
300
400
500
0 1000 2000 3000 4000 5000 6000
Strain (Micro mm/mm)
Str
es
s (
Mp
a)
specimen 1
specimen 2
specimen 3
Figure 3.4 Stress-strain behaviour of tensile coupons
3.2.2 Plain Cement Concrete
The concrete mix was designed for a cube compressive strength of
20 MPa at 28 days. The design mix of 1:2.09:2.25 with a w/c ratio of 0.49,
using 12.5 mm size (max.) coarse aggregate and 2.36mm (max.) size fine
aggregate was used as per ACI committee 211.1.1991 recommendations. The
PCC and SFRC for the composite columns were mixed in two separate
batches. From the concrete mix, concrete cubes and cylinders were prepared
and tested in compression to obtain the actual material properties. The test
setup is shown in Figure 3.5 and the stress-strain curves for all types of
concrete are shown in Figure 3.6. The material properties of PCC and SFRC
are listed in Table 3.1.
3.2.3 Steel Fiber Reinforced Concrete (SFRC)
To prepare the SFRC in-filled steel composite columns, three
different volume fractions of steel fibers were chosen viz., 0.75%, 1.00% and
1.25%. Crimped steel fibers having an aspect ratio of 70 (lf = 30.80 mm and

35
df = 0.44mm) were used for this purpose. The material properties of SFRC
are listed in Table 3.1. It has been shown that it was possible to relate the
mechanical properties of fiber reinforced concrete to the fundamental
properties of the fibers, such as diameter, length, and percentage in the matrix
material, shape, bond characteristics and tensile strength. The weight
percentage of fibers in the matrix material ranges from 0 to 6%, which
corresponds to about 0 to 150 kg of fibers per cubic meter of concrete. An
attempt has been made to study the optimum volume fraction for the chosen
type of fiber for in-filled columns. The experimental characteristics of SFRC
are compared with the theoretical values.
The expression for the compressive strength of fiber-reinforced
concrete fcf proposed by Nataraja et al is presented in equation (3.1).
fcf = fc + 2.1604 ( Wf lf / df ) (3.1)
where Wf = weight percentage of fibers
In contrast to plain cement concrete for which most structural
codes assume negligible resistance in tension, fiber reinforced concrete has,
at the ultimate stage, a residual tensile strength ftu given by Soroushan and
Lee is
ftu = 2 η1η0 τ Vf lf / df (3.2)
where η1 an effectiveness factor of the form of fibers given by
η1 = (τ / σfu ) (lf / df ) (3.3)
η0 = distribution factor of fibers (= 0.41 for random distribution
of fibers in a three dimensional space)
τ = bond strength of fibers (2 ~ 6 MPa)
Vf = volume percentage of fibers

36
The average elastic tangent modulus in compression Ecf of fiber
reinforced concrete is given by Bentur and Mindess as,
Ecf = γ Vf Ef + ( 1 – Vf ) Ec (3.4)
Ef = modulus of elasticity of fibers
where the correlation factor γ = ( )r f f
r f f
tanh n l / d1
n l / d
η −
(3.5)
In the above, the dimensionless co-efficient nr is given by
nr = c
f c e f
2E
E (1 ) log ( 1 V )+ ν + (3.6)
The modulus of elasticity Ec of confined concrete (Eurocode2) is
Ec = 9500 (fc + 8 )⅓ (3.7)
Using equations (3.1), (3.2) and (3.3), the compressive and residual
tensile strength of SFRC are calculated. The elastic tangent modulus and
Modulus of elasticity of confined concrete are calculated using equations
(3.4), (3.5), (3.6) and (3.7). All the values are presented in Table 3.1.

37
Table 3.1. Material properties of PCC and SFRC
Sl.
No.
Type
of in-fill
Cube
Strength
N/mm2
Cylinder
Strength
N/mm2
Cylinder
Strength
(Nataraja
et al.)
N/mm2
Flexural
Strngth
N/mm2
Spilit
Tensile
Strength
N/mm2
Residual
Tensile
Strength
(Soroushian
et al.)
N/mm2
Youngs
Modulus
(Ec)
(by Test)
(x104)
N/mm2
1 Plain
Cement
Concrete
32.44 26.65 --
4.24 4.10 -- 2.968
2 0.75%
Steel Fiber
Reinforced
Concrete
41.78 34.97 27.95
4.94 5.15 1.59 3.230
3 1.00%
Steel Fiber
Reinforced
Concrete
57.78 47.19 28.34
5.86 6.55 2.13 3.800
4 1.25%
Steel Fiber
Reinforced
Concrete
38.60 31.64 28.81
4.40 5.10 2.66 3.109
Figure 3.5 Test set up for calculation of stress-strain behaviour of
concrete

38
0
10
20
30
40
50
0 0.002 0.004 0.006 0.008
Micro strain
Str
ess
(N/m
m2)
PCC
0.75% SFRC
1% SFRC
1.25% SFRC
Figure 3.6 Stress strain behaviour of concrete
3.3 TEST SPECIMENS
The cross section of the steel sections is shown in Figure 3.7.
The thickness of the steel tube is 2 mm
The geometrical properties of the section
are given below.
Figure 3.7 Cross section details of the test specimen
Area of steel tube = 566.80 mm2
Area of in-filled concrete = 4433.20 mm2
Moment of Inertia (Ixx) = 73.1982 × 104mm
4
Moment of Inertia (Iyy) = 25.194 × 104 mm
4
For the composite sections equivalent areas are
calculated and listed in Table 3.2.
X X
100 mm
50 mm
Y
Y

39
Table 3.2 Equivalent area of the test specimens
Sl.
No. Description
Concrete converted to
Steel
Steel converted to
Concrete
PCC
1 Area of Steel 1197.44 mm2 --
2 Area of Concrete -- 8619.63 mm2
3 Ixx 1.246 × 106 mm
4 8.9712 × 10
6 mm
4
4 Iyy 3.7199 × 10⁵
mm4 2.6714 × 10
6 mm
4
5 rxx 32.26 mm 32.21 mm
6 ryy 17.60 mm 17.60 mm
0.75% SFRC
1 Area of Steel 1281.73 mm2 --
2 Area of Concrete -- 8122.61 mm2
3 Ixx 1.311 × 106 mm
4 8.31 × 10
6 mm
4
4 Iyy 3.857 × 105 mm
4 2.45 × 10
6 mm
4
5 rxx 31.98 mm 31.98 mm
6 ryy 17.36 mm 17.36 mm
1.00% SFRC
1 Area of Steel 1402.57 mm2 --
2 Area of Concrete -- 7566.64 mm2
3 Ixx 1.404 × 106 mm
4 7.57 × 10
6 mm
4
4 Iyy 4.073 × 105 mm
4 2.197 × 10
6 mm
4
5 rxx 31.98 mm 31.64 mm
6 ryy 17.04 mm 17.04 mm
1.25% SFRC
1 Area of Steel 1255.23 mm2 --
2 Area of Concrete -- 8266.90 mm2
3 Ixx 1.291 × 106 mm
4 8.50 × 10
6 mm
4
4 Iyy 3.81 × 105 mm
4 2.512 × 10
6 mm
4
5 rxx 32.07 mm 32.07 mm
6 ryy 17.42 mm 17.42 mm

40
3.4 TEST SERIES
The details of experiments conducted is presented in Figures 3.8
to 3.12.
Figure 3.8 Detail of the experiments conducted on stub columns
Figure 3.9 Detail of the experiments conducted on short column
WITHOUT INFILLS WITH INFILLS
TYPE (A) -
HOLLOW SECTION
TYPE (B) – PCC
TYPE (C) – 0.75% SFRC
TYPE (D) –1.00% SFRC
TYPE (E) – 1.25% SFRC
COLD FORM HOLLOW AND INFILLED COLUMNS
Number of Experiments: 5
COLD FORM HOLLOW AND INFILLED COLUMNS
WITHOUT INFILLS WITH INFILLS
TYPE (A) -
HOLLOW SECTION
TYPE (B) – PCC
TYPE (C) – 0.75% SFRC
TYPE (D) –1.00% SFRC
TYPE (E) – 1.25% SFRC
Number of Experiments : 5

41
Figure 3.10 Detail of the experiments conducted on axially and
eccentrically loaded medium columns
COLD FORM HOLLOW AND INFILLED COLUMNS
WITHOUT INFILLS WITH INFILLS
TYPE (A) -
HOLLOW SECTION
TYPE (B) – PCC
TYPE (C) – 0.75% SFRC
TYPE (D) –1.00% SFRC
TYPE (E) – 1.25% SFRC
AXIAL UNI-AXIAL
ex = 0.1B; ey = 0.1D
ex = 0.3B; ey = 0.3D
ex = 0.5B; ey = 0.5D
BI-AXIAL AXIAL UNI-AXIAL BI-AXIAL
ex = 0.1B ; ey = 0.1D
ex = 0.3B; ey = 0.3D
ex = 0.5B; ey = 0.5D
ex & ey =0.10B
& 0.10D
ex & ey = 0.30B
& 0.30D
ex & ey = 0.50B
& 0.50D
ex & ey = 0.10B
& 0.10D
ex & ey = 0.30B
& 0.30D
ex & ey = 0.50B
& 0.50D
Number of Experiments: 50

42
Figure 3.11 Detail of the experiments conducted to study the effect of
flat-width to thickness ratio on hollow and in-filled medium
columns
COLD FORM HOLLOW AND INFILLED COLUMNS
WITHOUT INFILLS WITH INFILLS
TYPE (A) - HOLLOW (Three types of section)
(i) 40 x 60 x 1.60 mm
(ii) 40 x 60 x 1.80 mm
(iii) 40 x 60 x 2.00 mm
TYPE (B) – PCC (Three types of section)
(i) 40 x 60 x 1.60 mm
(ii) 40 x 60 x 1.80 mm
(iii) 40 x 60 x 2.00 mm
TYPE (C) –1.00% SFRC (Three types of section)
(i) 40 x 60 x 1.60 mm
(ii) 40 x 60 x 1.80 mm
(iii) 40 x 60 x 2.00 mm
AXIAL UNI-AXIAL (0.10 ex)
AXIAL
UNI-AXIAL (0.10ex)
Number of Experiments: 18

43
Figure 3.12 Detail of the experiments conducted to study the flexural
behaviour of hollow and in-filled beams
COLD FORMED STEEL HOLLOW AND IN-FILLED BEAMS
MAJOR AXIS BENDING
5 No OF BEAMS
BEAMS WITH IN-FILLS
BEAMS WITHOUT IN-FILLS
TYPE A
TYPE B - PCC
TYPE C - 0.75% SFRC
TYPE D - 1.00% SFRC
TYPE E - 1.25% SFRC
MINOR AXIS BENDING
5 No OF BEAMS
Number of Experiments : 10
44
3.5 PUSH OUT TESTS
Push out tests were carried out to study the bond strength between
the steel sections and the in-fill. The test specimens for this test was 550 mm
in length and the concrete was poured to 500 mm length leaving a 50 mm gap
in which a groove of 7 mm in the form of a equilateral triangle had been
made at the end for relieving the air during testing. The test set-up is shown
in Figure 3.13. The load was applied through a steel plate, which rests
directly on concrete in small increments and the slip was observed using a
deflectometer as shown in the test set-up.
The slip was found to be very minimal indicating excellent bond
between the steel tube and the concrete up to the ultimate load. Beyond the
ultimate load, there was a rapid increase in the slip, indicating the sudden
reduction in bond. Due to increased characteristic compressive strength, the
bond strength was high for SFRC in-filled specimens when compared to PCC
in-filled specimens. The bond strength for PCC, 0.75% SFRC in-fill, 1%
SFRC in-fill and 1.25% SFRC in-fill are found to be 0.282 N/mm2, 0.389
N/mm2, 0.461 N/mm
2 and 0.318 N/mm
2, respectively. Compared to PCC in-
filled specimens, the SFRC in-filled specimens take about 63%more load
before slip. Tested specimens are shown in the Figure 3.14. According to
Eurocode4 (clause 4.8.2.7), the shear resistance provided by bond stresses
and friction at the interface or by mechanical shear connection for the
concrete in-filled hollow sections are given by 0.40 N/mm2 and the 1% SFRC
in-filled sections satisfy this condition well. . The load - slip characteristic of
the in-filled specimens are shown in Figure 3.15.

45
Figure 3.13 Test set up for push out test
Figure 3.14 Tested specimens of push out test
Push out test specimen
Displacement transducer

46
Type B
0
20
40
60
80
0 20 40 60
Slip ( mm )
Load
( k
N )
Type C
0
20
40
60
80
0 20 40 60
Slip ( mm )L
oad
( k
N )
a) PCC in-filled specimen b) 0.75% SFRC in-filled specimen
Type D
0
20
40
60
80
0 20 40 60
Slip ( mm )
Load
( k
N )
Type E
0
20
40
60
80
0 20 40 60
Slip ( mm )
Load
( k
N )
c) 1.00% SFRC in-filled specimen d) 1.25% SFRC in-filled specimen
Figure 3.15 Load-slip characteristics of in-filled specimens

47
3.6 TESTS ON STUB COLUMNS
Stub columns are specimens whose height is not less than three times
the largest dimension of the section and not more than twenty times the least
radius of gyration as prescribed in the IS: 801-1975. Tests on stub columns
were conducted on specimens to get their ultimate strength. In the present
investigation five stub columns (with slenderness ratios of 17.50) were tested.
3.6.1 Test Procedure
Rectangular hollow, PCC in-filled, 0.75%, 1.00% and 1.25% SFRC
in-filled stub columns were tested under axial load conditions. The test
specimen was placed centrally. The verticality of the stub column was ensured.
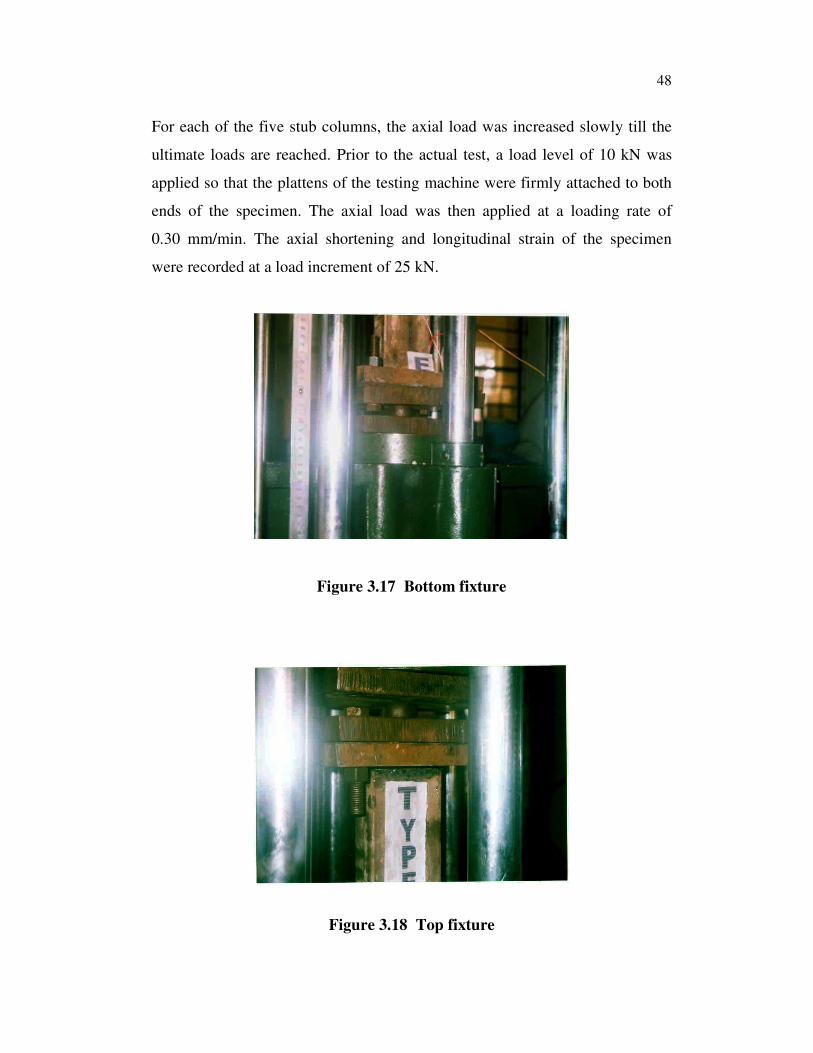
The test set up is shown in the Figure 3.16. Top and bottom fixture is shown
in Figures 3.17 and 3.18. To make hinged end condition steel balls are placed
on the grooved plates. Deflectometer is used to measure the axial shortening
and strain gauges are fixed at the longer face of the specimen to measure strain.
Figure 3.16 Test set up for stub column tests
Strain Gauge
Deflectometer
48
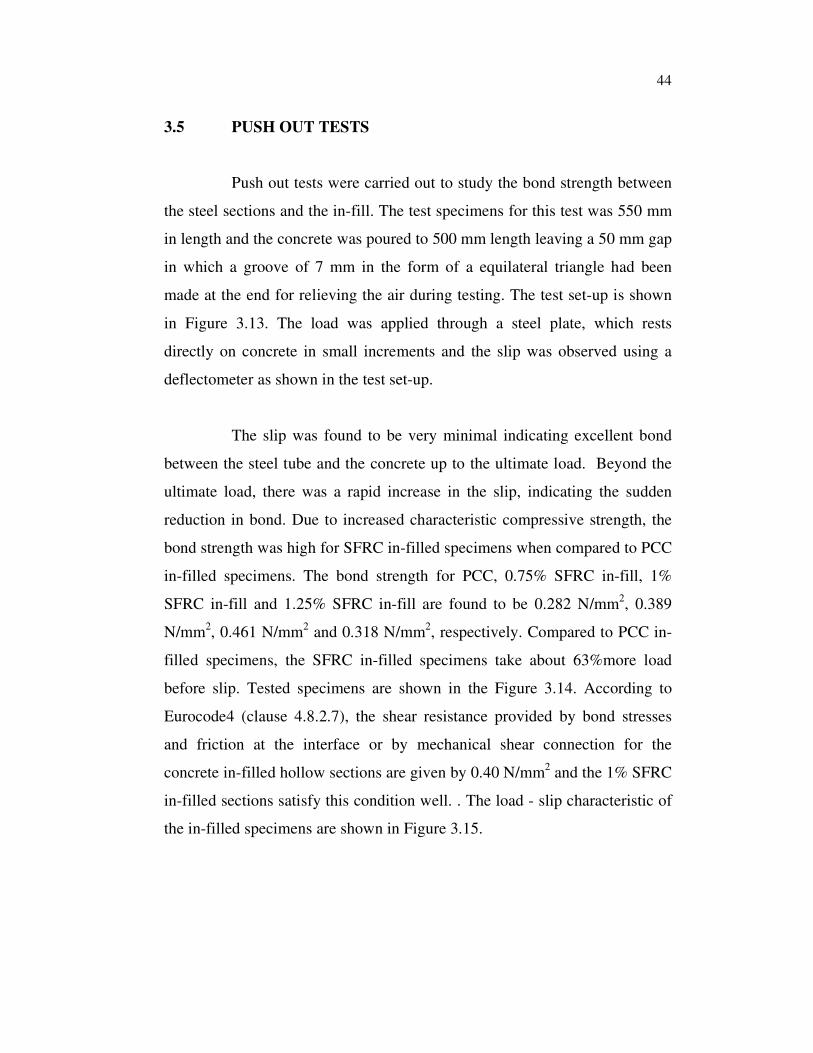
For each of the five stub columns, the axial load was increased slowly till the
ultimate loads are reached. Prior to the actual test, a load level of 10 kN was
applied so that the plattens of the testing machine were firmly attached to both
ends of the specimen. The axial load was then applied at a loading rate of
0.30 mm/min. The axial shortening and longitudinal strain of the specimen
were recorded at a load increment of 25 kN.
Figure 3.17 Bottom fixture
Figure 3.18 Top fixture

49
Figure 3.19 Tested specimens of the stub column
3.6.2 Failure Mode and Ultimate Loads
The failure mode is characterized by crushing of concrete and
outward bulging of the steel tubes at the bottom of the columns. Figure 3.19
shows the tested specimens. It is also observed that the PCC in-filled columns
are taking 53% more load than the hollow columns and SFRC in-filled columns
are taking 85% more load than the hollow columns. Compared with PCC in-
filled columns the SFRC in-filled columns are taking around 20% more load.
In general, comparing the capacity of all the columns, the 1% SFRC in-filled
columns have enhanced strength properties. The axial load carrying capacities
calculated from the expressions given by the various codes of practice were
compared with the experimental results for all the 5 specimens and are listed in
Table 3.3.
3.6.3 Comparison of Test Results with the Design codes
In this section, the experimental data are compared with the values
predicted by the design codes such as Eurocode4 and British code BS 5400.
According to Eurocode4, the axial load capacity (Nu) of CFT stub columns are

50
determined by summing up the strengths of the steel tube and the concrete core
as in equation (3.8). The EC4 is applicable to CFT stub columns with concrete
cylinder strength and steel yield stress not greater than 50 and 355MPa,
respectively.
Axial load capacity Nu = As fy + Ac fc’ (3.8)
As per the British code BS5400, the strength of the stub column is
determined using the equation (3.9). A coefficient of 0.675 was included in the
concrete cube strength to account for long-term and size effects of concrete
cube.
Axial load capacity Nc = As fy + 0.675Acfcu (3.9)
The axial load carrying capacity calculated using the expressions
given in codes are compared with the experimental results for all the
5 specimens and are listed in Table 3.3. It shows that the mean and standard
deviation of the theoretical load (Pthe) and experimental load (Pexp.) ratio for the
different design codes. The results show that BS5400 predicts the column
strength conservatively where as the EC4 predicts it slightly on the higher side.
The EC4 predicted around 7% more ultimate load than the experimental results
for in-filled columns and estimated 7.20% lower values for hollow columns.
The design strength predicted by BS5400 is nearer to the experimental values.
The code BS5400 gives a mean value of 0.969 and a standard deviation of
0.040 compared to the experimental values and is the best predictor and thus
are acceptable for the calculation of axial strength of SFRC in-filled stub
columns.
The comparison is also illustrated through Figure 3.20.

51
Table 3.3 Comparison of experimental and theoretical strengths of
stub columns
Sl.
No.
Specimen
Type
Experimental
Load (kN)
Pexp.
Euro code 4 BS5400
Theoretical
Load (kN)
Pthe
(Pthe. /
Pexp.)
Theoretical
Load (kN)
Pthe
(Pthe. /
Pexp.)
1 A 170.00 157.68 0.928 157.68 0.928
2 B 261.60 275.37 1.053 254.38 0.972
3 C 300.00 312.11 1.040 282.22 0.941
4 D 320.00 366.07 1.144 329.91 1.031
5 E 280.00 297.40 1.062 272.74 0.974
Mean 1.045 0 .969
Standard Deviation 0.077 0.040
0
50
100
150
200
250
300
350
400
Load
s in
kN
Type A Type B Type C Type D Type E
Experimental
Euro code 4
BS 5400
Figure 3.20 Comparison of experimental loads and theoretical loads

52
3.6.4 Load vs. Axial Shortening Behaviour
Load versus axial shortening behaviour of all the five stub columns
are shown in Figure 3.21. In the initial stages of loading, the load versus axial
shortening plots showed linear variations. After attaining the peak value (the
maximum load), the curve dropped slowly for hollow columns and sharply for
in-filled columns showing the reduction in the column capacity with small
increments in axial shortening. This is clearly indicated for 1% SFRC in-filled
column, which exhibited superior performance than the other types.
0
50
100
150
200
250
300
350
0 2 4 6 8
Axial Shortening in mm
Lo
ad k
N
Figure 3.21 Load vs. Axial shortening behaviour of hollow and in-filled
columns
3.6.5 Load vs. Strain Behaviour
The loads versus microstrain plots for the stub columns are shown in
Figure 3.22. All the columns are showing similar load- strain behaviour in the
initial stages of loading and varied only beyond the yield point. The strain
hardening portion is longer for the SFRC in-filled columns compared to PCC
in-filled columns exhibiting the ductile nature of the in-fill. The type D column
shows a better ductile region than other columns.
HOLLOW
PCC
0.75% SFRC
1.00% SFRC
1.25% SFRC

53
0
50
100
150
200
250
300
350
0 2000 4000 6000
Micro Strain mm/mm
Load
in k
N
Figure 3.22 Load vs. Strain behaviour of hollow and in-filled columns
3.7 DISCUSSION OF RESULTS
An experimental program on 5 hollow and in-filled light gauge steel
stub columns subjected to axial compression has been described. The strength
increase resulting from confinement of high strength concrete by steel section
was observed. Comparisons of failure loads, the PCC in-filled column were
taking 1.65 times more load than the hollow columns. The SFRC in-filled
columns were around 1.80 times and 1.15 times more loads than hollow and
PCC in-filled columns respectively. The comparison of failure loads between
the test loads and the design codes are presented. It indicates that EC4 is unsafe
to predict the ultimate capacity of the in-filled columns. On the other hand
BS5400 predicts the failure loads close to the experimental loads. The BS5400
method gives a mean value of 0.969 and a standard deviation of 0.040
compared with experimental value is the best predictor and thus are acceptable
for the calculation of axial strength of SFRC in-filled stub columns. Test results
also manifested favourable ductility performance for hollow and SFRC
in-filled stub column specimens which was ascertained by the load versus
strain curves. For the lower load levels i.e. up to 100kN the axial shortening
was 10% less for 1% SFRC in-filled columns compared to other columns. This
factor shows the impact of SFRC in-fill in the stub columns.
HOLLOW
PCC
0.75% SFRC
1.00% SFRC
1.25% SFRC

54
3.8 TESTS ON SHORT COLUMNS
These tests are conducted to study the behaviour of hinged short
columns under axial load, which include rectangular hollow, PCC in-filled,
0.75%, 1.00% & 1.25% SFRC in-filled short columns whose slenderness ratio
is 35. The test set up is shown in Figure 3.23.
Figure 3.23 Test set up
3.8.1 Test Procedure
The tests were conducted on a column load frame. In order to apply
truly axial load to the specimens, 22 mm thick plates were directly welded to
the ends of the specimen. To simulate simply supported end condition two
plates 30 mm thick and size 300 × 200 mm with a spherical groove at the
center to accommodate a ball of 40 mm diameter was bolted to the end plates
at either end by four 16 mm diameter bolts such that their centres coincide in
plan. The load was applied through a calibrated proving ring of 100 kN
capacity. 10 mm electrical strain gauges were used to measure the strains at

55
mid height of the columns. The axial shortenings and the strain gauge
readings were taken for each increment of load up to the failure of the
specimens. The specimens were loaded with a load increment of 10 kN in the
elastic range and with 5 kN load increment after columns have began to yield.
The ultimate loads were identified by rapid increase in the deflectometer and
strain gauge readings and the subsequent drop in the load.
3.8.2 Failure Modes and Ultimate Loads
It was observed that all the in-filled columns were crushed under
the axial load and no buckling failures or shear failures were observed. The
typical failure appearances of the test specimens are shown in Figure 3.24.
For the hollow columns alone, the failure was due to local buckling near the
bottom support whereas, all the in-filled columns failed at their bottom due to
crushing of in-fills at the verge of failure.
i) Crushing of in-fills and ii) Local buckling of steel tube (Hollow)
outward bulging of steel tube
Figure 3.24 Failure modes of short columns

56
It is observed that, the strength of PCC in-filled columns is 112%
more than the strength of the hollow columns. The SFRC in-filled columns
with 1% volume fraction of the fibers had taken 27% more load than the
corresponding PCC in-filled columns and 169% more load than the
corresponding hollow columns. Even though the percentage of fibers is
increased from 1.00% to 1.25%, there is no significant increase in the ultimate
load.
3.9 THEORETICAL EXPRESSIONS
The loads were calculated from the provisions given in Eurocode 4
and BS 5400 and are listed in Table 3.4.
3.9.1 Eurocode4: 1994
The nominal strengths of the in-filled columns (NSD) were
calculated from the expressions
NPL.RD = (Aafy / γma)+( Acfck /
γc) where (
γma = 1.10 and
γc=1) (3.10)
NPL.R=(Aafy/γma)+( Acfck /
γc) (
γma=
γc=1) (3.11)
Ncr = [π2EI / (L
2)] (3.12)
where L is the buckling length of the column
where EI = (EaIa + 0.8EcdIc) (3.13)
where Ea is Young’s Modulus of the steel forming the section and Ia is
area of steel section
and Ecd = (Ecm / γc) (3.14)
where Ecm is the Young’s modulus of concrete

57
λ = ( NPL.R / Ncr)0.5
(3.15)
for this value of λ, the reduction factor X is selected from the EC3.
The Strength of the in-filled column NSD = (X) × (NPL.RD) (3.16)
3.9.2 BS 5400: Part 5: 1979
The load carrying capacity of concrete in-filled columns is
calculated as per British code BS5400 from the equation
NU = 0.91Asfy + 0.45 Acfcu (3.17)
The loads calculated from the above expressions given in
Eurocode4 and BS5400 are listed in Table 3.4. Comparison of the theoretical
values, the BS5400 is estimating the strength of the in-filled columns
Table 3.4 Comparison of experimental and theoretical strengths of
short columns
Sl.
No.
Specimen
Type
Experimental
Load (kN)
Pexp.
Eurocode 4 BS5400
Theoretical
Load(kN)
Pthe
(Pthe. /
Pexp.)
Theoretical
Load(kN)
Pthe
(Pthe. /
Pexp.)
1 A 115.00 109.21 0.950 100.00 0.870
2 B 244.22 240.00 0.983 203.98 0.835
3 C 262.60 256.69 0.977 222.61 0.848
4 D 309.89 301.26 0.972 254.53 0.821
5 E 253.41 248.22 0.980 216.41 0.854
Mean 0.972 0.846
Standard Deviation 0.006 0.019

58
conservatively. The design strengths predicted by EC4 are nearer to the
experimental values. The EC4 method gives a mean value of 0.972 and a
standard deviation of 0.006 with reference to the experimental values and
hence can be taken as the best predictor and thus acceptable for the
calculation of axial strength of SFRC in-filled short columns. The
experimental and the theoretical loads are given in the bar chart shown in
Figure 3.25.
0
50
100
150
200
250
300
350
Load
s in
kN
Type A Type B Type C Type D Type E
Experimental
Euro code 4
BS 5400
Figure 3.25 Experimental and theoretical loads
The behaviour of the short concrete composite columns is usually
discussed in concurrence with the following terms.
3.9.3 Concrete Contribution Factor (α)
According to clause 11.1.4 in BS5400, the concrete contribution
factor is defined as the ratio of the contribution of strength by concrete to the
strength of the composite column.
Concrete Contribution factor (α) =0.45 Acfcu/ Nu (3.18)
Nu = Squash load

59
3.9.4 Constraining Factor (ξ)
The constraining factor is defined as the ratio of the strength of
steel to the strength of concrete as given by Han et al.
Constraining factor (ξ) = Asfy / Acfck. (3.19)
where fck is the 67% of the compression strength of concrete cubical blocks.
Table 3.5 shows the values of Concrete contribution factor (α) and
Constraining factor (ξ) for all the types of columns.
Table 3.5 Values of concrete contribution factor and constraining
factor for all the types of columns
Sl.
No.
Specimen
Type
Experimental
Load (Pexp).
(kN)
Theoretical
Load (Pthe)
(Eurocode4)
(kN)
Concrete
contribution
Factor
(α)
Constraining
factor
(ξ)
1 A 115.00 109.21 -- --
2 B 244.22 240.00 0.246 1.643
3 C 262.60 256.69 0.278 1.276
4 D 309.89 301.26 0.359 0.922
5 E 253.41 248.22 0.274 1.380
For higher compressive strength of confined concrete, the concrete
contribution factor (α) is higher and the constraining factor (ξ) is lower. For
1% SFRC in-filled columns the value of concrete contribution factor is higher
and constraining factor is lesser exhibiting the enhanced structural strength.

60
3.10 LOAD VS. AXIAL SHORTENING BEHAVIOUR
The axial shortening behaviour of all types of columns is illustrated
in Figure 3.26. Hollow columns show larger axial shortening beyond the
ultimate load, compared to the other types of columns. The axial shortening of
SFRC in-filled columns are lesser due to the enhanced characteristic
compressive strength of the in-filled concrete compared to PCC in-filled and
hollow columns. Beyond the ultimate loads, all the columns show
considerable axial shortening before failure. However, there is a notable
difference in the behaviour of the hollow column and 1% SFRC in-filled
column from the rest of the columns. For the 1.25% SFRC in-filled concrete
columns, the descending curve is found to be critical showing the reduction in
load was large compared to axial shortening.
0
100
200
300
400
0 2 4 6 8
Axial shortening in mm
Load
in
kN
Hollow
PCC
0.75% SFRC
1.0% SFRC
1.25% SFRC
Figure 3.26 Load vs. axial shortening behaviour of hollow and in-filled
column

61
3.11 LOAD vs. MICRO STRAIN BEHAVIOUR
Figure 3.27 shows the load micro strain behaviour of all the
columns. All the columns exhibit considerable amount of plastic strains at the
lower load levels. However, SFRC in-filled columns show lesser strains up to
the elastic state and undergo considerable strain beyond the ultimate load
compared to the plain concrete in-filled columns and hollow columns. The
plots clearly indicate that, the ductility performance of SFRC in-filled
columns is higher for 0.75%, 1% and 1.25% SFRC in-filled columns by 26%,
39% and 24% respectively compared to PCC in-filled column.
0
50
100
150
200
250
300
350
0 2000 4000 6000
Microstrain in mm/mm
Lo
ad
in
kN
Hollow
PCC
0.75% SFRC
1.0% SFRC
1.25% SFRC
Figure 3.27 Load vs. Micro strain behaviour of hollow and in-filled
column
3.12 DISCUSSION OF RESULTS
In this experimental program hollow and in-filled light gauge steel
short columns subjected to axial compression has been described. There is a
considerable increase in the strength of the in-filled columns, due to the
confining effect of PCC and SFRC by the steel section compared to the

62
hollow columns. The PCC in-filled column has taken 2.20 times more load
than the corresponding hollow columns. The SFRC in-filled columns have
taken around 2.25 times and 1.15 times more loads than hollow and PCC in-
filled columns respectively. Hollow columns showed large axial shortening
beyond the ultimate load. The axial shortening of SFRC in-filled columns are
lesser due to increased characteristic compressive strength of the in-fill
compared to plain concrete in-filled and hollow columns. Beyond the ultimate
loads, the axial shortenings are significant. All the columns exhibit larger
amount of plastic strains at the lower loads. The SFRC in-filled columns show
lesser strains up to the elastic state and considerable strains beyond the
ultimate loads when compared with the PCC in filled columns and hollow
columns. A comparison of the failure loads obtained from the experiments
and from the design codes indicates that BS5400 is not safe to predict the
ultimate loads of the in-filled columns. The EC4 predicts the ultimate loads
closest to the experimental loads, whose mean value is 0.972 and the standard
deviation is 0.006 compared to the experimental values. Hence EC4 is taken
as the best predictor and is acceptable for calculation of the axial strength of
SFRC in-filled short columns. Compared to stub columns, the short columns
take lesser axial loads, due to their higher slenderness ratio. The column in-
filled with 1% SFRC showing good performance than all other type of
columns.