chapter 3 enrolment and gender trends: primary … of new entrants in primary education with ecd(*)...
TRANSCRIPT

see below-left
LebanonCyprus
Israel
Maldives
Gambia
Tunisia
Sierra Leone
Liberia
Ireland
Jordan
Bhutan
Rwanda
Lesotho
Guinea-Bissau
Seychelles
Comoros
Djibouti
Armenia
BruneiDarussalam
Timor-Leste
Burundi
Swaziland
Kuwait
Singapore
Trinidad and TobagoGrenadaSt. Vincent & GrenadinesBarbadosSt. LuciaDominica
St. Kitts and NevisAntigua and Barbuda
El Salvador
JamaicaHaiti
Papua New Guinea
Uganda
Georgia
Gabon
CentralAfrican
Republic
Palau
Bangladesh
Iceland
Guatemala Honduras
Panama
Senegal
NicaraguaCosta Rica
Mauritius
Democratic People’sRepublic of Korea
SriLanka
Republicof Korea
Belize
Bahamas
CapeVerde
Dominican Republic
Cuba
Kyrgyzstan
Tajikistan
Cambodia
Greece
13245
67 891011
1213
14
Ecuador
UnitedKingdom
Afghanistan
Thailand
Zimbabwe
Germany
Botswana
Philippines
SouthAfrica
NewZealand
Madagascar
Mexico
Colombia
Côted’Ivoire
Guinea
Uruguay
Myanmar
Finland
Namibia
Venezuela
Mauritania
Nigeria
Bolivia
United Statesof America
SyrianArab Rep.
SpainPortugal
LiechtensteinSwitzerland
SanMarino
MonacoAndorra
Luxembourg
Belgium
EstoniaDenmark
Malta
LatviaLithuania
France
Morocco Iraq
Kenya
PolandUkraine
Egypt
Yemen
EthiopiaSouthSudan
Malaysia
United Republicof Tanzania
Angola
IslamicRepublic of Iran
Saudi Arabia
Chad
DemocraticRepublic of theCongo
India
Zambia
Turkey
KazakhstanMongolia
Libya
Niger
Indonesia
Mali
Brazil
Sudan
Australia
China
Canada
QatarBahrain
Azerbaijan
Algeria
United Arab Emirates
BurkinaFaso
São Tomé and PríncipeEquatorial Guinea
Belarus
MarshallIslands
Fed. States ofMicronesia
LaoP.D.R.
Netherlands
Italy
Russian Federation
Congo
Guyana
Suriname
Peru
Chile
Argentina
Paraguay
NorwaySweden
Turkmenistan
Uzbekistan
Pakistan
Oman
Eritrea
Nepal
Japan
Ghana
BeninTogo
Cameroon Somalia
Malawi
Mozambique
Viet Nam
Tonga
Tuvalu
NauruKiribati
Fiji
Samoa
Vanuatu
SolomonIslands
British Virgin Islands
Macao SAR, China
Aruba (Neth.)
Cayman Islands
(UK)WesternSahara
Greenland(Denmark)
Jammu and Kashmir*Bermuda (UK)
Anguilla (UK)
Turks andCaicos Is.
(UK)
Gibraltar (UK)
Puerto Rico(USA)
Hong Kong SAR, China
Montserrat (UK)
Faroe Islands(Den.)
Niue (NZ)Cook Islands(NZ)
Tokelau (NZ)
1. The FYR of Macedonia2. Albania3. Montenegro4. Serbia5. Bosnia and Herzegovina6. Croatia7. Slovenia
8. Hungary9. Austria10. Czech Republic11. Slovakia12. Republic of Moldova13. Romania14. Bulgaria
Less than 15%
[15% – 30%[
[30% – 50%[
[50% – 75%[
[75% – 95%[
Greater than 95%
No data
The World Conference on Education for All in Jomtien in 1990 identified universal primary education (UPE) as the bedrock objective for achieving Education for All, and the Millennium Declaration did likewise. Since the out-of-school population has been disproportionately female, the goal of UPE and the parallel goal of gender equality are inextricably connected.
Data show that significant progress has been made over the last four decades in enhancing access to primary education in all regions of the world and for both sexes. Moreover, primary school completion and school-life expectancy rates have been increasing, and there has been a general narrowing of gender gaps at the primary level. However, troubling trends include high repetition rates and large numbers of overage children in some countries and regions.
A growing body of research around the world has shown that participation in pre-primary education translates into better learning outcomes once pupils enter primary school and move on to higher levels of education. A report from the Organisation for Economic Co-operation and Development (OECD), for example, found that in practically all countries “15-year-old students who have attended some pre-primary school outperformed students who had not” on the reading portion of the 2009 Programme for International Study Assessment (PISA) that was administered to students in 65 countries.
In examining trends at the pre-primary level it is important to keep in mind that pre-primary education is not compulsory and frequently involves out-of-pocket costs to the families. Moreover, the age of participants varies from three to five or even six years, which means that the gross enrolment ratio may be higher than 100% in situations where students younger or older than the official age are enrolled.
As shown in Map 3.1.1, which depicts the gross enrolment ratios for pre-primary education in 178 countries, participation rates are minimal in about a fifth of countries (18 percent) but nearly universal in another fifth (21 percent). Another 20 percent have participation rates in the 50 to 75 percent range.
1. Participation in pre-primaryeducation on the rise
Map 3.1.1 Pre-primary enrolment apparent in most regions of the world
Gross enrolment ratio in pre-primary education
CHAPTER 3
Enrolment and gender trends: primary education
* Dotted line represents approximately the Line of Control in Jammu and Kashmir agreed upon by India and Pakistan. The final status of Jammu and Kashmir has not yet been agreed upon by the parties.
Final boundary between the Republic of Sudan and the Republic of South Sudan has not yet been determined.
Source: UNESCO Institute for Statistics
26 27

Percentage of new entrants in primary education with ECD(*) experience for selected countries, 2009 or latest year available
Malaysia-1
Serbia
Lebanon
Uruguay-1
China
United Arab Emirates
Costa Rica
Kuwait-2
El Salvador-1
Jordan-1
Peru-1
Morocco
Nepal-1
Algeria
Zambia
Niger
Azerbaijan
Djibouti-2
Ethiopia-1
0 20 3010 40 50 60 70 90
%
80 100
Note: (*) ECD - Early Childhood Development; -1 refer to 2008 data; -2 refer to 2007 dataSource: UNESCO Institute for Statistics
Figure 3.1.3 Early childhood experience ranges from minimal to near-universal
Gross enrolment ratio in pre-primary education for selected countries and regions, 2009 or latest year available
Sub-SaharanAfrica
Chad
Liberia-2
Djibouti
United ArabEmirates
Arab States
Tajikistan-1
Georgia-1
Central Asia
Bhutan-1
Maldives
South andWest Asia
Myanmar
Hong KongSAR, China
East Asia andthe Pacific
Bosnia andHerzegovina
CzechRepublic
Central andEastern Europe
Guatemala-1
Mexico
Latin Americaand the
Caribbean
United Statesof America
Spain
North Americaand Western
Europe
0
20
40
60
80
100
120
140
Note: -1 refer to 2008 data; -2 refer to 2007 dataSource: UNESCO Institute for Statistics
Gro
ss e
nrol
men
t rat
io (%
)
Minimum MaximumRegional average
Figure 3.1.2 Participation rates vary within regions
Sub-SaharanAfrica
Arab States Central Asia+1 South andWest Asia
East Asia andthe Pacific
Central andEastern Europe
Latin Americaand the
Caribbean
North Americaand Western
Europe
World
90
80
70
60
50
40
30
20
10
0
Gross enrolment ratio in pre-primary education, by region and worldwide, 1990–2009
Note: +1 1990 data for Central Asia refer to 1991Source: UNESCO Institute for Statistics
Gro
ss e
nrol
men
t rat
io (%
)
1990 2009 Male Female
Figure 3.1.1 Growth seen in the majority of the regions
proportion of children involved in pre-primary education is greatest in North America and Western Europe, followed by Latin America and the Caribbean and then Central and Eastern Europe. Sub-Saharan Africa has the lowest participation rates, slightly below the Arab States.
Participation in pre-primary education increased steadily between 1990 and 2009 for both sexes and in almost all regions of the world. As shown in Figure 3.1.1, the most dramatic gains took place in South and West Asia, where participation rates essentially tripled for both sexes. The
Participation rates for pre-primary education vary dramatically even within regions. These disparities can be seen in Figure 3.1.2 which provides data on eight regions showing the proportion of children enrolled in pre-primary education compared to the total population of children of pre-primary age. The figure also shows the highest and lowest values of GER per region. In sub-Saharan Africa the ratio ranges from less than 4 percent in Chad to 110 percent in Liberia. In North America and Western Europe the ratios extend from 57 percent in the United States to 130 percent in Spain.
Policies and practices relating to pre-primary education vary widely among various countries. Figure 3.1.3 provides information on the proportion of new entrants who enrol in primary school with prior experience in an Early Childhood Development program. The proportions range from single digit percentages in Ethiopia, Djibouti and Azerbaijan to virtually universal pre-primary experience in Malaysia.
CHAPTER 3 Enrolment and gender trends: primary education
28 29

see below
LebanonCyprus
Israel
Maldives
Gambia
Tunisia
Sierra Leone
Liberia
Ireland
Jordan
Bhutan
Rwanda
Lesotho
Guinea-Bissau
Seychelles
Comoros
Djibouti
Armenia
BruneiDarussalam
Timor-Leste
Burundi
Swaziland
Kuwait
Singapore
Trinidad and TobagoGrenadaSt. Vincent & GrenadinesBarbadosSt. LuciaDominica
St. Kitts and NevisAntigua and Barbuda
El Salvador
JamaicaHaiti
Papua New Guinea
Uganda
Georgia
Gabon
CentralAfrican
Republic
Palau
Bangladesh
Iceland
Guatemala Honduras
Panama
Senegal
NicaraguaCosta Rica
Mauritius
Democratic People’sRepublic of Korea
SriLanka
Republicof Korea
Belize
Bahamas
CapeVerde
Dominican Republic
Cuba
Kyrgyzstan
Tajikistan
Cambodia
Greece
13245
67 891011
1213
14
Ecuador
UnitedKingdom
Afghanistan
Thailand
Zimbabwe
Germany
Botswana
Philippines
SouthAfrica
NewZealand
Madagascar
Mexico
Colombia
Côted’Ivoire
Guinea
Uruguay
Myanmar
Finland
Namibia
Venezuela
Mauritania
Nigeria
Bolivia
United Statesof America
SyrianArab Rep.
SpainPortugal
LiechtensteinSwitzerland
SanMarino
MonacoAndorra
Luxembourg
Belgium
EstoniaDenmark
Malta
LatviaLithuania
France
Morocco Iraq
Kenya
PolandUkraine
Egypt
Yemen
EthiopiaSouthSudan
Malaysia
United Republicof Tanzania
Angola
IslamicRepublic of Iran
Saudi Arabia
Chad
DemocraticRepublic of theCongo
India
Zambia
Turkey
KazakhstanMongolia
Libya
Niger
Indonesia
Mali
Brazil
Sudan
Australia
China
Canada
QatarBahrain
Azerbaijan
Algeria
United Arab Emirates
BurkinaFaso
São Tomé and PríncipeEquatorial Guinea
Belarus
MarshallIslands
Fed. States ofMicronesia
LaoP.D.R.
Netherlands
Italy
Russian Federation
Congo
Guyana
Suriname
Peru
Chile
Argentina
Paraguay
NorwaySweden
Turkmenistan
Uzbekistan
Pakistan
Oman
Eritrea
Nepal
Japan
Ghana
BeninTogo
Cameroon Somalia
Malawi
Mozambique
Viet Nam
Tonga
Tuvalu
NauruKiribati
Fiji
Samoa
Vanuatu
SolomonIslands
British Virgin Islands
Macao SAR, China
Aruba (Neth.)
Cayman Islands
(UK)WesternSahara
Greenland(Denmark)
Jammu and Kashmir*Bermuda (UK)
Anguilla (UK)
Turks andCaicos Is.
(UK)
Gibraltar (UK)
Puerto Rico(USA)
Hong Kong SAR, China
Montserrat (UK)
Faroe Islands
(Den.)
Niue (NZ)Cook Islands(NZ)
Tokelau (NZ)
* Dotted line represents approximately the Line of Control in Jammu and Kashmir agreed upon by India and Pakistan. The final status of Jammu and Kashmir has not yet been agreed upon by the parties.
Final boundary between the Republic of Sudan and the Republic of South Sudan has not yet been determined.
1. The FYR of Macedonia2. Albania3. Montenegro4. Serbia5. Bosnia and Herzegovina6. Croatia7. Slovenia
8. Hungary9. Austria10. Czech Republic11. Slovakia12. Republic of Moldova13. Romania14. Bulgaria
Males favoured
Parity
Females favoured
No data
Gender parity is strong in the area of pre-primary education. As shown in Map 3.1.2, girls and boys participate in pre-primary education at the same rates in a substantial majority (62 percent) of countries. Males are favoured in 18 percent of countries and females in 20 percent.
One reason for the high level of parity in the earliest years of schooling may be that, especially in developing countries, it is the wealthier and better educated families who enrol their children in pre-primary schools, and such families are more inclined to value schooling for both boys and girls. Such is certainly the case in situations where pre-school involves costs to the families.
Map 3.1.2 Gender parity widespread in pre-primary education
Gender parity index in pre-primary education
CHAPTER 3 Enrolment and gender trends: primary education
Source: UNESCO Institute for Statistics
30 31

see below
LebanonCyprus
Israel
Maldives
Gambia
Tunisia
Sierra Leone
Liberia
Ireland
Jordan
Bhutan
Rwanda
Lesotho
Guinea-Bissau
Seychelles
Comoros
Djibouti
Armenia
BruneiDarussalam
Timor-Leste
Burundi
Swaziland
Kuwait
Singapore
Trinidad and TobagoGrenadaSt. Vincent & GrenadinesBarbadosSt. LuciaDominica
St. Kitts and NevisAntigua and Barbuda
El Salvador
JamaicaHaiti
Papua New Guinea
Uganda
Georgia
Gabon
CentralAfrican
Republic
Palau
Bangladesh
Iceland
Guatemala Honduras
Panama
Senegal
NicaraguaCosta Rica
Mauritius
Democratic People’sRepublic of Korea
SriLanka
Republicof Korea
Belize
Bahamas
CapeVerde
Dominican Republic
Cuba
Kyrgyzstan
Tajikistan
Cambodia
Greece
13245
67 891011
1213
14
Ecuador
UnitedKingdom
Afghanistan
Thailand
Zimbabwe
Germany
Botswana
Philippines
SouthAfrica
NewZealand
Madagascar
Mexico
Colombia
Côted’Ivoire
Guinea
Uruguay
Myanmar
Finland
Namibia
Venezuela
Mauritania
Nigeria
Bolivia
United Statesof America
SyrianArab Rep.
SpainPortugal
LiechtensteinSwitzerland
SanMarino
MonacoAndorra
Luxembourg
Belgium
EstoniaDenmark
Malta
LatviaLithuania
France
Morocco Iraq
Kenya
PolandUkraine
Egypt
Yemen
EthiopiaSouthSudan
Malaysia
United Republicof Tanzania
Angola
IslamicRepublic of Iran
Saudi Arabia
Chad
DemocraticRepublic of theCongo
India
Zambia
Turkey
KazakhstanMongolia
Libya
Niger
Indonesia
Mali
Brazil
Sudan
Australia
China
Canada
QatarBahrain
Azerbaijan
Algeria
United Arab Emirates
BurkinaFaso
São Tomé and PríncipeEquatorial Guinea
Belarus
MarshallIslands
Fed. States ofMicronesia
LaoP.D.R.
Netherlands
Italy
Russian Federation
Congo
Guyana
Suriname
Peru
Chile
Argentina
Paraguay
NorwaySweden
Turkmenistan
Uzbekistan
Pakistan
Oman
Eritrea
Nepal
Japan
Ghana
BeninTogo
Cameroon Somalia
Malawi
Mozambique
Viet Nam
Tonga
Tuvalu
NauruKiribati
Fiji
Samoa
Vanuatu
SolomonIslands
British Virgin Islands
Macao SAR, China
Aruba (Neth.)
Cayman Islands
(UK)WesternSahara
Greenland(Denmark)
Jammu and Kashmir*Bermuda (UK)
Anguilla (UK)
Turks andCaicos Is.
(UK)
Gibraltar (UK)
Puerto Rico(USA)
Hong Kong SAR, China
Montserrat (UK)
Faroe Islands(Den.)
Niue (NZ)Cook Islands(NZ)
Tokelau (NZ)
* Dotted line represents approximately the Line of Control in Jammu and Kashmir agreed upon by India and Pakistan. The final status of Jammu and Kashmir has not yet been agreed upon by the parties.
Final boundary between the Republic of Sudan and the Republic of South Sudan has not yet been determined.
1. The FYR of Macedonia2. Albania3. Montenegro4. Serbia5. Bosnia and Herzegovina6. Croatia7. Slovenia
8. Hungary9. Austria10. Czech Republic11. Slovakia12. Republic of Moldova13. Romania14. Bulgaria
Less than 80%
[80% – 90%[
[90% – 98%[
Greater than 98%
No data
Distribution of world’s children by levels of gross enrolment ratio in primary education, 2009
Less than 80 [80 – 90[ [90 – 98[
Gross enrolment ratio (%)
Perc
enta
ge o
f chi
ldre
n liv
ing
in c
ount
ries
at s
peci
fied
GER
leve
l (%
)
Greater than 98
100
90
80
70
60
50
40
30
20
10
0
Source: UNESCO Institute for Statistics
Figure 3.2.1 Majority of children living in countries with high gross enrolment ratios
Universal primary education (UPE) has long been the situation in most developed countries, and considerable progress has been made in making primary schooling accessible to children in developing countries as well. Progress has been especially strong over the last decade, when a growing number of countries have achieved UPE. Girls’ enrolment has been increasing at a faster rate than that of boys, which has helped to close the gender gap at the primary level.
Map 3.2.1 offers a global overview of the number of countries with respect to their gross enrolment ratio (GER). The primary level GER expresses the number of children, regardless of age, who are enrolled in primary school as a percentage of the corresponding population in the theoretical age group for this level of education. The GER can exceed 100 percent if there are significant numbers of under- or over-age children enrolled in primary schools.
Figure 3.2.1 shows that whereas 72 percent of countries report a GER greater than 98 percent, 77 percent of the world’s children live in such countries. Put another way, a majority of children live in countries that have a high GER. At the other end of the spectrum only 3 percent of children live in the 5 percent of countries that have GERs below 80 percent.
Nearly three-quarters (73 percent) of the 194 countries for which data are available reported a gross enrolment ratio over 98 percent, a sign of near-universal primary enrolment. Only 4 percent of countries have a GER below 80 percent, meaning that at least one in five of their children do not have access to primary schools.
Since countries vary widely in the size of their populations, the number of countries at various GER levels may not be an accurate reflection of where the world stands with regards to primary enrolment.
2. Growing number of countriesachieving universal primary education
Map 3.2.1 Gross enrolment ratios vary across regions
Gross enrolment ratio in primary education
CHAPTER 3 Enrolment and gender trends: primary education
Source: UNESCO Institute for Statistics
32 33

see below
LebanonCyprus
Israel
Maldives
Gambia
Tunisia
Sierra Leone
Liberia
Ireland
Jordan
Bhutan
Rwanda
Lesotho
Guinea-Bissau
Seychelles
Comoros
Djibouti
Armenia
BruneiDarussalam
Timor-Leste
Burundi
Swaziland
Kuwait
Singapore
Trinidad and TobagoGrenadaSt. Vincent & GrenadinesBarbadosSt. LuciaDominica
St. Kitts and NevisAntigua and Barbuda
El Salvador
JamaicaHaiti
Papua New Guinea
Uganda
Georgia
Gabon
CentralAfrican
Republic
Palau
Bangladesh
Iceland
Guatemala Honduras
Panama
Senegal
NicaraguaCosta Rica
Mauritius
Democratic People’sRepublic of Korea
SriLanka
Republicof Korea
Belize
Bahamas
CapeVerde
Dominican Republic
Cuba
Kyrgyzstan
Tajikistan
Cambodia
Greece
13245
67 891011
1213
14
Ecuador
UnitedKingdom
Afghanistan
Thailand
Zimbabwe
Germany
Botswana
Philippines
SouthAfrica
NewZealand
Madagascar
Mexico
Colombia
Côted’Ivoire
Guinea
Uruguay
Myanmar
Finland
Namibia
Venezuela
Mauritania
Nigeria
Bolivia
United Statesof America
SyrianArab Rep.
SpainPortugal
LiechtensteinSwitzerland
SanMarino
MonacoAndorra
Luxembourg
Belgium
EstoniaDenmark
Malta
LatviaLithuania
France
Morocco Iraq
Kenya
PolandUkraine
Egypt
Yemen
EthiopiaSouthSudan
Malaysia
United Republicof Tanzania
Angola
IslamicRepublic of Iran
Saudi Arabia
Chad
DemocraticRepublic of theCongo
India
Zambia
Turkey
KazakhstanMongolia
Libya
Niger
Indonesia
Mali
Brazil
Sudan
Australia
China
Canada
QatarBahrain
Azerbaijan
Algeria
United Arab Emirates
BurkinaFaso
São Tomé and PríncipeEquatorial Guinea
Belarus
MarshallIslands
Fed. States ofMicronesia
LaoP.D.R.
Netherlands
Italy
Russian Federation
Congo
Guyana
Suriname
Peru
Chile
Argentina
Paraguay
NorwaySweden
Turkmenistan
Uzbekistan
Pakistan
Oman
Eritrea
Nepal
Japan
Ghana
BeninTogo
Cameroon Somalia
Malawi
Mozambique
Viet Nam
Tonga
Tuvalu
NauruKiribati
Fiji
Samoa
Vanuatu
SolomonIslands
British Virgin Islands
Macao SAR, China
Aruba (Neth.)
Cayman Islands
(UK)WesternSahara
Greenland(Denmark)
Jammu and Kashmir*Bermuda (UK)
Anguilla (UK)
Turks andCaicos Is.
(UK)
Gibraltar (UK)
Puerto Rico(USA)
Hong Kong SAR, China
Montserrat (UK)
Faroe Islands(Den.)
Niue (NZ)Cook Islands(NZ)
Tokelau (NZ)
* Dotted line represents approximately the Line of Control in Jammu and Kashmir agreed upon by India and Pakistan. The final status of Jammu and Kashmir has not yet been agreed upon by the parties.
Final boundary between the Republic of Sudan and the Republic of South Sudan has not yet been determined.
1. The FYR of Macedonia2. Albania3. Montenegro4. Serbia5. Bosnia and Herzegovina6. Croatia7. Slovenia
8. Hungary9. Austria10. Czech Republic11. Slovakia12. Republic of Moldova13. Romania14. Bulgaria
Less than 75%
[75% – 85%[
[85% – 95%[
[95% – 98%[
Greater than 98%
No data
Changes in net enrolment ratios in primary education, 2000–2009
0 10 20 30 40 50 60
NER in 2000 (%)
NER
in 2
009
(%)
70 80 90 100
100
90
80
70
60
50
40
30
20
10
0
Djibouti
Niger
Burkina Faso
Eritrea
EthiopiaMali
Guinea
Burundi
Pakistan
United Republic ofTanzania
MauritaniaGhanaSenegal
Côte d'Ivoire
Mozambique
Bhutan
Nigeria
Kenya
Yemen
ZambiaMadagascar
Swaziland
Equatorial Guinea
Gambia
Comoros
Rwanda
Lesotho
Lao PDR
Morocco
United ArabEmirates
Togo
Oman
IraqAzerbaijan
Kyrgyzstan
Bahamas
CapeVerdeJamaica
ParaguayAlbania
Indonesia
OccupiedPalestinianTerritory
Fiji
Net enrolment ratioshave deterioratedsince 2000
Net enrolment ratioshave progressedsince 2000
Source: UNESCO Institute for Statistics
Figure 3.2.2 Net enrolment rates rising in most countries
One way of measuring universal participation in primary education is to examine the net enrolment rate (NER), which is calculated by dividing the number of students of a particular age group – in this case primary level – by the number of children in the population of that age group. In other words, unlike GER, NER indicates the actual share of the particular age group that should be enrolled in primary schools; therefore this rate can never exceed 100%.
Map 3.2.2 shows that the largest proportion of countries (44 percent) have NERs in the range of 85 to 95 percent. About a tenth have near-universal primary enrolment levels of 98 percent or above, while slightly less than one in ten show rates of less than 75 percent. Overall, GERs tend to be higher than NERs – which makes sense given that many children in primary schools are over-aged due to late entrance to school.
Net enrolment rates have been rising in most countries over the last decade – a pattern that can be seen in Figure 3.2.2. Among countries where the NER has deteriorated, most of the declines are either relatively small, such as the drop in Nigeria from 64 to 63 percent, or are occurring in countries that already had near-universal NER in 2000.
Map 3.2.2 Steady progress seen toward universal primary education
Net enrolment rate in primary education
CHAPTER 3 Enrolment and gender trends: primary education
Source: UNESCO Institute for Statistics
34 35

Gross enrolment ratio in primary education for selected countries, 2009 or latest year available
0
20
40
60
80
100
120
140
Note: +1 refer to 2010 dataSource: UNESCO Institute for Statistics
Gro
ss e
nrol
men
t rat
io (%
)
Mon
aco
Beni
n
Syria
n Ar
ab R
epub
lic
Cong
o
Afgh
anis
tan
Cam
eroo
n
Moz
ambi
que+1
Cam
bodi
a
Togo
Tim
or-L
este
Dom
inic
an R
epub
lic
Mor
occo
Alge
ria
Gre
nada
Ethi
opia
Chad
Cent
ral A
fric
an R
epub
lic
Mal
i
Cape
Ver
de
Dem
. Rep
. of t
he C
ongo
Gui
nea
Paki
stan
Burk
ina
Faso
+1
Côte
d'Iv
oire
Suda
n
Nig
er+1
Djib
outi
Eritr
ea
Chin
a
Mau
ritan
ia
Arm
enia
Bang
lade
sh
Male Female
Figure 3.2.5 Gross enrolment ratio higher for boys in some countries and girls in others
Percentage change in enrolment and population in primary education by gender, 1999–2009
Central Asia Central andEastern Europe
East Asia andthe Pacific
Latin Americaand the
Caribbean
North Americaand Western
Europe
Arab States South andWest Asia
Sub-SaharanAfrica
-30
-20
-10
0
10
20
30
40
50
60
70
Gro
wth
rate
(%)
Source: UNESCO Institute for Statistics
Male enrolment Female enrolment Population
Figure 3.2.4 Primary enrolments keeping pace with population growth
Gross enrolment ratio in primary education by region and worldwide, 1970–2009
Sub-SaharanAfrica
North Americaand Western
Europe
Central andEastern Europe
Central Asia* Latin Americaand the
Caribbean
East Asia andthe Pacific*
World
140
120
100
80
60
40
20
0Arab States South and
West Asia
Note: * Data for Central Asia is from 1980–2009; * Data for East Asia and the Pacific is from 1975–2009Source: UNESCO Institute for Statistics
Gro
ss e
nrol
men
t rat
io (%
)
1970 2009 Male Female
Figure 3.2.3 Sub-Saharan Africa leading gains in gross enrolment ratios for both sexes
Other significant gains for females were registered in the Arab States and in South and West Asia. The only regions to show declines in GERs were Central Asia, where the ratio for both females and males dropped by around 8 percentage points, Central and Eastern Europe, where both the male and female ratios dropped below 100 percent and East Asia and the Pacific, where the GER
A general upward trend in primary level gross enrolment ratios has occurred for both males and females since 1970. As shown in Figure 3.2.3, the most dramatic gains have been registered among both sexes in sub-Saharan Africa, where the GERs rose from 62 to 106 percent for males and more than doubled, from 43 to 97 percent, for females.
Figure 3.2.4 shows that the number of primary age children was either steady or declined somewhat in most regions of the world between 1999 and 2009 due to slower population growth. Primary enrolments generally moved in parallel to the population trends, although in Central Asia and in East Asia and the Pacific enrolment declines were slightly less severe than the population drop-offs.
Three regions of the world – Arab States, South and West Asia, and sub-Saharan Africa – showed growth in the school-age population, and in all three cases primary enrolments grew at even faster rates. Another sign of improvement in access to primary education is the fact that the enrolment rates of girls rose faster than those of boys in all three regions.
Figure 3.2.5 reports data on the primary level gross enrolment ratio for 32 selected countries. The largest gap in favour of boys is in Afghanistan, where boys outnumber girls by a ratio of three to two. By contrast, girls have the edge in four countries: China, Mauritania, Armenia and Bangladesh.
for males dropped from 119 to 110 percent. It is noteworthy to mention however that declines of the GER that occur when the latter remains near 100 percent, are mostly due to fewer over/under aged pupils being enrolled and do not project a step back for the region.
The ratios are virtually identical for males and females in North America and Western Europe. The ratio is higher for males than for females in six of the other seven regions. The exception is East Asia and the Pacific, where females have a slight edge. The highest GER (119 percent) is for males in Latin America and the Caribbean, while the lowest (93 percent) is for females in the Arab States. The largest gaps in favour of males are in sub-Saharan Africa and in the Arab States.
An obvious question that arises is how the changes in enrolment compare with the overall growth of the school-age population? Are there any signs that gains in access to education are being negated by rising population levels? In general, the answer seems to be no. Enrolments are more than keeping pace with population growth.
CHAPTER 3 Enrolment and gender trends: primary education
36 37

see below
LebanonCyprus
Israel
Maldives
Gambia
Tunisia
Sierra Leone
Liberia
Ireland
Jordan
Bhutan
Rwanda
Lesotho
Guinea-Bissau
Seychelles
Comoros
Djibouti
Armenia
BruneiDarussalam
Timor-Leste
Burundi
Swaziland
Kuwait
Singapore
Trinidad and TobagoGrenadaSt. Vincent & GrenadinesBarbadosSt. LuciaDominica
St. Kitts and NevisAntigua and Barbuda
El Salvador
JamaicaHaiti
Papua New Guinea
Uganda
Georgia
Gabon
CentralAfrican
Republic
Palau
Bangladesh
Iceland
Guatemala Honduras
Panama
Senegal
NicaraguaCosta Rica
Mauritius
Democratic People’sRepublic of Korea
SriLanka
Republicof Korea
Belize
Bahamas
CapeVerde
Dominican Republic
Cuba
Kyrgyzstan
Tajikistan
Cambodia
Greece
13245
67 891011
1213
14
Ecuador
UnitedKingdom
Afghanistan
Thailand
Zimbabwe
Germany
Botswana
Philippines
SouthAfrica
NewZealand
Madagascar
Mexico
Colombia
Côted’Ivoire
Guinea
Uruguay
Myanmar
Finland
Namibia
Venezuela
Mauritania
Nigeria
Bolivia
United Statesof America
SyrianArab Rep.
SpainPortugal
LiechtensteinSwitzerland
SanMarino
MonacoAndorra
Luxembourg
Belgium
EstoniaDenmark
Malta
LatviaLithuania
France
Morocco Iraq
Kenya
PolandUkraine
Egypt
Yemen
EthiopiaSouthSudan
Malaysia
United Republicof Tanzania
Angola
IslamicRepublic of Iran
Saudi Arabia
Chad
DemocraticRepublic of theCongo
India
Zambia
Turkey
KazakhstanMongolia
Libya
Niger
Indonesia
Mali
Brazil
Sudan
Australia
China
Canada
QatarBahrain
Azerbaijan
Algeria
United Arab Emirates
BurkinaFaso
São Tomé and PríncipeEquatorial Guinea
Belarus
MarshallIslands
Fed. States ofMicronesia
LaoP.D.R.
Netherlands
Italy
Russian Federation
Congo
Guyana
Suriname
Peru
Chile
Argentina
Paraguay
NorwaySweden
Turkmenistan
Uzbekistan
Pakistan
Oman
Eritrea
Nepal
Japan
Ghana
BeninTogo
Cameroon Somalia
Malawi
Mozambique
Viet Nam
Tonga
Tuvalu
NauruKiribati
Fiji
Samoa
Vanuatu
SolomonIslands
British Virgin Islands
Macao SAR, China
Aruba (Neth.)
Cayman Islands
(UK)WesternSahara
Greenland(Denmark)
Jammu and Kashmir*Bermuda (UK)
Anguilla (UK)
Turks andCaicos Is.
(UK)
Gibraltar (UK)
Puerto Rico(USA)
Hong Kong SAR, China
Montserrat (UK)
Faroe Islands(Den.)
Niue (NZ)Cook Islands(NZ)
Tokelau (NZ)* Dotted line represents approximately the Line of Control in Jammu and Kashmir agreed upon by India and Pakistan. The final status of Jammu and Kashmir has not yet been agreed upon by the parties.
Final boundary between the Republic of Sudan and the Republic of South Sudan has not yet been determined.
1. The FYR of Macedonia2. Albania3. Montenegro4. Serbia5. Bosnia and Herzegovina6. Croatia7. Slovenia
8. Hungary9. Austria10. Czech Republic11. Slovakia12. Republic of Moldova13. Romania14. Bulgaria
Males favoured
Parity
Females favoured
No data
Percentage of countries within parity range in primary education, 1970–2009
1970 1980 1990
Perc
enta
ge o
f cou
ntrie
s (%
)
2000 2009
100
90
80
70
60
50
40
30
20
10
0
Source: UNESCO Institute for Statistics
North Americaand WesternEurope
Central andEastern Europe
Latin Americaand theCaribbean
East Asia andthe Pacific
South andWest Asia
Sub-SaharanAfrica
Arab States
Central Asia
Figure 3.3.1 Pace of movement toward gender parity varies among regions
1.081.061.041.041.041.041.031.03
MauritaniaNauru-1
Kiribati-1
BangladeshSenegalChinaMalawiArmenia
Country GPI
0.550.670.700.710.800.810.810.82
Somalia-2
AfghanistanChadCentral African Republic+1
Yemen-1
Angola-1
Côte d'IvoireNiger+1
Country GPI
Table 3.3.1 Examples of countries with more girls and more boys
Countries with more females enrolled, 2009 or latest year available
Countries with more males enrolled, 2009 or latest year available
Note: +1 refer to 2010 data; -1 refer to 2008 data; -2 refer to 2007 dataSource: UNESCO Institute for Statistics
Although boys continue to have a slight edge in access to primary education in some areas, girls have been the principal beneficiaries of the trend toward higher gross enrolment ratios. These gains are reflected in data on gender parity.
Map 3.3.1 depicts the gender parity index at the primary level for 193 countries. It shows that nearly two-thirds (128) of these countries have achieved gender parity. Boys have the edge in all but 8 of the 65 countries that do not show gender parity. Examples of these countries are shown in Table 3.3.1.
Figure 3.3.1 depicts the percentage of countries in each region that have been within the range of gender parity (0.97 to 1.03) from 1970 to 2009. The eight regions fall into three categories. Countries in three regions – North America and Western Europe, Central Asia, and Central and Eastern Europe – began in 1970 with relatively high levels of parity and have maintained these levels despite a dip in the 1980s. In two other regions – Latin America and the Caribbean,
Table 3.3.1 provides lists of eight countries that have more females in primary schools as well as eight with more males. The range varies from the 1.08 advantage of females in Mauritania to the 0.55 in favour of males in Somalia.
While almost all countries have made progress towards gender parity, there are significant differences among regions. Moreover, while the gap between regions with high and low levels of gender parity has narrowed, it still remains significant.
and East Asia and the Pacific – about half of countries had achieved parity in 1970, and this proportion has grown.
The greatest gains were registered by the three regions that had the lowest proportions in 1970 – the Arab States, sub-Saharan Africa, and South and West Asia. These regions continue to lag behind the other five, but the gap is narrowing. The most dramatic gains came in sub-Saharan Africa and the Arab States, where the proportion of countries achieving parity quadrupled over the four decades from 1970 to 2009.
3. Significant progress in gender parityat the primary level
Map 3.3.1 Two-thirds of countries show gender parity in primary schools
Gender parity index in primary education
CHAPTER 3 Enrolment and gender trends: primary education
Source: UNESCO Institute for Statistics
38 39
see below
LebanonCyprus
Israel
Maldives
Gambia
Tunisia
Sierra Leone
Liberia
Ireland
Jordan
Bhutan
Rwanda
Lesotho
Guinea-Bissau
Seychelles
Comoros
Djibouti
Armenia
BruneiDarussalam
Timor-Leste
Burundi
Swaziland
Kuwait
Singapore
Trinidad and TobagoGrenadaSt. Vincent & GrenadinesBarbadosSt. LuciaDominica
St. Kitts and NevisAntigua and Barbuda
El Salvador
JamaicaHaiti
Papua New Guinea
Uganda
Georgia
Gabon
CentralAfrican
Republic
Palau
Bangladesh
Iceland
Guatemala Honduras
Panama
Senegal
NicaraguaCosta Rica
Mauritius
Democratic People’sRepublic of Korea
SriLanka
Republicof Korea
Belize
Bahamas
CapeVerde
Dominican Republic
Cuba
Kyrgyzstan
Tajikistan
Cambodia
Greece
13245
67 891011
1213
14
Ecuador
UnitedKingdom
Afghanistan
Thailand
Zimbabwe
Germany
Botswana
Philippines
SouthAfrica
NewZealand
Madagascar
Mexico
Colombia
Côted’Ivoire
Guinea
Uruguay
Myanmar
Finland
Namibia
Venezuela
Mauritania
Nigeria
Bolivia
United Statesof America
SyrianArab Rep.
SpainPortugal
LiechtensteinSwitzerland
SanMarino
MonacoAndorra
Luxembourg
Belgium
EstoniaDenmark
Malta
LatviaLithuania
France
Morocco Iraq
Kenya
PolandUkraine
Egypt
Yemen
EthiopiaSouthSudan
Malaysia
United Republicof Tanzania
Angola
IslamicRepublic of Iran
Saudi Arabia
Chad
DemocraticRepublic of theCongo
India
Zambia
Turkey
KazakhstanMongolia
Libya
Niger
Indonesia
Mali
Brazil
Sudan
Australia
China
Canada
QatarBahrain
Azerbaijan
Algeria
United Arab Emirates
BurkinaFaso
São Tomé and PríncipeEquatorial Guinea
Belarus
MarshallIslands
Fed. States ofMicronesia
LaoP.D.R.
Netherlands
Italy
Russian Federation
Congo
Guyana
Suriname
Peru
Chile
Argentina
Paraguay
NorwaySweden
Turkmenistan
Uzbekistan
Pakistan
Oman
Eritrea
Nepal
Japan
Ghana
BeninTogo
Cameroon Somalia
Malawi
Mozambique
Viet Nam
Tonga
Tuvalu
NauruKiribati
Fiji
Samoa
Vanuatu
SolomonIslands
British Virgin Islands
Macao SAR, China
Aruba (Neth.)
Cayman Islands
(UK)WesternSahara
Greenland(Denmark)
Jammu and Kashmir*Bermuda (UK)
Anguilla (UK)
Turks andCaicos Is.
(UK)
Gibraltar (UK)
Puerto Rico(USA)
Hong Kong SAR, China
Montserrat (UK)
Faroe Islands(Den.)
Niue (NZ)Cook Islands(NZ)
Tokelau (NZ)
* Dotted line represents approximately the Line of Control in Jammu and Kashmir agreed upon by India and Pakistan. The final status of Jammu and Kashmir has not yet been agreed upon by the parties.
Final boundary between the Republic of Sudan and the Republic of South Sudan has not yet been determined.
1. The FYR of Macedonia2. Albania3. Montenegro4. Serbia5. Bosnia and Herzegovina6. Croatia7. Slovenia
8. Hungary9. Austria10. Czech Republic11. Slovakia12. Republic of Moldova13. Romania14. Bulgaria
Less than 1%
[1% – 5%[
[5% – 10%[
[10% – 20%[
Greater than 20%
No data
Almost all countries face disparities in the way pupils progress through school, with girls usually doing so in a more timely manner than boys. Repetition of grades is an important determinant of whether or not pupils persist and eventually complete primary school. Repetition rates are an indication of the internal inefficiencies of education systems, and some studies on student learning have questioned the pedagogical benefits of holding pupils back.
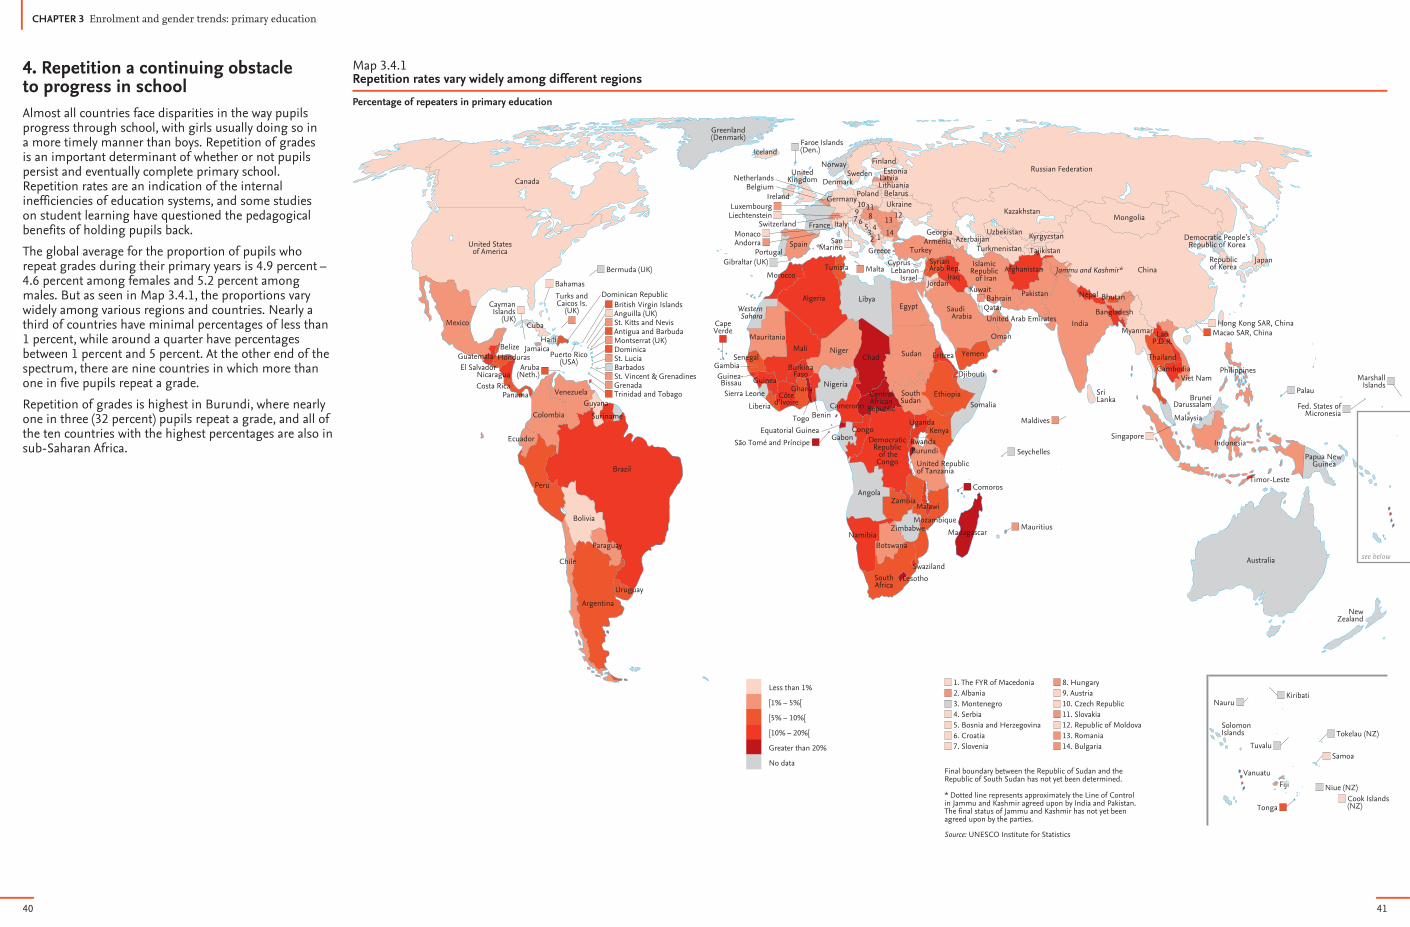
The global average for the proportion of pupils who repeat grades during their primary years is 4.9 percent – 4.6 percent among females and 5.2 percent among males. But as seen in Map 3.4.1, the proportions vary widely among various regions and countries. Nearly a third of countries have minimal percentages of less than 1 percent, while around a quarter have percentages between 1 percent and 5 percent. At the other end of the spectrum, there are nine countries in which more than one in five pupils repeat a grade.
Repetition of grades is highest in Burundi, where nearly one in three (32 percent) pupils repeat a grade, and all of the ten countries with the highest percentages are also in sub-Saharan Africa.
4. Repetition a continuing obstacle to progress in school
Map 3.4.1 Repetition rates vary widely among different regions
Percentage of repeaters in primary education
CHAPTER 3 Enrolment and gender trends: primary education
Source: UNESCO Institute for Statistics
40 41

Countries with gender parity in repetition rates, 2009 or latest year available
Countries where there are more female repeaters, 2009 or latest year available
Arab StatesEast Asia and the PacificEast Asia and the PacificLatin America and the CaribbeanLatin America and the CaribbeanLatin America and the CaribbeanNorth America and Western EuropeNorth America and Western EuropeNorth America and Western EuropeNorth America and Western EuropeNorth America and Western EuropeNorth America and Western EuropeNorth America and Western EuropeNorth America and Western EuropeCentral and Eastern EuropeCentral and Eastern EuropeCentral AsiaEast Asia and the PacificArab StatesSouth and West AsiaSub-Saharan AfricaSub-Saharan AfricaArab StatesSub-Saharan AfricaSub-Saharan AfricaSub-Saharan AfricaSouth and West AsiaSub-Saharan AfricaSub-Saharan AfricaSub-Saharan AfricaSub-Saharan AfricaSub-Saharan AfricaSub-Saharan AfricaSub-Saharan Africa
Occupied Palestinian TerritoryCook Islands+1
Japan-1
Anguilla-1
Bahamas-1
Cayman Islands-1
AustriaCanada-3
IcelandLiechtensteinSan MarinoSwedenUnited Kingdom-1
United States of AmericaBelarus-1
UkraineTajikistanMyanmarBahrainIndiaNiger+1
SenegalDjiboutiBurkina Faso+1
UgandaMali+1
Nepal+1
BeninDemocratic Republic of the CongoMalawiCôte d'IvoireCentral African Republic+1
Comoros-1
Burundi
--------------
0.10.10.20.41.93.44.47.49.9
10.111.512.914.014.315.618.418.720.924.432.3
Region Country
Malerepetition
rate
--------------
0.10.10.20.41.93.54.57.6
10.110.111.912.814.114.315.219.018.920.624.532.3
Femalerepetition
rate
Arab StatesArab StatesArab StatesCentral and Eastern EuropeLatin America and the CaribbeanSub-Saharan AfricaSub-Saharan AfricaSub-Saharan Africa
QatarJordan-1
OmanTurkey-1
Antigua and BarbudaLiberia-1
GuineaChad
0.50.61.32.15.46.5
14.722.3
0.50.61.62.26.76.9
16.123.6
Note: +1 refer to 2010 data; -1 refer to 2008 data;
Source: UNESCO Institute for Statistics -2 refer to 2007 data; -3 refer to 2006 data
Table 3.4.3 Some countries have more female repeaters
Percentage of countries according to repetition rates
More male repeaters75%
More female repeaters5%
Parity20%
10.7%1.7%
0.6%5.3%1.7%
Source: UNESCO Institute for Statistics
More male repeatersMore female repeatersParityLess than 1%[1% – 5%[[5% – 10%[[10% – 20%[Greater than 20%
Figure 3.4.2 Male repeaters outnumber females in 75 percent of countries
30
25
20
15
10
5
0
São
Tom
éan
d Pr
ínci
pe-1
Equa
toria
lG
uine
a+1
Leso
tho
Tim
or-L
este
Swaz
iland
-2
Surin
ame-1
Iraq
-2
Nam
ibia
Vanu
atu
Nic
arag
ua-1
Mor
occo
Alge
ria
Cape
Ver
de
Leba
non
Thai
land
-2
Arub
a
Uru
guay
-1
Tuni
sia
Dom
inic
anRe
publ
ic
Briti
sh V
irgin
Isla
nds
Mac
ao S
AR,
Chin
a
Dom
inic
a
Percentage of repeaters for selected countries, 2009 or latest year available
Note: +1 refer to 2010 data; -1 refer to 2008 data; -2 refer to 2007 dataSource: UNESCO Institute for Statistics
Perc
enta
ge o
f rep
eate
rs (%
)
Male Female
Figure 3.4.1 Boys are more likely to repeat than girls
BurundiComoros-1
São Tomé and Príncipe-1
TogoChadCentral African Republic+1
LesothoMadagascarEquatorial Guinea+1
Congo
32.324.424.222.922.820.720.520.420.419.7
Country Repetition rate
Note: +1 refer to 2010 data; -1 refer to 2008 dataSource: UNESCO Institute for Statistics
Table 3.4.2 Countries with highest percentage of repeaters, 2009 or latest year available
Regional percentage of repeaters, 2009 or latest year available
Arab StatesCentral and Eastern EuropeCentral AsiaEast Asia and the PacificLatin America and the CaribbeanNorth America and Western EuropeSouth and West Asia-1
Sub-Saharan AfricaWorld
6.91.20.11.58.50.84.89.74.9
Region Percentage
Regional percentage of repeaters by gender, 2009 or latest year available
Arab StatesCentral and Eastern EuropeCentral AsiaEast Asia and the PacificLatin America and the CaribbeanNorth America and Western EuropeSouth and West Asia-1
Sub-Saharan AfricaWorld
5.71.50.11.38.21.34.88.94.6
Region Female
8.00.90.11.88.70.34.9
10.55.2
Male
Note: -1 refer to 2008 dataSource: UNESCO Institute for Statistics
Table 3.4.1 Largest proportions of repeaters found in Latin America and the Caribbean and sub-Saharan Africa
As already noted, boys are far more likely than girls to be repeaters at the primary level. Table 3.4.1 shows that this pattern applies to all regions except for Central Asia, where there are negligible repetition rates for both sexes and for Central and Eastern Europe, and North America and Western Europe where the repetition rates for females are slightly higher.
Figure 3.4.2 indicates that male repeaters outnumber females in 75 percent of countries, while female repeaters are more numerous in only 5 percent. The other 20 percent of countries are at parity. It is interesting to note that half of the countries that are at parity have very low repetition rates.
Figure 3.4.1 depicts the extent to which a higher percentage of boys repeat in 22 selected countries. The differences range from 2.5 percentage points in Vanuatu to a 5.5 point differential in Suriname.
Male and female repetition rates can be similar in countries where the overall repetition rates fall in different levels. As seen in Table 3.4.3, such parity exists in Myanmar (0.4 for both sexes), Nepal (14.0 for males, 14.1 for females) and Burundi (32.3 for both sexes).
Table 3.4.1 shows how repetition levels differ among regions. The practice is negligible in Central Asia and in North America and Western Europe, both of which record percentages below 1 percent. Less than 1.5 percent of students are held back in two other regions: Central and Eastern Europe and East Asia and the Pacific.
The largest proportions of repeaters are found in Latin America and the Caribbean and in sub-Saharan Africa, where the proportion of one in ten students is more than double the global average. As shown in Table 3.4.2, ten of the countries with the highest repetition rates are in sub-Saharan Africa.
CHAPTER 3 Enrolment and gender trends: primary education
42 43

see below
LebanonCyprus
Israel
Maldives
Gambia
Tunisia
Sierra Leone
Liberia
Ireland
Jordan
Bhutan
Rwanda
Lesotho
Guinea-Bissau
Seychelles
Comoros
Djibouti
Armenia
BruneiDarussalam
Timor-Leste
Burundi
Swaziland
Kuwait
Singapore
Trinidad and TobagoGrenadaSt. Vincent & GrenadinesBarbadosSt. LuciaDominica
St. Kitts and NevisAntigua and Barbuda
El Salvador
JamaicaHaiti
Papua New Guinea
Uganda
Georgia
Gabon
CentralAfrican
Republic
Palau
Bangladesh
Iceland
Guatemala Honduras
Panama
Senegal
NicaraguaCosta Rica
Mauritius
Democratic People’sRepublic of Korea
SriLanka
Republicof Korea
Belize
Bahamas
CapeVerde
Dominican Republic
Cuba
Kyrgyzstan
Tajikistan
Cambodia
Greece
13245
67 891011
1213
14
Ecuador
UnitedKingdom
Afghanistan
Thailand
Zimbabwe
Germany
Botswana
Philippines
SouthAfrica
NewZealand
Madagascar
Mexico
Colombia
Côted’Ivoire
Guinea
Uruguay
Myanmar
Finland
Namibia
Venezuela
Mauritania
Nigeria
Bolivia
United Statesof America
SyrianArab Rep.
SpainPortugal
LiechtensteinSwitzerland
SanMarino
MonacoAndorra
Luxembourg
Belgium
EstoniaDenmark
Malta
LatviaLithuania
France
Morocco Iraq
Kenya
PolandUkraine
Egypt
Yemen
EthiopiaSouthSudan
Malaysia
United Republicof Tanzania
Angola
IslamicRepublic of Iran
Saudi Arabia
Chad
DemocraticRepublic of theCongo
India
Zambia
Turkey
KazakhstanMongolia
Libya
Niger
Indonesia
Mali
Brazil
Sudan
Australia
China
Canada
QatarBahrain
Azerbaijan
Algeria
United Arab Emirates
BurkinaFaso
São Tomé and PríncipeEquatorial Guinea
Belarus
MarshallIslands
Fed. States ofMicronesia
LaoP.D.R.
Netherlands
Italy
Russian Federation
Congo
Guyana
Suriname
Peru
Chile
Argentina
Paraguay
NorwaySweden
Turkmenistan
Uzbekistan
Pakistan
Oman
Eritrea
Nepal
Japan
Ghana
BeninTogo
Cameroon Somalia
Malawi
Mozambique
Viet Nam
Tonga
Tuvalu
NauruKiribati
Fiji
Samoa
Vanuatu
SolomonIslands
British Virgin Islands
Macao SAR, China
Aruba (Neth.)
Cayman Islands
(UK)WesternSahara
Greenland(Denmark)
Jammu and Kashmir*Bermuda (UK)
Anguilla (UK)
Turks andCaicos Is.
(UK)
Gibraltar (UK)
Puerto Rico(USA)
Hong Kong SAR, China
Montserrat (UK)
Faroe Islands(Den.)
Niue (NZ)Cook Islands(NZ)
Tokelau (NZ)
* Dotted line represents approximately the Line of Control in Jammu and Kashmir agreed upon by India and Pakistan. The final status of Jammu and Kashmir has not yet been agreed upon by the parties.
Final boundary between the Republic of Sudan and the Republic of South Sudan has not yet been determined.
1. The FYR of Macedonia2. Albania3. Montenegro4. Serbia5. Bosnia and Herzegovina6. Croatia7. Slovenia
8. Hungary9. Austria10. Czech Republic11. Slovakia12. Republic of Moldova13. Romania14. Bulgaria
Less than 1%
[1% – 5%[
[5% – 15%[
[15% – 30%[
Greater than 30%
No data
Percentage of countries according to dropout rates in primary education for sub-Saharan Africa and the remaining regionsof the world, 2009
Remainingregions ofthe world
Sub-SaharanAfrica
3%6%
28%
63%33%
28%
14%
13% 12%
Source: UNESCO Institute for Statistics
Less than 1%[1% – 5%[[5% – 15%[[15% – 30%[Greater than 30%
Dropout rate
Figure 3.5.1 Dropout rates high in two out of three sub-Saharan countries
A major obstacle to reaching the goal of universal primary education is the high dropout rates that characterize many countries. The causes of dropping out, or “school wastage”, are mostly rooted in the overall social and economic environment and those that stem from the way the school system itself is organized and operates. Data show that dropout rates are highly sensitive to the national economic context. Studies in certain less developed countries, for example, have shown a significant and positive correlation between dropout rates and the percentage of people having a very poor income, since even when public schools are ostensibly free, parents must bear various direct costs to educate their children such as purchasing school supplies, textbooks, etc. A poor economy can also be the cause of having classrooms with unfavourable working conditions and teachers that have poor teaching skills. High dropout rates are also observed in countries where there is high mortality amongst adults (e.g. Tanzania). In these situations, the child may be needed to care for the ill or replace them in different economic activities. As a result, the child may attend fewer hours or drop out of school.
Map 3.5.1 and Figure 3.5.1 show how rates vary across the world, with the number of countries spread fairly evenly across the five categories. For sub-Saharan Africa, nearly two-thirds of the countries (63 percent) have a dropout rate greater than 30 percent, compared to only 13 percent in the remaining regions of the world.
Globally, 48 countries have rates of less than 5 percent, where only one (Mauritius) is in sub-Saharan Africa, while 33 others register rates greater than 30 percent, of which 20 are located in sub-Saharan Africa.
5. Dropout a threatto universal primary education
Map 3.5.1 Dropout rates vary widely among different regions
Dropout rate in primary education
CHAPTER 3 Enrolment and gender trends: primary education
Source: UNESCO Institute for Statistics
44 45

Dropout rates by gender for selected countries, 2009 or latest year available
0
10
20
30
40
50
Chad
-4
Cent
ral
Afric
an R
ep.
Libe
ria-2
Gui
nea-1
Togo
-2
Gha
na-1
São
Tom
éan
d Pr
ínci
pe-2
Dem
. Rep
. Con
go-2
Mar
shal
l Isl
ands
-1
Saud
i Ara
bia-2
Ethi
opia
-1
Leso
tho-3
Nic
arag
ua-2
Cam
bodi
a-2
Buru
ndi-2
Surin
ame-3
Phili
ppin
es-2
Uni
ted
Rep.
of T
anza
nia-1
Indo
nesi
a-2
Nam
ibia
-1
Colo
mbi
a-3
Bhut
an-1
Suda
n-2
Arub
a-1
Mal
ta-2
Vene
zuel
a-1
Qat
ar-2
60
70
80
Dro
pout
rate
(%)
Note: -1 refer to 2008 data; -2 refer to 2007 data; -3 refer to 2006 data; -4 refer to 2005 dataSource: UNESCO Institute for Statistics
Male Female
Figure 3.5.4 Examples of male/female dropout rates among countries
Dropout rates by gender for all countries with available data, 2009 or latest year available
Dropout rate higher for girls in49 countries
Dropout rate higher for boys in84 countries
Chad-4
Ethiopia-1
Lesotho-3
Nicaragua-2
Madagascar-1
Mauritania-2
Malawi-1
Cambodia-2Guinea-1
Guatemala-2 Djibouti-1
Lao PDR-2
Togo-2
Burundi-2
Senegal-1
Nepal-2Niger
Côted’Ivoire-1
Pakistan-1
Burkina Faso
Suriname-3
United Republic of Tanzania-1Swaziland-3
Philippines-2Honduras-2
El Salvador-2
Eritrea-1
Paraguay-1Ecuador-3
Indonesia-2
Liechtenstein-1Namibia-1
Colombia-3
Bhutan-1
Argentina-2Qatar-2
Venezuela-1Latvia-1
Israel-1St Lucia-1
Aruba-1
Sudan-2
Panama-1
Malta-2
Marshall Islands-1
SaudiArabia-2 Dominica-2
Botswana-4
Mali
Guyana-1
Bolivia-2
Cape Verde-2
Democratic Republic of the Congo-2São Tomé and Príncipe-2
Ghana-1Vanuatu-1
Gambia
Zambia-1Uganda-1
Liberia-2
Central AfricanRepublic
Mozambique
00
10
10
20
20
30
30
40
40
50
50
60
60
70
70
80
80
Fem
ale
drop
out r
ate
(%)
Male dropout rates (%)Note: -1 refer to 2008 data; -2 refer to 2007 data; -3 refer to 2006 data; -4 refer to 2005 dataSource: UNESCO Institute for Statistics
Figure 3.5.3 Boys more likely than girls to leave school
Dropout rates for selected countries, primary education, 2009 or latest year available
Sub-SaharanAfrica
North Americaand Western
Europe
Central andEastern Europe
Arab States Central Asia Latin Americaand the
Caribbean
East Asia andthe Pacific
80
50
Dro
pout
rate
(%)
Occ
upie
d Pa
lest
inia
nTe
rrito
ry-3
Uni
ted
Arab
Emira
tes-3
Djib
outi-1
Mau
ritan
ia-2
Czec
h Re
publ
ic-1
Slov
enia
-1
Turk
ey-2
Bulg
aria
-1
Tajik
ista
n-2
Kaza
khst
an
Geo
rgia
-1
Mon
golia
-2
Japa
n-1
Hon
g Ko
ng S
AR, C
hina
-2
Lao
PDR-2
Cam
bodi
a-2
Arge
ntin
a-2
Cuba
-1
Gua
tem
ala-2
Nic
arag
ua-2
Italy
-2
Finl
and-1
Belg
ium
-1
Mal
ta-2
Sri L
anka
-3
Iran
-1
Nep
al-2
Paki
stan
-1
Mau
ritiu
s-1
Bots
wan
a-4
Moz
ambi
que
Chad
-4
60
70
40
30
20
10
0
South andWest Asia
Note: -1 refer to 2008 data; -2 refer to 2007 data; -3 refer to 2006 data; -4 refer to 2005 dataSource: UNESCO Institute for Statistics
Countries with lowest dropout rates Countries with highest dropout rates
Figure 3.5.2 How dropout rates vary among countries
The range of dropout rates is wide within various countries and regions. Figure 3.5.2 shows the rates at four different levels for selected countries in each region. The largest dropout problem is found in Chad, where nearly three-quarters (70 percent) of pupils drop out before completing the full primary education cycle. As shown in Figure 3.5.1, sub-Saharan Africa is notable for the fact that whereas 63 percent of countries have rates above 30 percent, only 3 percent have rates in the zero to 5 percent range.
Gender is a significant factor in school survival in almost every country in the world regardless of its state of development, with boys usually dropping out at much higher rates than girls.
Figure 3.5.3 demonstrates both the wide range of dropout rates among various countries and the fact that the number of countries with higher male rates is almost twice as large as those with higher female rates.
Figure 3.5.4 shows the pattern for 27 selected countries – 17 with higher rates for boys and 10 in which girls have a higher rate. Substantial gaps favouring females are found in Lesotho, where the rates are 62 percent for boys and 44 percent for girls, and in Sudan and Aruba, where boys are more than five times as likely to drop out of primary school as girls. The largest gap favouring males exists in Togo, where the rate is 38 percent for females and only 24 percent for males.
CHAPTER 3 Enrolment and gender trends: primary education
46 47

see below
LebanonCyprus
Israel
Maldives
Gambia
Tunisia
Sierra Leone
Liberia
Ireland
Jordan
Bhutan
Rwanda
Lesotho
Guinea-Bissau
Seychelles
Comoros
Djibouti
Armenia
BruneiDarussalam
Timor-Leste
Burundi
Swaziland
Kuwait
Singapore
Trinidad and TobagoGrenadaSt. Vincent & GrenadinesBarbadosSt. LuciaDominica
St. Kitts and NevisAntigua and Barbuda
El Salvador
JamaicaHaiti
Papua New Guinea
Uganda
Georgia
Gabon
CentralAfrican
Republic
Palau
Bangladesh
Iceland
Guatemala Honduras
Panama
Senegal
NicaraguaCosta Rica
Mauritius
Democratic People’sRepublic of Korea
SriLanka
Republicof Korea
Belize
Bahamas
CapeVerde
Dominican Republic
Cuba
Kyrgyzstan
Tajikistan
Cambodia
Greece
13245
67 891011
1213
14
Ecuador
UnitedKingdom
Afghanistan
Thailand
Zimbabwe
Germany
Botswana
Philippines
SouthAfrica
NewZealand
Madagascar
Mexico
Colombia
Côted’Ivoire
Guinea
Uruguay
Myanmar
Finland
Namibia
Venezuela
Mauritania
Nigeria
Bolivia
United Statesof America
SyrianArab Rep.
SpainPortugal
LiechtensteinSwitzerland
SanMarino
MonacoAndorra
Luxembourg
Belgium
EstoniaDenmark
Malta
LatviaLithuania
France
Morocco Iraq
Kenya
PolandUkraine
Egypt
Yemen
EthiopiaSouthSudan
Malaysia
United Republicof Tanzania
Angola
IslamicRepublic of Iran
Saudi Arabia
Chad
DemocraticRepublic of theCongo
India
Zambia
Turkey
KazakhstanMongolia
Libya
Niger
Indonesia
Mali
Brazil
Sudan
Australia
China
Canada
QatarBahrain
Azerbaijan
Algeria
United Arab Emirates
BurkinaFaso
São Tomé and PríncipeEquatorial Guinea
Belarus
MarshallIslands
Fed. States ofMicronesia
LaoP.D.R.
Netherlands
Italy
Russian Federation
Congo
Guyana
Suriname
Peru
Chile
Argentina
Paraguay
NorwaySweden
Turkmenistan
Uzbekistan
Pakistan
Oman
Eritrea
Nepal
Japan
Ghana
BeninTogo
Cameroon Somalia
Malawi
Mozambique
Viet Nam
Tonga
Tuvalu
NauruKiribati
Fiji
Samoa
Vanuatu
SolomonIslands
British Virgin Islands
Macao SAR, China
Aruba (Neth.)
Cayman Islands
(UK)WesternSahara
Greenland(Denmark)
Jammu and Kashmir*Bermuda (UK)
Anguilla (UK)
Turks andCaicos Is.
(UK)
Gibraltar (UK)
Puerto Rico(USA)
Hong Kong SAR, China
Montserrat (UK)
Faroe Islands(Den.)
Niue (NZ)Cook Islands(NZ)
Tokelau (NZ)
* Dotted line represents approximately the Line of Control in Jammu and Kashmir agreed upon by India and Pakistan. The final status of Jammu and Kashmir has not yet been agreed upon by the parties.
Final boundary between the Republic of Sudan and the Republic of South Sudan has not yet been determined.
1. The FYR of Macedonia2. Albania3. Montenegro4. Serbia5. Bosnia and Herzegovina6. Croatia7. Slovenia
8. Hungary9. Austria10. Czech Republic11. Slovakia12. Republic of Moldova13. Romania14. Bulgaria
Less than 80%
[80% – 90%[
[90% – 95%[
[95% – 100%[
Greater than 100%
No data
Sub-SaharanAfrica
ArabStates
CentralAsia
South andWest Asia
East Asiaand thePacific*
Central andEasternEurope
Latin Americaand the
Caribbean
North Americaand Western
Europe
World
110
100
90
80
70
60
50
40
Primary completion rates by region and gender, 1999–2009
Note: * 2009 data for East Asia and the Pacific refers to 2007Source: UNESCO Institute for Statistics
Prim
ary
com
plet
ion
rate
(%)
1999 2009 Male Female
Figure 3.6.1 Rise seen in most regions and among both sexes
Dropout rates by definition have a negative impact on school completion rates. By lowering the number of students who drop out at the primary level, countries will not only increase their primary school completion rates but set the stage for progression through lower secondary and post-compulsory education and training.
Map 3.6.1 depicts the primary completion rates for 173 countries around the world. It shows that around half of countries (45 percent) have rates of 95 percent or higher. At the other end of the spectrum, a quarter of countries have no more than four out of five pupils who complete primary education.
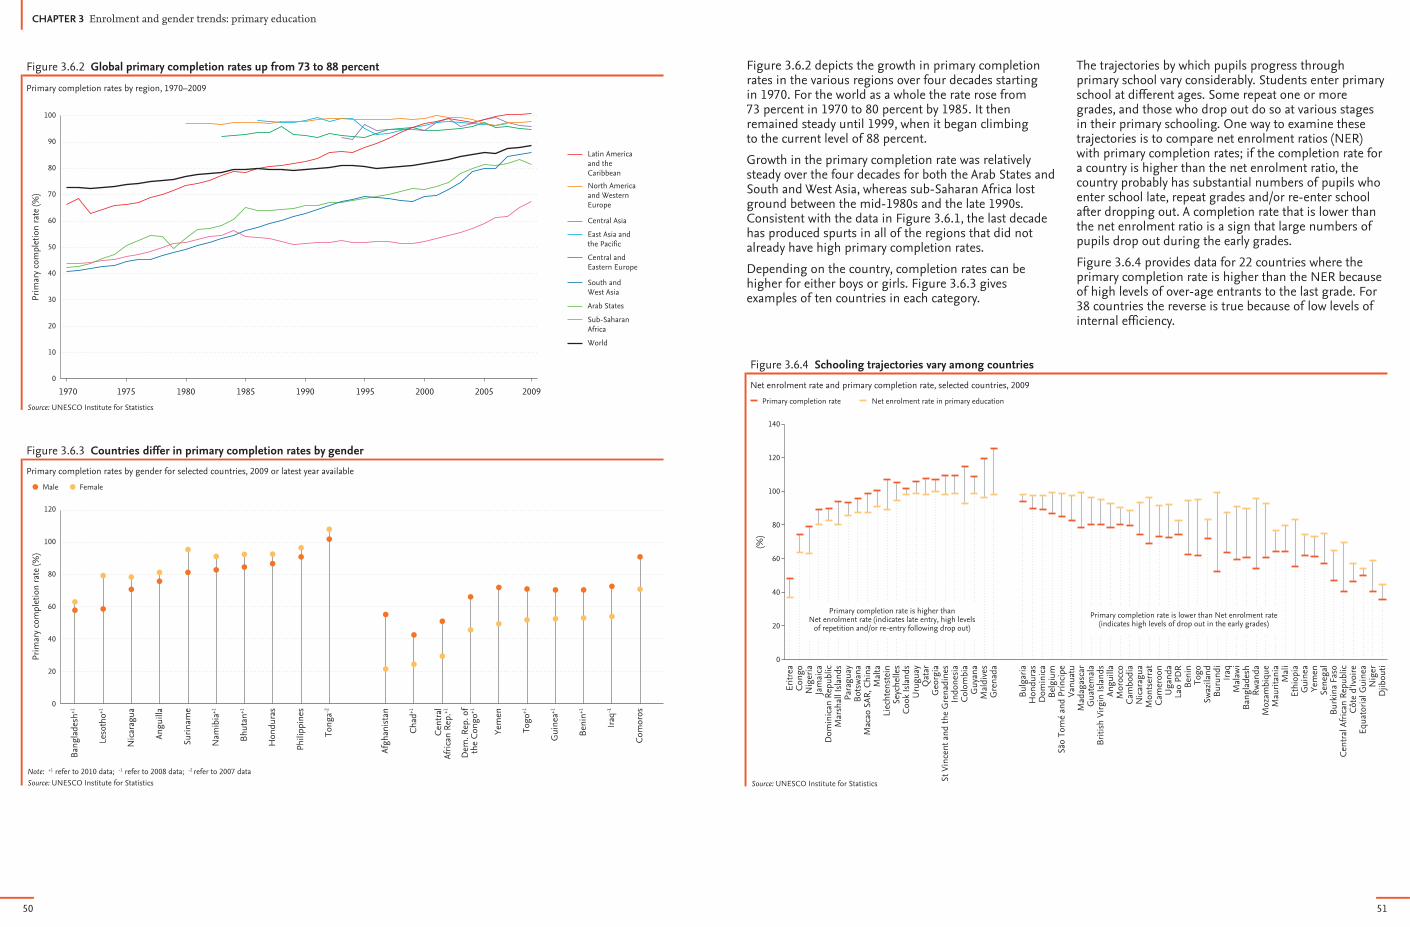
For the world as a whole, primary completion rates rose significantly over the last decade for both sexes. As shown in Figure 3.6.1, the rates for girls increased from 78 to 87 percent, while those for males grew from 84 to 90 percent. Completion rates are higher for boys in all but two of the regions: Latin America and the Caribbean, and East Asia and the Pacific.
The largest gains occurred in the three regions that started at a relatively low base in 1999: sub-Saharan Africa, South and West Asia, and the Arab States. In sub-Saharan Africa, for example, completion rates jumped from 47 to 64 percent for girls and from 55 to 71 percent for boys. Latin America and the Caribbean is notable because by 2009 the primary completion rate had surpassed 100 percent for both sexes. Changes were both modest and mixed in the other four regions that started at relatively high levels in 1999.
6. Primary level completion rates on the rise
Map 3.6.1 Primary completion rates at least 95 percent in half of countries
Primary completion rate
CHAPTER 3 Enrolment and gender trends: primary education
Source: UNESCO Institute for Statistics
48 49
Net enrolment rate and primary completion rate, selected countries, 2009
0
20
40
60
80
Eritr
eaCo
ngo
Nig
eria
Jam
aica
Dom
inic
an R
epub
licM
arsh
all I
slan
dsPa
ragu
ayBo
tsw
ana
Mac
ao S
AR, C
hina
Mal
taLi
echt
enst
ein
Seyc
helle
sCo
ok Is
land
sU
rugu
ayQ
atar
Geo
rgia
St V
ince
nt a
nd th
e G
rena
dine
sIn
done
sia
Colo
mbi
aG
uyan
aM
aldi
ves
Gre
nada
Bulg
aria
Hon
dura
sD
omin
ica
Belg
ium
São
Tom
é an
d Pr
ínci
peVa
nuat
uM
adag
asca
rG
uate
mal
aBr
itish
Virg
in Is
land
sAn
guill
aM
oroc
coCa
mbo
dia
Nic
arag
uaM
onts
erra
tCa
mer
oon
Uga
nda
Lao
PDR
Beni
nTo
goSw
azila
ndBu
rund
iIr
aqM
alaw
iBa
ngla
desh
Rwan
daM
ozam
biqu
eM
aurit
ania
Mal
iEt
hiop
iaG
uine
aYe
men
Sene
gal
Burk
ina
Faso
Cent
ral A
fric
an R
epub
licCô
te d
'Ivoi
reEq
uato
rial G
uine
aN
iger
Djib
outi
120
100
140
(%)
Primary completion rate is lower than Net enrolment rate(indicates high levels of drop out in the early grades)
Primary completion rate is higher thanNet enrolment rate (indicates late entry, high levels
of repetition and/or re-entry following drop out)
Source: UNESCO Institute for Statistics
Primary completion rate Net enrolment rate in primary education
Figure 3.6.4 Schooling trajectories vary among countries
Primary completion rates by gender for selected countries, 2009 or latest year available
0
20
40
60
80
Bang
lade
sh+1
Leso
tho+1
Nic
arag
ua
Angu
illa
Surin
ame
Nam
ibia
+1
Bhut
an+1
Hon
dura
s
Phili
ppin
es
Tong
a-2
Afgh
anis
tan
Chad
+1
Cent
ral
Afric
an R
ep.+1
Dem
. Rep
. of
the
Cong
o+1
Yem
en
Togo
+1
Gui
nea+1
Beni
n+1
Iraq
-1
Com
oros
100
120
Prim
ary
com
plet
ion
rate
(%)
Note: +1 refer to 2010 data; -1 refer to 2008 data; -2 refer to 2007 dataSource: UNESCO Institute for Statistics
Male Female
Figure 3.6.3 Countries differ in primary completion rates by gender
Primary completion rates by region, 1970–2009
100
80
90
60
70
40
50
20
30
10
0
1970 1975 19851980 1990 1995 2005 20092000
Prim
ary
com
plet
ion
rate
(%)
Source: UNESCO Institute for Statistics
North Americaand WesternEurope
Central andEastern Europe
Latin Americaand theCaribbean
East Asia andthe Pacific
South andWest Asia
Sub-SaharanAfrica
World
Arab States
Central Asia
Figure 3.6.2 Global primary completion rates up from 73 to 88 percent The trajectories by which pupils progress through primary school vary considerably. Students enter primary school at different ages. Some repeat one or more grades, and those who drop out do so at various stages in their primary schooling. One way to examine these trajectories is to compare net enrolment ratios (NER) with primary completion rates; if the completion rate for a country is higher than the net enrolment ratio, the country probably has substantial numbers of pupils who enter school late, repeat grades and/or re-enter school after dropping out. A completion rate that is lower than the net enrolment ratio is a sign that large numbers of pupils drop out during the early grades.
Figure 3.6.4 provides data for 22 countries where the primary completion rate is higher than the NER because of high levels of over-age entrants to the last grade. For 38 countries the reverse is true because of low levels of internal efficiency.
Figure 3.6.2 depicts the growth in primary completion rates in the various regions over four decades starting in 1970. For the world as a whole the rate rose from 73 percent in 1970 to 80 percent by 1985. It then remained steady until 1999, when it began climbing to the current level of 88 percent.
Growth in the primary completion rate was relatively steady over the four decades for both the Arab States and South and West Asia, whereas sub-Saharan Africa lost ground between the mid-1980s and the late 1990s. Consistent with the data in Figure 3.6.1, the last decade has produced spurts in all of the regions that did not already have high primary completion rates.
Depending on the country, completion rates can be higher for either boys or girls. Figure 3.6.3 gives examples of ten countries in each category.
CHAPTER 3 Enrolment and gender trends: primary education
50 51

see below
LebanonCyprus
Israel
Maldives
Gambia
Tunisia
Sierra Leone
Liberia
Ireland
Jordan
Bhutan
Rwanda
Lesotho
Guinea-Bissau
Seychelles
Comoros
Djibouti
Armenia
BruneiDarussalam
Timor-Leste
Burundi
Swaziland
Kuwait
Singapore
Trinidad and TobagoGrenadaSt. Vincent & GrenadinesBarbadosSt. LuciaDominica
St. Kitts and NevisAntigua and Barbuda
El Salvador
JamaicaHaiti
Papua New Guinea
Uganda
Georgia
Gabon
CentralAfrican
Republic
Palau
Bangladesh
Iceland
Guatemala Honduras
Panama
Senegal
NicaraguaCosta Rica
Mauritius
Democratic People’sRepublic of Korea
SriLanka
Republicof Korea
Belize
Bahamas
CapeVerde
Dominican Republic
Cuba
Kyrgyzstan
Tajikistan
Cambodia
Greece
13245
67 891011
1213
14
Ecuador
UnitedKingdom
Afghanistan
Thailand
Zimbabwe
Germany
Botswana
Philippines
SouthAfrica
NewZealand
Madagascar
Mexico
Colombia
Côted’Ivoire
Guinea
Uruguay
Myanmar
Finland
Namibia
Venezuela
Mauritania
Nigeria
Bolivia
United Statesof America
SyrianArab Rep.
SpainPortugal
LiechtensteinSwitzerland
SanMarino
MonacoAndorra
Luxembourg
Belgium
EstoniaDenmark
Malta
LatviaLithuania
France
Morocco Iraq
Kenya
PolandUkraine
Egypt
Yemen
EthiopiaSouthSudan
Malaysia
United Republicof Tanzania
Angola
IslamicRepublic of Iran
Saudi Arabia
Chad
DemocraticRepublic of theCongo
India
Zambia
Turkey
KazakhstanMongolia
Libya
Niger
Indonesia
Mali
Brazil
Sudan
Australia
China
Canada
QatarBahrain
Azerbaijan
Algeria
United Arab Emirates
BurkinaFaso
São Tomé and PríncipeEquatorial Guinea
Belarus
MarshallIslands
Fed. States ofMicronesia
LaoP.D.R.
Netherlands
Italy
Russian Federation
Congo
Guyana
Suriname
Peru
Chile
Argentina
Paraguay
NorwaySweden
Turkmenistan
Uzbekistan
Pakistan
Oman
Eritrea
Nepal
Japan
Ghana
BeninTogo
Cameroon Somalia
Malawi
Mozambique
Viet Nam
Tonga
Tuvalu
NauruKiribati
Fiji
Samoa
Vanuatu
SolomonIslands
British Virgin Islands
Macao SAR, China
Aruba (Neth.)
Cayman Islands
(UK)WesternSahara
Greenland(Denmark)
Jammu and Kashmir*Bermuda (UK)
Anguilla (UK)
Turks andCaicos Is.
(UK)
Gibraltar (UK)
Puerto Rico(USA)
Hong Kong SAR, China
Montserrat (UK)
Faroe Islands(Den.)
Niue (NZ)Cook Islands(NZ)
Tokelau (NZ)
* Dotted line represents approximately the Line of Control in Jammu and Kashmir agreed upon by India and Pakistan. The final status of Jammu and Kashmir has not yet been agreed upon by the parties.
Final boundary between the Republic of Sudan and the Republic of South Sudan has not yet been determined.
1. The FYR of Macedonia2. Albania3. Montenegro4. Serbia5. Bosnia and Herzegovina6. Croatia7. Slovenia
8. Hungary9. Austria10. Czech Republic11. Slovakia12. Republic of Moldova13. Romania14. Bulgaria
Less than 1%
[1% – 5%[
[5% – 15%[
[15% – 20%[
Greater than 20%
No data
0
10
20
30
40
50
60
70
North Americaand Western
Europe
East Asiaand thePacific
Rate
of o
ut-o
f-sc
hool
chi
ldre
n (%
)
Latin Americaand the
Caribbean
Central andEasternEurope
Central Asia South andWest Asia
Arab States Sub-SaharanAfrica
Out-of-school rate for primary school-age children for selected countries and regions, 2009 or latest year available
Note: +1 refer to 2010 data; -1 refer to 2008 data; -2 refer to 2007 dataSource: UNESCO Institute for Statistics
UnitedKingdom-1 CubaJapan
AndorraMarshall Islands-2 Jamaica-1
Montenegro+1
Azerbaijan
Pakistan
Djibouti
Eritrea
Bulgaria TunisiaIslamic Rep.of Iran-2Mongolia Madagascar-2
Minimum MaximumRegional average
Figure 3.7.1 How out-of-school rates vary among regions
Recent progress in expanding access to primary education worldwide, and the narrowing of the gender gap, have translated into a decline in both absolute numbers, as well as the rate, of children out of school. Despite this progress, however, large numbers of children still lack access to schooling. Data show that in 2009 there were 68 million out-of-school primary-age children around the world.
As seen in Map 3.7.1, about one in seven countries (15 percent) have minimal proportions of such children of 0 to 1 percent, but another fifth of countries (20 percent) have rates of more than 15 percent. In 19 of these countries more than one in five children are out of school.
Figure 3.7.1 shows the regional rate of out-of-school children in primary education, as well as the range, along with the lowest and highest values in the region. The regions with the highest rate of out-of-school children are sub-Saharan Africa and the Arab States. It is interesting to observe that the regions with the highest rates also have the highest variation. In the Arab States for example, where the regional rate is 13.7 percent, the rate of out-of-school children goes as low as 0.6 percent (for Tunisia) up to 55.4 percent (for Djibouti).
7. Out-of-school children a continuingchallenge
Map 3.7.1 Children not in school heavily concentrated in three regions
Rate of out-of-school children
CHAPTER 3 Enrolment and gender trends: primary education
Source: UNESCO Institute for Statistics
52 53

Out-of-school trends, 1990–2009
120
100
27.57 26.90
20.56
6.58
9.56
13.32
16.07
11.73
22.58
18.63
22.43
12.20
23.57
17.06
20.99
80
60
40
20
01990 1992 1994 1996 1998 2000 2002 2004 2006 2009
Out
-of-
scho
ol c
hild
ren
(mill
ions
)
Note: (*) 2009 data for South and West Asia refer to 2008Source: UNESCO Institute for Statistics
Sub-Saharan Africa, female Sub-Saharan Africa, male South and West Asia, female (*) South and West Asia, male (*) Remaining regions of the world
Figure 3.7.6 Dramatic gains in girls’ school participation seen in South and West Asia
Percentage of female out-of-school children of primary age, by region and worldwide, 1990–2009
80
70
60
50
40
30
20
10
0South and
West Asia (*)East Asiaand the
Pacific (*)
Central AsiaCentral andEastern
Europe (*)
Latin Americaand the
Caribbean
Arab States North Americaand Western
Europe
Sub-SaharanAfrica
World
Note: (*) 1990 data for Central and Eastern Europe refers to the year 1993; 2009 data for East Asia and the Pacific refer to 2007; 2009 data for South and West Asia refer to 2008Source: UNESCO Institute for Statistics
Perc
enta
ge o
f fem
ale
out-
of-s
choo
l chi
ldre
n (%
)
1990 2000 2009
Figure 3.7.5 Decline of percentage of female out-of-school children greatest in East Asia and the Pacific
Rate of out-of-school children by region, 1999 and 2009
5
10
0
15
20
25
30
35
40
45
Rate
of o
ut-o
f-sc
hool
chi
ldre
n (%
)
Arab StatesCentral andEasternEurope
Central AsiaEast Asiaand thePacific
Latin Americaand the
Caribbean
North Americaand Western
Europe
South andWest Asia
Sub-SaharanAfrica
Source: UNESCO Institute for Statistics
1999 2009
Figure 3.7.4 Out-of-school rates declining, including in sub-Saharan Africa
Country distribution according to the out-of-school rate for primary school-age children, 2009
Remainingregions
of the world78%
18%
Sub-SaharanAfrica
39%
19%
42%
4%
Source: UNESCO Institute for Statistics
Greater than 20%10 – 20%Less than 10%
Figure 3.7.3 How sub-Saharan Africa compares to world
Distribution of out-of-school children, 2009
9%
2%1%
12%
4%3%
24%
45%
Source: UNESCO Institute for Statistics
Arab States
Central and Eastern EuropeCentral Asia
East Asia and the Pacific
Latin America and theCaribbean
North America andWestern Europe
South and West AsiaSub-Saharan Africa
Figure 3.7.2 Most out-of-school children living in three regions
As with the overall numbers of out-of-school children, the share of girls has been declining. Figure 3.7.5 indicates that globally the proportion of girls among out-of-school children has gone down steadily, from 60 percent in 1990 to 53 percent in 2009. The most dramatic decline has taken place in East Asia and the Pacific, where the proportion was almost halved, from 70 to 40 percent in 2007.
Figure 3.7.6 shows the decline in proportions of out-of-school children by sex in sub-Saharan Africa and South and West Asia. The most dramatic gains were among girls in South and West Asia, where the percentages were halved, from 24 to 10 million children.
The global population of out-of-school children is heavily concentrated in three regions of the world: sub-Saharan Africa, South and West Asia, and East Asia and the Pacific. As seen in Figure 3.7.2, together these regions account for more than four out of five (81 percent) out-of-school primary age children. The problem of out-of-school children is particularly serious in sub-Saharan Africa. Figure 3.7.3 shows that nearly four out of ten (39 percent) of countries in this region have rates above 20 percent, versus only 4 percent for the remaining regions of the world.
Within these regions, however, the patterns vary considerably. As seen in Figure 3.7.1, the percentages in sub-Saharan Africa range from 63 percent in Eritrea to a negligible percentage of 0.7 percent in Madagascar. Likewise, the proportions in Latin America and the Caribbean range from less than 1 percent in Cuba or Belize to 20 percent in Jamaica.
Despite the substantial number of children who remain out of school, the proportion is actually declining even though the overall school-age populations continue to increase. Figure 3.7.4 shows that the rates of out-of-school children were relatively stable between 1999 and 2009 for most regions and declined dramatically in the three areas where the problem had been most severe: South and West Asia, Arab States, and sub-Saharan Africa. Progress was greatest in sub-Saharan Africa, where, despite a number of countries with large out-of-school populations, the overall rate fell from 41 to 23 percent.
CHAPTER 3 Enrolment and gender trends: primary education
54 55

School attendance of primary school-age children: Urban versus rural areas
0
10
20
30
40
50
60
70
80
90
100
Prim
ary
ANAR
(%)
Burk
ina
Faso
Nig
er
Mal
i
Ethi
opia
Moz
ambi
que
Nig
eria
Dem
. Rep
.Co
ngo
Gha
na
Mad
agas
car
Tanz
ania
Zam
bia
Uga
nda
Cam
eroo
n
Mal
awi
Keny
a
Source: Demographic and Health Survey
National averageRural maleUrban maleRural femaleUrban female
Figure 3.9.2 Attendance also higher in urban than in rural areas
Primary adjusted net attendance rate: Richest versus poorest wealth quintile
Burk
ina
Faso
Nig
er
Mal
i
Ethi
opia
Moz
ambi
que
Nig
eria
Dem
. Rep
.Co
ngo
Gha
na
Mad
agas
car
Tanz
ania
Zam
bia
Uga
nda
Cam
eroo
n
Mal
awi
Keny
a0
10
20
30
40
50
60
70
80
90
100
Prim
ary
ANAR
(%)
Source: Demographic and Health Survey
National averageRich male Poor maleRich female Poor female
Figure 3.9.1 Primary school attendance highest in wealthy households
Percentage of overage boys and girls in the last grade of primary education, 2008 or latest year available
00
10
10
20
20
30
30
40
40
50
50
60
60
70
80
70
90
9080
Boys
who
are
ove
rage
as
% o
f all
boys
in th
e la
st g
rade
Girls who are overage as % of all girls in the last grade
Boys are more likely to be overage than girls
Girls are more likely to be overage than boys
Swaziland
Botswana
British VirginIslands
Namibia
Netherlands AntillesDominican Rep.
Morocco
Lesotho
Algeria
Lao PDR
EritreaBelize
Zambia
Suriname
Ethiopia
Madagascar
Grenada
El Salvador
Burundi
Trinidad & Tobago
Kenya
Timor-Leste
Colombia
Nicaragua
Uganda
Bhutan
Marshall Islands
Malawi
Yemen
Mozambique
Ghana
DjiboutiBolivia
Chad
Vanuatu
Cambodia
Andorra
Central African Republic
Isl. Rep. of Iran
Mali
Angola
Togo
Burkina Faso
Lebanon
Myanmar
Guinea-Bissau
Benin
Comoros
Liberia
Bangladesh
Equatorial Guinea
Note: For this chart, overage pupils are those who are two years or more older than the target age for their gradeSource: UNESCO Institute for Statistics
Figure 3.8.1 Boys more likely than girls to be overage at the end of primary school
Primary pupils may be overaged because they start school late or repeat grades. Being overage in school affects boys and girls for different reasons. As boys in poor and rural families become older, they face demands for their labour outside the home. Girls are often withdrawn to take on domestic tasks or prepare for early marriage, which is prevalent in regions such as South and West Asia and sub-Saharan Africa.
Pupils who are two or three years older than the target age for their grade are at greater risk of dropping out of school, of poor academic performance and of not
making the transition to lower secondary education.
In general, boys are much more likely than girls to be overage for their grades. Figure 3.8.1 shows that boys are most likely to be overage in 86 of the countries that have not achieved gender parity (defined as having a GPI between 0.97 and 1.03), while girls are likely to be so in only seven countries. Where boys are disproportionately overage the margins tend to be higher than they are when girls are overage. In Swaziland, for example, 63 percent of boys are overage as opposed to only 42 percent of girls.
Throughout the world enrolment in primary school tends to be highly correlated with socioeconomic status and geographic location. Children in the lowest economic quintiles are more likely to be out of school than peers from higher quintiles and to cite lack of money as their reason for not attending school. Likewise children from rural areas are more likely to be out of school than those from urban areas.
Figures 3.9.1 and 3.9.2 provide data for 15 sub-Saharan African countries showing how school attendance of
children of primary age correlates with whether pupils come from rich or poor families and whether they live in urban or rural areas. The primary adjusted net attendance rate measures the percentage of primary school-age children who attend either primary or secondary school.
These data show some consistent patterns. Among both males and females, children from families in the highest quintile of household wealth consistently participate in school at higher rates than children of the same sex from
households in the lowest quintiles. Likewise, attendance rates for children of both sexes who live in urban areas are consistently higher than the comparable rates for children in rural areas.
The data show some differences in patterns among the two sexes. In most countries rich males enrol at higher rates than rich females, but there are some exceptions. In Cameroon, for example, the attendance rate of 97 percent among rich females is slightly higher than
the 95 percent for rich males. Likewise, urban males tend to participate at higher rates than urban females, but in Kenya the female rate of 95 percent is above the male rate of 92 percent.
In general, the largest disparities among the sexes occur in countries with the lowest attendance rates. Such countries also tend to have the largest gaps between urban and rural and between rich and poor.
8. Overage children more likely to drop out of school
9. Special challenges of poor children and those in rural areas
CHAPTER 3 Enrolment and gender trends: primary education
56 57