chapter 2 moving people - bts.dot.gov local trips and travel-miles ... bureau of transportation...
TRANSCRIPT

2-1
CHAPTER 2
Moving People
Highlights• In2015Americanstraveledmorethanin
2014.Carsandotherpersonalvehiclesremainthedominantchoiceformosttrips.
• All-timehighsforairtravelwerereachedin2016,followingrecord-settingyearsin2014and2015.Totalenplanementsin2016were928million,comparedto835millionin2007and768millionintherecessionyearof2009.
• Internationalairtravelpassenger-milessurpasseddomesticairtravelpassenger-milesforthefourthconsecutiveyearin2016.
• 2016wasthefirstyearthatforeigncarrierstransportedmorepassengerstoandfromtheUnitedStatesthandidU.S.carriers.
• Therewere75.6millioninternationalvisitorstotheUnitedStatesin2016,downfrom77.5millionin2015—thefirstannualdeclinesince2009.Foreignvisitorsspentanestimated$244.7billionintheir2016visits,downabout2percentfrom2015.
• Childrenwalkingandbikingtoschoolfellfromnearlyhalfofchildrenin1969tojust13percentin2009andhasremainedasmall
proportiondespitemodestrecentgrowth.
• Bike-sharesystemsoperateinmorethan150citiesnationwide,withriderstaking28milliontripsonthelargersystemsduring2016.
• App-enhancedride-hailingcompaniesarecapturingagrowingshareofthefor-hirepassengertransportationinmanymetropolitanmarkets.Inthelargestmarket,NewYorkCity,theseservicesprovided80milliontripsandcarried133millionpassengersin2016.
• Transitusegrewbetween2000and2015,withtotalridershipgrowing1.2billionandtransit’sshareofcommutersgrowingfrom4.7to5.2percent.
• Ruralresidentshavegreaterreliancethanurbanresidentsonautomobileswithmorethan95percenthavingaccesstoavehicle.

2-2
Chapter 2: Moving People
TheNation’stransportationsystemaccommodatesextensivelocalandlong-distancetraveldemandedbynearly325millionU.S.residentsandabout76millionforeignvisitors[USDOCCENSUS2017a,USDOCNTTO].In2015person-milesoftravel(PMT)intheUnitedStateswasroughly5.6trillion.Peopleusedcarsorotherpersonalvehiclesfor3.8trillionofthesetravel-miles,ornearly70percent.Domesticandinternationalairtraveltoandfromthiscountryaccountedfor1.3trillionofthe5.6trillionPMT(23percent)—ofwhich631.1billion(11percentoftotalPMT)wasdomesticand661.1billion(12percentoftotalPMT)wasinternational.Transit,intercityrail,andbusservices
accountedfortheremainingPMT(table2-1).Walkingandbikingalsotalliedalargenumberoflocaltripsandtravel-miles,withnearly5millionpeoplegettingtoworkundertheirownpowerdaily[USDOCCENSUS2017c].
Thenumberofcommercialairpassengersandairlinerevenuepassenger-milesreachedarecordhighin2016,asdiscussedinthelong-distancetravelsection,reboundingfullyfromdeclinesduringandafterthe2007to2009economicrecession.Afterfallingfrom2007through2009,domesticairPMTroseabovethepre-recessionlevelin2015andreachedarecordhighof631.1trillionin2016.InternationalairPMTtoandfromthe
TABLE 2-1 Person-Miles of Travel in Selected Travel Modes(million miles)
TOTALLight-duty highway
vehiclesAir carrier, domestic
U.S. and foreign air carrier, international Bus Motorcycle Transit Intercity/ Amtrak
2005 5,704,012 4,319,993 583,771 451,386 278,864 17,492 47,125 5,381
2006 5,769,816 4,332,465 588,471 472,005 297,631 24,329 49,504 5,410
2007 5,838,220 4,341,984 607,564 496,088 307,753 27,173 51,873 5,784
2008 5,735,729 4,248,783 583,292 503,056 314,278 26,430 53,712 6,179
2009 5,045,642 3,625,598 551,741 481,049 305,014 22,428 53,898 5,914
2010 5,082,855 3,646,451 554,618 510,884 291,914 19,941 52,627 6,420
2011 5,124,375 3,650,223 564,685 535,928 292,716 19,927 54,328 6,568
2012 5,195,569 3,669,278 569,931 (R) 558,046 313,357 23,034 55,169 6,752
2013 5,262,358 3,688,161 578,723 (R) 588,249 321,539 21,937 56,467 7,283
2014 5,372,132 3,731,888 595,970 (R) 621,915 339,177 21,510 54,998 6,675
2015 5,552,941 3,828,301 631,100 666,115 344,073 21,118 55,698 6,536
2016 U U 660,473 711,759 U U U 6,520KEY: R = revised; U = unavailable.
NOTES: U.S. and foreign air carrier, international includes only scheduled flight segments to and from the United States. Light-duty highway vehicle includes both short and long wheel base passenger cars, pickup trucks, vans, and sport utility vehicles (SUVs). Bus and demand response are included in both Bus and Transit, which results in some double counting. Amtrak does not include contract commuter passenger miles. The data in table above may not be consistent with other sources, particularly data that are revised on an irregular or frequent basis. Different vehicle occupancy rates were used to estimate passenger miles for Light-duty highway vehicles and Bus beginning with 2009. Nationwide travel data for walking and biking are not collected on an annual basis. Highway PMT data for 2016 had yet to be released when this report was finalized.
SOURCES: U.S. foreign air carrier, international: U.S. Department of Transportation, Research and Innovative Technology Administration, Bureau of Trans-portation Statistics, Scheduled Passenger Data Tool, available at http://www.transtats.bts.gov as of March 2017. All other categories: Various sources as cited in U.S. Department of Transportation, Research and Innovative Technology Administration, Bureau of Transportation Statistics, National Transportation Statistics, table 1-40, available at http://www.bts.gov/publications/national_transportation_statistics/ as of March 2017.
2-3
Transportation Statistics Annual Report
UnitedStatesexperiencedasmallerdeclineduringtherecessionandrosesteadilyfrom2009toreachanall-timehighof666.1trillionin2016.HighwayPMTbycarsandotherpersonalvehiclesin2015wasstillbelowthepeaksetin2007priortotherecession(table2-1).HighwayPMTdatafor2016hadyettobereleasedwhenthisreportwasfinalized.However,monthlyvehiclemilesoftravel(VMT)data,seasonallyadjustedbytheBureauofTransportationStatistics(BTS),showscontinuingVMTgrowthbeyond2007levelsthroughout2016andinthefirsthalfof2017[USDOTBTSSA].1Transitandintercitypassengerrailservicesgrewinnumberofpassengersandpassenger-milesduringtherecessionandinmostyearsthereafter(table2-1).
1PMTestimationrequiresinformationonthenumberofvehicleoccupantsthatisnotavailableinthemonthlyvehicle-milestraveleddata.Additionally,themonthlyVMTdatadoesnotdistinguishbetweenpassengerandfreightvehicle-milestraveled.
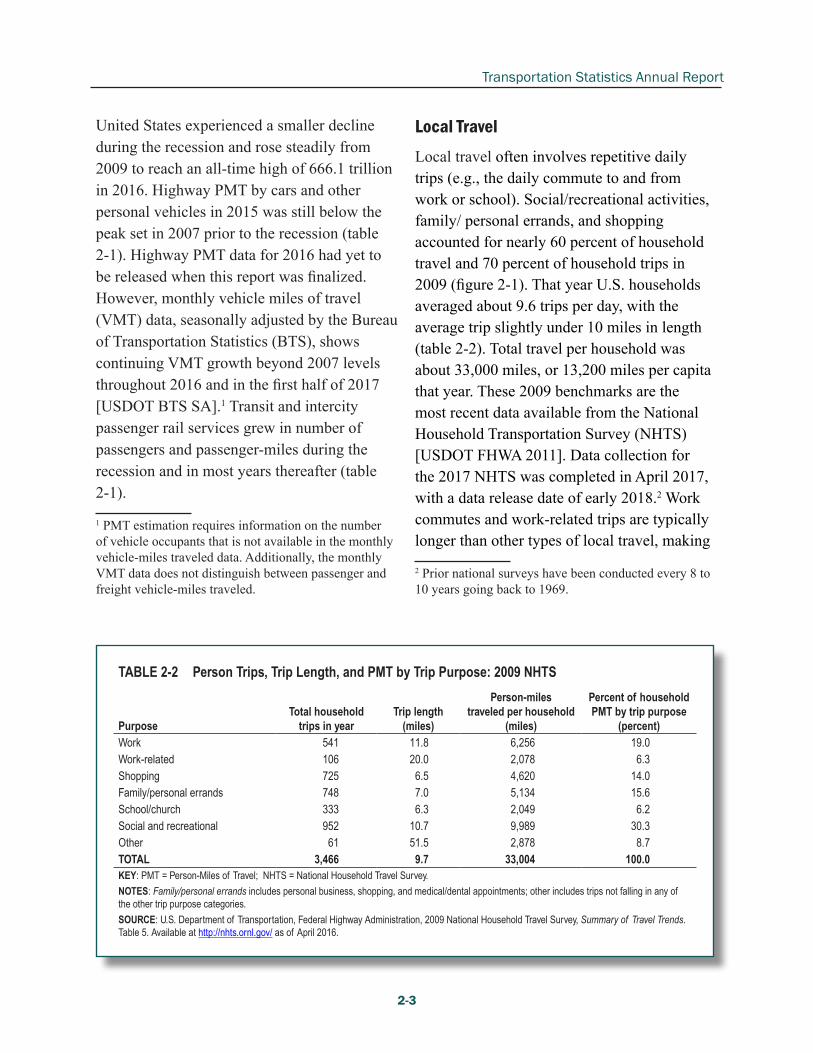
Local TravelLocaltravelofteninvolvesrepetitivedailytrips(e.g.,thedailycommutetoandfromworkorschool).Social/recreationalactivities,family/personalerrands,andshoppingaccountedfornearly60percentofhouseholdtraveland70percentofhouseholdtripsin2009(figure2-1).ThatyearU.S.householdsaveragedabout9.6tripsperday,withtheaveragetripslightlyunder10milesinlength(table2-2).Totaltravelperhouseholdwasabout33,000miles,or13,200milespercapitathatyear.These2009benchmarksarethemostrecentdataavailablefromtheNationalHouseholdTransportationSurvey(NHTS)[USDOTFHWA2011].Datacollectionforthe2017NHTSwascompletedinApril2017,withadatareleasedateofearly2018.2Workcommutesandwork-relatedtripsaretypicallylongerthanothertypesoflocaltravel,making
2Priornationalsurveyshavebeenconductedevery8to10yearsgoingbackto1969.
TABLE 2-2 Person Trips, Trip Length, and PMT by Trip Purpose: 2009 NHTS
PurposeTotal household
trips in year Trip length
(miles)
Person-miles traveled per household
(miles)
Percent of household PMT by trip purpose
(percent)Work 541 11.8 6,256 19.0Work-related 106 20.0 2,078 6.3Shopping 725 6.5 4,620 14.0Family/personal errands 748 7.0 5,134 15.6School/church 333 6.3 2,049 6.2Social and recreational 952 10.7 9,989 30.3Other 61 51.5 2,878 8.7TOTAL 3,466 9.7 33,004 100.0KEY: PMT = Person-Miles of Travel; NHTS = National Household Travel Survey.
NOTES: Family/personal errands includes personal business, shopping, and medical/dental appointments; other includes trips not falling in any of the other trip purpose categories.
SOURCE: U.S. Department of Transportation, Federal Highway Administration, 2009 National Household Travel Survey, Summary of Travel Trends. Table 5. Available at http://nhts.ornl.gov/ as of April 2016.

2-4
Chapter 2: Moving People
upaboutone-fourthoftotalmileagetraveledbutlessthanone-fifthoftotaltrips.Theshortertripsweretypicallyforshopping,personalbusiness,andsocial/recreation—eachwithlargesharesofthenumberoftrips(table2-2).
Peopleuseautomobilesorotherpersonalmotorvehiclesfortheoverwhelmingmajorityoftheirtravel,whetherlocalorlongdistance.In2015about91percentofU.S.householdshadatleastonevehicleavailable,with57percentofhouseholdshavingtwoormore[USDOCCENSUS2017c].
Supportingthehighpercentageoftravelbypersonalvehicle,theshareofhouseholdswithoutavehicledeclinedfrom11.5percentin1990to8.9percentin2015.Roughly10.5millionhouseholdsdidnothaveaccesstoavehiclein2015[USDOCCENSUS2017b].Thenumberofhouseholdswithoutvehicleshasstayedaboutthesame,at10to11millionforseveraldecades,despiteagrowingnumberofhouseholds[AASHTO2013].Peoplewhorenttheirlivingplaceandpeopleinlow-incomehouseholdsarelesslikelytohaveaccesstoavehicle[USDOCCENSUS2017b].
The2009NHTSsurveyfoundthataboutone-fifthoftripsinvolvetrip-chaininginwhichpeoplesandwichindailyerrandsandactivities,suchasdroppingoffandpickingupchildrenatschool/daycareorstoppingatafitnesscenter,whileonthewaytoandfromwork[USDOTFHWANHTS2011].
Thenumberoftripsvariesthroughouttheweek.Fridayaccountedforthemosttripsin2009,becauseofmoresocial/recreationalandfamily/personal/errandtrips,andSundayfortheleast.Reducednumbersofworktripsanderrands
onSaturdayandSundayarepartiallyoffsetbyshoppingandsocial/recreationaltrips,aswellastraveltoreligiousservices[USDOTFHWANHTS2011].
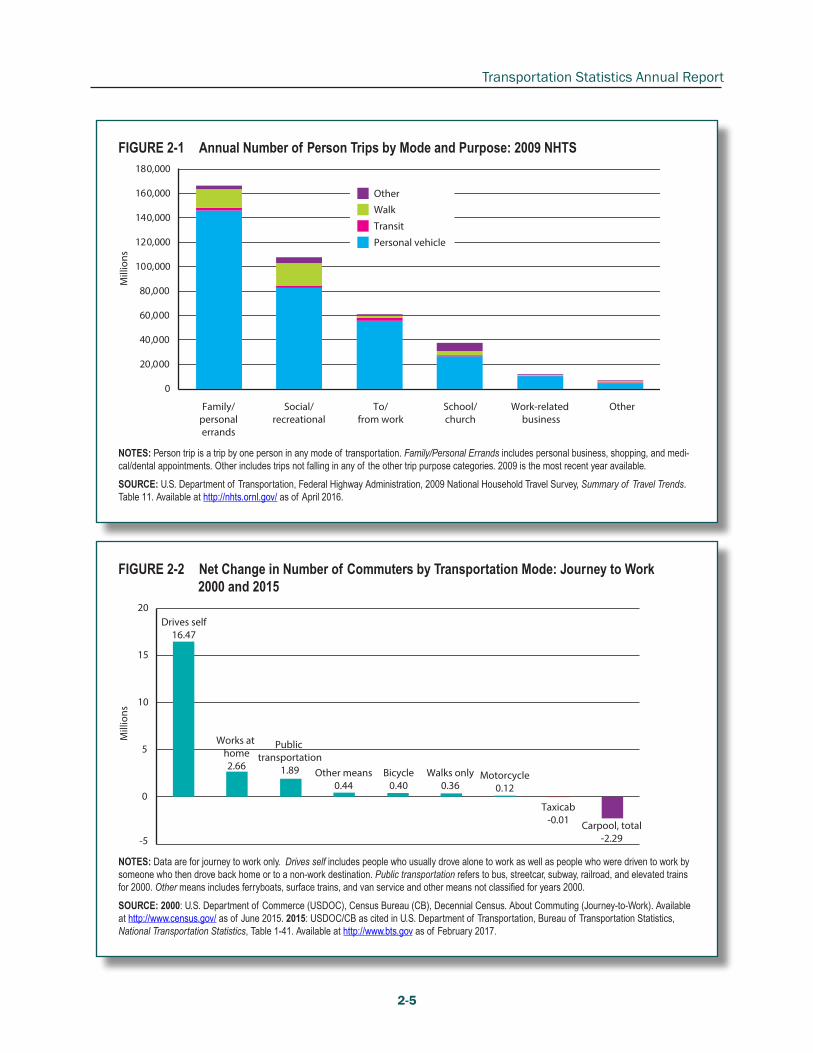
Asshowninfigure2-1,theoverwhelmingmajorityofpersontripsaretakenincarsorotherpersonalvehicles.Walkingisusedforasubstantialnumberoferrandsandsocial/recreationaltrips.Family/personalerrandsandsocial/recreationalactivitiesaccountedformorethantwo-thirdsoftrips,followedbytripstoandfromwork,whichaccountedfor15.6percent.
Journey to Work
Personalvehicleswereusedforabout86to88percentofjourneys-to-workinthe2000to2015period.However,drivingalonecontinuedtoriseinshareandnumbers,whilecarpoolingdeclined.Roughly16.5millionmorepeoplesaidtheyusuallydrovealonetoworkin2015thanin2000,whilethenumberofcarpoolersfellbynearly2.3millionasshowninfigure2-2.Transit’sshareofcommutersroseto5.2percent,upfrom4.7percentin2000.About752,000morepeoplewalkedorbikedtoworkin2015thanin2000,accountingforabout5millioncommutersorabout3.4percentofallworkersin2015[USDOCCENSUS2017c,CENSUS2004].
Thegeographyandcharacteristicsofcommutinghavechanged:
• Morepeopleareworkingathome.Theavailabilityofcomputersandotheradvancedinformationtechnologieshasincreasedtheabilityofpeopletoworkathomewhileperformingtheirjobresponsibilities.
2-5
Transportation Statistics Annual Report
FIGURE 2-1 Annual Number of Person Trips by Mode and Purpose: 2009 NHTS
0
20,000
40,000
60,000
80,000
100,000
120,000
140,000
160,000
180,000
Family/personalerrands
Social/recreational
To/from work
School/church
Work-related business
Other
Mill
ions
Personal vehicle
Transit
Walk
Other
NOTES: Person trip is a trip by one person in any mode of transportation. Family/Personal Errands includes personal business, shopping, and medi-cal/dental appointments. Other includes trips not falling in any of the other trip purpose categories. 2009 is the most recent year available.
SOURCE: U.S. Department of Transportation, Federal Highway Administration, 2009 National Household Travel Survey, Summary of Travel Trends. Table 11. Available at http://nhts.ornl.gov/ as of April 2016.
FIGURE 2-2 Net Change in Number of Commuters by Transportation Mode: Journey to Work 2000 and 2015
Drives self16.47
Works at home2.66
Public transportation
1.89 Other means0.44
Bicycle0.40
Walks only0.36
Motorcycle0.12
Taxicab-0.01 Carpool, total
-2.29-5
0
5
10
15
20
Mill
ions
NOTES: Data are for journey to work only. Drives self includes people who usually drove alone to work as well as people who were driven to work by someone who then drove back home or to a non-work destination. Public transportation refers to bus, streetcar, subway, railroad, and elevated trains for 2000. Other means includes ferryboats, surface trains, and van service and other means not classified for years 2000.
SOURCE: 2000: U.S. Department of Commerce (USDOC), Census Bureau (CB), Decennial Census. About Commuting (Journey-to-Work). Available at http://www.census.gov/ as of June 2015. 2015: USDOC/CB as cited in U.S. Department of Transportation, Bureau of Transportation Statistics, National Transportation Statistics, Table 1-41. Available at http://www.bts.gov as of February 2017.

2-6
Chapter 2: Moving People
• Forworkerswhocommutetowork,theaveragedistancefromtheirhometotheirplacesofworkhasincreasedinrecentyears.Arecentstudyof96majormetropolitanareasfoundanoveralldeclineof7percentinthenumberofjobswithinatypicalcommutingdistance3between2000and2012.Whilethenumberofjobsin29metroareasincreasedwithinthetypicalcommutingdistance,67metroareasshowedadecrease[BROOKINGS2015].
• Workersleavingtheirhomecountytoworkinanotherin-statecountyorinadifferentstateincreasedfrom23.5millionto40.9millionbetween1990and2015;theirpercentageshareoftheworkforcegrewfrom20.4to27.6percent[USDOCCENSUS1990,2017c].
AccordingtotheBureauofLaborStatistics,22.3percentofworkersdidsomeoralloftheirworkathomein2016,averagingabout3.1hoursperworkday.Thiscompareswith19percentofworkersaveraging2.6hoursoftheirworkdayathomein2003[USDOLBLS2017a].AnotherCensussurveyfoundthatMondayandFridaywerethemostlikelydaystoteleworkandThursdaywasleastlikely[USDOCCENSUS2013].4Consistentwiththeincreaseintelecommuting,averagecommuteisdownfrom0.78hoursin2010
3The“typicalcommutedistance”wascalculatedsepa-ratelyforeachareabasedonmediancommutedistancesbetweenCensustracts.Thus,intheAtlantaarea,thetyp-icalcommutedistancewascalculatedtobe12.8mileswhileinStockton,CA,itwas4.7miles.4ThefindingsofthetwoCensusBureausurveysarenotcomparablebecauseamongotherdetails,theyusediffer-entdefinitions.The2015estimateisfromtheAmericanCommunitySurveywhiletheotherestimateisfromtheSurveyofIncomeandProgramParticipation.
to0.76hoursperdayin2016[USDOLBLS2017a].
About14.8percentofworkerswithnoavailablevehiclewalkedtowork,roughlyfourtimesthepercentageforworkerswithoneavailablevehicle.Similarly,2.8percentofthosewithoutavehiclebikedtotheirworkplace,comparedwith0.8percentforworkerswithoneavailablevehicle.Only4.5percentofhouseholdswithworkershadnovehiclein2014,butthispercentagerepresents6.3millionworkers[MCKENZIE2015].
About11.6percentofhouseholdshavemoreworkersthanvehicles.Theother88.4percentareaboutevenlysplit(about44percenteach)betweenhouseholdswithmorevehiclesthanworkersandhouseholdswherethenumberofvehiclesequalsthenumberofworkers[AASHTO2013].
Whiletheaveragecommutetoworkis24.6minuteslong,about9percentofcommutersspendanhourorlongergettingtowork[USDOCCENSUS2017c].Forsocalledmegacommuters(workerswhocommuteformorethan90minutesandtravelatleast50milesone-waytoandfromwork),thejourney-to-workismoreorlessaformoflong-distancetravel.Inthe10countiesattractingthemostmegacommuters,themeandistancetoworkamongthemrangedfromjustunder60toover90miles,andtheirmeantraveltimerangedfrom1hour44minutestojustover2hours[RAPINOANDFIELDS2013].
Nationaltrendsdonotportraytravelinindividualmetropolitanareas.Forexample,transitservesahighershareofworktrips

2-7
Transportation Statistics Annual Report
inlargermetropolitanareas:11.0percentinareaswithapopulationover5million,4.0percentinareasbetween2.5and5million,and2.2percentinareasbetween1and2.5million.TransitridershipishighestintheNewYork-Newark-JerseyCity,NY-NJ-PA;SanFrancisco-Oakland-Fremont,CA;Washington-Arlington-Alexandria,DC-VA-MD-WV;Boston-Cambridge-Quincy,MA-NH;andChicago-Naperville-Elgin,IL-IN-WImetropolitanareas(figure2-3).
Overalltransitridershiphasbeenonanupwardtrajectorysincereachingalowin1995,increasingbyabout30percentin20
years.Mostofthegrowthhasbeeninthevarioustransitrailmodes;bus,thelargesttransitmode,hasshownlittlegrowthinridershipovertheperiod[APTA2017].Transitridershipstoodatabout10.7billionunlinkedpassengertripsin2014,beforedecliningslightlyin2015and2016,whenridershipwas10.2billion.Thedeclinecontinuedinthefirsthalfof2017[USDOTBTS2017c].
Since2010,transportationnetworkedcompanies(TNC),app-basedride-hailingservicesinwhichdriversusetheirowncarstotransportpassengersforafee,haveemerged
FIGURE 2-3 Percent of Workers Who Commute by Public Transit: 2016
0 100 Miles0 200 Miles 0 100 Miles
Percent of workerswho commute bypublic transit
10.0 or more5.0 to 9.92.0 to 4.9Less than 2.0
SOURCE: U.S. Department of Commerce, Census Bureau, 2015 American Communities Survey 5-year Estimates, available at http://www.census.gov as of August 2017.

2-8
Chapter 2: Moving People
inmanymetropolitanareasaroundtheworld.TNCs,thelargestofwhichareUberandLyftintheUnitedStates,arechallengingthetraditionaltaxibusinessinmanylargecities.Theyhavebecomeanewfeatureofurbantransportation.Asisdiscussedinbox2-A,publicdataarelimited,butinthebiggestmarket,NewYork
City,TNCsprovided80milliontripsin2016,carrying133millionpassengers,comparedtovirtuallynoridersin2012.SomeoftheTNCtripsreplacedtraditionaltaxiandliveryservicetrips[SCHALLER2017].Thecellphoneapphasalsorevivedinterestinavarietyofothermobilityoptions,suchasshort-termcarand
Box 2-A Ridesourcing: The Emergence of the Transportation Networking Company (TNC)Tensofthousandsofpeoplenowdrivetheirownpersonalvehicleonafor-hirebasisforothersontheirownschedule.Theycandothisonafull-orpart-timebasisbecausetherearefewrequirementsasidefromowningasuitablemotorvehicle,adequatecarinsurance,adriver’slicenseindicatingagooddrivingrecord,andasmartphoneappfromaTNC.Uber,Lyft,andotherTNCsorganizeridesourcing(alsocalledapp-enhancedrideservices,transportationnetworkservices,and,somewhatmisleadingly,ridesharing).TheTNCsserveasintermediariesbetweendriversandpeopleseekingrides,providingbothwiththerequisitemobilephoneapp,handlingthegenerallycashlesscredit-cardbasedtransaction,vettingdriversandvehicles,andprovidingafeedbackmechanismforboththepassengerandthedriver.WhilemostTNCdriversowntheirvehicles,avarietyofleasingarrangementsareavailablethatallowpeoplewhodonotownacartodriveforaTNC[USATODAY2017].
Inlessthanadecade,theseridesourcingcompanieshavecometogreatlyaffecturbantransportationincitiesaroundtheworldwheretheseservicesarepermitted.IntensecompetitionnowexistsbetweenTNCsandtraditionaltaxiservicesinmanylargemetropolitanareas.MostdataonridershiparecloselyheldbytheTNCs.However,NYCnowcollectsTNCridershipdata,allowingcomparisonwithtraditionaltaxi
services,basedon2015and2016data.A2017report[SCHALLER2017]detailstherapidgrowthofTNCservicesinNYC:
• Fromvirtuallynoserviceavailablein2012,TNCscarried15millionpassengersamonthin43,000vehiclesbythefallof2016.Thiswasnearlyasmanytripsascarriedbythecity’syellowcabindustry,thelargestsinglecomponentofNYC’straditionaltaxiindustry.
• TNCridershipoutpacedgrowthinNYCtransit(subwayandbus)ridershipduring2014–2016.Thiscontrastswith2012–2013,whenTNCservicefirstbeganinthecityandtransitridershipaccountedfortwo-thirdsoftheincreaseinnon-autotripmaking.
TNCservicesandotherridesourcingcompaniesnowoperateinsome500citiesorcommunitiesintheUnitedStates.Uberandothersuchservices(butnotyetLyftasofMay2017)arealsoavailableindozensofforeigncountries,makingitpossibleforaU.S.residenttravelingoverseastousethesamecellphoneapptohailarideinaforeigncountry.WhileUberisamajorpresenceinmanylargecitiesaroundtheworld,itnolongeroperatesinChina,whereitsChineseoperationswereacquiredbyDiDiChuxinginAugust2016.Didiisconsideredthelargestridesourcingcompanyintheworld.
2-9
Transportation Statistics Annual Report
bikerentals,carsharing,andvanpoolingasdiscussedinmoredetailinthePassenger Access and Connectivity sectionofthischapter.
Walking and Biking to Work and to School
Nationally,onlyasmallpercentageofpeoplewalkorbiketowork.However,thesenonmotorizedmodesofcommutingareimportantinmanycitiesofallsizes,asshownbythe2008–2012AmericanCommunitySurvey.Inthe50largestU.S.cities,5.0percentofworkerswalkedtoworkandanother1.0percentbiked.Over15percentofworkersinBoston,MA,walkedtowork,asdidmorethan10percentofcommutersinWashington,DC,Pittsburgh,PA,andNewYorkCity.Portland,OR(6.1percent)andMinneapolis,MN(4.1percent)hadthehighestpercentageofbicyclecommuters.Thesecitieshavealsoinvestedininfrastructuretofacilitatebiking(e.g.,buildingdedicatedbikelanes).Somesmallcitieshavehigherratesofwalkingandbiking,especiallywherecollegesanduniversitiesarelocated.Forexample,about42percentofworkersinIthaca,NY,walktoworkandnearly19percentinDavis,CA,commutebybike[MCKENZIE2014].
Amongregions,theNortheasthasthehighestrateofwalkingtowork,whiletheWesthadthehighestrateofbiking.TheSouthhadthelowestrateofwalkingandbicyclingtoworkformostcity-sizecategories.
Peoplewalkingorbikingtoworkspendlesstimeontheircommutethanthoseusingothermodes—walkersaverage11.5minutesandbikers19.3minutes,comparedto25.9minutesforothermodes.Womenwereslightlylesslikelytowalktoworkthanmen,butlessthan
halfaslikelytocommutebybike.Peoplewhowalkorbiketoworkalsotendtobeyoungerthantheaveragecommuter.Manypeoplewalkorbiketowork,inpart,fortheexerciseitprovidesincontrasttolessactivemeansofcommuting[MCKENZIE2014].
Somepeoplecombinebikingandtransittomaketheircommutesandothertrips.Manytransitvehiclescanaccommodatebicyclesonboard.Anotheroption,increasinglyavailableatcitieswithbike-sharesystems,istocombineatransittripwithashort-termbicyclerental.Bike-sharesystemsnowexistin124U.S.cities,accordingtoaBTSdatabase.TheNationalAssociationofCityTransportationOfficialsestimatesthatridershipwas28millionin2016onbike-sharesystemswithatleast100bicyclesand10dockingstations,upfromjust320,000in2010[NACTO].Bike-sharesystemsandtheirproximitytotransitandothertransportationmodesarediscussedinmoredetailinthePassenger Access and Connectivitysectionofthischapter.
Walkingandbikingtoschoolhasdeclineddramaticallyfromroughlyhalfofstudentsin1969toroughly15percenttoday,withnearlyasmanystudentsdriventoschoolinfamilycarsasthosewhowalkortakethebus.Thedeclineisapparentevenamongchildrenwholiveashortdistance—amileorlessfromschool.AmongKindergartenthrougheighthgrade(K-8)studentsresidingwithinonemileofschool,nearly90percentusuallywalkedorbikedin1969,butthispercentagefellto35percentin2009[NCSRTS2011].Morerecentdata(albeitbasedonadifferentsamplingapproach)showincreasesinbikingandwalkingtoschool,upto15percentinthe

2-10
Chapter 2: Moving People
morningand18percentintheafternoonin2014[NCSRTS2016].Seebox2-Bformoredetails.
Time Spent Traveling
Onweekdaysin2016,theaveragepersonspent83.6minutesperdaytravelingforavarietyofactivities—upfrom82.0minutesin2015,accordingtotheAmericanTimeUse
Survey(ATUS),anannualsurveyconductedbytheBureauofLaborStatistics.Amongthe46.0percentofpeoplewhoengagedintravelforwork,theaveragepersoninthisgroupspent45.5minutesperdayonworktravel,themosttraveltimeforallactivitiesin2016[USDOLBLS2017a].
Peopleaveraged3.3moreminutesinweekendandholidaytravelactivitiesthanonweekdays
Box 2-B How Children Travel To and From School: A Changing PictureInthefourdecadesbetween1969and2009,thelastyearforwhichNHTSnationalsurveydataareavailable,walking/bikingtoschoolandgoingtoschoolinafamilyvehicleroughlyswitchedpositionsasthemodalchoiceofparentsforgettingtheirchildrentoandfromschool:
• In1969,48percentofelementaryandmiddleschoolchildrenwalkedorbikedtoschool;in2009,just12.7percentdidso.
• In2009,45percentofchildrenweretakentoschoolinafamilyvehicle,comparedtojust12percentin1969,
• Inbothyears,childrenridingtheschoolbusaccountedforroughlythesamepercentages,38percentin1969and39.4percentin2009.
Evenwhenstudentsliveonemileorclosertoschool,theyarelesslikelytowalkorbike,andmorelikelytobedroppedoffbyparents:
• In1969,88.6percentofstudentslivingamileorlessfromschoolusuallywalkedorbiked;in2009only35.2percentdidso.1
• Childrendroppedoffatanearbyschoolina
1Thenumbersfor1969and2009donotsumto100percentbecauseasmallpercentageofchildrenalsotooktransitorothermeanstogettoschool.
familyvehicleincreasedfrom6.9percentin1969to42.8percentin2009.
• Studentslivingneartheirschoolalsoaremorelikelytotaketheschoolbus,risingfrom3.8to20.4percentover40years[NCSRTS2011].
Itispossiblethatthedeclineinwalkingandbikingtoschoolmayhavetaperedofforevenreversedsince2009.TheNationalCenterforSafeRoutestoSchool(NCSRTS)estimatesthatwalkingtoschoolincreasedfrom11.9to15.2percentbetween2007/2008and2014.Walkinghomefromschoolincreasedfrom15.2to18.4percent.Bikingtoandfromschooldeclinedtounder2percentbetween2007/2008and2011,butthenstabilizedatabout2percentbetween2012through2014.
NCSRTSalsofoundfewerchildrentakingtheschoolbusaswalkingincreasedinthe2007/2008to2014period.Thelikelihoodofgettingtoschoolonaschoolbusdecreasedfrom36.8to29.8percentovertheperiod,andthelikelihoodoftakingabushomefellfrom42.5to34.6percentintheafternoon.However,thepercentageofstudentstakentoschoolbycarincreasedfrom49.1to51.5percent,whilethosepickedupafterschoolrosefrom40to45.9percent[NCSRS2016].

2-11
Transportation Statistics Annual Report
in2016—anaverageof86.9minutesperday.Theaveragepersonspentthemostweekendandholidaytraveltime(43.7minutes)foractivitiesrelatedtoconsumerpurchases,about8.8minutesperdaymorethanonweekdays.Travelrelatedtoeatinganddrinkingonweekendsandholidaysaccountedfor31.3minutes—about6minutesmorethanonweekdays.
Peoplespentlesstimetravelingin2016thanin2003,accordingtotheATUS.Onweekdaysin2016,peoplespent3.3fewerminutestravelingperday,adecreaseof3.8percentfrom2003.Onweekendsandholidays,peoplespent3.5fewerminutestravelingperday,a3.9percentdecrease(figure2-4).
Long-Distance and International TravelAmericansprimarilyuseairlinesandpersonalvehiclesfortheirlong-distancetravel.There
isnolongeracomprehensivenationaldatasourceforlong-distancetravel(usuallyconsideredastripstoplacesatleast50milesaway).Althoughtotalscouldbeestimatedfromavarietyofsources,theendresultisincomplete—intermsofsystemusageforlong-distancetrips,trippurposeandlength,andtravelercharacteristics.Themissingpiecesincludetripsbycarorotherpersonalmotorvehicle(usedbymostpeoplefortheirlong-distancetrips),generalaviation,andcruiseships.VMTonruralinterstatehighwaysareoccasionallyusedasasurrogateforlong-distancehighwaytravel,butthereisnomethodologyforseparatinglocalfromlong-distancetravelwithinruralareas.Takeoffsandlandingsofgeneralaviationaircraftarenotagoodproxyforlong-distancetravelbecausemanyflightstakeoffandlandatthesameairportratherthantransportplaneoccupants
FIGURE 2-4 Total Time Spent Traveling on Weekdays and Weekends: 2003–2016
74
76
78
80
82
84
86
88
90
92
2003 2004 2005 2006 2007 2008 2009 2010 2011 2012 2013 2014 2015 2016
Ave
rage
min
utes
per
day
Weekdays
Weekends and holidays
NOTE: Shaded area indicates economic recession. Activities are based on American Time Use Survey Activity Lexicon 2016 definitions. Weekdays exclude holidays. Weekends and holidays includes the following: New Year’s Day, Easter, Memorial Day, the Fourth of July, Labor Day, Thanksgiving, and Christmas.
SOURCE: U.S. Department of Labor, Bureau of Labor Statistics, American Time Use Survey 2016, available at www.bls.gov as of July 2017.

2-12
Chapter 2: Moving People
todistantdestinations.Numbersofpassengersboardinganddebarkingfromcruiseshipsineachportarecounted,butdetailedstatisticsoncruises,cruisepassengers,departureports,anddestinationshavenotbeencompiledsinceJune2012.
Long-distancetravelersincludeinternationalvisitorswhoentertheUnitedStatesatofficiallandbordercrossingcheckpoints,airports,andtoafarlesserextent,seaportsaswellas
returningU.S.citizensanddayworkers(figure2-5).ThelandcrossingcheckpointsalongtheborderwithMexicoprocessmorethan3millionpeopleenteringtheUnitedStatesinanaverageweek.In2015,182.1millionpassedintotheUnitedStatesalongtheU.S.-Mexicoborder.ThebordercrossingstationswithCanadaaremorenumerous,butprocessfarfewerpeople—52.4millionin2016[USDOTBTSNTS].
FIGURE 2-5 Persons Entering the United States at Land Border Crossings and International Airports: 2016
Incoming persons at:land border crossings international airports
5 million
15 million
500,000
32 million
PHX
LAX
SFODEN
IAD
FLL
MIA
MCO
ATL
ORD
BOS
BWIBWI
DTW
MSP
CLT
EWR
LAS
JFK
LGALGA
PHL
DFW
IAH
SEA
Champlain
Sumas
DouglasDouglas
NogalesNogales
San Luis
Andrade
Andrade
Calexico
Calexico
East
Calexico
East
Otay MesaSan Ysidro
Tecate
Santa Teresa
Del Rio
El Paso
HidalgoHidalgo
Presidio
ProgresoRoma
Eagle Pass
Laredo
Brownsville
Buffalo-Niagara FallsBuffalo-Niagara Falls
Detroit
PortHuronPortHuron
Blaine
HNL
0 100 Miles0 200 Miles 0 100 Miles
GUM
0 5 Miles
NOTE: Truck crossings are not included because they are primarily freight related.
SOURCE: Person Crossings: U.S. Department of Transportation, Bureau of Transportation Statistics, Border Crossing/Entry Database, available at transborder.bts.gov as of October 2017. Air Passengers: U.S. Department of Transportation, Bureau of Transportation Statistics, T-100 Data, available at www.transtats.bts.gov as of October 2017.

2-13
Transportation Statistics Annual Report
FIGURE 2-6 Foreign Visits by Main Markets: 2000–2016
0
10
20
30
40
50
60
70
80
90
2000 2001 2002 2003 2004 2005 2006 2007 2008 2009 2010 2011 2012 2013 2014 2015
Mill
ions
Overseas
Canada
Mexico
Foreign Visits by Main Markets: 2000–2016
Percent Change from Previous Year in Total Foreign Visits: 2001–2016
-12.3%
-8.2%-4.2%
10.8%
30.6%
3.6%
10.2%
1.9%
-5.0%
8.9%
4.7%6.1% 4.9%
6.9%3.7%
-15%
-10%
-5%
0%
5%
10%
15%
20%
25%
30%
35%
2001 2002 2003 2004 2005 2006 2007 2008 2009 2010 2011 2012 2013 2014 2015
NOTE: These statistics count visitors staying in the United States for at least one overnight.
SOURCE: U.S. Department of Commerce, Office of Travel and Tourism Industries, U.S. Monthly Arrivals Trend Line: Overseas, Canada, Mexico & International, available at travel.trade.gov as of March 2017.
WhilethelargestinternationalairportsarelocatedatmajorcitiesalongtheEastandWestCoast,aswellasChicagoandAtlanta,thenumberofsmallerairportsofferinginternationalserviceshasgrown.Since1993thenumberofU.S.airportswithnon-stopinternationalflightshasgrownfrom72to122.
In2016approximately75.6millionforeignvisitorsstayedforatleastovernightintheUnitedStates,adeclineof1.9millionfromapeakin2015following6yearsofyear-to-yeargrowth(figure2-6).ThenumberofforeignvisitorsdeclinedtheconsecutiveyearsfollowingtheSeptember2001terrorist

2-14
Chapter 2: Moving People
attacksandin2009duringtheglobaleconomicrecession[USDOCNTTO].ManymorepeoplepassedthroughlandbordercrossingcheckpointsfromMexicoandCanadaondaytripscomparedtoovernight/multidaytrips[USDOCNTTO].
CanadaandMexicotogetheraccountformorethanhalfofforeignvisitorstotheUnitedStates.VisitorsfromChinahavegrownmostdramatically—upnearly1,000percentsince2000whenonly249,000ChinesevisitedtheU.S.,rankingitlowasasourceofU.S.tourism.VisitorsfromtheUnitedKingdomandJapanhavedeclinedsince2000whileItalyandVenezuelanolongerappearinthetop10countries.Table2-3showsthechangeinthetop10countriessince2000,withChinagrowingfrom24thto10thplaceintheperiod.
Australiaalsojoinedthetop10list,withthenumberofitsvisitorsmorethandouble.
U.S.andforeignairlinescarried927.8millionpassengersondomesticflightsandinternationalflightstoandfromtheUnitedStatesin2016—anall-timehigh(table2-4).Passengerenplanementswereupbyabout31millionfrom2015,thepreviouspeakyear.Domesticenplanementsin2016accountedfor77.4percentofpassengers,whileinternationalenplanementsonU.S.andforeignairlinesaccountedfor22.6percent.U.S.airlinescarriedlessthanhalf(49.5percent)ofpassengerstravelingbetweentheUnitedStatesandinternationalpointsin2016,makingthisthefirsttimeforeigncarrierstransportedmorepassengerstoandfromtheUnitedStatesthandidU.S.carriers[USDOTBTS2017a].
TABLE 2-3 Countries Sending the Most Travelers to the United States: 2000 and 2016Thousands of travelers
Percent change, 2000 to 2016Country 2000 Rank Rank 2016 Country
Canada 14,594 1 1 19,302 Canada 32.3
Mexico 10,322 2 2 18,730 Mexico 81.5
Japan 5,061 3 3 4,574 United Kingdom -2.7
United Kingdom 4,703 4 4 3,577 Japan -29.3
Germany 1,786 5 5 2,972 Chinaa 1,093.6
France 1,087 6 6 2,035 Germany 13.9
Brazil 737 7 7 1,693 Brazil 129.7
South Korea 662 8 8 1,974 South Korea 198.2
Australia 540 12 9 1,628 France 49.8
Chinaa 249 24 10 1,346 Australia 149.3aArrivals for 2016 excludes Hong Kong.
NOTES: Beginning in 2014, overseas data include one-night stay travelers.
SOURCE: U.S. Department of Commerce, International Trade Administration, Office of Travel & Tourism Industries, International Visitation in the United States, available at travel.trade.gov/outreachpages as of April 2017.

2-15
Transportation Statistics Annual Report
TABLE 2-4 Enplanements on Domestic Flights and Flight Segments To and From the United States (U.S. and Foreign Carriers): 2005–2016Scheduled flights only
Enplanements (millions) Load factor (percent)
Domestic International Domestic and international Domestic International Domestic and international
2005 657.3 143.6 800.8 77.2 78.7 77.8
2006 658.4 149.7 808.1 79.1 78.6 78.9
2007 679.2 156.3 835.4 79.9 79.1 79.5
2008 651.7 157.7 809.4 79.7 77.6 78.7
2009 618.1 149.7 767.8 81.1 78.3 79.7
2010 629.5 157.9 787.5 82.2 81.6 81.9
2011 638.2 163.9 802.1 82.9 80.3 81.6
2012 642.3 170.8 813.1 83.4 81.7 82.5
2013 645.7 179.3 825.0 83.5 82.1 82.8
2014 662.8 (R) 188.8 (R) 851.6 84.5 81.1 82.7
2015 (R) 696.0 (R) 200.6 (R) 896.6 85.0 (R) 80.6 82.7
2016 719.0 208.8 927.8 84.6 80.5 82.4
NOTE: International enplanements include U.S. and foreign carriers. Load factor is calculated by dividing demand, as measured by revenue passen-ger-miles (RPMs), by capacity, as measured in available seat-miles (ASMs). Flight segment in this context refers to a non-stop flight stage from taking off in the United States to the first destination in a foreign country or a non-stop flight stage from taking off in a foreign country to its first destination in the United States.
SOURCE: U.S. Department of Transportation, Bureau of Transportation Statistics, Office of Airline Information, Airline Data and Statistics, Passengers. Available at http://www.bts.gov/programs/airline_information/ as of March 2017.
Total(domesticandinternationalflightsintheUnitedStates)revenuepassenger-milesalsosetall-timerecordsin2016,totaling1.361trillion,4.7percentmorethanin2015,thepreviousrecordyear.Internationalflightsaccountedfor51percentofpassenger-miles,thefourthyearinarowthatpassenger-milesontheseflightsexceededthoseondomesticflights.
Thenumberofdomesticandinternationalflightsroseto9.7millionin2016,comparedto9.5millioninboth2014and2015.Despitetherecentincrease,thenumberofflightsremainswellbelowthe2005peakofover11.3millionflights.However,flightsarecarryingmorepassengersandhavehigherloadfactorsthanadecadeago.
Table2-4showsthatplaneshavealsobecomemorecrowdedsince2005asmeasuredbyloadfactors.Domesticflightswere,ingeneral,morecrowdedthaninternationalflights.Availableseatmiles,anothermeasureofplanecarryingcapacity,increasedabout10percentfrom2005to2016onU.S.carriers[USDOTBTSSA].Itcanbethoughtofasthesupplyofseats.
Flightsbetweendomesticairportsin2016accountedforroughly84percentoftotalU.S.flights,whileinternationalflightsofU.S.andforeigncarriersaccountedforabout16percent.Thepercentofpassengerswhoflewoninternationalflightsrosefrom18percentin2005toabout23percentin2016.

2-16
Chapter 2: Moving People
Long-distancerailroadtravelintheUnitedStatesisprimarilyonAmtrak(alsoknownastheNationalRailPassengerCorp.).Amtrakridershipgrewfor15consecutiveyearsbetween1997and2012,risingfrom19.7millionannualperson-tripsinfiscalyear1997,to31.2millionin2012.Subsequently,ridershipfellfor3years(decliningto30.8millionin2015),butthenreboundedin2016to31.3million,anewrecord.RidershiponNortheastCorridortrainsreachedarecordof11.9millionin2016,surpassingthepreviouspeaksetin2015[AMTRAK2017,2015].OnthesmallerAlaskaRailroad,annualridershippeakedin2007atmorethanone-halfmilliontrips,andhadnotregainedthislevelasof2015.CustomerstravelingaboardrailcarsownedbycruiselinesandpulledbytheAlaskaRailroadaccountedforjustunderhalfofthe2015AlaskaRailroadpassengers[ARRC2016].
Comparedto2012,long-distancetravelbymotorcoach,includingcharteraswellasscheduledservicebuses,declinedsomewhatin2013and2014,thelastyearforwhichdata
areavailable(table2-5).Therewereabout604millionpersontripsintheUnitedStatesandCanadain2014,roughly33millionfewertripsthanin2012butslightlymorethanin2010,whenthereweremorecarriersandcoachesbutfewerpassengertripspercoach.Justunderhalfofallbuspassengersin2014wereeitherstudentsorseniorcitizens[ABA2016].Charterserviceaccountedforabout47.5percentofmotorcoachmileage,andscheduledserviceaccountedforanother32.3percent.Theremainingmileswereforcommuting(4.6percent);packagedtours(6.6percent);transporttoandfromairports(3.7percent);sightseeing(3.5percent);andspecialoperations,suchasregular-routeservicetofairs,sports,andotherevents,andemployeetransporttoworksites(1.8percent).
Forces of Change in TravelManyfactorsaffectlocal,long-distance,andinternationaltraveltrends.Amongthemostimportantarepopulation,employment,carownership,householdincome,andeconomicconditions.Asubsetoftheseinclude:
TABLE 2-5 Motorcoach Carriers, Coaches, Trips, and Passenger-Miles: 2010–2014
2010 2011 2012 2013 2014 Percent change, 2010–2014
Carriers 4,011 3,984 3,954 3,801 3,628 -9.55
Coaches 40,709 40,141 39,607 36,903 36,520 -10.29
Passenger trips (millions) 601 627 637 605 604 0.44
Passenger trips per coach 14,800 15,600 16,100 16,400 16,500 11.49
Passenger miles (billions) 69 76 76 63 62 -10.87
Passenger miles per coach 1,703,200 1,897,400 1,912,500 1,710,000 1,700,000 -0.19
NOTE: The Motorcoach Census measures the size and activity of the motorcoach industry in the U.S. and Canada. The 2014 data year is the last year for which data are available.
SOURCE: American Bus Association, Motorcoach Census, available at www.buses.org as of March 2016.

2-17
Transportation Statistics Annual Report
FIGURE 2-7 U.S. GDP and Highway VMT: 1990–2015
0
500,000
1,000,000
1,500,000
2,000,000
2,500,000
3,000,000
3,500,000
$0
$2,000
$4,000
$6,000
$8,000
$10,000
$12,000
$14,000
$16,000
$18,000
1990 1992 1994 1996 1998 2000 2002 2004 2006 2008 2010 2012 2014
Hig
hway
VM
T (m
illio
ns)
GD
P (b
illio
ns o
f cha
ined
200
9 do
llars
)
GDP (billions of chained 2009 dollars)
Highway VMT (millions)
KEY: GDP = gross domestic product. VMT = vehicle-miles traveled.
NOTE: Shaded areas indicate economic recessions.
SOURCE: GDP: U.S. Department of Commerce, Bureau of Economic Analysis as cited U.S. Department of Transportation (DOT), Bureau of Transportation Statistics (BTS), National Transportation Statistics, Tables 3-10, available: www.bts.gov as of March 2017. VMT: DOT, Federal Highway Administration as cited in DOT, BTS. National Transportation Statistics, Table 1-35. Available: www.bts.gov as of March 2017.
• howtravelpreferencesmaychangeanddifferfromeachotheramongtheagingbabyboomgeneration(peoplebornbetweenmid-1946andmid-1964),theequallynumerousmillennialgeneration(generallydescribedaspeoplebornbetweentheearly1980sandtheearly2000s)andthesubsequentgeneration(thefirstentiregenerationbroughtupwiththeubiquitouspresenceofthecellphone);
• theemergenceandpopularityofapp-enabledtransportationoptions;
• uncertaintiesaboutfuturelevelsofimmigrationbothintoandwithintheUnitedStates;and
• thediminishingbutpossiblylingeringeffectsoftheeconomicrecessionspanningDecember2007toJune2009ontravelpatterns.
Economics and Recession
U.S.grossdomesticproduct(GDP)grewatabout3percentperyearbetween2000and2007,butdeclined0.3percentin2008and2.8percentin2009,beforeagaingrowingeachyearfrom2010throughtheendof2016atarateofabout2percentannually[USDOCBEA].
Figure2-7chartsGDPandhighwayVMTduringthepastquarterofacentury,duringwhichthreerecessionsoccurred.HighwayVMTremainedstableorgrewinthefirsttworecessions,whichwereofrelativelyshortdurationandrelativelymild.VMTshowsadifferentpatternduringthelongerandmoresevere2007–2009recession.Asthefigureillustrates,highwayVMTpeakedin2007,justastherecessionbegan,thendroppedin2008and2009.AgainVMTdroppedin2011beforereboundingslowly,onlyagainexceeding

2-18
Chapter 2: Moving People
prerecessionlevelsin2015.GDPhasgrownmorequicklythanVMTsincetheendoftherecession,rising13.7percent(inchained2009dollars)between2009and2015,whereasVMTroseonly4.7percent[USDOTFHWA2017].
Airlinetravel—especiallydomestictraffic—wasalsoadverselyaffectedbythe2007–2009recession.WhilethenumberofpassengersoninternationalflightstoandfromtheUnitedStatesreturnedtoprerecessionlevelsbeginningin2010,itwasnotuntil2015thatenplanementsondomesticflightsfinallyexceededtheir2007levels(figure2-8).
Transitridershipreachedahighpointin2008attheheightoftherecession,thendropped2.8percentby2010.Thiswasfollowedbyseveralyearsofgrowth,with2008levelsexceededin
2014whentherewere10.75billionunlinkedtransittrips.Transitridershipwasstimulatedinpartbyrisinggaspricesinthe2002to2008period,whenmanypeoplechosetotaketransitratherthandrive.5Afteradeclinein2009,gaspricesbounceduptoanall-timehighin2012[USDOEEIA2016].Thesubsequentandrapiddeclineingasprices—anationwideaveragedeclineof$1.19pergallonbetween2012and2015,with$0.91ofthedeclineoccurringin2015—raisesthequestionofwhetherpeoplewhoswitchedtotransitwhengaspriceswerehighwillgobacktodrivingifgaspricesremainlow[NOWAKANDSAVAGE].Transitridershipdeclinedfromthe2014highpointin
5A2014report,Net Effects of Gasoline Price Changes on U.S. Urban Areas,examinestheimpactofgasolinepriceincreasesontransitridershipin10U.S.urbanareas[ISEKI;ALI2014].Thereportisdiscussedinchapter2oftheTransportation Statistics Annual Report 2015.
FIGURE 2-8 U.S. Air Carrier Monthly Passenger Enplanements: January 2000–November 2016
0
10
20
30
40
50
60
70
80
2000 2001 2002 2003 2004 2005 2006 2007 2008 2009 2010 2011 2012 2013 2014 2015 2016
Mill
ions
of p
asse
nger
s
International
Domestic
International and domestic
NOTE: Includes enplanements on scheduled services. International enplanements include only U.S. carriers.
SOURCE: U.S. Department of Transportation, Bureau of Transportation Statistics, Office of Airline Information, T-100 Market Data. Available at www.transtats.bts.gov as of April 2016.
2-19
Transportation Statistics Annual Report
FIGURE 2-9 PMT per Household by Income Level: 2009 NHTS
0
10,000
20,000
30,000
40,000
50,000
60,000
70,000
Under$10,000
$10-19,999
$20-29,999
$30-39,999
$40-49,999
$50-59,999
$60-69,999
$70-79,999
$80-99,999
$100,000+
Pers
on-m
les
of tr
avel
per
hou
seho
ld
Household income
NOTE: 2009 is the most recent year available.
SOURCE: U.S. Department of Transportation, Federal Highway Administration, 2009 National Household Travel Survey, Online Analysis Tool. Avail-able at http://nhts.ornl.gov/ as of April 2016.
2015,andthedeclinecontinuedin2016andthefirsthalfof2017[USDOTBTS2017c].
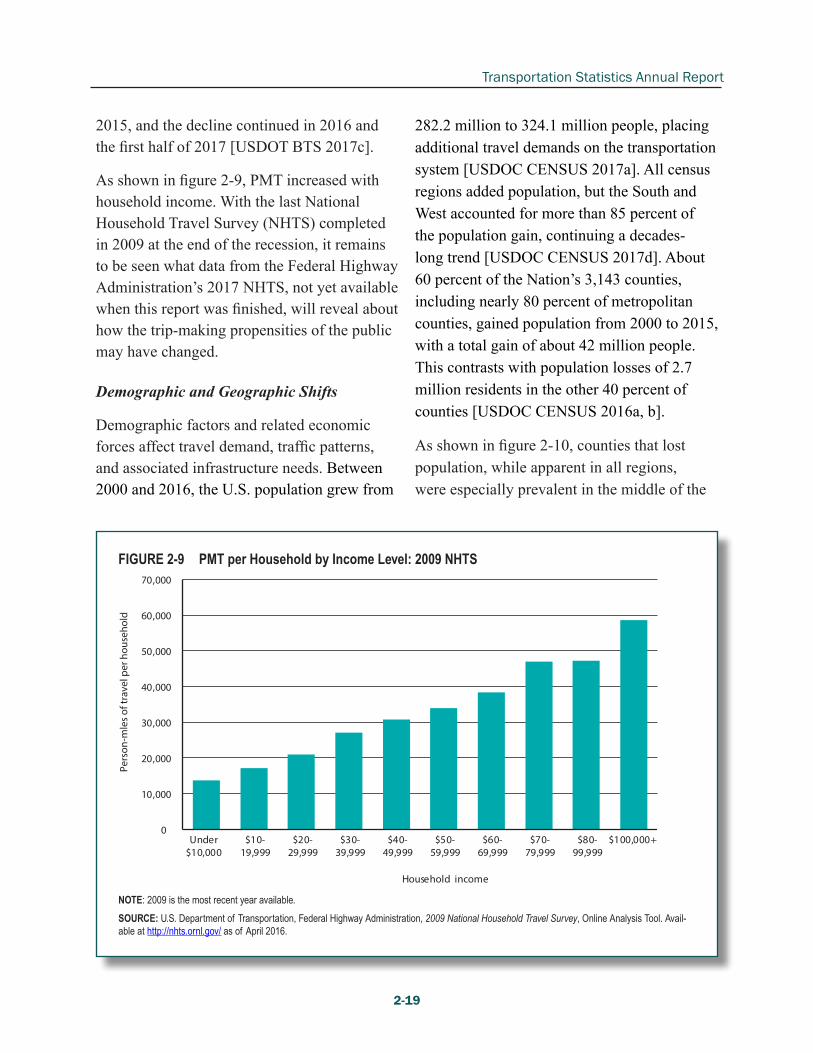
Asshowninfigure2-9,PMTincreasedwithhouseholdincome.WiththelastNationalHouseholdTravelSurvey(NHTS)completedin2009attheendoftherecession,itremainstobeseenwhatdatafromtheFederalHighwayAdministration’s2017NHTS,notyetavailablewhenthisreportwasfinished,willrevealabouthowthetrip-makingpropensitiesofthepublicmayhavechanged.
Demographic and Geographic Shifts
Demographicfactorsandrelatedeconomicforcesaffecttraveldemand,trafficpatterns,andassociatedinfrastructureneeds.Between2000and2016,theU.S.populationgrewfrom
282.2millionto324.1millionpeople,placingadditionaltraveldemandsonthetransportationsystem[USDOCCENSUS2017a].Allcensusregionsaddedpopulation,buttheSouthandWestaccountedformorethan85percentofthepopulationgain,continuingadecades-longtrend[USDOCCENSUS2017d].About60percentoftheNation’s3,143counties,includingnearly80percentofmetropolitancounties,gainedpopulationfrom2000to2015,withatotalgainofabout42millionpeople.Thiscontrastswithpopulationlossesof2.7millionresidentsintheother40percentofcounties[USDOCCENSUS2016a,b].
Asshowninfigure2-10,countiesthatlostpopulation,whileapparentinallregions,wereespeciallyprevalentinthemiddleofthe

2-20
Chapter 2: Moving People
FIGURE 2-10 Percent Change in Population by County: 2000–2015
0 100 Miles0 200 Miles 0 100 Miles
Percent change25.0 or more10.0 to 24.95.0 to 9.90.0 to 4.9-5.0 to -0.1Less than -5.0
Not comparable
SOURCE: U.S. Department of Commerce, Census Bureau, Population, County Population, Available at http://www.census.gov as of September 2017.
country,whilecountiesgainingpopulationwereespeciallyevidentintheWesternstatesandinTexasandFlorida.Gainsandlossesinregionalandmetropolitanpopulationaffecttransportationinfrastructureneedsandtravelpatterns.
Traveldemandisalsoaffectedbychangesinthelaborforceandsubsequentchangesinjourneys-to-work.Someoftheincomegeneratedbythelaborforceisspentnotonlyonessentialtravelbutalsoondiscretionarytrips.Thenumberofpeopleintheworkforceincreasedbynearly33million,growingfromabout126millionin
2000toabout159millionin2016[USDOLBLS2017b].Whileagreatershareofthelaborforceworksathomeorwalksandbikestotheirjobsthanin2000,three-fourthsormorecontinuetocommutealoneintheircars.
Ageisanotherfactorthataffectstraveldemand.Ageiscloselyassociatedwiththeprogressionofthehouseholdlifecycle(e.g.,singleperson,marriedcouple,householdswithsmallchildrenand/orschoolagechildren,emptynesters,andretiredindividuals).Boththeyoungest(under16yearsofage)andtheoldest(over65yearsofage)traveledtheleast

2-21
Transportation Statistics Annual Report
FIGURE 2-11 Daily Person-Miles of Travel (PMT) by Age Group: 1983, 1990, and 1995 NPTS, and 2001 and 2009 NHTS
0
10
20
30
40
50
60
1983 1990 1995 2001 2009
Dai
ly P
MT
(mile
s)
<16 16-20 21-35 36-65 >65
NOTES: 1990 person trips were adjusted to account for survey collection method changes. Please see Appendix 2 of 2001 Summary of Travel Trends for specifics. 2009 is the most recent year available.
SOURCE: U.S. Department of Transportation, Federal Highway Administration, National Household Travel Survey (multiple years), 2009 Summary of Travel Trends. Table 14. Available at http://nhts.ornl.gov/ as of June 2015.
comparedtootheragegroups(figure2-11).Thein-betweenagegroups,particularlythosebetween36and65yearsofage,accountedforthemajorityofPMT.Thisisaharbingeroffuturetrendsasoldermembersofthelaborforcemovetowardthe65-year-agethresholdwheremanypeoplemoveintoretirement.
Thebabyboomgeneration,peoplebornbetweenmid-1946andmid-1964,hasgeneratedmuchofthetravelactivityatthelocalandintercitylevelformanydecades.Today,evenasthetrailingedgeofthebabyboomgeneration,nowintheirearly50s,approachesearlyretirementage,boomersarestillaffectingtravelpatterns.Theyarethefirstgenerationinwhichbothwomenandmenhavebeenclosetoreachingsaturationpoints
fordriverlicensesandvehicleavailability.6Thusretiredbabyboomerscouldbeexpectedtobemoremobileintheirretirementyearsthanpreviousgenerations[AASHTO2013].Infact,theshareofpeoplewithdriverslicensesincreasedamongpeopleaged55andabovebetween1983and2014,withthegreatestincreaseoccurringamongpeople70ormoreyearsofage[UMTRI].Bycontrast,between1983and2014,theshareofpeoplewithdriver’slicensesfellforallagegroupsbetween16and44,withthegreatestdeclineoccurring
6AccordingtoFHWA,morethan89percentofpeople16andolderhadadriver’slicensein2009.Thisinclud-ed107millionmalesand104millionfemales.Peoplehavetheirlicensesuntilolderagesthaninthepast.About84percentofpeople70andabovehadadriver’slicensein2009,comparedtojust66percentofthesameagecohortin1990.About91percentofU.S.householdshaveaccesstoamotorvehicle.

2-22
Chapter 2: Moving People
amongtheyoungeragegroups[UMTRI].Asfornewvehiclepurchases,people55andaboveincreasedtheirshareofnewvehiclepurchasesintheUnitedStates,growingfrom21.2percentin2000to36.4percentin2015.Conversely,theshareofvehiclepurchasesamongallagegroupsbelowtheageof55declinedbetween2007,justbeforethestartoftherecession,and2015,withlittlesignificantdifferencesonceincomeandemploymentweretakenintoaccount.[KURZ,LIANDVINE].
Challenges for TravelAnimportantcomponentofthetransportationsystemisofferingwidespreadaccesstooptions,inparticularforthosegroupsinsocietywhohavethemostdifficultytravelingorthosewhohavelimitedaccesstotransportationservices.Thissectionbeginswithadiscussionofthedegreeofconnectivitybetweenpublictransportationmodes,usingdatafromtheBTSIntermodalPassengerConnectivityDatabase(IPCD).Otherchallengesdiscussedincludeaccesstotransportationforpeoplewithoutapersonalvehicleandtransportationoptionsfortheelderlyandthedisabled.
Passenger Access and Connectivity
Peopleusingpublictransportation(e.g.,Amtrak,intercitybus,orcommercialaviation)oftenneedtoconnecttoanothermodeoftransportationtoreachtheirdestinations.Proximitytotransportationmodes(e.g.,transit,intercitybus,ortrainstationaccessatairports)givestravelersmoremobilityoptions.
TheBTSIPCDinventoriestheproximityofintercitypassengerfacilities(e.g.,airports,
long-distancebusandferry,andintercityrailservice),certaintransitfacilities(e.g.,localferryandheavy,light,andcommuterrail),andbike-sharelocationstoeachother.AsofAugust2017,thereareover10,000uniquepassengertravelfacilitiesintheIPCD(seefigure2-12),ofwhich40.8percentdidnotoffernearbyconnectionstoothertransportationmodes,50.4percentconnectedtooneothermode,8.7percentconnectedtotwoothermodesoftransportation,and0.1percentconnectedtothreeormoreothermodesoftransportation.
Specifically,86.0percentoftheheavyrail-stations(high-speedtransitrailonanexclusiveright-of-way)offeredconnectionstoothermodesandarethemostconnectedofalltraveloptions,followedbybike-share(with73.8percent),commuterrail(with70.3percent),light-railtransit(with68.5percent),andAmtrak/intercityrail(with54.1percent).Aboutaquarter(23.7percent)ofairportswithscheduledpassengerserviceconnectwithotherpublictransportationmodes.Only12.5percentofintercitybusfacilitieshaveconnectionstoothermodes.
Bike-sharesystemsthatconnectwithothertransportationmodesextendthetransportationnetworkandincreasemodaloptions.Forexample,abuspassengerwhodisembarksnearabike-sharefacilityandgrabsabikecanridetomoreareagrocerystoresorothercommercialservicesthanbywalkingforthesameamountoftime.Atotalof93bike-sharesystemsoperate4,911stationsinover150U.S.citiesasofAugust2017(figure2-13).Mostbike-sharedockingstations(74.1percent)canbefoundnearlocalpublictransportationstops

2-23
Transportation Statistics Annual Report
FIGURE 2-12 Intermodal Passenger Facilities by Mode: August 2017
286
529
666
2,634
1,000
1,164
1,356
4,843
0 1,000 2,000 3,000 4,000 5,000
Ferries
Intercity rail
Airport
Intercity bus
Heavy rail transit
Commuter rail
Light rail transit
Bike-share
No other mode One other mode
Two other modes Three other modes or more
NOTES: Intercity bus connection includes: intercity, code share, and supplemental bus service. Transit rail connection includes: light rail, heavy rail, and commuter rail. Ferries includes both transit ferry and intercity ferry.
SOURCE: U.S. Department of Transportation, Bureau of Transportation Statistics, Intermodal Passenger Connectivity Database (as of 08/01/2017). Available at www.bts.gov as of August 2017.
(transitbus,commuterrail,heavyrail,lightrail,and/ortransitferry).Transitbusisthemosttypicalconnection,with72.4percentofbike-sharestationslocatedablockorlessfromatransitbusstop[USDOTBTS2017b].
SeveralU.S.citiesaretestingorhaveadopteddocklessbike-share(e.g.Washington,DC;Dallas,TX;Seattle,WA;andRevere,MA,amongothers),whereuserslocateandunlockanavailablebikeusingamobileappandthenleavethebikealmostanywherewhenfinished(versusreturningthebiketoafixeddockingstation).Becausethelocationofthebikeschanges,itisdifficulttomeasurehowthesesystemsextendthetransportationsystem.
Peopleusingpublictransportationoftenneedmoreinformationaboutexactlywhereandwhentogettotheirnextconnection.Transitprovidersarenowofferingsmartphoneappsthat“pushforward”informationaboutnearbyconnections,andprovideGPS
walkinginstructionsabouthowtogettotheirconnectionfromtheircurrentlocation.Theseappscanalsobeusedfortripplanning,mapping,routing,scheduling,identificationofreal-timestatus,andinsomecases,cashlessfarepayment.Somecitiesalsolinktheseappstobike-share,car-sharing,andridesourcingservices,allowinguserstogrababikeatabike-dockingstation,hailaTNCvehicle,orlocateacar-sharevehicletorent.Asnewwaystoconnecttransportationuserstoavailableservicesaredeveloped,variousnicherolesandmarketsforserviceprovidershaveproliferatedthatcouldenhanceaccessandconnectivity,asshowninbox2-C.
Transportation Options for People without Access to a Vehicle
Manypeoplewithoutaccesstoapersonalvehicle,especiallylow-incomegroups,havedifficultyreachingstores,services,

2-24
Chapter 2: Moving People
FIGURE 2-13 U.S. Cities with More than 10 Bike-Share Stations: 2017
Boston
Hoboken New York
AnnArbor
Miami
Denver
El Paso
Fort Worth
Boulder
Ft Lauderdale
Charlotte
Des MoinesSalt LakeCity
Omaha
Houston
Kansas City
Madison
Nashville
San Antonio
Minneapolis
Aspen
Pittsburgh
WestPalm Beach
OrlandoTampa
Topeka
Hailey
Boise
Phoenix
Albuquerque
San FranciscoPhiladelphia
DaytonIndianapolis
Milwaukee
Fargo
Austin
Chattanooga
Long Beach
WashingtonCincinnati
Columbus
San Diego
Chicago
Birmingham
Carmel
Fort Collins
Portland
San Ramon
Buffalo
Las Vegas
Cleveland
San Mateo
Charleston
Longmont
Carrollton
CollegePark
0 100 Miles
BeverlyHills
Long Beach
Los AngelesSanta
Monica
WestHollywood
0 10 Miles
1,000500
10010
Number of Stations
SOURCE: U.S. Department of Transportation, Bureau of Transportation Statistics, Intermodal Passenger Connectivity Database, available at http://www.bts.gov as of August 2017.

2-25
Transportation Statistics Annual Report
Box 2-C App-Enhanced Transportation OptionsTheapp-enhanced1transportationoptionsthathaveemergedinthelastdecadearerevampingtraditionalwaysofride-sharing,suchassharingataxi,acommuterbus,ortakingavanpool.Varioussmartphoneappsarealsomakingiteasierforpeopletoidentifyandmakelocaltransportationchoicesinreal-time,showingwhatservicesareavailableattheirspecificlocation.Servicesinclude:
• Ridesharing:matchcustomersgoingthesamedirectionanddeterminehowtosplitthefare.
• Buspooling:matchcommutersgoingthesamedirection,allowpeopletoreserveseatsinadvance,andchargeafixedfare.
1Appisshortforapplication,asoftwareprogramdownloadedtoamobilephoneorothercomput-ingdevicethatcanbeusedtocarryoutaspecificfunction.
• Neighborhoodshuttles:followafixedroute,withsomeinneighborhoodstypicallyunderservedbyothertransportationservices.
• Car-sharingfleets:app-basedservicesallowsubscriberstoreserveandrentacarforshortperiodsoftime.
• Car-sharingbyindividualowners:servicesallowcarownerstorenttheirvehicleswhenunneededtostrangers.
• Bike-share:short-termbikerentals
• Mobilephoneappforlocaltripplanning:Appdisplaysreal-timetransitarrivals/departures,andinsomemetroareasappcanbeusedtopayfareselectronically.Someappslinktobike-sharing,car-sharing,andridesourcingoptionsdiscussedabove,allowingtravelerstodeterminewhichoptionismostconvenientforthem.
andworkplacesoutsideoftheirimmediateneighborhoods.Aspreviouslydiscussed,about8.9percentofU.S.householdsdonothaveaccesstoapersonalvehicle.Thisshareofvehicle-lesshouseholdsinurbanareasis10.1percent,butinthemostdenselypopulatedpartsofcities(10,000pluspeoplepersquaremile),28.4percentofhouseholdshadnovehiclein2009[USDOTFHWANHTS2011].Vehicleavailabilityishigherinruralareasthanurbanareas,withonly4.2percentofruralhouseholdslackingaccesstoavehicle[NDSU].
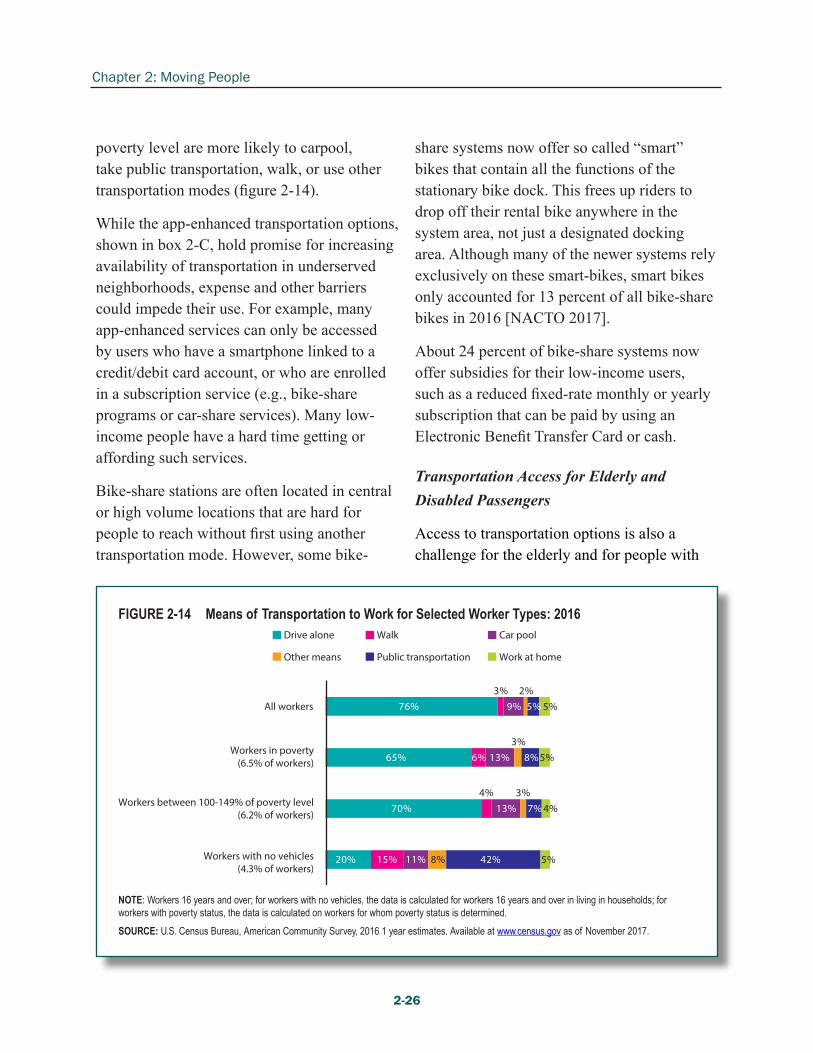
Peoplelivingbelowthepovertylevelarelesslikelytoownorhaveaccesstoapersonalvehicletogettoworkthanthepopulationas
awhole.In2015,43.1millionpeople,13.5percent,oftheU.S.populationwerelivinginpoverty7[USDOCCENSUS2016c].BTSanalysisofthe2009NHTSfoundthathouseholdswithannualincomeslessthan$25,000wereeighttimesmorelikely,onaverage,tobezero-vehiclehouseholdsthanhouseholdswithannualincomesabovethatlevel[USDOTFHWANHTS2011].Ofworkersbelowthepovertylevel,64.3percentdrivetoworkcomparedto76.8percentofworkersoverallin2014.Comparedtocommutersasawhole,peoplebelowthe
7AsdefinedbytheU.S.CensusBureau,povertythresh-oldsin2015variedfrom$12,228forasinglepersonun-dertheageof65to$49,721forafamilyofnine.Lowerthresholdspertainforpeopleovertheageof65.
2-26
Chapter 2: Moving People
povertylevelaremorelikelytocarpool,takepublictransportation,walk,oruseothertransportationmodes(figure2-14).
Whiletheapp-enhancedtransportationoptions,showninbox2-C,holdpromiseforincreasingavailabilityoftransportationinunderservedneighborhoods,expenseandotherbarrierscouldimpedetheiruse.Forexample,manyapp-enhancedservicescanonlybeaccessedbyuserswhohaveasmartphonelinkedtoacredit/debitcardaccount,orwhoareenrolledinasubscriptionservice(e.g.,bike-shareprogramsorcar-shareservices).Manylow-incomepeoplehaveahardtimegettingoraffordingsuchservices.
Bike-sharestationsareoftenlocatedincentralorhighvolumelocationsthatarehardforpeopletoreachwithoutfirstusinganothertransportationmode.However,somebike-
sharesystemsnowoffersocalled“smart”bikesthatcontainallthefunctionsofthestationarybikedock.Thisfreesupriderstodropofftheirrentalbikeanywhereinthesystemarea,notjustadesignateddockingarea.Althoughmanyofthenewersystemsrelyexclusivelyonthesesmart-bikes,smartbikesonlyaccountedfor13percentofallbike-sharebikesin2016[NACTO2017].
About24percentofbike-sharesystemsnowoffersubsidiesfortheirlow-incomeusers,suchasareducedfixed-ratemonthlyoryearlysubscriptionthatcanbepaidbyusinganElectronicBenefitTransferCardorcash.
Transportation Access for Elderly and Disabled Passengers
Accesstotransportationoptionsisalsoachallengefortheelderlyandforpeoplewith
FIGURE 2-14 Means of Transportation to Work for Selected Worker Types: 2016
20%
70%
65%
76%
15%
4%
6%
3%
11%
13%
13%
9%
8%
3%
3%
2%
42%
7%
8%
5%
5%
4%
5%
5%
Workers with no vehicles(4.3% of workers)
Workers between 100-149% of poverty level(6.2% of workers)
Workers in poverty(6.5% of workers)
All workers
Drive alone Walk Car pool
Other means Public transportation Work at home
NOTE: Workers 16 years and over; for workers with no vehicles, the data is calculated for workers 16 years and over in living in households; forworkers with poverty status, the data is calculated on workers for whom poverty status is determined.
SOURCE: U.S. Census Bureau, American Community Survey, 2016 1 year estimates. Available at www.census.gov as of November 2017.
2-27
Transportation Statistics Annual Report
physicalorcognitiveimpairments.Between2000and2015,theelderlypopulation(thoseage65orolder)intheUnitedStatesgrewby36.6percent,increasingfromabout35millionpeopletonearly48millionin15years.
Thetransportationneedsoftheolderpopulationwillchangeovertime;somewillcontinuetorelyontheirpersonalvehicleorothertransportationoptionstheyusedwhenyounger.Othersmaymakegreateruseoftransit,paratransitservices,andperhapssomeoftheapp-enhancedtransportationnetworkservicesshowninbox2-C.Stillothersmaydependonfamilymembersorfriendsfortheirtransportation.
SometransitagenciesarecontractingwithTNCsandtraditionaltaxistoprovide“lastmile”ridestoandfromtransitstationsatsubsidizedrates.TheAmericanAssociationofRetiredPersonsPublicPolicyInstituteestimatedthat12percentofalltripsand10percentofallmilestraveledintheUnitedStatesin2009weretakenbypersonsage65andolder[AARP2011].Transitusebypeopleage65andolderasashareofallthetripstheytookincreasedby40percentbetween2001and2009,whichrepresentedmorethan1billiontripsonpublictransportationin2009(a55percentincreasefromwhatwasreportedin2001).
Peoplewithdisabilitiesoftenreducetheirneedtotravel,orrelyonotheroptions,suchasaskingrelativesorfriendsforaride(figure2-15).Sincethe1990enactmentoftheAmericans with Disabilities Act(ADA),theNation’stransportationagencieshavebeenchargedwithmakingiteasierforpeoplewithdisabilitiestousepublictransportation
throughsuchaccommodationsasinstallingliftsandrampsonvehiclesforwheelchairsandmodifyingstationplatforms,parkingfacilities,andrestrooms.Progressvariesamongvariousserviceproviders.Allbutabout3percentoftransitbusstations(51outof1,475)aresaidtobeADAcompliant,asare98.2percentoftransitbuses(atleastamongthoseservicesthatreporttotheFederalTransitAdministration).AllcarsintheheavyrailtransitfleetarenowreportedtobeADAcompliant,butonlyabouthalf(50.6percent)ofheavyrailstations(suchassubwaystations)arecompliant.Similarly,inthecaseofcommuterrail,87percentoftraincarsarecompliant,butonly31.5percentofthecommuterrailstationsmeetADArequirements.Inthecaseofdemand-responsetransitvehiclesthatcanbeassignedbasedonapassenger’sindividualneeds,about87percentofthefleetisreportedtobeaccessible[APTAnodate].
Asforlong-distancepassengerrail,AmtrakhashaddifficultiesinmeetingitsscheduleforupgradingitspassengertrainstationstoADAstandards.ThiswassupposedtooccurbySeptember30,2015,25yearsafterpassageoftheADA.In2011theAmtrakInspectorGeneralfoundthatonly10percent(48of482)ofAmtrakstationswerecompliant[AMTRAKOIG].UnderanunderstandingwiththeDepartmentofJustice,AmtrakisdevelopingastrategytoprioritizeADAactions[USDOJ].AsofMarch2017,Amtrakinformationindicatedthatconstructionwascompleteon57stations,butnotedthatplatformworkcouldbeneededatsomestationstomakeplatformsADAcompliant[GREATAMERICANSTATIONS].

2-28
Chapter 2: Moving People
AnexaminationofrecentindicatorsofU.S.travelshowsthefollowing:
• Airtravelreboundedquicklyafterthe2007–2009recessionandsetnewrecordsin2016.
• Highwaytravelhaslaggedrecoveryratesofpriorrecessions,withVMTonlyreturningtoprerecessionlevelsin2015and2015PMTstillbelow2007levels.
• Carsandotherpersonalvehiclesremainthepredominantmodalchoiceformosttrips,includinginurbanareas.However,withtransitridershiponanupwardtrajectory,walkingandbikingtripsrebounding,andgrowingpopularityofapp-enhancedtransportoptions,modalchoiceshaveexpandedinmanyurbancenters.
Inordertounderstandpossiblechangesintraveldynamics,gooddataaboutlocal,long-distance,andinternationaltravelwillneedtobecollectedonaregularbasis.Thecentralquestionfordatadevelopmentwillbetodistinguishwhatchangesarecyclicalphenomena,andthereforetransient,fromthosethatarestructuralandafundamentalpartofaneweraoftravelbehavior.
ReferencesAARPPublicPolicyInstitute(AARP).How the Travel Patterns of Older Adults Are Changing: Highlights from the 2009 National Household Travel Survey(April2011).FactSheet218.Availableathttp://www.aarp.org/asofApril2016.
AlaskaRailroadCorporation(ARRC).Business Facts: Alaska Railroad Passenger
Services(January7,2016).Availableathttps://www.alaskarailroad.com/asofApril2017.
AmericanAssociationofStateHighwayandTransportationOfficials(AASHTO).Commuting in America 2013.Availablehttp://traveltrends.transportation.org/asofApril2017.
AmericanBusAssociation(ABA)Foundation.2016.Motorcoach Census 2014, (February11,2016).Availableathttp://www.buses.org/asofApril2016.
AmericanPublicTransportationAssociation(APTA).
—2017:RidershipReport.Availableathttps://www.apta.com/asofApril2017.
—Nodate:ADAFactsataGlance.Nodate.Availableathttps://www.apta.com/asofMay2016.
BrookingsMetropolitanPolicyProgram[BROOKINGS].TheGrowingDistanceBetweenPeopleandJobsinMetropolitanAmerica.Kneebone,ElizabethandHolmes,Natalie.March2015.Availableathttp://brookings.edu/metroasofSeptember2017.
GreatAmericanStations,AmtrakAccessibilityUpdate:March2017.Availableathttp://www.greatamericanstations.com/amtrakasofSeptember2017.
Iseki,Hiroyuki;Ali,Rubaba(ISEKI;ALI).Net Effects of Gasoline Price Changes on U.S. Urban Areas.(December2014).Availableathttp://transweb.sjsu.edu/asofNovember2017.
Kurz,Christopher;Li,Geng;andVine,Daniel(KURZ,LIANDVINE).TheYoung

2-29
Transportation Statistics Annual Report
andtheCarless:TheDemographicsofNewVehiclePurchases.June24,2016.FEDSNOTES.BoardofGovernorsoftheFederalReserveSystem.Availableathttp://www.federalreserve.gov/asofApril2017.
MarketRealist:Must-know:Whyavailableseatmilesaffectairlines’revenue.September15,2014.Availableatmarketrealist.comasofNovember2017.
Mckenzie,Brian(MCKENZIE):
—2015:“WhoDrivestoWork?CommutingbyAutomobileintheUnitedStates:2013.”American Community Survey Reports,ACS-32.U.S.CensusBureau.Washington,DC.Availableathttps://www.census.gov/asofApril2017.
—2014:“ModesLessTraveled:CommutingbyBicycleandWalkingintheUnitedStates2008-2012.”American Community Survey Reports,ACS-25.U.S.CensusBureau.Washington,DC.Availableathttps://www.census.gov/asofApril2017.
NationalAssociationofCityTransportationOfficials(NACTO).BikeShareintheUS:2010-2016.Availableathttps://www.nacto.org/asofApril2017.
NationalCenterforSafeRoutestoSchool(NCSRTS),
—2016:TrendsinWalkingandBicyclingtoSchoolfrom2007to2014.Availableathttp://www.saferoutesinfo.org/asofApril2017.
—2011:HowChildrenGettoSchool:SchoolTravelPatternsfrom1969to2009.November2011.Availableathttp://www.saferoutesinfo.org/asofApril2017.
NationalRailroadPassengerCorporation(AMTRAK).
—2017:NationalFactSheetFY2016.Availableathttp://www.amtrak.com/asofApril,2017.
—2015:Amtrak Ridership And Ticket Revenue Steady In Fiscal Year 2015. (December2,2015).Availableathttp://www.amtrak.com/asofApril,2017.
—2015:OfficeofInspectorGeneral(OIG).TrainOperationsandBusinessManagement:AddressingManagementWeaknessesisKeytoEnhancingtheAmericanwithDisabilitiesProgram.AuditReportOIG-A2014-010,August4,2014.Availableathttp://www.amtrakoig.gov/asofSeptember,2017.
NorthDakotaStateUniversity(NDSU).Rural Transit Fact Book 2017.UpperGreatPlainsTransportationInstitute.SmallUrbanandRuralTransitCenter.SURLC17-007October2017.Availableathttp://www.surtc.org/transitfactbook/asofNovember2017.
Nowak,WiiliamP.andSavage,Ian(NOWAKANDSAVAGE).The cross elasticity between gasoline prices and transit use: evidence from Chicago.2013.TransportPolicy,v.29.Availableathttp://faculty.wcas.northwestern.edu/asofNovember2017.
Rapino,MelanieA.andFields,AlsionK.(RAPINOANDFIELDS).MegaCommutersintheU.S.TimeandDistanceinDefiningtheLongCommuteusingtheAmericanCommunitySurvey.WorkingPaper2013-03.PresentedattheAssociationforPublicPolicyAnalysisandManagementFall2013Conference.Availableathttp://www.census.
2-30
Chapter 2: Moving People
gov/asofApril2017.
SchallerConsulting(SCHALLER).Unsustainable? The Growth of App-Based Ride Services and Traffic, Travel and the Future of New York City.2017.February27.Availableatschallerconsult.comasofApril2017.
UniversityofMichiganTransportationResearchInstitute(UMTRI).RecentDecreasesintheProportionofPersonswithaDriver’sLicenseacrossAllAgeGroups.MichaelSivakandBrandonSchoettle.January2016.Availableathttp://www.umtri.umich.edu/asofApril2017.
USAToday(USATODAY).5waystogetacaryouneedtodriveforUberorLyft.Jan.8,2017.Availableathttps://www.usatoday.com/asofSeptember2017.
U.S.DepartmentofCommerce(USDOC),CensusBureau(CENSUS):
—2017a:Annual Estimates of the Resident Population: April 1, 2010 to July 1, 2016.Availableathttp://factfinder2.census.gov/asofApril2017.
—2017b:American Community Survey (ACS).ComparativeHousingCharacteristics.CP04.Availableathttp://www.census.gov/asofApril2017.
—2017c:American Community Survey (ACS).Commuting.S0801.Availableathttp://www.census.gov/asofApril2017.
—2017d:UnitedStatesPopulationGrowthbyRegion:2000to2016.Availableathttp://www.census.gov/asofApril2017.
—2016a:Cumulative Estimates of Resident
Population Changes for Counties and County Rankings: April 1, 2010 to July 1, 2015.Availableathttp://www.census.gov/asofMay2016.
—2016b:MetropolitanandMicropolitanMain.Availableathttp://www.census.gov/asofMay2016.
—2016c:IncomeandPovertyintheUnitedStates:2015.BernadetteD.Proctor,JessicaL.Semega,MelissaA.Kollar.September13,2016.ReportNumber:P60-256.Availableathttp://www.census.gov/asofApril2017.
—2013:Working at Home is on the Rise.(Infographic)Availableathttp://www.census.gov/asofApril2016.
—2004:Journey-to-Work:2000.Census2000Brief.March2004.C2KBR-33.Availableathttp://www.census.gov/asofApril2017.
—1990:Decennial Census.Availableathttp://www.census.gov/asofApril2017.
U.S.DepartmentofCommerce(USDOC),BureauofEconomicAnalysis(BEA),Monthly Disposable Income, Personal Consumption Expenditures and Personal Saving (December2013).Availableathttp://www.bea.gov/asJune2015.
U.S.DepartmentofCommerce(USDOC),NationalTravelandTourismOffice(NTTO),InternationalVisitationtotheUnitedStates.Availableathttp://travel.trade.gov/asofApril2017.
U.S.DepartmentofEnergy(USDOE),EnergyInformationAdministration(EIA).2016.AverageAnnualGasolinePumpPrice,1929—2015,FactoftheWeek#915.Availableat

2-31
Transportation Statistics Annual Report
http://eia.govasofApril2017.
U.S.DepartmentofJustice(USDOJ).CivilRightsDivision.TheUnitedStates’FindingsandConclusionsBasedonitsInvestigationunderTitleIIoftheAmericanswithDisabilitiesActoftheNationalRailroadPassengerCorporation,DJNo.204-16-128.June9,2015.Availableathttps://www.ada.gov/asofSeptember2017.
U.S.DepartmentofLabor(USDOL).BureauofLaborStatistics(BLS):
—2017a:AmericanTimeUseSurvey-2016results,June27,2017.USDL-17-0880.Availableatwww.bls.govasofJuly2017.
—2017b:LaborForceStatisticsfromtheCurrentPopulationSurvey.SeriesIDLNS12000000.Availableathttp://www.bls.gov/asofApril2017-2016.AmericanTimeUseSurvey-2015results,June2016.USDL-16-1230.Availableatwww.bls.govasofOctober2016.
U.S.DepartmentofTransportation(USDOT).BureauofTransportationStatistics(BTS):
—2017a.U.S.Flights2016TrafficDataforU.S.AirlinesandForeignAirlines.March27.Availableathttp://www.bts.gov/asofApril2017
—2017b.IntermodalPassengerConnectivityDatabase(IPCD).Availableathttp://www.bts.gov/asofApril2016.
—2017c.Seasonally-AdjustedTransportationData.Availableathttp://www.bts.gov/asofSeptember2017.
—National Transportation Statistics (NTS).Availableathttp://www.bts.gov/asofApril2017.
—OfficeofAirlineInformation(OAI).T-100Segment Data.Availableathttp://www.bts.gov/asofApril2016.
U.S.DepartmentofTransportation(USDOT).FederalHighwayAdministration(FHWA).
—2017.HighwayStatistics.January2017.Availableathttp://www.fhwa.dot.gov/asofApril2017.
—2011.Summary of Travel TrendsNational Household Travel Survey (NHTS)2009(June2011).Availableathttp://nhts.ornl.gov/asofApril2017.
