chapter 2 interactions in ecosystems - miss s....
TRANSCRIPT
2Interactions in EcosystemsCHAPTER
Living things are connectedto each other in complexinterrelationships.
Biotic and abiotic factors areresponsible for shaping a community ofliving things.
Nutrients cycle within ecosystems.
Energy flows through ecosystems.
20 NEL
Chapter PreviewWhat do you need to live? How are your needs differentfrom those of other living things on Earth? Where do thethings that you need come from? What would happen ifsomething you needed was not available?
Life exists almost everywhere on Earth. All life, andeverything needed to maintain it, exists within a thinlayer of land, sea, and air. While the estimates vary, somescientists believe that as many as 40 million differentspecies may populate the planet. But only about 3 millionof them have been identified and given a name. Only afew thousand of them have been studied in detail.Scientists attempt to learn more about each living thing.But they do not stop there.
To fully understand the world of living things, scientistslook at how organisms interact with each other and withtheir environment. No living thing can exist in isolation.Every organism is linked to other organisms on theplanet. Trying to understand all of the relationships thatexist among different living things, as well as with theirsurroundings, is the goal of ecology.
Skills Focus: communicating, recording
TRY THIS: Modelling Interactions
In this activity, you will explore the interactions that one organismhas with the other organisms around it, and with the environmentin which it lives.
Materials: notebook or graphic organizer
1. Create a graphic organizer to represent interactions betweena spider and its environment.
2. Consider what the spider eats. What other organisms mightcompete with it for the same food? What eats spiders?Consider other relationships as well.
3. Consider the non-living factors that affect the spider.
4. Add these organisms, relationships, and factors in yourgraphic organizer. Connect the interactions by drawing linesbetween them and the spider.
A. In what way is this model of representing interrelationshipsuseful?
B. What are the weaknesses of this type of model for showinginterrelationships?
C. Why are models like this one useful for understandinginterrelationships among organisms and their environments?
D. The spider is just one organism. What can you predict aboutmodelling interactions that occur between all of the livingthings on planet Earth?
KEY IDEAS
Unit A_Ch 02 4/1/08 11:22 AM Page 20
2.1 Biotic and Abiotic Factors in Ecosystems 21NEL
2.1 Biotic and Abiotic Factors in Ecosystems
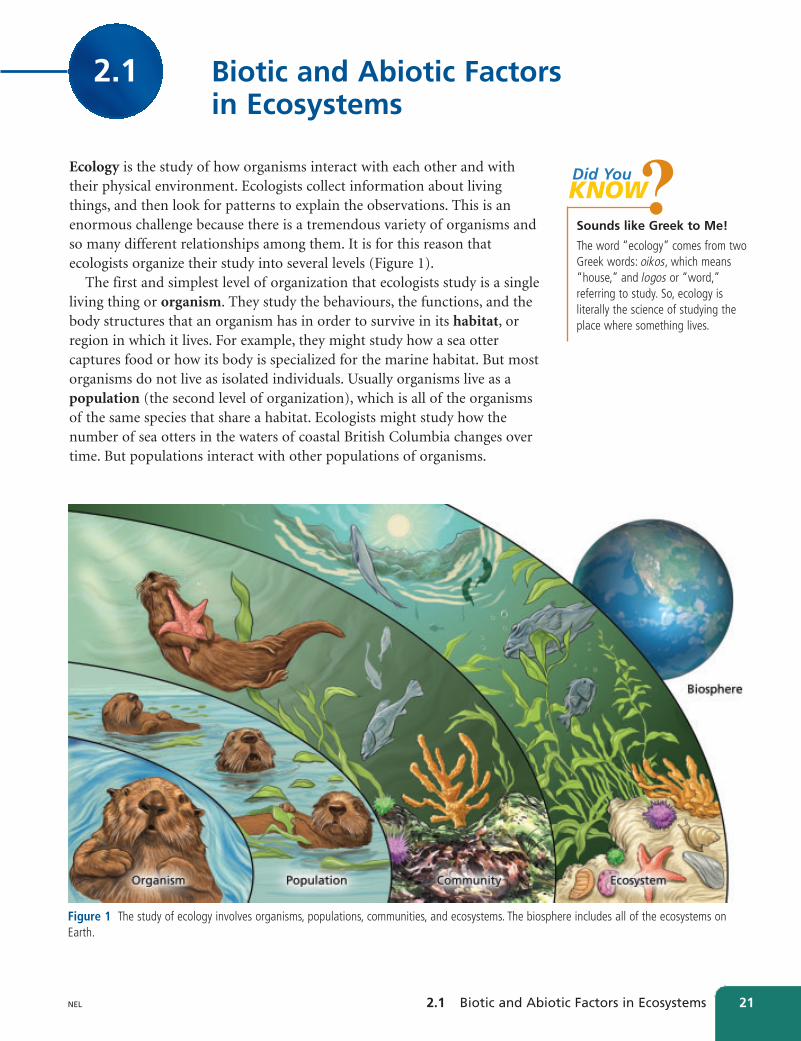
Ecology is the study of how organisms interact with each other and withtheir physical environment. Ecologists collect information about livingthings, and then look for patterns to explain the observations. This is anenormous challenge because there is a tremendous variety of organisms andso many different relationships among them. It is for this reason thatecologists organize their study into several levels (Figure 1).
The first and simplest level of organization that ecologists study is a singleliving thing or organism. They study the behaviours, the functions, and thebody structures that an organism has in order to survive in its habitat, orregion in which it lives. For example, they might study how a sea ottercaptures food or how its body is specialized for the marine habitat. But mostorganisms do not live as isolated individuals. Usually organisms live as apopulation (the second level of organization), which is all of the organismsof the same species that share a habitat. Ecologists might study how thenumber of sea otters in the waters of coastal British Columbia changes overtime. But populations interact with other populations of organisms.
Sounds like Greek to Me!
The word “ecology” comes from twoGreek words: oikos, which means“house,” and logos or “word,”referring to study. So, ecology isliterally the science of studying theplace where something lives.
?KNOWDid You
Figure 1 The study of ecology involves organisms, populations, communities, and ecosystems. The biosphere includes all of the ecosystems onEarth.
Unit A_Ch 02 4/1/08 11:22 AM Page 21
Unit A Sustainability of Ecosystems22 NEL
All of the different populations in a particular area interact, forming acommunity, which is the third level of organization. The community thatlives within the kelp beds off the coast of British Columbia includes manypopulations of plants, fish, and invertebrates like sea urchins, sea stars, andsponges. At the community level, an ecologist might study how the numberof sea urchins affects the number of sea otters in the kelp bed community.They are interested in ways that internal and external factors affect the sizeof the populations in a community.
An ecosystem, which is the fourth and most complex level oforganization, includes the living community as well as the physicalenvironment in which the organisms live.
Factors such as the introduction of a new species or a temperature changewould have a huge impact on the kelp bed community. An ecosystem issimply a convenient way to look at interactions between the living and thenon-living things in an area. It is not defined by size or complexity. It couldbe as small as the spaces in a rotting log, or as big as the ocean. You couldeven think of Earth as one big ecosystem, but because of its complexity it isusually considered on a different level called the biosphere. The biosphere isthe total area of Earth where living things are found, including the soil,atmosphere, and ocean.
There are two types of environmental factors in an ecosystem, the livingcommunity and the physical environment. The living components of theecosystem are called biotic factors. For example, in the kelp beds off thecoast of British Columbia the biotic factors include the plants, fish, andinvertebrates, as well as the complex interactions occurring between them.The non-living components, or abiotic factors, include the physical andchemical components in the environment. Some of the more significant
GOGO
In this activity, you will combine living and non-living factors tocreate your own ecosystem.
Materials: 3–4 L jar with lid, 250 g of sand or gravel,4–5 aquatic snails, 2 small guppies, 4–5 aquatic plants
1. Place 2–3 cm of sand or gravel into a large jar.
2. Fill the jar with tap water to within 5 cm of the top. Let itstand without the lid on for 48 h.
3. Add the aquatic plants, snails, and guppies.
4. Place the lid on the jar and seal tightly.
5. Place the jar in an area where it can receive indirect sunlightfor 1 week.
A. What was the purpose of sealing your model ecosystem?
B. What is the source of carbon dioxide that the algae andplants require?
C. What is the source of oxygen that the fish and snails require?
D. How do the plants and animals get the necessary nutrients?
E. What would happen to the ecosystem if one of the fish died?
Skills Focus: conducting, recording, communicating, questioning, evaluating
TRY THIS: Make a Model Ecosystem
Handle glass products with care. Assemblethe equipment where it will stand so that itdoes not need to be moved after being filled.
STUDY TIPCheck your understanding. Are youable to recall the levels within thebiosphere? If not, reread the mainideas and words in bold, and re-examine Figure 1, on page 21.
To learn more about theecosystems found in BritishColumbia, go towww.science.nelson.com GOGO
Unit A_Ch 02 4/1/08 11:22 AM Page 22
2.1 Biotic and Abiotic Factors in Ecosystems 23NEL
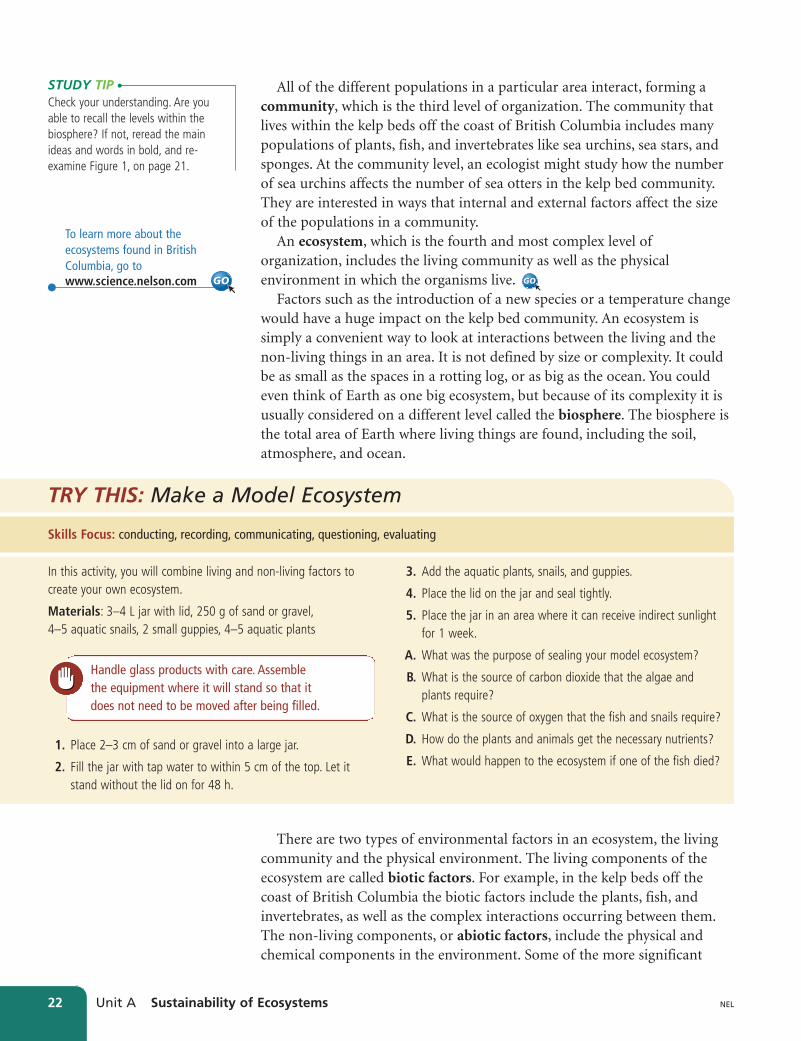
abiotic factors are temperature, wind, water, sunlight, and oxygen.The abiotic factors in the kelp beds would include (among others) the watertemperature, the currents, and factors such as an oil spill.
Abiotic and biotic factors are connected to each other (Figure 2). Asorganisms live, they alter the environment around them, which in turnaffects the organisms. This type of balance, where there is continuous changebut the overall system remains stable, is called dynamic equilibrium.Ecosystems are normally able to adjust to small changes from within.The importance of abiotic factors cannot be emphasized enough. The difference in abiotic factors like climatic conditions and soil qualitydetermines the distribution of life and contributes to diversity within thebiosphere.
Sometimes one factor, known as a limiting factor, is the most criticalfactor in determining the types of organisms that can exist in an ecosystem.For example, the large Douglas fir trees in our Pacific coastal forests growonly in regions with high annual rainfall. In aquatic environments,important limiting factors are sunlight, temperature, and the amount ofdissolved oxygen in the water.
Figure 2 Abiotic factors such as (a) frost and biotic factors such as (b) pests and (c) other organisms affect the growth of the biotic factors likecrops.
Investigation2A
The Effect of Abiotic Factorson a Yeast Population
To perform this investigation, turn topage 42.
In this investigation, you willinvestigate the effects of abioticfactors on populations.
Investigation2A
Abiotic Technology
Many of the technologies you useeveryday were invented in responseto an existing abiotic factor. Furnaces,air conditioners, solar panels, andmany other technologies are just afew of the adaptations humans havemade in response to abiotic factors.
?KNOWDid You
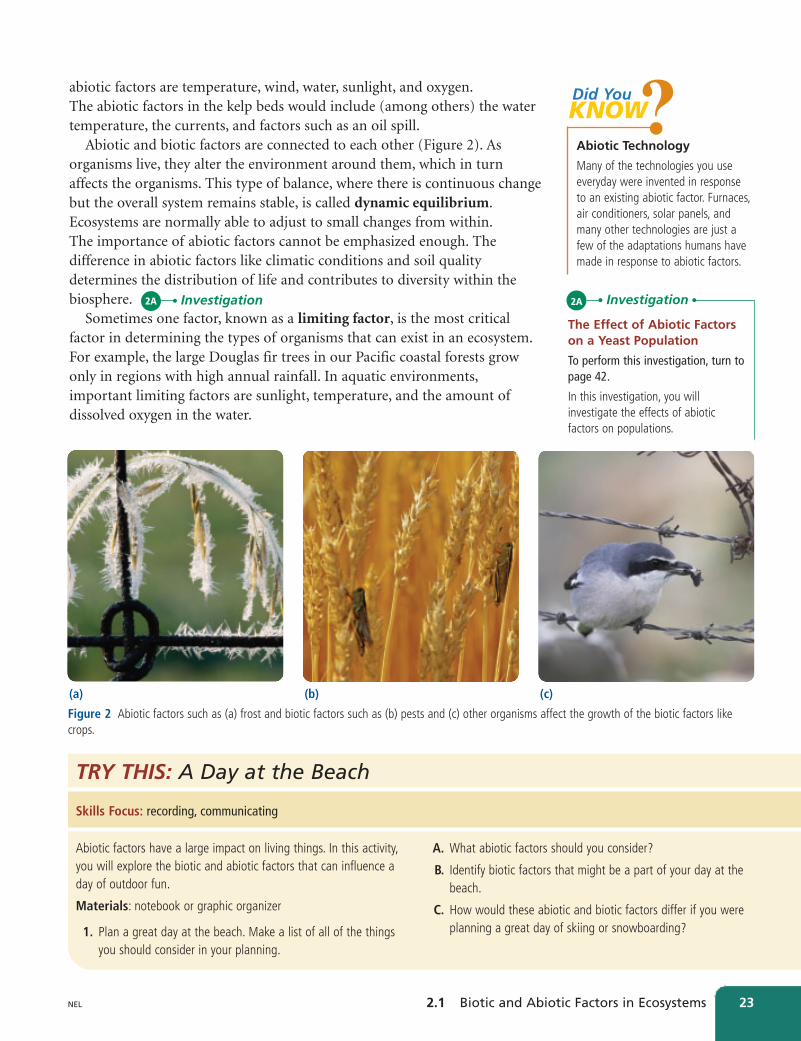
Abiotic factors have a large impact on living things. In this activity,you will explore the biotic and abiotic factors that can influence aday of outdoor fun.
Materials: notebook or graphic organizer
1. Plan a great day at the beach. Make a list of all of the thingsyou should consider in your planning.
Skills Focus: recording, communicating
TRY THIS: A Day at the Beach
A. What abiotic factors should you consider?
B. Identify biotic factors that might be a part of your day at thebeach.
C. How would these abiotic and biotic factors differ if you wereplanning a great day of skiing or snowboarding?
(a) (c)(b)
Unit A_Ch 02 4/1/08 11:23 AM Page 23

CHECK YOUR Understanding2.1
1. Compare the following terms. Give bothsimilarities and differences.(a) ecosystem and habitat (b) organism and population(c) biosphere and community(d) ecosystem and community
2. What level of organization within the biosphereis represented by each of the following?(a) a herd of water buffalo(b) the plants and animals on the Serengeti
plain of Africa(c) a lake and all of the organisms that live
within it(d) a grizzly bear(e) sunflowers growing in a garden
3. Which level of organization is being consideredin each of the following ecological studies?(a) observing how the talons of a bald eagle are
used to capture food(b) observing the migratory pattern of a flock
of snow geese(c) observing the impact of a hazardous
chemical spill on living things in a nearbystream
(d) observing the nest-building behaviour ofhummingbirds
(e) observing the effect of fleas on the health ofhouse pets
(f) measuring the changes in oxygen levels of asmall lake during periods of rapid plantgrowth
4. Why is the science of ecology important?
5. List at least three characteristics of ecosystemsthat make them challenging to understand indetail.
6. Provide two other situations besides ecology inwhich it is helpful to use a classification systemlike the one developed by ecologists.
7. The mouth of a dog or Earth itself could eachbe defined as entire ecosystems. Whatcharacteristics do they have in common thatmakes this similar classification appropriate?
8. Use Figure 3 to answer the following questions:
(a) Identify each of the following from theillustration. Explain your reasoning.
i) two biotic factors
ii) two abiotic factors
iii) a limiting factor(b) Describe the relationship between the
abiotic and biotic factors that you selected.(c) Which abiotic factor could be altered to
have the greatest effect on the ecosystem?Explain your reasoning.
Unit A Sustainability of Ecosystems24 NEL
Figure 3
Unit A_Ch 02 4/1/08 11:23 AM Page 24
2.2 Ecological Roles and Relationships 25NEL
We can look at an ecosystem as a complex network of interactions. Withinan ecosystem, all organisms need to carry out basic essential life functionssuch as growth, movement, repair, and reproduction. In order to performthese functions, organisms must take in food, water, and other nutrients.Nutrients are the elements and compounds that organisms must have inorder to live and grow. Nutrients include water, oxygen, vitamins, andminerals, as well as the foods we eat that provide fats, proteins, andcarbohydrates. Some organisms, like plants, can make their own food,while other organisms need to consume food in order to live.
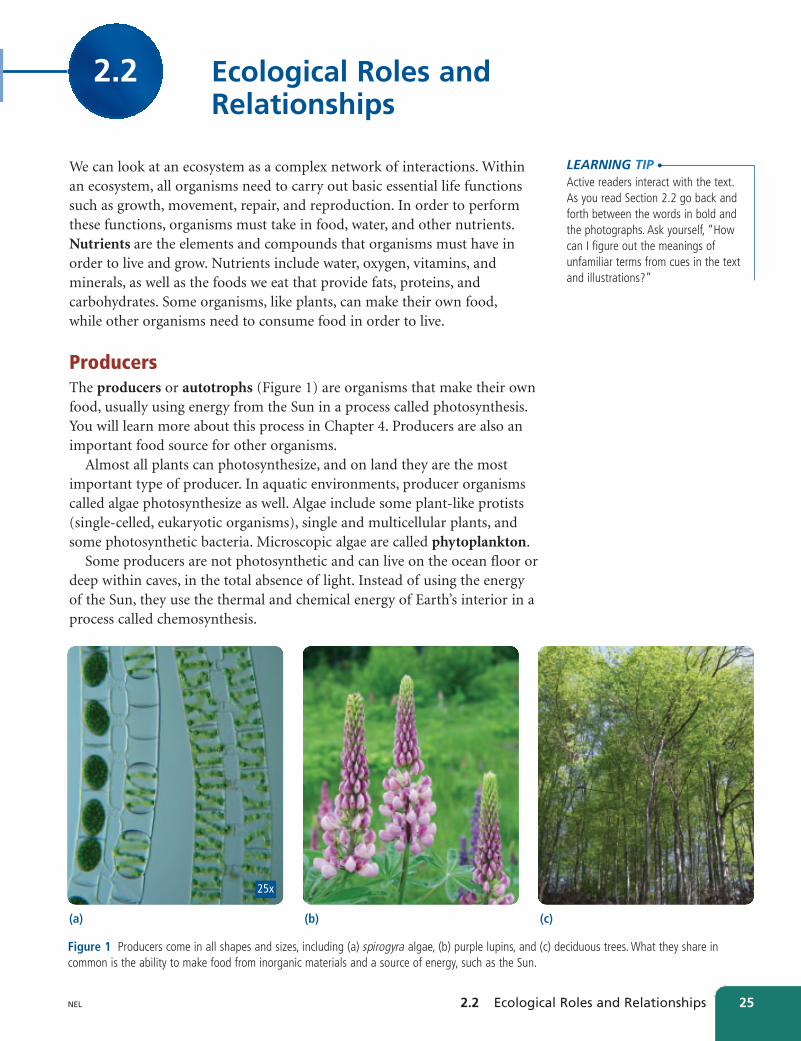
Producers The producers or autotrophs (Figure 1) are organisms that make their ownfood, usually using energy from the Sun in a process called photosynthesis.You will learn more about this process in Chapter 4. Producers are also animportant food source for other organisms.
Almost all plants can photosynthesize, and on land they are the mostimportant type of producer. In aquatic environments, producer organismscalled algae photosynthesize as well. Algae include some plant-like protists(single-celled, eukaryotic organisms), single and multicellular plants, andsome photosynthetic bacteria. Microscopic algae are called phytoplankton.
Some producers are not photosynthetic and can live on the ocean floor ordeep within caves, in the total absence of light. Instead of using the energy of the Sun, they use the thermal and chemical energy of Earth’s interior in aprocess called chemosynthesis.
2.2 Ecological Roles and Relationships
Figure 1 Producers come in all shapes and sizes, including (a) spirogyra algae, (b) purple lupins, and (c) deciduous trees. What they share incommon is the ability to make food from inorganic materials and a source of energy, such as the Sun.
(a) (b) (c)
LEARNING TIPActive readers interact with the text.As you read Section 2.2 go back andforth between the words in bold andthe photographs. Ask yourself, “Howcan I figure out the meanings ofunfamiliar terms from cues in the textand illustrations?”
25x
Unit A_Ch 02 4/1/08 11:23 AM Page 25
Unit A Sustainability of Ecosystems26 NEL
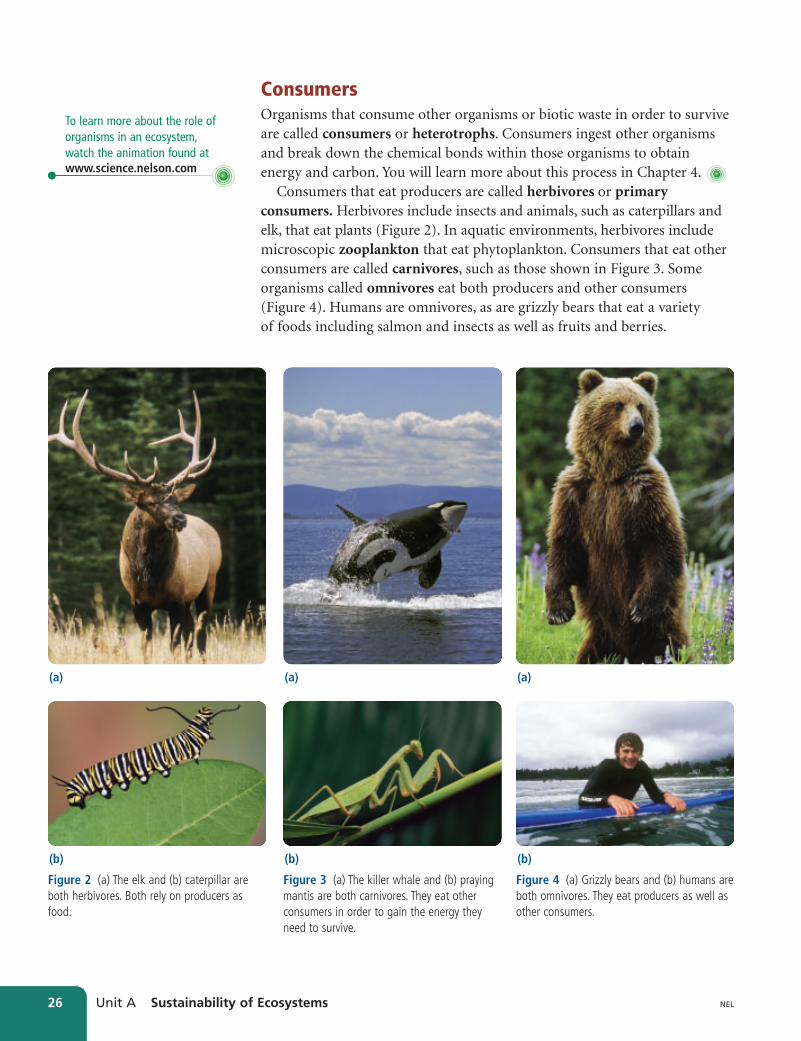
ConsumersOrganisms that consume other organisms or biotic waste in order to surviveare called consumers or heterotrophs. Consumers ingest other organismsand break down the chemical bonds within those organisms to obtainenergy and carbon. You will learn more about this process in Chapter 4.
Consumers that eat producers are called herbivores or primaryconsumers. Herbivores include insects and animals, such as caterpillars andelk, that eat plants (Figure 2). In aquatic environments, herbivores includemicroscopic zooplankton that eat phytoplankton. Consumers that eat otherconsumers are called carnivores, such as those shown in Figure 3. Someorganisms called omnivores eat both producers and other consumers(Figure 4). Humans are omnivores, as are grizzly bears that eat a variety of foods including salmon and insects as well as fruits and berries.
Figure 2 (a) The elk and (b) caterpillar areboth herbivores. Both rely on producers asfood.
To learn more about the role oforganisms in an ecosystem,watch the animation found atwww.science.nelson.com
Figure 3 (a) The killer whale and (b) prayingmantis are both carnivores. They eat otherconsumers in order to gain the energy theyneed to survive.
(b) (b)
(a) (a)
Figure 4 (a) Grizzly bears and (b) humans areboth omnivores. They eat producers as well asother consumers.
(b)
(a)
Unit A_Ch 02 4/1/08 11:24 AM Page 26
2.2 Ecological Roles and Relationships 27NEL
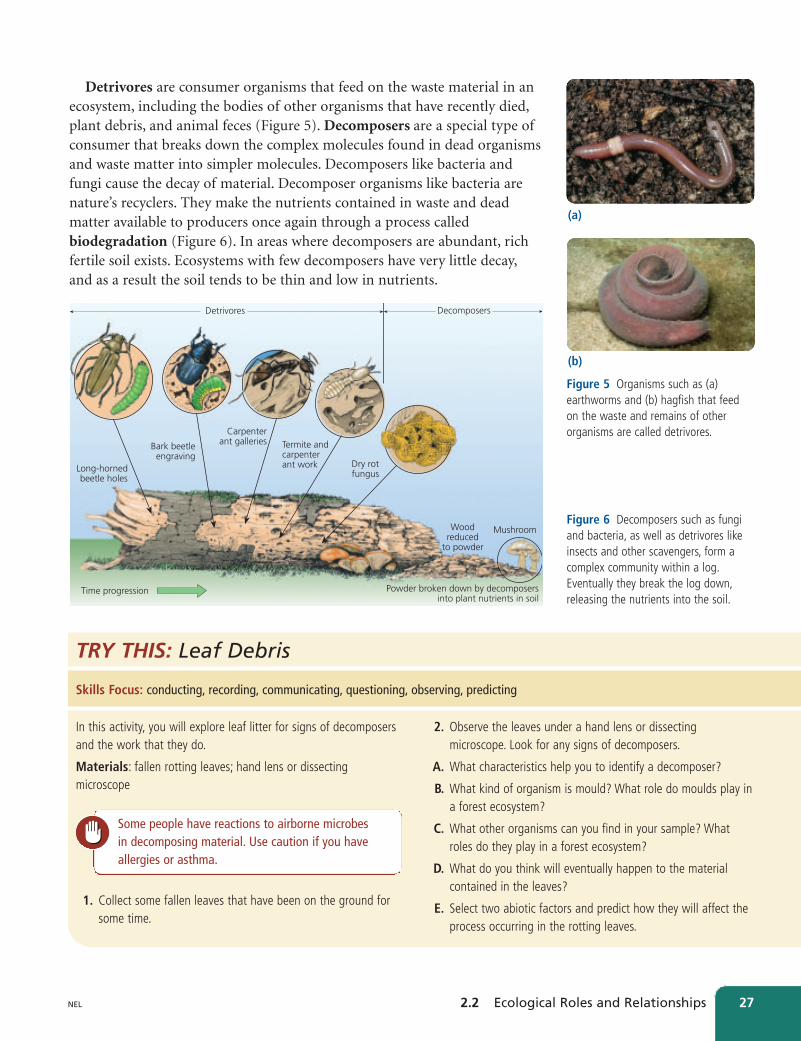
Detrivores are consumer organisms that feed on the waste material in anecosystem, including the bodies of other organisms that have recently died,plant debris, and animal feces (Figure 5). Decomposers are a special type ofconsumer that breaks down the complex molecules found in dead organismsand waste matter into simpler molecules. Decomposers like bacteria andfungi cause the decay of material. Decomposer organisms like bacteria arenature’s recyclers. They make the nutrients contained in waste and deadmatter available to producers once again through a process calledbiodegradation (Figure 6). In areas where decomposers are abundant, richfertile soil exists. Ecosystems with few decomposers have very little decay,and as a result the soil tends to be thin and low in nutrients.
Figure 5 Organisms such as (a)earthworms and (b) hagfish that feedon the waste and remains of otherorganisms are called detrivores.
Detrivores
Long-hornedbeetle holes
Bark beetleengraving
Carpenterant galleries
Time progression Powder broken down by decomposersinto plant nutrients in soil
Decomposers
Mushroom
Termite andcarpenterant work Dry rot
fungus
Woodreduced
to powder
Figure 6 Decomposers such as fungiand bacteria, as well as detrivores likeinsects and other scavengers, form acomplex community within a log.Eventually they break the log down,releasing the nutrients into the soil.
In this activity, you will explore leaf litter for signs of decomposersand the work that they do.
Materials: fallen rotting leaves; hand lens or dissectingmicroscope
1. Collect some fallen leaves that have been on the ground forsome time.
Skills Focus: conducting, recording, communicating, questioning, observing, predicting
TRY THIS: Leaf Debris
2. Observe the leaves under a hand lens or dissectingmicroscope. Look for any signs of decomposers.
A. What characteristics help you to identify a decomposer?
B. What kind of organism is mould? What role do moulds play ina forest ecosystem?
C. What other organisms can you find in your sample? Whatroles do they play in a forest ecosystem?
D. What do you think will eventually happen to the materialcontained in the leaves?
E. Select two abiotic factors and predict how they will affect theprocess occurring in the rotting leaves.
Some people have reactions to airborne microbesin decomposing material. Use caution if you haveallergies or asthma.
(a)
(b)
Unit A_Ch 02 4/1/08 11:24 AM Page 27
Unit A Sustainability of Ecosystems28 NEL
PredatorsPredation occurs when a consumer captures and eats another organism,such as when a predator like a mountain lion captures, kills, and eats a preyanimal such as a deer. It is common to think of predators as fast-movingcarnivores, but the term more broadly refers to any consumer in anecosystem. Organisms as varied as sea stars, centipedes, rabbits, and tigersare all predators (Figure 7).
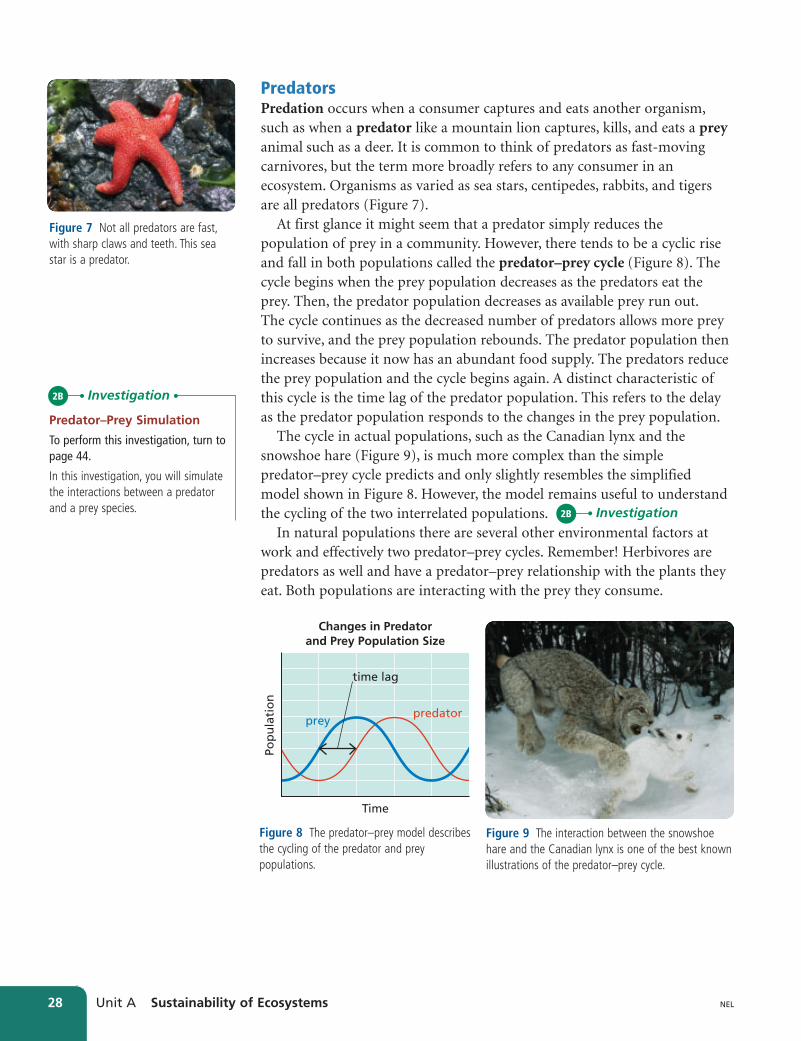
At first glance it might seem that a predator simply reduces thepopulation of prey in a community. However, there tends to be a cyclic riseand fall in both populations called the predator–prey cycle (Figure 8). Thecycle begins when the prey population decreases as the predators eat theprey. Then, the predator population decreases as available prey run out.The cycle continues as the decreased number of predators allows more preyto survive, and the prey population rebounds. The predator population thenincreases because it now has an abundant food supply. The predators reducethe prey population and the cycle begins again. A distinct characteristic ofthis cycle is the time lag of the predator population. This refers to the delayas the predator population responds to the changes in the prey population.
The cycle in actual populations, such as the Canadian lynx and thesnowshoe hare (Figure 9), is much more complex than the simplepredator–prey cycle predicts and only slightly resembles the simplifiedmodel shown in Figure 8. However, the model remains useful to understandthe cycling of the two interrelated populations.
In natural populations there are several other environmental factors atwork and effectively two predator–prey cycles. Remember! Herbivores arepredators as well and have a predator–prey relationship with the plants theyeat. Both populations are interacting with the prey they consume.
Figure 7 Not all predators are fast,with sharp claws and teeth. This seastar is a predator.
Time
Changes in Predatorand Prey Population Size
Pop
ula
tio
n
preypredator
time lag
Figure 8 The predator–prey model describesthe cycling of the predator and preypopulations.
Investigation2B
Predator–Prey Simulation
To perform this investigation, turn topage 44.
In this investigation, you will simulatethe interactions between a predatorand a prey species.
Investigation2B
Figure 9 The interaction between the snowshoehare and the Canadian lynx is one of the best knownillustrations of the predator–prey cycle.
Unit A_Ch 02 4/1/08 11:24 AM Page 28
2.2 CHECK YOUR Understanding
2.2 Ecological Roles and Relationships 29NEL
1. Compare the following terms. Give bothsimilarities and differences.(a) producer and consumer(b) omnivore and carnivore(c) carnivore and herbivore
2. The word “autotroph” literally means “self-feeder.” Why is this term appropriate inreference to producers?
3. The word “heterotroph” literally means “other-feeder.” Why is this term appropriate inreference to consumers?
4. How does a consumer differ from adecomposer?
5. What role do decomposers fill in an ecosystem?
6. List five producers and five consumers that livenear your home.
7. Compare a herbivore, a carnivore, and adetrivore. Indicate both similarities anddifferences.
8. In your own words, define “nutrient.”
9. Which of the following classifications is mostappropriate for bread mould and mushrooms?A. producersB. herbivoresC. carnivoresD. decomposers
10. Often farmers will plough the remains of theircrops into the soil. Explain why this is a betteroption than taking them away to burn.
11. Which of the following terms refers toorganisms that are able to causebiodegradation?A. herbivoresB. omnivoresC. carnivoresD. decomposers
12. The word “omnivore” is from two Latin words:omne meaning “all” or “everything” and voraremeaning “to devour.” What characteristic ofomnivores makes this an appropriate name forthem? In what ways is the name misleading?
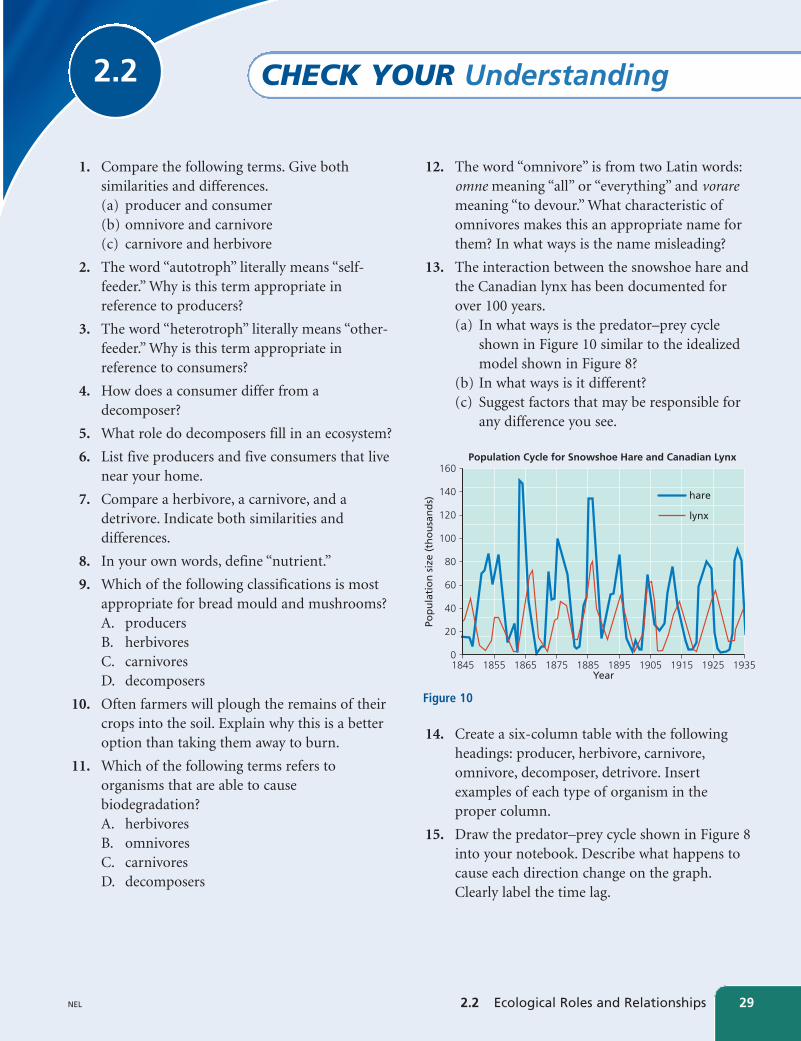
13. The interaction between the snowshoe hare andthe Canadian lynx has been documented forover 100 years.(a) In what ways is the predator–prey cycle
shown in Figure 10 similar to the idealizedmodel shown in Figure 8?
(b) In what ways is it different? (c) Suggest factors that may be responsible for
any difference you see.
14. Create a six-column table with the followingheadings: producer, herbivore, carnivore,omnivore, decomposer, detrivore. Insertexamples of each type of organism in theproper column.
15. Draw the predator–prey cycle shown in Figure 8into your notebook. Describe what happens tocause each direction change on the graph.Clearly label the time lag.
Population Cycle for Snowshoe Hare and Canadian Lynx
1845 1855 1865 1875 1885 1895 1905 1915 1925 19350
20
40
60
80
100
120
140
160
Year
hare
lynx
Pop
ula
tio
n s
ize
(th
ou
san
ds)
Figure 10
Unit A_Ch 02 4/1/08 11:24 AM Page 29

Unit A Sustainability of Ecosystems30 NEL
Symbiosis refers to any close relationship between two different species.Symbiotic relationships are the most specialized form of species interactionand each species often develops very specialized behaviours, life cycles, orstructures. There are three types of symbiotic relationships: mutualism,commensalism, and parasitism.
Mutualism is a relationship in which both species obtain some benefitfrom the interaction. For example, lichens are made up of a fungus and aphotosynthetic organism, usually a green algae. The fungus grows aroundthe algae, protecting the algae which then makes food for the fungusthrough the process of photosynthesis (Figure 1).
Commensalism is an interaction in which one organism benefits whilethe other is unaffected. Relationships of this type often are difficult to detectand the term is usually applied to situations where there is no obvious costor benefit to one of the organisms. For example, the relationship betweenbarnacles and grey whales is usually classified as commensalism. Thebarnacles live on the hide of the whale and feed passively from the waterpassing by, while there is no apparent benefit or harm to the grey whale(Figure 2).
Parasitism occurs when one organism lives and feeds on, or in, the body of another organism called the host. The parasite benefits from therelationship by getting its nutrients from the host. The host is harmed by the relationship, but the death of the host means the loss of a habitat for the parasite, so the host’s death usually comes slowly, if at all. From theperspective of any host, the parasite is harmful. The host is often starved for
2.3 Symbiosis
Figure 1 A fungus and a green algaeform a composite organism (a lichen)through symbiosis.
Figure 2 The whale barnacle has a commensal relationship with the grey whale.
LEARNING TIPPeriodically stop reading to recall whatyou have read. Ask yourself, “What aresome examples of mutualism,commensalism, and parasitism?”
Unit A_Ch 02 4/1/08 11:24 AM Page 30

2.3 Symbiosis 31NEL
nutrients, and may be unable to reproduce or carry out some basic lifefunctions. However, parasites can have a positive role, because they controlspecies’ population growth and prevent them from becoming too abundant.In this way, parasites ensure the survival of the strongest and healthiestmembers of a population. Nevertheless, parasites are responsible for manyserious diseases.
Biologists estimate that as many as 25 % of all animal species may beparasites. Parasites often have hooks or suckers for attaching to the host.In some parasitic species, only the reproductive system is well developed.Tapeworms that live in the intestine of their host can absorb nutrientsdirectly through their skin. Tapeworms, ticks, and fleas, as well as manybacteria and protozoa, are among the parasites that are responsible forwidespread disease among animals and humans (Figure 3).
Many plant parasites gain nutrients from a host plant instead ofproducing their own food through photosynthesis. Some plant parasitescannot photosynthesize at all, and must gain nutrients from a host plantinstead. Mistletoe is a common parasite of lodgepole pine and Douglas firtrees in British Columbia (Figure 4).
Parasites are not usually the primary cause of the death of the hostorganism. Instead, the host organism dies from a secondary causedue to its weakened condition. Parasites often have very complexlife cycles that help them to move to a new host body on a regularbasis.
Materials: research materials
1. Choose an internal parasite to study, such as a fluke, atapeworm, a roundworm, or a species of Plasmodium orTrypanosome.
Skills Focus: recording, communicating, researching
TRY THIS: Host Sweet Host
2. Research the methods by which it gets from one host body tothe next.
A. Draw the life cycle of your chosen parasite, indicating how itmoves between hosts.
B. How does the parasite get its nutrients?
C. Describe the effect of the parasite on the host’s body.
GOGO
To learn more aboutparasitism, go towww.science.nelson.com GOGO
Figure 3 The tapeworm is highly specialized for survival in themammalian digestive system.
STUDY TIPA summary answers the question,“What is the writer really saying?”Create a summary card for the threetypes of symbiosis. Ask yourself, “Whatare the main ideas in each paragraph?How would I explain them in my ownwords?”
www.science.nelson.com GOGO
Figure 4 Parasites like mistletoe can cause damage to trees in BritishColumbia’s forests.
Unit A_Ch 02 4/1/08 11:24 AM Page 31
CHECK YOUR Understanding2.3
1. What characteristics of parasitism would leadsome scientists to classify it as a form ofpredation? What characteristics of parasitismsuggest that it is not a form of predation?
2. Why is it often difficult to distinguish betweenmutualism and commensalism?
3. Give an example of a situation in which humansare involved in symbiotic relationships,including commensalism, parasitism, andmutualism.
4. Suggest several reasons why it is beneficial for aparasite to be small.
5. Create a graphic organizer to compare thedifferent types of symbiosis.
6. Which type of relationship is illustrated by eachof the following situations?(a) a small tick that slowly sucks the blood from
a black tail deer(b) a grizzly bear that leaves the bodies of
salmon as food for birds and smallmammals
(c) a bat that pollinates a plant as it feeds onnectar from a flower
7. In which of the following situations do bothorganisms benefit?A. predation B. parasitism C. mutualism D. commensalism
8. Streptococcus bacteria in the human mouthdigest sugars and produce lactic acid thatdissolves tooth enamel, causing cavities. Whichof the following types of interactions isrepresented by this example?A. predationB. parasitismC. mutualismD. commensalism
9. Corynebacterium are microscopic bacteria thatlive on the surface of the human eye. They feedoff the secretions and discarded cells and do notseem to affect the human they are living on.Which of the following types of interactions isrepresented by this example?A. predationB. parasitismC. mutualismD. commensalism
10. Helicobacter pylori is a bacteria that can thrive instomach acid, where they are known to causestomach ulcers. Which of the following types ofinteractions is represented by this example?A. predationB. parasitismC. mutualismD. commensalism
11. Biologists estimate that as many as 25 % of allliving things are parasites. Suggest severalcharacteristics that may allow them to be sosuccessful.
11. Many parasites have complex life cyclesinvolving two or more host species. How doesthis fact ensure the survival of the parasite?
12. Explain how parasites may actually improve thesurvival of many animal populations.
13. Some plant species have a mutualisticrelationship with a single species of pollinator.Explain how this might be an advantage to theplant. Explain how this might lead to theextinction of the plant species.
Unit A Sustainability of Ecosystems32 NEL
Unit A_Ch 02 4/1/08 11:24 AM Page 32

2.4 Trophic Levels and Energy Flow 33NEL
As one organism eats another, nutrients and energy move through theecosystem, passing from producers to consumers. The nutrients are recycledthrough the process of biodegradation but the energy only moves in onedirection through the community (Figure 1). This means that ecosystemsrequire a continuous source of energy, such as the Sun.
A trophic level describes the position of the organism in relation to theorder of nutrient and energy transfers in an ecosystem (Figure 2). Allproducers belong to the first trophic level. The herbivores that consume theproducers belong to the second trophic level, while carnivores occupy theupper trophic levels. Decomposers play a unique role and consume materialfrom all of the trophic levels, so they can be shown in all consumer trophiclevels.
2.4 Trophic Levels and Energy Flow
Energy from Sun
PRODUCERSPRIMARY
CONSUMERSSECONDARYCONSUMERS
TERTIARYCONSUMERS
Plants Herbivores Carnivores Top Carnivores
Ener
gy
Ener
gy
Ener
gy
Ener
gyEnergy
Energy
Energy
Energy
Energy
Detrivores and Decomposers
Figure 1 Nutrients cycle throughecosystems, but energy flows andeventually leaves. Energy must becontinually supplied to the ecosystem by the Sun.
Figure 2 In an ecosystem, all of theorganisms that consume the same typeof food belong to the same trophiclevel. Decomposers could be shown ateach consumer trophic level becausethey consume material from all trophiclevels.
To learn more about energyflowing and materials cycling,watch the animation atwww.science.nelson.com
To test your knowledge abouttrophic levels, go towww.science.nelson.com
Unit A_Ch 02 4/1/08 11:30 AM Page 33
Unit A Sustainability of Ecosystems34 NEL
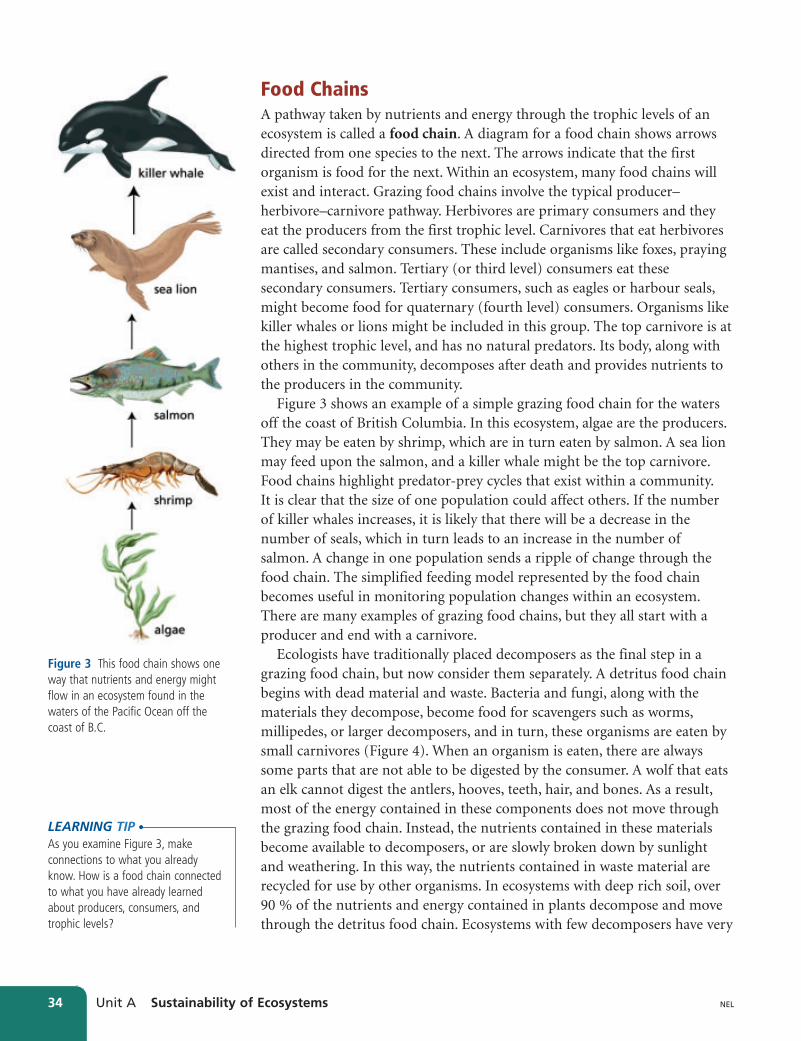
Food ChainsA pathway taken by nutrients and energy through the trophic levels of anecosystem is called a food chain. A diagram for a food chain shows arrowsdirected from one species to the next. The arrows indicate that the firstorganism is food for the next. Within an ecosystem, many food chains willexist and interact. Grazing food chains involve the typical producer–herbivore–carnivore pathway. Herbivores are primary consumers and theyeat the producers from the first trophic level. Carnivores that eat herbivoresare called secondary consumers. These include organisms like foxes, prayingmantises, and salmon. Tertiary (or third level) consumers eat thesesecondary consumers. Tertiary consumers, such as eagles or harbour seals,might become food for quaternary (fourth level) consumers. Organisms likekiller whales or lions might be included in this group. The top carnivore is atthe highest trophic level, and has no natural predators. Its body, along withothers in the community, decomposes after death and provides nutrients tothe producers in the community.
Figure 3 shows an example of a simple grazing food chain for the watersoff the coast of British Columbia. In this ecosystem, algae are the producers.They may be eaten by shrimp, which are in turn eaten by salmon. A sea lionmay feed upon the salmon, and a killer whale might be the top carnivore.Food chains highlight predator-prey cycles that exist within a community.It is clear that the size of one population could affect others. If the numberof killer whales increases, it is likely that there will be a decrease in thenumber of seals, which in turn leads to an increase in the number ofsalmon. A change in one population sends a ripple of change through thefood chain. The simplified feeding model represented by the food chainbecomes useful in monitoring population changes within an ecosystem.There are many examples of grazing food chains, but they all start with aproducer and end with a carnivore.
Ecologists have traditionally placed decomposers as the final step in agrazing food chain, but now consider them separately. A detritus food chainbegins with dead material and waste. Bacteria and fungi, along with thematerials they decompose, become food for scavengers such as worms,millipedes, or larger decomposers, and in turn, these organisms are eaten bysmall carnivores (Figure 4). When an organism is eaten, there are alwayssome parts that are not able to be digested by the consumer. A wolf that eatsan elk cannot digest the antlers, hooves, teeth, hair, and bones. As a result,most of the energy contained in these components does not move throughthe grazing food chain. Instead, the nutrients contained in these materialsbecome available to decomposers, or are slowly broken down by sunlightand weathering. In this way, the nutrients contained in waste material arerecycled for use by other organisms. In ecosystems with deep rich soil, over90 % of the nutrients and energy contained in plants decompose and movethrough the detritus food chain. Ecosystems with few decomposers have very
Figure 3 This food chain shows oneway that nutrients and energy mightflow in an ecosystem found in thewaters of the Pacific Ocean off the coast of B.C.
LEARNING TIPAs you examine Figure 3, makeconnections to what you alreadyknow. How is a food chain connectedto what you have already learnedabout producers, consumers, andtrophic levels?
Unit A_Ch 02 4/1/08 11:30 AM Page 34

2.4 Trophic Levels and Energy Flow 35NEL
little decay. As a result, the soil tends to be thin and low in nutrients. Thecondition of the soil is important in determining the types of producers thatcan grow, and therefore also affects the types of communities that candevelop.
The detritus food chain is important in another way as well. Scavengers,such as vultures, prevent the spread of disease as they feed on the decayingbodies of recently killed animals. In this way, they help to maintain thehealth of plant and animal populations within the ecosystem. The grazingand detritus food chains are closely linked because small carnivores likeshrews and raccoons are often part of both energy pathways.
Explore the decomposers and detrivores in a rotting log.
Materials: gloves, safety goggles, tools (such as screwdriver,pliers, hammer), newspaper or large garbage bag, large plasticbasin, newly collected rotting log, several small dishes or jars,magnifying glass or hand lens, field guides
1. Collect a section of rotting log with as much moss, fungus,and decay as possible.
2. Put on gloves and safety goggles. Place your log section in alarge plastic basin on newspaper or a large garbage bag.
3. Use your tools to carefully pry open the log.
4. Place any organisms you find in several small dishes or jars forcloser observation.
A. Use a magnifying glass or hand lens and field guide toidentify your organisms. If you cannot identify them, carefullydescribe them.
B. Which components that you observed are parts of the logecosystem and which components are parts of the logcommunity?
C. Describe one organism–organism interaction you observed.
D. Describe one organism–environment interaction you observed.
E. Draw one food chain that occurs within the community thatlives inside the rotting log.
Skills Focus: questioning, observing, identifying, concluding, recording, communicating
TRY THIS: Exploring a Detrivore Microhabitat
Be careful of centipedes; they are capable ofinflicting a painful bite. Wear gloves when collectingthe log.
Figure 4 The detritus food chain makes the nutrients in dead organisms and waste available to other organisms.
Unit A_Ch 02 4/1/08 11:30 AM Page 35
Unit A Sustainability of Ecosystems36 NEL
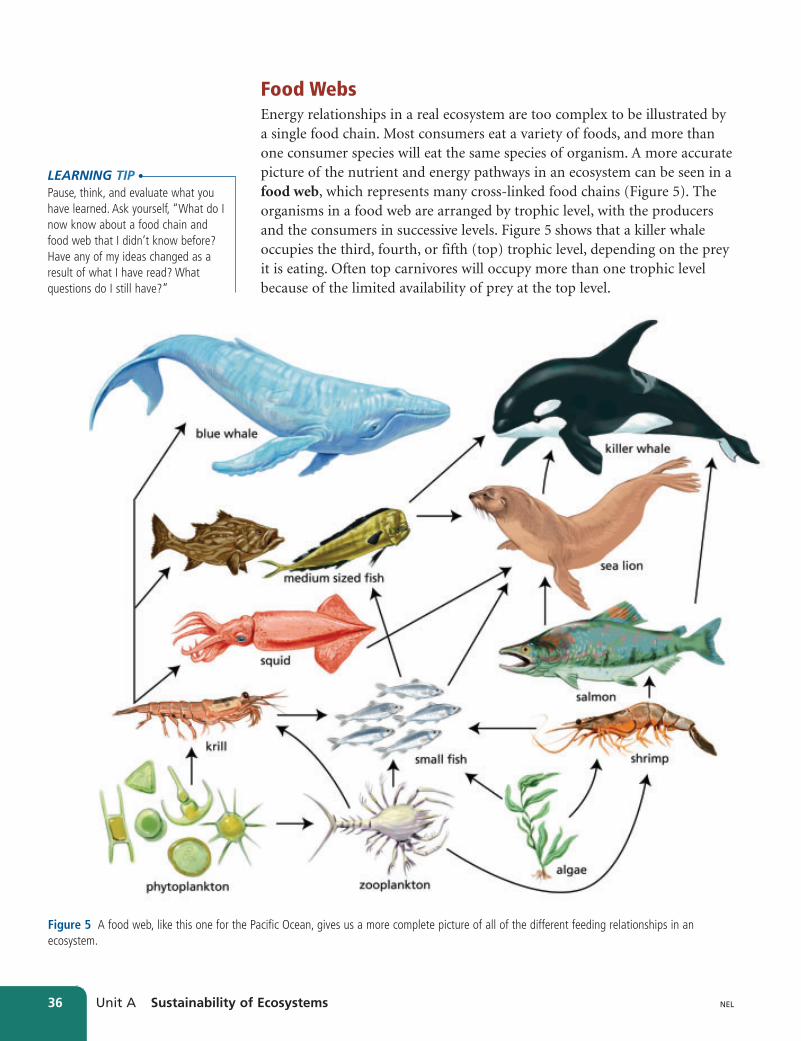
Food WebsEnergy relationships in a real ecosystem are too complex to be illustrated bya single food chain. Most consumers eat a variety of foods, and more thanone consumer species will eat the same species of organism. A more accuratepicture of the nutrient and energy pathways in an ecosystem can be seen in afood web, which represents many cross-linked food chains (Figure 5). Theorganisms in a food web are arranged by trophic level, with the producersand the consumers in successive levels. Figure 5 shows that a killer whaleoccupies the third, fourth, or fifth (top) trophic level, depending on the preyit is eating. Often top carnivores will occupy more than one trophic levelbecause of the limited availability of prey at the top level.
Figure 5 A food web, like this one for the Pacific Ocean, gives us a more complete picture of all of the different feeding relationships in anecosystem.
LEARNING TIPPause, think, and evaluate what youhave learned. Ask yourself, “What do Inow know about a food chain andfood web that I didn’t know before?Have any of my ideas changed as aresult of what I have read? Whatquestions do I still have?”
Unit A_Ch 02 4/1/08 11:30 AM Page 36

2.4 CHECK YOUR Understanding
2.4 Trophic Levels and Energy Flow 37NEL
1. Why is sunlight essential to most food chainsand food webs?
2. Explain the term “trophic level” in your ownwords.
3. Define and give three examples of a topcarnivore.
4. Contrast food webs and food chains.
5. Energy flows through two different food chainsin an ecosystem: grazing and detritus foodchains. Describe each food chain. How doesenergy enter and leave each food chain?
6. Consider the food chain shown in Figure 6.
(a) How would a decline in the number of frogsaffect each of the other organisms in thisfood chain?
(b) Redraw this food chain with the addition ofbacteria, in order to show the role ofdecomposers in this community.
7. Why is energy flow in an ecosystem considereda one-way process?
8. (a) What type of food is eaten by a consumer inthe second trophic level?
(b) What type of food is eaten by a consumer inthe third trophic level?
9. Is it possible for an organism to belong to morethan one trophic level? Explain, using anexample and description.
10. In your notebook, sketch a food web containingat least six organisms. Write labels to representthe organisms. Complete the food web byconnecting the organisms with arrows.
11. What is meant by the statement “nutrients cycle,but energy flows”?
12. Use the food web shown in Figure 7 to answerthe following questions:(a) Which organisms are the top carnivores in
this food web? (b) Which organisms are the producers in this
food web?(c) If the population of grasshoppers was
eliminated from the area, what organismswould lose one of their food sources?
(d) Which organisms in the food web could beclassified as primary consumers? Whichorganisms in the food web could beclassified as secondary consumers?
grass insect frog snake
Figure 6
marsh vegetation (includes many speciesof grasses, algae, etc.)
mosquito
grasshoppervolesnail
ratsnow goose herring salmon
bald eaglered-tailed
hawk harbour seal
killer whale
Figure 7
Unit A_Ch 02 4/1/08 11:31 AM Page 37
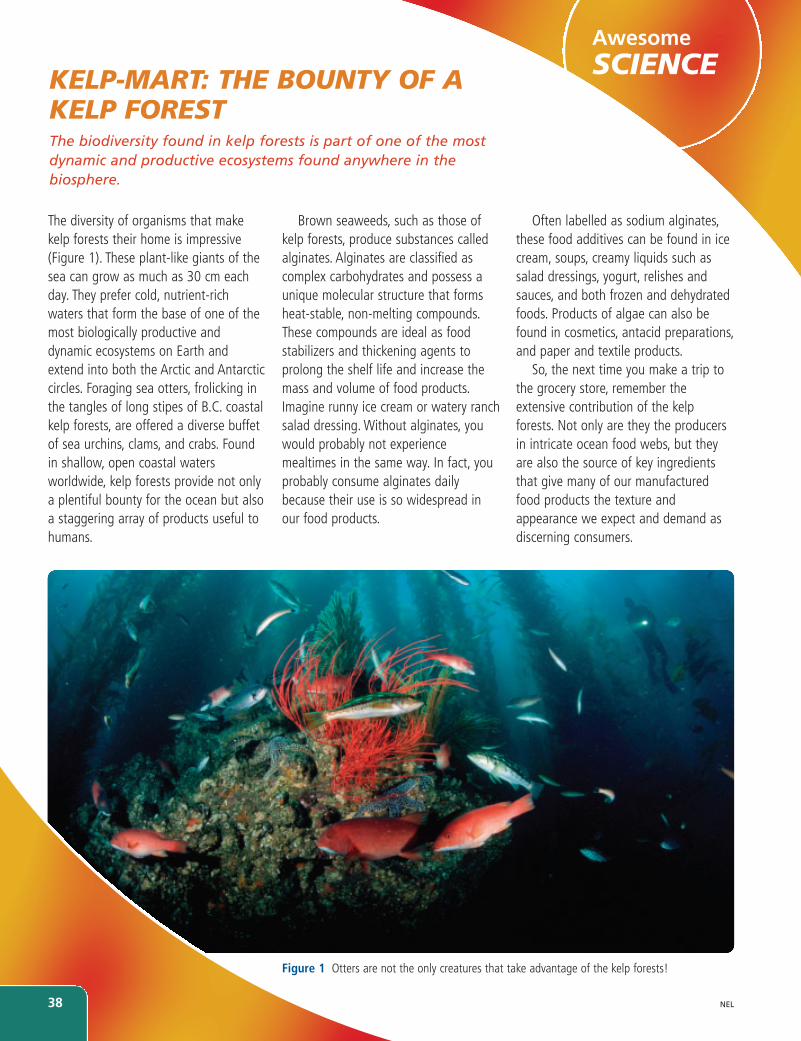
KELP-MART: THE BOUNTY OF AKELP FORESTThe biodiversity found in kelp forests is part of one of the mostdynamic and productive ecosystems found anywhere in thebiosphere.
Often labelled as sodium alginates,these food additives can be found in icecream, soups, creamy liquids such assalad dressings, yogurt, relishes andsauces, and both frozen and dehydratedfoods. Products of algae can also befound in cosmetics, antacid preparations,and paper and textile products.
So, the next time you make a trip tothe grocery store, remember theextensive contribution of the kelpforests. Not only are they the producersin intricate ocean food webs, but theyare also the source of key ingredientsthat give many of our manufacturedfood products the texture andappearance we expect and demand asdiscerning consumers.
Brown seaweeds, such as those ofkelp forests, produce substances calledalginates. Alginates are classified ascomplex carbohydrates and possess aunique molecular structure that formsheat-stable, non-melting compounds.These compounds are ideal as foodstabilizers and thickening agents toprolong the shelf life and increase themass and volume of food products.Imagine runny ice cream or watery ranchsalad dressing. Without alginates, youwould probably not experiencemealtimes in the same way. In fact, youprobably consume alginates dailybecause their use is so widespread inour food products.
The diversity of organisms that makekelp forests their home is impressive(Figure 1). These plant-like giants of thesea can grow as much as 30 cm eachday. They prefer cold, nutrient-richwaters that form the base of one of themost biologically productive anddynamic ecosystems on Earth andextend into both the Arctic and Antarcticcircles. Foraging sea otters, frolicking inthe tangles of long stipes of B.C. coastalkelp forests, are offered a diverse buffetof sea urchins, clams, and crabs. Foundin shallow, open coastal watersworldwide, kelp forests provide not onlya plentiful bounty for the ocean but alsoa staggering array of products useful tohumans.
AwesomeSCIENCE
38 NEL
Figure 1 Otters are not the only creatures that take advantage of the kelp forests!
Unit A_Ch 02 4/1/08 11:31 AM Page 38
2.5 Ecological Pyramids 39NEL
Often, the pathway of energy through an ecosystem is illustrated by anecological pyramid, also called a food pyramid. Ecologists use three basictypes of pyramids: a pyramid of energy, a pyramid of numbers, and apyramid of biomass.
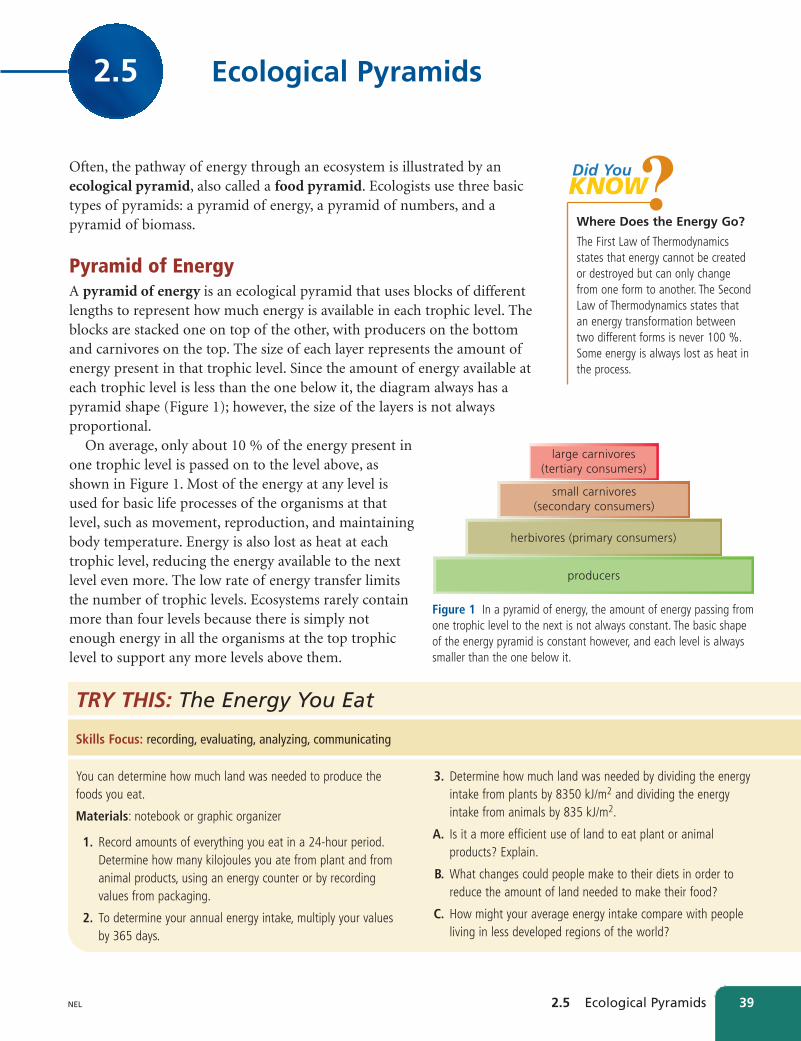
Pyramid of EnergyA pyramid of energy is an ecological pyramid that uses blocks of differentlengths to represent how much energy is available in each trophic level. Theblocks are stacked one on top of the other, with producers on the bottomand carnivores on the top. The size of each layer represents the amount ofenergy present in that trophic level. Since the amount of energy available ateach trophic level is less than the one below it, the diagram always has apyramid shape (Figure 1); however, the size of the layers is not alwaysproportional.
On average, only about 10 % of the energy present inone trophic level is passed on to the level above, asshown in Figure 1. Most of the energy at any level isused for basic life processes of the organisms at thatlevel, such as movement, reproduction, and maintainingbody temperature. Energy is also lost as heat at eachtrophic level, reducing the energy available to the nextlevel even more. The low rate of energy transfer limitsthe number of trophic levels. Ecosystems rarely containmore than four levels because there is simply notenough energy in all the organisms at the top trophiclevel to support any more levels above them.
2.5 Ecological Pyramids
Where Does the Energy Go?
The First Law of Thermodynamicsstates that energy cannot be createdor destroyed but can only changefrom one form to another. The SecondLaw of Thermodynamics states thatan energy transformation betweentwo different forms is never 100 %.Some energy is always lost as heat inthe process.
?KNOWDid You
small carnivores(secondary consumers)
large carnivores(tertiary consumers)
herbivores (primary consumers)
producers
Figure 1 In a pyramid of energy, the amount of energy passing fromone trophic level to the next is not always constant. The basic shapeof the energy pyramid is constant however, and each level is alwayssmaller than the one below it.
You can determine how much land was needed to produce thefoods you eat.
Materials: notebook or graphic organizer
1. Record amounts of everything you eat in a 24-hour period.Determine how many kilojoules you ate from plant and fromanimal products, using an energy counter or by recordingvalues from packaging.
2. To determine your annual energy intake, multiply your valuesby 365 days.
Skills Focus: recording, evaluating, analyzing, communicating
TRY THIS: The Energy You Eat
3. Determine how much land was needed by dividing the energyintake from plants by 8350 kJ/m2 and dividing the energyintake from animals by 835 kJ/m2.
A. Is it a more efficient use of land to eat plant or animalproducts? Explain.
B. What changes could people make to their diets in order toreduce the amount of land needed to make their food?
C. How might your average energy intake compare with peopleliving in less developed regions of the world?
Unit A_Ch 02 4/1/08 11:31 AM Page 39
Unit A Sustainability of Ecosystems40 NEL
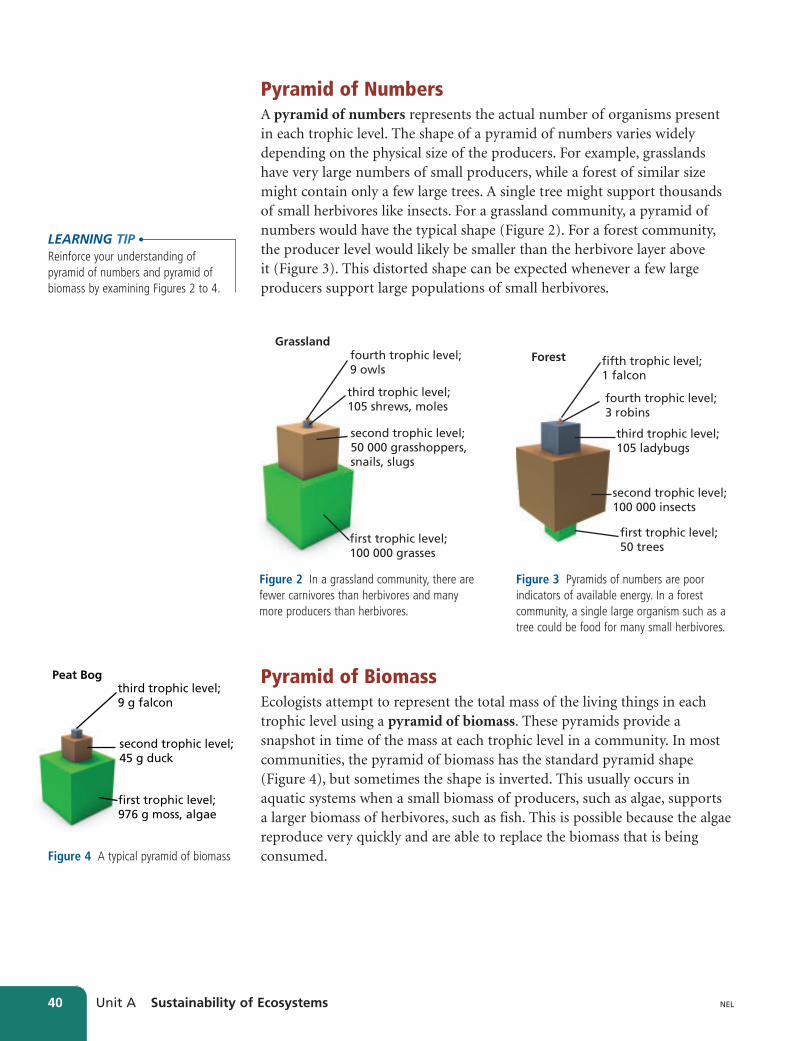
Pyramid of NumbersA pyramid of numbers represents the actual number of organisms presentin each trophic level. The shape of a pyramid of numbers varies widelydepending on the physical size of the producers. For example, grasslandshave very large numbers of small producers, while a forest of similar sizemight contain only a few large trees. A single tree might support thousandsof small herbivores like insects. For a grassland community, a pyramid ofnumbers would have the typical shape (Figure 2). For a forest community,the producer level would likely be smaller than the herbivore layer above it (Figure 3). This distorted shape can be expected whenever a few largeproducers support large populations of small herbivores.
Grasslandfourth trophic level;9 owls
third trophic level;105 shrews, moles
second trophic level;50 000 grasshoppers, snails, slugs
first trophic level;100 000 grasses
Figure 2 In a grassland community, there arefewer carnivores than herbivores and manymore producers than herbivores.
Forest fifth trophic level;1 falcon
fourth trophic level;3 robins
third trophic level;105 ladybugs
second trophic level;100 000 insects
first trophic level;50 trees
Figure 3 Pyramids of numbers are poorindicators of available energy. In a forestcommunity, a single large organism such as atree could be food for many small herbivores.
Pyramid of BiomassEcologists attempt to represent the total mass of the living things in eachtrophic level using a pyramid of biomass. These pyramids provide asnapshot in time of the mass at each trophic level in a community. In mostcommunities, the pyramid of biomass has the standard pyramid shape(Figure 4), but sometimes the shape is inverted. This usually occurs inaquatic systems when a small biomass of producers, such as algae, supports a larger biomass of herbivores, such as fish. This is possible because the algaereproduce very quickly and are able to replace the biomass that is beingconsumed.
Peat Bogthird trophic level;9 g falcon
second trophic level;45 g duck
first trophic level;976 g moss, algae
Figure 4 A typical pyramid of biomass
LEARNING TIPReinforce your understanding ofpyramid of numbers and pyramid ofbiomass by examining Figures 2 to 4.
Unit A_Ch 02 4/1/08 11:31 AM Page 40
2.5 CHECK YOUR Understanding
2.5 Ecological Pyramids 41NEL
1. Why are producers essential to a stableecosystem?
2. List two factors that are responsible for thesmall percent of energy that passes from onetrophic level to the next.
3. Why can more herbivores than carnivores live inequal-sized ecosystems?
4. On average, how much energy is available toorganisms in the third trophic level if 5000 kJwere available at the first trophic level?A. 5 kJB. 50 kJC. 500 kJD. 5000 kJ
5. Describe the effects of removing all of theherbivores from an ecosystem. Which organismswould be affected and how?
6. Explain why ecosystems usually contain only afew trophic levels.
7. Why do energy pyramids have the specific shapethat they do?
8. Explain the similarities and differences betweenan ecological pyramid of energy, a pyramid ofbiomass, and a pyramid of numbers for aconiferous forest.
9. You have the option of choosing between a beefsteak or a plate of beans and rice. Both mealsprovide you with 1000 kJ of energy. How willyour choice affect the amount of energyrequired from the ecosystem?
10. Create a concept map that shows the path ofenergy in an ecosystem. Include the followingterms in your diagram: herbivore, producer,carnivore, detrivore, trophic level, food web,food chain, and any additional terms yourequire.
11. Why does energy only flow in one generaldirection (from producer to consumer) in anecosystem?
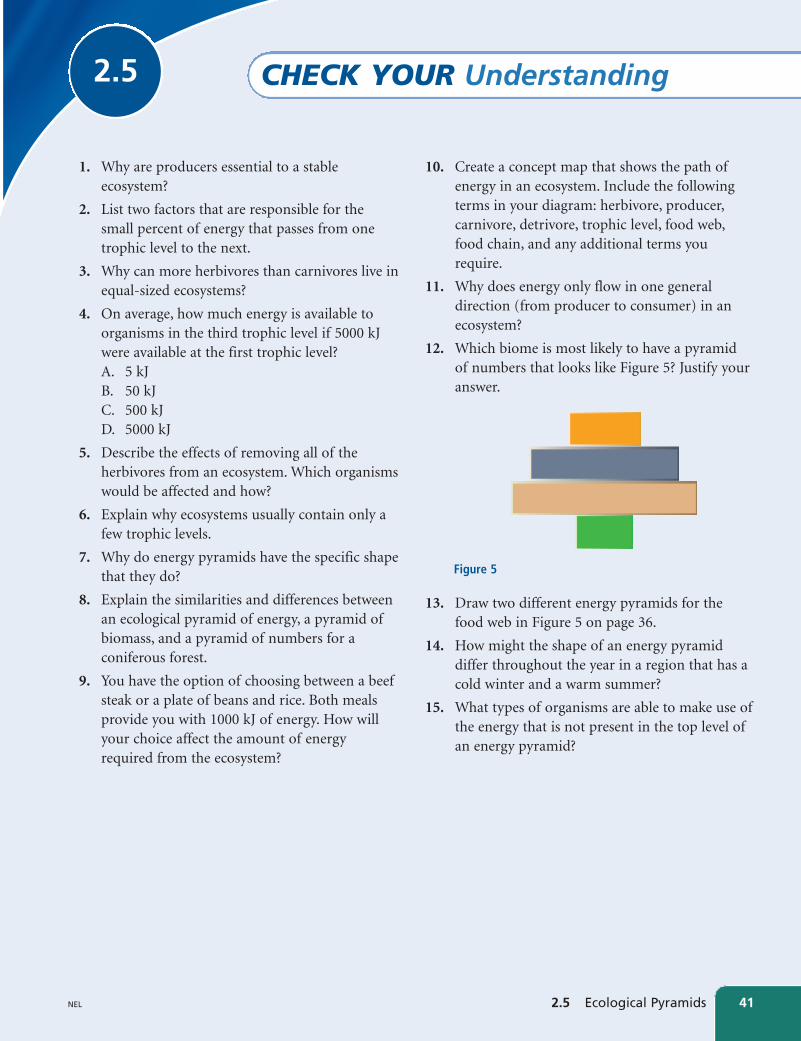
12. Which biome is most likely to have a pyramidof numbers that looks like Figure 5? Justify youranswer.
13. Draw two different energy pyramids for thefood web in Figure 5 on page 36.
14. How might the shape of an energy pyramiddiffer throughout the year in a region that has acold winter and a warm summer?
15. What types of organisms are able to make use ofthe energy that is not present in the top level ofan energy pyramid?
Figure 5
Unit A_Ch 02 4/1/08 11:31 AM Page 41

Unit A Sustainability of Ecosystems42 NEL
The Effect of Abiotic Factorson a Yeast PopulationIn this investigation, you will observe the effect ofchanges in abiotic factors on the growth of a yeastpopulation. Yeast is a type of fungus and is often usedin the production of bread.
QuestionWhat are the optimal conditions for the growth ofyeast?
PredictionPredict what conditions of temperature, pH, andnutrient availability will be best for the growth ofyeast.
Experimental DesignIn this investigation, you will observe evidence ofyeast growth under different experimentalconditions. The population’s cellular activity will bemeasured under different abiotic conditions.
Materials
• 8 large clean test tubes labelled #1–#8
• 25 mL graduated cylinder
• 3 600 mL beakers
• thermometer
• measuring spoons
• active dry yeast
• sugar
• vinegar (acid)
• ammonia solution (base)
• pH paper
• ice
• safety goggles
ProcedurePart 1: The Effect of Temperature on YeastRespiration
1. Read through the Procedure and copy the tablesto record your observations in each part.Remember to give your tables a title.
2. Put on your safety goggles. Prepare threeseparate water baths in the 600 mL beakers: onebath at 0 °C (containing ice water), one bath at50 °C, and one bath near 100 °C.
3. Measure 2.5 mL of yeast and 2.5 mL of sugarinto three separate test tubes labelled #1, #2, and#3. Add 10 mL of room-temperature water toeach of the test tubes. Place one test tube intoeach of the three water baths.
4. Leave the test tubes in the water baths for 15 min. Record your observations in Table 1.While you are waiting, set up Part 2 of theInvestigation.
Investigation2A
QuestioningHypothesizingPredictingPlanning
ConductingRecordingAnalyzing
EvaluatingSynthesizingCommunicating
INQUIRY SKILLS
Acids and bases, even weak ones, can causeirritation to skin. If any acid or base solution isspilled, clean it up immediately. If any solution fallson skin, flush it well with running water. Report anyinstances to your teacher.
Test tube Temperature Observation
#1 0 ºC
#2 50 ºC
#3 100 ºC
Table 1
Unit A_Ch 02 4/1/08 11:31 AM Page 42

Chapter 2 Investigation 43NEL
Part 2: The Effect of pH on Yeast Respiration5. Measure 2.5 mL of yeast and 2.5 mL of sugar
into another set of test tubes labelled #4, #5, and#6. Add 10 mL of water to test tube #4. Add 10 mL of acid solution to test tube #5. Add 10 mL of base solution to test tube #6.
6. Use the pH paper to determine the approximatepH of each solution. Place all three test tubes inthe 50 °C water bath.
7. Leave the test tubes in the water baths for 15 min. Record your observations in Table 2.While you are waiting, set up Part 3 of theInvestigation.
Part 3: The Effect of Nutrient Availability onYeast Respiration
8. Measure 2.5 mL of yeast into two test tubeslabelled #7 and #8. Add 2.5 mL sugar to testtube #7. Do not add any sugar to test tube #8.Add 10 mL of room-temperature water to eachtest tube. Place both test tubes in the 50 ºCwater bath.
9. Leave the test tubes in the water baths for 15 min. Record your observations in Table 3.
ConclusionComplete the following items to answer the questionposed at the beginning of the investigation.
Analysis(a) What temperature was most suitable for the
growth of yeast? Suggest a reason for thisconclusion.
(b) What pH was the most suitable for the growthof yeast? Suggest a reason for this conclusion.
(c) What effect did the presence of sugar have onthe rate of yeast growth?
Evaluation(d) Did your observations support your prediction?
Explain.
(e) Why was it important that all of the materialsadded to each test tube were accuratelymeasured?
(f) Three test tubes containing water and sugarwere placed in the 50 °C water bath. Did they allproduce the exact same result? Explain anydifferences.
(g) For each of the three parts of this experiment,list the independent variable.
(h) Describe what measures were taken to ensurethat each part of this experiment wascontrolled.
Synthesis(i) How does this investigation show that biotic
and abiotic factors are interacting?
(j) List three additional abiotic factors that youthink might affect the growth rate of yeast.
(k) How can an understanding of abiotic factorsassist farmers in finding the best farmingtechniques?
(l) Use the term “limiting factor” to summarize theobserved effects of temperature, pH, andnutrient availability in this investigation.
Test tube pH Observation
#4
#5
#6
Table 2
Test tube Nutrient Observation
#7 Sugar present
#8 Sugar absent
Table 3
Unit A_Ch 02 4/1/08 11:31 AM Page 43

Unit A Sustainability of Ecosystems44 NEL
Predator–Prey SimulationEcologists often use models and simulations to helpunderstand natural processes. In this investigation,you will simulate a predator–prey relationshipbetween two species: the great horned owl and thewhite-footed deer mouse (Figure 1).
QuestionCan a predator–prey relationship effectively regulatethe size of both species’ populations?
PredictionPredict what pattern will describe the changes in sizeof the predator and prey populations.
Experimental DesignIn this investigation, you will use models of predatorsand prey to simulate the predator–prey cycleresponsible for population regulation.
Materials
• metre stick
• 20 10 cm � 10 cm cardboard squares (predator)
• 200 3 cm � 3 cm paper squares (prey)
• masking tape
• graph paper
• 2 coloured pencils
Procedure1. Use masking tape to mark out a 1 m � 1 m
boundary on a flat tabletop or floor. You mayalso use a flat desktop.
2. Scatter five prey cards throughout the area.Hold a predator card at least 10 cm above thesurface and drop it in the marked area, trying tocapture as many prey as possible.
3. If the predator card touches at least three preycards, remove those prey cards. They have beeneaten.
4. If the predator card does not touch at least threeprey cards, remove the predator card and leavethe prey cards. The predator has starved.
5. If at any time the number of prey or predatorsdrops to zero, replace them with five prey or onepredator card as needed.
6. Copy Table 1 in your notebook. Leave room foradditional rows, and give it a title. Record thenumber of surviving prey and survivingpredators. This represents one generation. Youwill need to record 20 generations.
7. Double the population of surviving predatorsand surviving prey. They have reproduced.
8. Scatter enough prey cards to represent the newpopulation of the area.
Investigation2B
QuestioningHypothesizingPredictingPlanning
ConductingRecordingAnalyzing
EvaluatingSynthesizingCommunicating
INQUIRY SKILLS
Figure 1
Unit A_Ch 02 4/1/08 11:31 AM Page 44

Chapter 2 Investigation 45NEL
Table 1
9. Continue to repeat Steps 3 through 8 for a totalof 20 generations.
10. Graph the number of prey and predatorspresent at the beginning of each generation. Usea scale of 0–200 for prey and 0–20 for predators.Include this as part of your results.
ConclusionComplete the following items to answer the questionposed at the beginning of the investigation.
Analysis(a) Which population showed the first increase in
size?
(b) Which population showed the first decrease insize?
(c) What maximum predator population wasreached in your simulation?
(d) What maximum prey population was reached inyour simulation?
Evaluation(e) What factors limit the size of the owl (predator)
population?
(f) What factors limit the size of the mouse (prey)population?
(g) Use the results of your simulation to describethe principle of time lag.
Synthesis(h) Explain how your results might change if the
area were larger or smaller.
(i) Copy the idealized predator–prey cycle shownin Figure 7 in your notebook. What aspects ofyour simulation would cause yourpredator–prey cycle to differ from the idealizedmodel?
(j) What factors cause predator–prey cycles amongactual populations to differ from the idealizedpredator–prey cycle?
(k) Explain how the owl population could bereplenished even when all of the owls presenthave starved to death.
Generation Initial prey Prey caught Surviving prey Initial predators Surviving predators
1 5 1
2
3
4
Time
Changes in Predatorand Prey Population Size
Pop
ula
tio
n
preypredator
time lag
Figure 7
Unit A_Ch 02 4/1/08 11:31 AM Page 45

Interactions in Ecosystems
Key IdeasLiving things are connected to each other in complexinterrelationships.
• Living things interact on several levels of organization: organism,population, community, ecosystem, and biosphere.
• A community of organisms and the non-living environment make up anecosystem.
• Organisms can be producers, consumers, herbivores, carnivores, ordecomposers in ecosystems.
• Predators and prey control each other’s population size as they gothrough cycles in their relationship.
• Symbiosis describes complex relationships occurring between two species.The types of symbiotic relationships are mutualism, commensalism, andparasitism.
Biotic and abiotic factors are responsible for shaping a community ofliving things.
• Relationships between organisms and their environment include bothliving (biotic) and non-living (abiotic) components.
• Abiotic factors determine the types of organisms that can exist in acommunity and the characteristics of the environment.
• Biotic factors change continually in response to each other.
2CHAPTER
Review
Vocabulary
ecology, p. 21
organism, p. 21
habitat, p. 21
population, p. 21
community, p. 22
ecosystem, p. 22
biosphere, p. 22
biotic factors, p. 22
abiotic factors, p. 22
dynamic equilibrium, p. 23
limiting factor, p. 23
nutrients, p. 25
producer, p. 25
autotroph, p. 25
phytoplankton, p. 25
consumer, p. 26
heterotroph, p. 26
herbivore, p. 26
primary consumer, p. 26
zooplankton, p. 26
carnivore, p. 26
omnivore, p. 26
detrivore, p. 27
decomposer, p. 27
biodegradation, p. 27
predation, p. 28
predator, p. 28
prey, p. 28
predator–prey cycle, p. 28
symbiosis, p. 30
Unit A Sustainability of Ecosystems46 NEL
Unit A_Ch 02 4/1/08 11:31 AM Page 46

Nutrients cycle within ecosystems.
• Food chains and food webs show how nutrients cycle through ecosystems.
• Each type of organism is found at a trophic level in a food chain or web.
• Decomposers play an important role in recycling nutrients.
Energy flows through ecosystems.
• The primary source of energy for living things is the Sun.
• Producers are able to convert solar energy into a form that living thingscan use.
• Energy passes from producers to herbivores to carnivores.
• Most terrestrial ecosystems have only three or four trophic levels becauseenergy transfer is inefficient.
• Only about 10 % of the energy at one trophic level is transferred to thenext trophic level.
Chapter 2 Review 47NEL
mutualism, p. 30
commensalism, p. 30
parasitism, p. 30
host, p. 30
parasite, p. 30
trophic level, p. 33
food chain, p. 34
food web, p. 36
ecological pyramid, p. 39
food pyramid, p. 39
pyramid of energy, p. 39
pyramid of numbers, p. 40
pyramid of biomass, p. 40
small carnivores(secondary consumers)
large carnivores(tertiary consumers)
herbivores (primary consumers)
producers
Unit A_Ch 02 4/1/08 11:32 AM Page 47

Unit A Sustainability of Ecosystems48 NEL
Review Key Ideas and Vocabulary 1. Match the term on the left with the correct
definition on the right.
2. Explain the term “interconnectedness” as itapplies to ecology.
3. Identify each of the following as a population,community, or ecosystem:(a) a pod of killer whales (b) a pack of wolves in a forest (c) all of the living and non-living things in a
pond(d) all of the organisms living in a decomposing
log
4. List five abiotic factors that affect life interrestrial ecosystems.
5. Describe five ecosystems of differing size.
6. What is the relationship between the firsttrophic level and a primary consumer?
7. Which of the following terms does not representa level within the biosphere that is studied byecologists?A. cell B. ecosystemC. populationD. community
8. Which of the following processes could producethe energy necessary to support a community oforganisms in a deep cave in the total absence ofsunlight?A. photosynthesisB. biodegradationC. decompositionD. chemosynthesis
Use What You’ve Learned9. A student conducts an experiment to measure
the effects of pH on the growth of bread mould(Rhizopus nigricans). The student moistenedslices of bread with solutions of three differentpH levels. The bread slices were incubated at aconstant temperature and observed for a periodof three days as recorded in Table 1.
(a) Graph the results of the experiment usingthree line graphs on the same set of axes.
(b) To which pH is the bread mould bestadapted?
(c) What was the purpose of keeping thetemperature constant throughout theexperiment?
(d) List three other factors that must be keptconstant in order to ensure that theexperimental results are valid.
(e) List three other abiotic factors that mightaffect the growth of bread mould.
(f) What would be an appropriate control forthis experiment?
Many of these questions are in the style of the Science 10 Provincial Exam.The following icons indicate an exam-style question and its cognitive level.
Knowledge Understanding and Application Higher Mental ProcessesK HMPU
K
K
Table 1
Day Number of mould colonies
pH � 4.0 pH � 6.0 pH � 8.0
Start 0 0 0
1 0 7 1
2 1 15 3
3 2 27 3
Term Definition
(a) biosphere I. A community as well as the physicalenvironment
(b) community II. All of the ecosystems on Earth
(c) ecology III. All of the individual populations in aparticular area
(d) ecosystem IV. All of the organisms of one type thatinhabit a particular area
(e) habitat V. An individual life form of one specifictype
(f) organism VI. The place where an organism orpopulation lives
(g) population VII. The study of the interactions betweenorganisms and between theirenvironment
Unit A_Ch 02 4/1/08 11:32 AM Page 48

Chapter 2 Review 49NEL
10. Which of the following lists includes onlyabiotic factors?A. pH, height of trees, water temperature B. temperature, annual precipitation, rock type C. solar radiation, nutrient availability, number
of decomposersD. salt concentration, stream flow rate,
migration pattern of reindeer
11. Which of the following characteristicsdistinguishes decomposers from otherconsumers?A. the ability to produce foodB. their position within a grazing food chainC. the tendency to gain nutrition from dead
organismsD. the ability to chemically break down organic
compounds
12. Name and define four different categories ofconsumers. Give two examples of each.
Think Critically13. A scientist is interested in creating a
conservation strategy at the ecosystem level.Which of the following would she have toconsider for her strategy to be at the correctlevel?A. all regions of Earth where life existsB. all members of a single species in an areaC. all living and non-living things in an areaD. all members of all of the species in an area
14. What type of food do organisms in the secondtrophic level eat? What type of food doorganisms in the third trophic level eat?
15. Explain how changes in abiotic factors caninfluence the types of communities that developin an area.
16. List three different abiotic factors and describe away in which each of them has had a directimpact on your day so far.
17. Use the food chain shown in Figure 1 to answerthe questions.
(a) What level of the biosphere is representedby the food chain?
(b) Which of the organisms in the food chain isan autotroph?
(c) Which of the organisms would belong to apopulation with the least biomass?
(d) Which level contains the least energy?
18. Use your knowledge of ecological pyramids toconstruct an energy pyramid, biomass pyramid,and numbers pyramid for the food chain shownin Figure 1.
19. A wolf that eats an elk cannot digest the antlers,hooves, teeth, hair, and bones. What do thesematerials represent?A. matter available to omnivores B. energy available to herbivoresC. energy not available to carnivoresD. matter not available to decomposers
20. What effect would spraying insecticides to killbeetles have on the size of a hawk population inthe food chain shown in Figure 1? Explain yourreasoning.
Reflect on Your Learning21. Scientists study many different ecosystems.
Some are small and some are large. Explain howa puddle and a mountain range are both validecosystems. What are the similarities and whatare the differences between these ecosystems?
HMP
U
U
U
tree beetle spider mouse hawk
Figure 1
Visit the Quiz Centre atwww.science.nelson.com GOGO
Unit A_Ch 02 4/1/08 11:32 AM Page 49