chapter 12 transport - home - ntepa · 2016-07-01 · chapter 12: transportation era: proposed...
TRANSCRIPT
Chapter 12 Transport

Chapter 12: Transportation
ERA: Proposed Ranger 3 Deeps Underground Mine 12-i
CONTENTS
12.1 INTRODUCTION 12-1
12.2 STUDY SCOPE 12-1
12.3 TRANSPORT ROUTES 12-2
12.3.1 Existing Road Network 12-2
12.4 EXISTING ENVIRONMENT 12-4
12.4.1 Existing Land Use 12-4
12.4.2 Physical Environment 12-5
12.5 ASSESSMENT APPROACH 12-6
12.5.1 Environmental Assessment 12-6
12.5.1.1 Desktop Assessment 12-6
12.5.1.2 Species of Conservation Significance (Commonwealth and NT) 12-7
12.5.1.3 Ecologically Sensitive Areas 12-7
12.5.2 Risk Assessment Process 12-8
12.5.2.1 Risk Identification 12-9
12.5.3 Risk Analysis 12-10
12.5.3.1 Consequence Assessment 12-10
12.5.3.2 Likelihood of an Escalating Event 12-11
12.5.4 Risk Evaluation 12-14
12.5.5 Level of Uncertainty 12-14
12.5.6 Cumulative Impacts 12-15
12.5.7 Monitoring and Review 12-15
12.6 ROUTE CAPACITY IMPACT ASSESSMENT 12-15
12.6.1 Background Traffic Volume 12-15
12.6.2 Existing ERA Vehicle Traffic Volumes 12-17
12.6.3 Historical and Projected ERA Traffic 12-20
12.6.3.1 Change to Consignment Quantities 12-20
12.6.3.2 Change to Background Traffic 12-21
12.6.4 Potential Impact to Route Capacity 12-22
12.6.4.1 Construction Traffic Volume 12-22
12.6.4.2 Operational Traffic Volume 12-23
12.7 ASSESSMENT OF RISK 12-24
12.8 MITIGATION 12-27
12.8.1 Project Controls 12-27
12.8.1.1 Contractor Management System 12-28
12.8.1.2 Dangerous Goods Regulations and Code Compliance 12-28
12.8.1.3 National Heavy Vehicle Accreditation Scheme 12-29
12.8.1.4 Hazard Identification and Risk Management 12-29
12.8.1.5 Emergency Preparedness and Response 12-30
12.8.2 Controls Effectiveness 12-30
Chapter 12: Transportation
ERA: Proposed Ranger 3 Deeps Underground Mine 12-ii
12.8.2.1 Controls Compliance 12-31
12.8.2.2 Controls Reliability 12-31
12.9 SUMMARY 12-31
12.10 REFERENCES 12-33
FIGURES
Figure 12-1: Study area road sections 12-3
Figure 12-2: Predominant transport routes to the Ranger mine 12-4
Figure 12-3: Study area bioregions 12-5
Figure 12-4: 2012 average daily traffic volumes and Ranger mine contribution (%) 12-16
Figure 12-5: Historical and projected heavy and light vehicle trips to the Ranger mine 12-20
Figure 12-6: Cumulative risk rankings 12-25
TABLES
Table 12-1: Ecologically sensitive areas 12-8
Table 12-2: Key consumables and product 12-9
Table 12-3: Consequence descriptors 12-12
Table 12-4: Likelihood classification 12-13
Table 12-5: Consequence and risk ranking comparison 12-14
Table 12-6: 2012 average daily traffic volumes along each road section (round trips) 12-16
Table 12-7: 2012 existing ERA heavy vehicle traffic volumes 12-18
Table 12-8: Consumables transported, heavy vehicle type, capacity and current haulage routes 12-19
Table 12-9: Forecast consignments, transport quantities and annual movement frequency 12-21
Table 12-10: Projected daily averages in 2017 and expected cumulative contribution from Ranger (round trip) 12-22
Table 12-11: 2017 estimated hourly volumes and comparison to Austroads capacity guidelines 12-23
Table 12-12: Summary risk profile 12-24

Chapter 12: Transportation
ERA: Proposed Ranger 3 Deeps Underground Mine 12-1
12 TRANSPORTATION
12.1 INTRODUCTION
This chapter is based on the findings of the traffic impact assessment undertaken by
GHD Pty Ltd (Appendix 16) and discusses the traffic risk assessment method, relevant
transportation routes and traffic volumes. The chapter also discusses the outcomes of the
traffic risk assessment and the contribution of the Project to ERA's current transport risk
profile. These risks are discussed in consideration of potential impacts to the public and
receiving environment inclusive of listed threatened species and other Matters of National
Environmental Significance (MNES). The effectiveness of existing controls to mitigate
potential impacts on these values is discussed. In addition, the chapter discusses the
capacity of the road network to accommodate ERA traffic, inclusive of the Project.
The methods used to assess risks to the environment; public safety and the capacity of the
road network to accommodate the Project were selected in consideration of the EIS
guidelines. The chapter discusses the following:
� study scope (Section 12.2);
� transport routes (Section 12.3);
� existing environment (Section 12.4);
� assessment approach (Section 12.5);
� route capacity impact assessment (Sections 12.6);
� assessment of risk (Section 12.7); and
� mitigation (Section 12.8).
12.2 STUDY SCOPE
The transport impact assessment (Appendix 16):
� Identified proposed routes for transport to and from the Project of construction
materials, consumables, product and personnel;
� Identified the type, size and number of vehicles required during all Project phases;
� Identified the quantity of materials to be transported in support of the Project;
� Compared existing traffic on the road network and compare this with a future project
traffic scenario to establish the potential impacts to the existing road network;
� Considered projected traffic volumes associated with the project in the context of the
relative likelihood of incidents;
� Undertook a risk assessment of the maximum reasonable consequence to (a) public
safety, and (b) the receiving environment, should an incident occur. This was based on

Chapter 12: Transportation
ERA: Proposed Ranger 3 Deeps Underground Mine 12-2
quantitative analysis of incidents occurring along the identified haulage routes and
assessment of the credible worst case consequence of the risk;
� Identified levels of uncertainty in estimating the level of risk;
� Undertook an assessment of the safeguards and mitigation measures adopted by ERA
and its suppliers. This assessment sought to understand the effectiveness of the
current controls to reduce the likelihood of an incident occurring. This analysis took into
consideration the ability of the safeguards and measures to take account of seasonality
(wet/dry), nature of the consignment, truck/trailer configuration and design, and the
biophysical nature of the local environment. These controls and their effectiveness
were considered in the risk assessment process.
12.3 TRANSPORT ROUTES
12.3.1 Existing Road Network
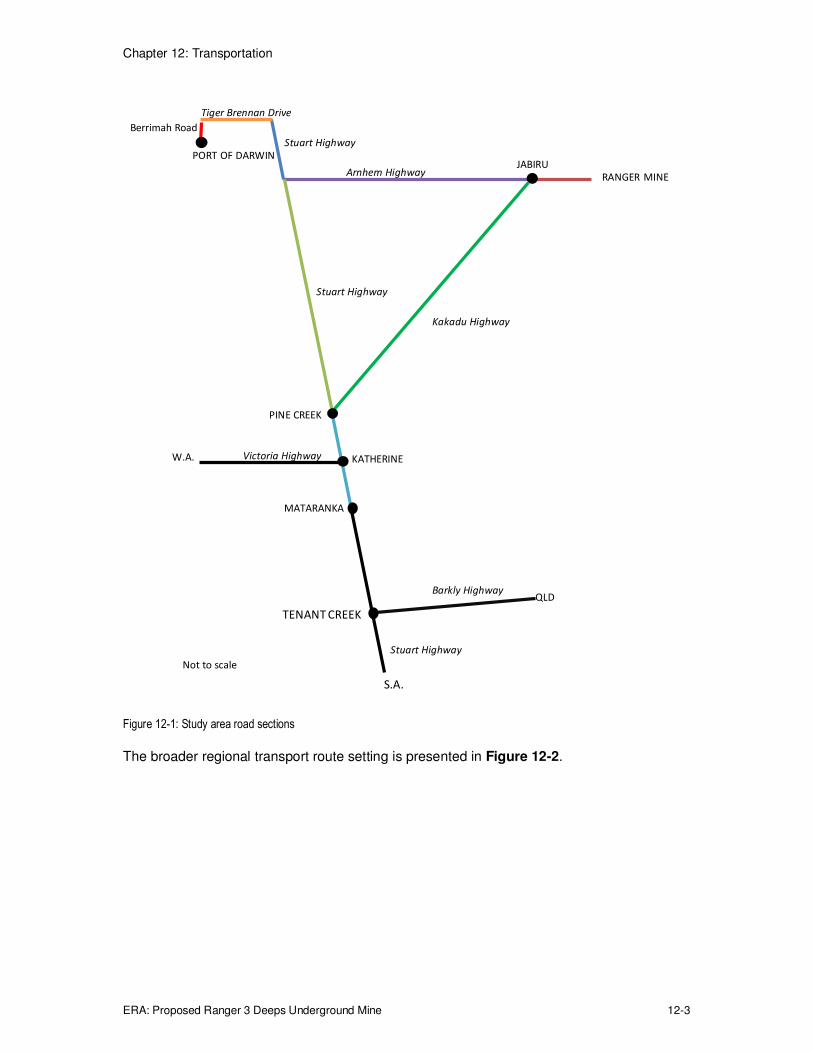
The main haulage routes associated with ERA's current operations and the Project are
Berrimah Road, Tiger Brennan Drive, and the Stuart, Arnhem and Kakadu Highways; these
therefore constituted the study area (refer to Figure 12-1). Both Berrimah Road and Tiger
Brennan Drive are located within Darwin. For further information on these road sections,
refer to Section 2.2.5.
Chapter 12: Transportation
ERA: Proposed Ranger 3 Deeps Underground Mine 12-3
Figure 12-1: Study area road sections
The broader regional transport route setting is presented in Figure 12-2.
Tiger Brennan Drive
Berrimah Road
Stuart Highway
Arnhem Highway
Stuart Highway
Kakadu Highway
Victoria Highway
Barkly Highway
Stuart Highway
Not to scale
PORT OF DARWIN
RANGER MINE
PINE CREEK
MATARANKA
TENANT CREEK
KATHERINE
QLD
S.A.
W.A.
JABIRU
Chapter 12: Transportation
ERA: Proposed Ranger 3 Deeps Underground Mine 12-4
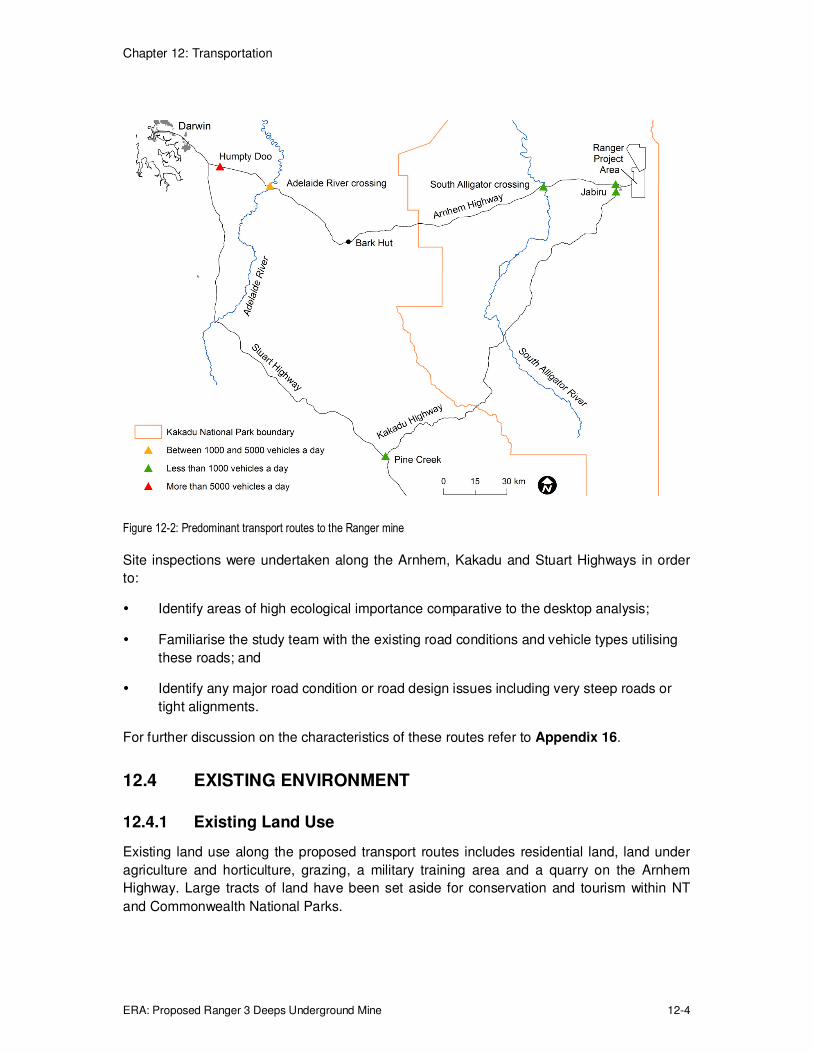
Figure 12-2: Predominant transport routes to the Ranger mine
Site inspections were undertaken along the Arnhem, Kakadu and Stuart Highways in order
to:
� Identify areas of high ecological importance comparative to the desktop analysis;
� Familiarise the study team with the existing road conditions and vehicle types utilising
these roads; and
� Identify any major road condition or road design issues including very steep roads or
tight alignments.
For further discussion on the characteristics of these routes refer to Appendix 16.
12.4 EXISTING ENVIRONMENT
12.4.1 Existing Land Use
Existing land use along the proposed transport routes includes residential land, land under
agriculture and horticulture, grazing, a military training area and a quarry on the Arnhem
Highway. Large tracts of land have been set aside for conservation and tourism within NT
and Commonwealth National Parks.

Chapter 12: Transportation
ERA: Proposed Ranger 3 Deeps Underground Mine 12-5
12.4.2 Physical Environment
The study area transport corridors occur within three northern Australian bio-geographic
regions (Figure 12-3). Most of the transport corridor occurs within the Pine Creek bioregion.
To a lesser extent, the north western and north eastern ends of the Arnhem Highway lie
within the southern extent of the Darwin Coastal bioregion. Also of limited extent, the Kakadu
Highway intercepts the south western portion of the Arnhem Plateau bioregion while the
Stuart Highway partially traverses the north eastern edge of the Daly Basin. Additional
information on these bioregions is provided in Appendix 16.
Figure 12-3: Study area bioregions
Chapter 12: Transportation
ERA: Proposed Ranger 3 Deeps Underground Mine 12-6
12.5 ASSESSMENT APPROACH
This section outlines the traffic impact assessment method conducted to address the
following EIS guideline requirement:
" potential risks relating to the environment and public safety from the transportation of
uranium, explosives (bulk emulsion) and consumables, including dangerous goods, on
public roads ..." (refer Appendix 2; p.1)
ERA engaged independent consultants GHD Pty Ltd to conduct the traffic assessment and
consider risks to a) public health and safety, b) Northern Territory (NT) conservation
significant species and communities, and c) MNES as outlined in the Commonwealth
Environment Protection and Biodiversity Conservation Act 1999 (EPBC Act).
The traffic risk assessment was semi-quantitative in consideration of the EIS guideline
requirement:
"Sufficient quantitative analysis should be provided to indicate whether risks are likely
to be acceptable or tolerable."
The outcomes of the transportation impact assessment are discussed in Section 12.7 and
Appendix 16.
12.5.1 Environmental Assessment
The environmental assessment was conducted for all road transport routes to the Ranger
mine; these pass along the Stuart Highway and either the Kakadu or Arnhem highways. The
transport study area was defined as a 10 km wide corridor along each route (i.e. 5 km each
side of the highway).
12.5.1.1 Desktop Assessment
A desktop assessment was undertaken to identify species of conservation significance
(including threatened ecological communities and threatened and migratory species) within
the study corridor (Section 12.5.1.2) along with ecologically sensitive areas (Section
12.5.1.3).
Identifying areas of greater sensitivity to disturbance allowed the risk assessment to focus on
locations of comparatively greater vulnerability to a particular event. Background information
and data for the desktop assessment was sourced from the following:
� The Department of the Environment protected matters search tool to identify MNES
potentially occurring in the study area;
� The Department of Land and Resource Management;
� Fauna atlas database records from the study area;
� Land systems and soil mapping;
� Vegetation mapping;
Chapter 12: Transportation
ERA: Proposed Ranger 3 Deeps Underground Mine 12-7
� Mapping of surface water features based on Bureau of Meteorology data; and
� Geology mapping based on Geoscience Australia data.
12.5.1.2 Species of Conservation Significance (Commonwealth and NT)
The desktop assessment included a review of the Commonwealth EPBC Act protected
matters search database, to identify any threatened species and ecological communities
likely to occur within the study area. The database search returned the Arnhem Plateau
Sandstone Shrubland as an endangered ecological community impacted by altered fire
regimes along with invasive weed species. Given available information regarding habitat
preferences and likely distribution of this ecological community (SEWPAC 2012), it is unlikely
to occur within the study area; therefore, this community was not included in the assessment.
In addition to the protected matters search, the desktop assessment also reviewed the
Department of Land and Resource Management database for threatened NT flora and fauna.
In total, the Commonwealth and NT databases identified 13 threatened flora species and 43
threatened fauna species predicted or known to occur in the study area. This includes 11
mammals, 14 birds, 12 reptiles, 1 amphibian and 5 fish. These are threatened under both the
EPBC Act and the Territory Parks and Wildlife Conservation Act. The protected matters
search tool and the Department of Land and Resource Management database also identified
56 migratory species that are predicted or known to occur in the study area as listed under
the EPBC Act. This includes 3 mammals, 46 birds and 7 reptiles. For a full discussion on the
threatened and migratory species identified by the desktop assessment refer Appendix 16.
The likelihood of occurrence of species of conservation significance, within the 10 km wide
traffic corridor, was assessed using a three-tier scale:
� Possible – suitable habitat occurs within the study area;
� Unlikely – suitable habitat is unlikely to occur within the study; or suitable habitat
substantially modified; or suitable habitat present, but species have not been recorded
for over 50 years; and
� Highly unlikely – no suitable habitat is present within the study area and individuals
have not been recorded within the study area.
12.5.1.3 Ecologically Sensitive Areas
A site inspection was undertaken at each ecologically sensitive area to validate the outcomes
of the desktop assessment described above and confirm that the habitat characteristics are
consistent with known areas of high species abundance and/or diversity. These locations
predominantly comprise of wetlands, floodplains and rivers that have the potential to be
significantly impacted in the event that a spill occurs during the transport of materials to/from
Ranger mine. A total of 14 locations were identified as areas high in species richness,
recording the highest abundance and diversity of threatened flora/fauna and migratory
species. Each of these locations is provided in Table 12-1 and presented in Appendix 16;
Figures 4 to 6.

Chapter 12: Transportation
ERA: Proposed Ranger 3 Deeps Underground Mine 12-8
Table 12-1: Ecologically sensitive areas
Highway Ecologically sensitive area
Arnhem Highway Adelaide River crossing and surrounding floodplain
Arnhem Highway Mary River crossing and surrounding floodplains
Arnhem Highway South Alligator River crossing and surrounding floodplains
Arnhem Highway Wetland areas between Jabiru and Ranger mine
Kakadu Highway Nourlangie Creek crossing and surrounding floodplain
Kakadu Highway Jim Jim Creek/ Jim Jim Billabong crossing and surrounding floodplain *
Kakadu Highway South Alligator River crossing and surrounding floodplain
Kakadu Highway Mary River crossing and surrounding floodplain
Kakadu Highway 7 km east of the Mary River crossing
Stuart Highway Pine Creek township at the intersection of Stuart Highway and Kakadu Highway
Stuart Highway Eastern roadside area, approximately 60 km north of Pine Creek
Stuart Highway Adelaide River crossing and surrounding floodplain
Stuart Highway 134 km Bridge crossing over creek line and adjoining riparian woodland
Stuart Highway Greater Darwin region and broader area surrounding the intersection of Arnhem Highway and Stuart Highway
* Yellow Waters wetland is also in the vicinity of this floodplain.
For further information on ecologically sensitive areas refer to Appendix 16.
12.5.2 Risk Assessment Process
The risk assessment considered potential risks to both public health and safety and the
environment. The scope of the risk assessment included transport requirements associated
with construction and operational phases of the Project and comprised both incremental
(Project) and cumulative (Project and continuation of existing operations) impacts.
During Project decommissioning, equipment and material requirements in support of closure
activity are anticipated to be sourced from existing operations. Therefore, transport
movements for this Project phase have not formed part of the risk assessment scope.
Further information regarding the decommissioning phase of the Project is discussed in
Chapter 3 and Chapter 13.
Chapter 12: Transportation
ERA: Proposed Ranger 3 Deeps Underground Mine 12-9
12.5.2.1 Risk Identification
Risk identification was undertaken in an independently facilitated workshop held on
5 December 2013. The workshop participants included ERA, NT Department of Transport,
and GHD ecologists, together with ERA key suppliers and transport contractors (represented
by chemical product and logistics specialists). Further details concerning the participants are
provided in Appendix 16.
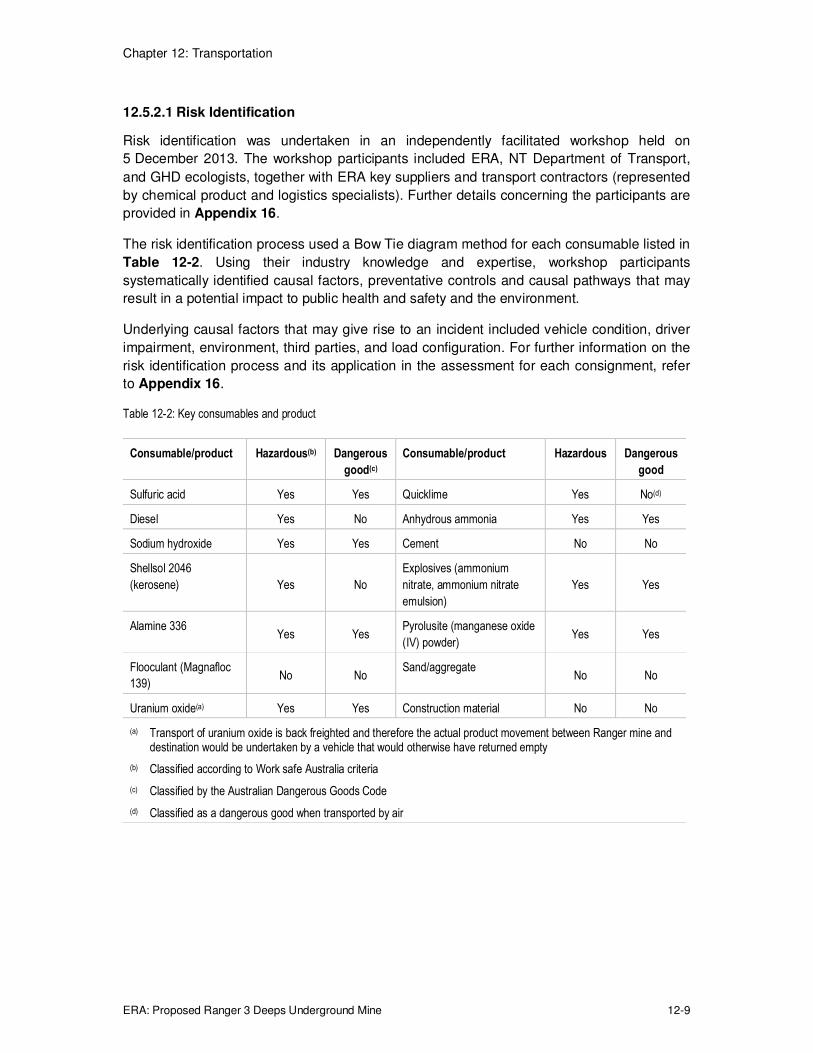
The risk identification process used a Bow Tie diagram method for each consumable listed in
Table 12-2. Using their industry knowledge and expertise, workshop participants
systematically identified causal factors, preventative controls and causal pathways that may
result in a potential impact to public health and safety and the environment.
Underlying causal factors that may give rise to an incident included vehicle condition, driver
impairment, environment, third parties, and load configuration. For further information on the
risk identification process and its application in the assessment for each consignment, refer
to Appendix 16.
Table 12-2: Key consumables and product
Consumable/product Hazardous(b) Dangerous
good(c)
Consumable/product Hazardous Dangerous
good
Sulfuric acid Yes Yes Quicklime Yes No(d)
Diesel Yes No Anhydrous ammonia Yes Yes
Sodium hydroxide Yes Yes Cement No No
Shellsol 2046
(kerosene) Yes No
Explosives (ammonium
nitrate, ammonium nitrate
emulsion)
Yes Yes
Alamine 336 Yes Yes
Pyrolusite (manganese oxide
(IV) powder) Yes Yes
Flooculant (Magnafloc
139) No No
Sand/aggregate No No
Uranium oxide(a) Yes Yes Construction material No No
(a) Transport of uranium oxide is back freighted and therefore the actual product movement between Ranger mine and destination would be undertaken by a vehicle that would otherwise have returned empty
(b) Classified according to Work safe Australia criteria
(c) Classified by the Australian Dangerous Goods Code
(d) Classified as a dangerous good when transported by air

Chapter 12: Transportation
ERA: Proposed Ranger 3 Deeps Underground Mine 12-10
12.5.3 Risk Analysis
12.5.3.1 Consequence Assessment
Consequence descriptors ranging in magnitude from minor to catastrophic were developed
for species of conservation significance, environmental values, and public health and safety
(refer Table 12-3).
For each ecologically sensitive location listed in Table 12-1, and the environmental values1 they contain, the risk assessment considered a loss of containment scenario for each
consumable/product and the expected recovery time of the ecological system. The maximum
reasonable consequence level associated with each scenario considered a) the range of
controls currently in place for each consumable/product, and b) the "credible release"2
quantity in the event of a containment loss.
The consequence to public health and safety has been determined on the basis of whether
the incident is associated with direct vehicle to vehicle interaction or subsequent fire and/or
explosion, in addition to contact with the contents of the consignment.
The likelihood of a crash involving a light or heavy vehicle at a particular location (or road
length) was calculated as the product of two components:
� Probability of a crash at a specific location; and
� Frequency3 of trips and, therefore, the exposure of a light or heavy vehicle to that
location.
For example, if a consumable has three times the number of deliveries as another
consumable along the same route, then its exposure (and the likelihood of a crash at a
particular location) is three times as high.
Average crash rates along each 1 km road section were established using traffic data
sourced from the NT annual traffic report 2012 and NT vehicle accident data. Crash rate
calculations encompassed all vehicle classifications. Heavy vehicles comprise a smaller
component of this vehicle profile and, therefore, the use of all vehicle classifications provided
a larger data set from which to derive crash rates.
The leading measure of crash rates along the transport route is ‘crashes per million vehicle
kilometres travelled'. For example, a crash rate of 1.0 crash per million vehicle kilometres
travelled means that if one million vehicles traversed a 1 km section of road, the probability
would be for one crash to occur.
1 The consequence criteria used for environmental values applies to multiple biotic and abiotic elements including impacts to flora, fauna, soils and surface water.
2 The term "credible release" is the maximum reasonable loss of a substance to ground based on tanker design and industry statistics.
3 The year of 2017 has been selected to establish frequency as this is the year that represents the greatest number of round trips and therefore exposure.
Chapter 12: Transportation
ERA: Proposed Ranger 3 Deeps Underground Mine 12-11
Once the crash rate is established, it is multiplied by the number of ERA vehicles and the
length of a specific road section to calculate the crash likelihood. A worked example is
provided in Appendix 16.
The likelihood value is then aligned to the corresponding likelihood level described in
Table 12-4. For example, a risk scenario with a quantified likelihood of 5% corresponds to a
likelihood level of ‘possible'.
Despite the impossibility of eliminating all conceivable traffic risks, the controls identified as
an outcome of the Bow Tie process reduce the likelihood associated with a number of risks
within ERA's control. Further information on risk mitigation and controls is provided in
Section 12.8 and Appendix 16.
12.5.3.2 Likelihood of an Escalating Event
An escalating event is a vehicle incident where there are additional circumstances or
conditions that may result in a secondary impact event, e.g. flammable liquid plus fire causes
an explosion. In other words, the potential for an escalating event depends on both a
containment loss (release) and the physical and chemical properties of the substance. The
conditional probability that this scenario may occur was determined using loss of
containment escalation factors sourced from the United States Federal Motor Carrier Safety
Administration (Battelle 2001).
The likelihood of a release event is quantified by multiplying the previously established crash
rate by the consignment load along with the escalation factor relevant to the consumable.
Similarly, the likelihood that this release event may result in a fire and explosion is further
quantified using an appropriate escalation factor. A worked example is provided in
Appendix 16.
With the exception of product which is outbound from Ranger mine, the likelihood of release
events is comparatively greater from inbound deliveries carrying full loads. Therefore, the
release exposure exists for half the time that the vehicle and its load are in transit.

Chapter 12: Transportation
ERA: Proposed Ranger 3 Deeps Underground Mine 12-12
Table 12-3: Consequence descriptors
Consequence
type
Consequences
Minor Medium Serious Major Catastrophic
Environmental
values
Impact* will be very limited and
have no discernible effect on
environmental values, including
sensitive populations, communities
and assets.
Impact* will be limited and
affect only minor
environmental values.
Recovery periods are
relatively short.
Impact* will affect environmental
values, disrupting some aspects
of environmental structures or
functions, but recovery periods
are relatively short.
Impact* will seriously affect
environmental values, disrupting
many environmental structures or
functions.
Long periods of recovery.
Impact* will seriously affect
environmental values,
disrupting major
environmental structures or
functions.
Potentially irreversible.
Negligible soil impact; chemical
concentrations are above
background but below ecological
investigation levels as defined in
the National Environmental
Protection Measure.
Localised soil impact; low
level (< 2 times) exceedance
of ecological investigation
levels defined in the National
Environmental Protection
Measure.
Localised long term or
widespread short term soil
impact; chemical concentrations
(2 to 5 times) exceedance of
ecological investigation level
defined in the National
Environmental Protection
Measure.
Widespread and/or long term
impact; chemical concentrations (5
to 10 times) exceedance of
ecological investigation level
defined in the National
Environmental Protection Measure.
Irreversible and/or extensive
impact; chemical
concentrations are (> 10
times) the ecological
investigation level defined in
the National Environmental
Protection Measure.
No detectable change to
background water quality; no
exceedance of background and
applicable Australian and New
Zealand Environment and
Conservation Council/ Agriculture
and Resources Management
Council of Australia and New
Zealand.
Local, short term, minor
exceedance of background
and applicable Australian and
New Zealand Environment
and Conservation Council/
Agriculture and Resources
Management Council of
Australia and New Zealand.
Local, long term or widespread,
short term exceedance of
background and applicable
Australian and New Zealand
Environment and Conservation
Council/Agriculture and
Resources Management Council
of Australia and New Zealand.
Local, permanent or widespread,
long term exceedance of
background and applicable
Australian and New Zealand
Environment and Conservation
Council/ Agriculture and Resources
Management Council of Australia
and New Zealand.
Widespread, permanent
exceedance of background
and applicable Australian and
New Zealand Environment
and Conservation Council/
Agriculture and Resources
Management Council of
Australia and New Zealand.
Public health and No injuries or first aid required Basic first aid treatment
required Medical attention required Permanent injury or illness Loss of life

Chapter 12: Transportation
ERA: Proposed Ranger 3 Deeps Underground Mine 12-13
Consequence
type
Consequences
Minor Medium Serious Major Catastrophic
safety
No increase in vehicle accidents Increase of < 2 annual non
fatal vehicle accidents
Increase of 2 to 5 annual non
fatal vehicle accidents
Increase of 5 to 10 annual non fatal
vehicle accidents
Increase of > 10 annual non
fatal vehicle accidents
* Includes an impact that would modify, destroy, remove, isolate or decrease the availability or quality of habitat to the extent that a species is likely to decline and/or an impact to a world heritage
and/or national heritage place (not excluding declared Ramsar wetland); and/or impact to common flora and fauna such as an impact that would modify habitat and/or disrupt the lifecycle of common
species.
Table 12-4: Likelihood classification
Likelihood
A Almost certain Common repeating occurrence that is ongoing. Frequency interval (multiple events): more than twice per year; probability (single events): more than 25%.
B Likely Known to occur or will probably occur at some time and in most circumstances. Frequency interval (multiple events): from once per year; probability (single events): from
10% to 25%.
C Possible Could occur at some time but not often. Frequency interval (multiple events): from once in 10 years to once per year; probability (single events): from 1% to 10%.
D Unlikely Could potentially occur at some time but highly unlikely. Frequency interval (multiple events): from once in 100 years to once in 10 years; probability (single events): from
0.1% to 1%.
E Rare Practically impossible, will only occur in very rare circumstances. Frequency interval (multiple events): less than once in 100 years; probability (single events): less than
0.1%.
Chapter 12: Transportation
ERA: Proposed Ranger 3 Deeps Underground Mine 12-14
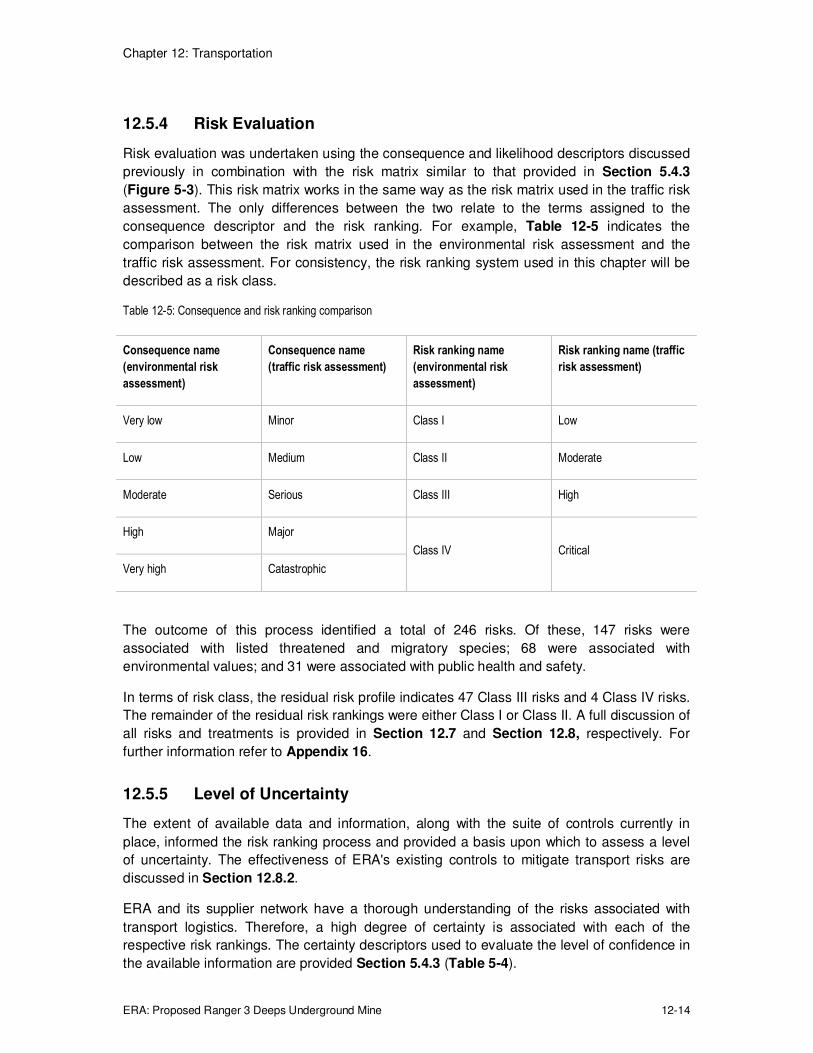
12.5.4 Risk Evaluation
Risk evaluation was undertaken using the consequence and likelihood descriptors discussed
previously in combination with the risk matrix similar to that provided in Section 5.4.3
(Figure 5-3). This risk matrix works in the same way as the risk matrix used in the traffic risk
assessment. The only differences between the two relate to the terms assigned to the
consequence descriptor and the risk ranking. For example, Table 12-5 indicates the
comparison between the risk matrix used in the environmental risk assessment and the
traffic risk assessment. For consistency, the risk ranking system used in this chapter will be
described as a risk class.
Table 12-5: Consequence and risk ranking comparison
Consequence name
(environmental risk
assessment)
Consequence name
(traffic risk assessment)
Risk ranking name
(environmental risk
assessment)
Risk ranking name (traffic
risk assessment)
Very low Minor Class I Low
Low Medium Class II Moderate
Moderate Serious Class III High
High Major
Class IV Critical
Very high Catastrophic
The outcome of this process identified a total of 246 risks. Of these, 147 risks were
associated with listed threatened and migratory species; 68 were associated with
environmental values; and 31 were associated with public health and safety.
In terms of risk class, the residual risk profile indicates 47 Class III risks and 4 Class IV risks.
The remainder of the residual risk rankings were either Class I or Class II. A full discussion of
all risks and treatments is provided in Section 12.7 and Section 12.8, respectively. For
further information refer to Appendix 16.
12.5.5 Level of Uncertainty
The extent of available data and information, along with the suite of controls currently in
place, informed the risk ranking process and provided a basis upon which to assess a level
of uncertainty. The effectiveness of ERA's existing controls to mitigate transport risks are
discussed in Section 12.8.2.
ERA and its supplier network have a thorough understanding of the risks associated with
transport logistics. Therefore, a high degree of certainty is associated with each of the
respective risk rankings. The certainty descriptors used to evaluate the level of confidence in
the available information are provided Section 5.4.3 (Table 5-4).
Chapter 12: Transportation
ERA: Proposed Ranger 3 Deeps Underground Mine 12-15
12.5.6 Cumulative Impacts
The traffic impact assessment is a cumulative assessment that considered all traffic volumes
(including other user traffic and Ranger mine traffic with and without the Project). The
cumulative impact to route capacity and road intersections was also assessed to determine
whether the Project could be accommodated within the existing road transport network.
12.5.7 Monitoring and Review
The continued effectiveness of ERA's management of traffic and transport-related risks are
assessed systematically through its established light vehicle committee, light vehicle travel
statistics and contractor management system. This ensures that those who travel on ERA
business or transport materials on the company's behalf do so in a manner that minimises
the potential for an incident that may result in an impact to public health and safety and/or the
environment.
In addition, ERA meets quarterly with its transport providers and the NT Department of
Transport. This collaborative forum is an opportunity to discuss current road conditions and
identify opportunities to improve existing transport management practices.
12.6 ROUTE CAPACITY IMPACT ASSESSMENT
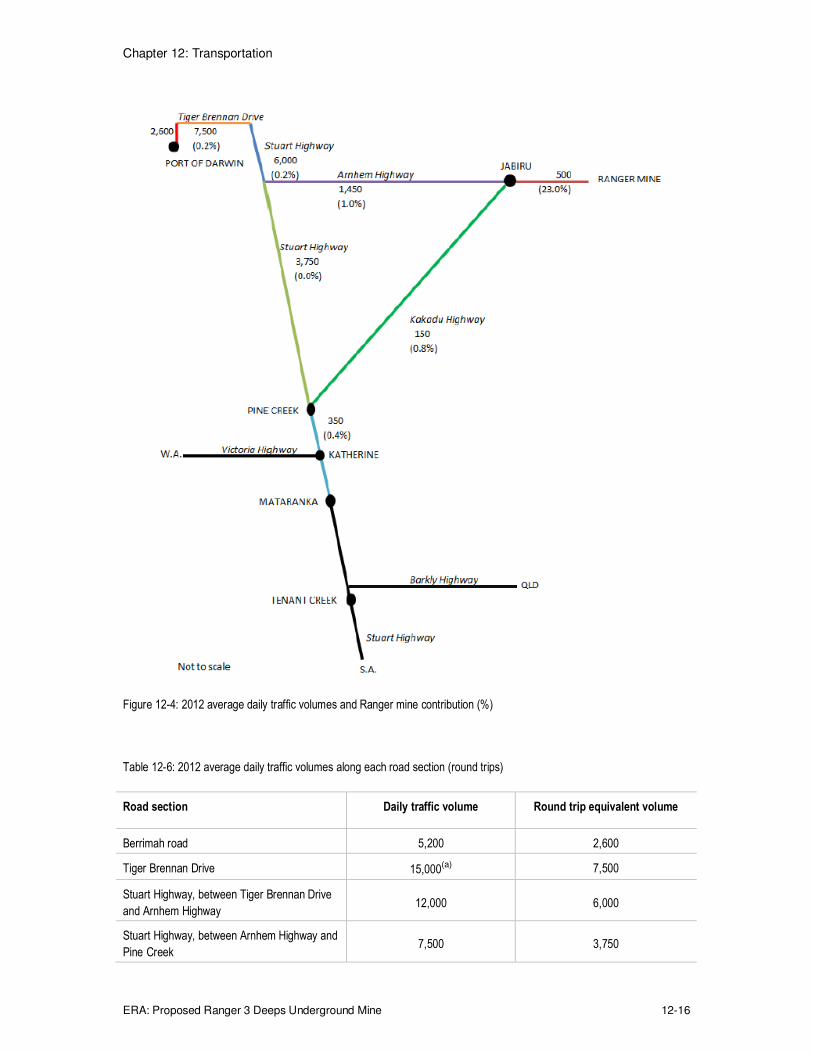
12.6.1 Background Traffic Volume
Traffic volumes were obtained from the NT Department of Transport 2012 Annual Traffic
Report (TAMS 2012) and daily traffic volumes for each road section are summarised in
Table 12-6 which includes both heavy and light vehicles travelling to and from the Ranger
uranium mine. The geographical distribution of traffic volumes including ERA's contribution is
presented in Figure 12-4. Other user traffic consists of both light and heavy vehicles which
are for private, commercial or military use.
Tourists travelling along the study area transport corridors predominantly occur in the dry
season months of May through to November. Of these, a significant proportion visit Kakadu
National Park.
Chapter 12: Transportation
ERA: Proposed Ranger 3 Deeps Underground Mine 12-16
Figure 12-4: 2012 average daily traffic volumes and Ranger mine contribution (%)
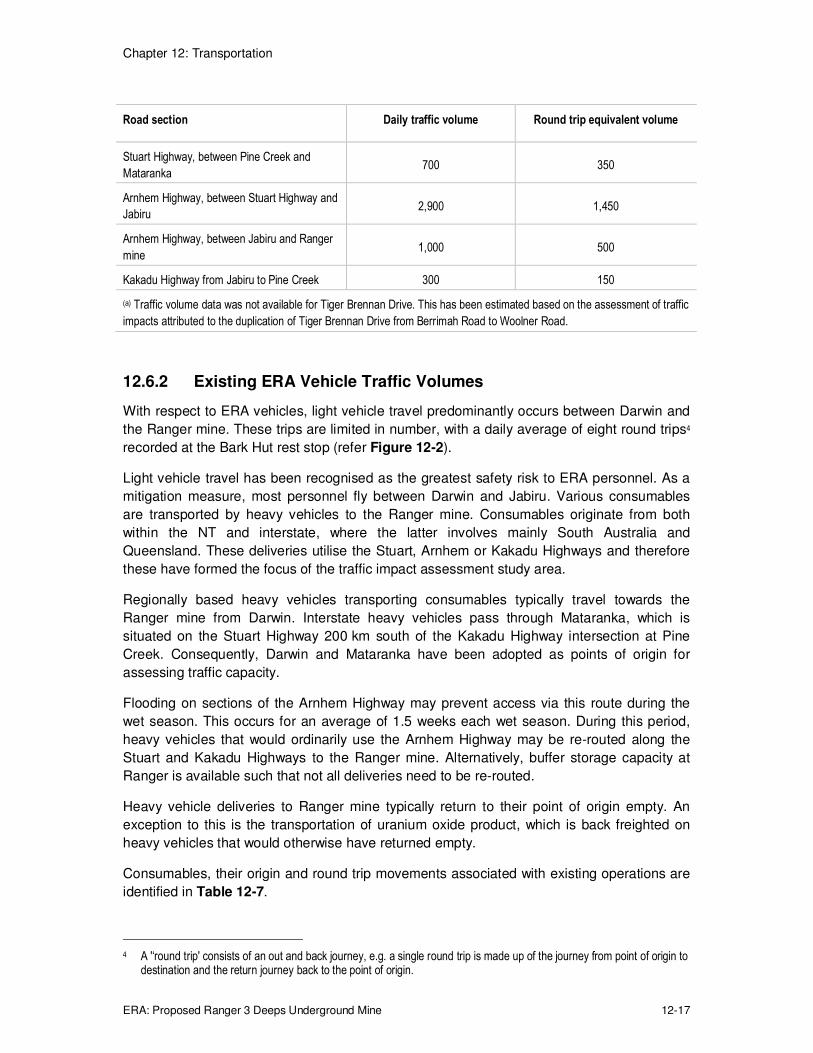
Table 12-6: 2012 average daily traffic volumes along each road section (round trips)
Road section Daily traffic volume Round trip equivalent volume
Berrimah road 5,200 2,600
Tiger Brennan Drive 15,000(a) 7,500
Stuart Highway, between Tiger Brennan Drive
and Arnhem Highway 12,000 6,000
Stuart Highway, between Arnhem Highway and
Pine Creek 7,500 3,750
Chapter 12: Transportation
ERA: Proposed Ranger 3 Deeps Underground Mine 12-17
Road section Daily traffic volume Round trip equivalent volume
Stuart Highway, between Pine Creek and
Mataranka 700 350
Arnhem Highway, between Stuart Highway and
Jabiru 2,900 1,450
Arnhem Highway, between Jabiru and Ranger
mine 1,000 500
Kakadu Highway from Jabiru to Pine Creek 300 150
(a) Traffic volume data was not available for Tiger Brennan Drive. This has been estimated based on the assessment of traffic
impacts attributed to the duplication of Tiger Brennan Drive from Berrimah Road to Woolner Road.
12.6.2 Existing ERA Vehicle Traffic Volumes
With respect to ERA vehicles, light vehicle travel predominantly occurs between Darwin and
the Ranger mine. These trips are limited in number, with a daily average of eight round trips4
recorded at the Bark Hut rest stop (refer Figure 12-2).
Light vehicle travel has been recognised as the greatest safety risk to ERA personnel. As a
mitigation measure, most personnel fly between Darwin and Jabiru. Various consumables
are transported by heavy vehicles to the Ranger mine. Consumables originate from both
within the NT and interstate, where the latter involves mainly South Australia and
Queensland. These deliveries utilise the Stuart, Arnhem or Kakadu Highways and therefore
these have formed the focus of the traffic impact assessment study area.
Regionally based heavy vehicles transporting consumables typically travel towards the
Ranger mine from Darwin. Interstate heavy vehicles pass through Mataranka, which is
situated on the Stuart Highway 200 km south of the Kakadu Highway intersection at Pine
Creek. Consequently, Darwin and Mataranka have been adopted as points of origin for
assessing traffic capacity.
Flooding on sections of the Arnhem Highway may prevent access via this route during the
wet season. This occurs for an average of 1.5 weeks each wet season. During this period,
heavy vehicles that would ordinarily use the Arnhem Highway may be re-routed along the
Stuart and Kakadu Highways to the Ranger mine. Alternatively, buffer storage capacity at
Ranger is available such that not all deliveries need to be re-routed.
Heavy vehicle deliveries to Ranger mine typically return to their point of origin empty. An
exception to this is the transportation of uranium oxide product, which is back freighted on
heavy vehicles that would otherwise have returned empty.
Consumables, their origin and round trip movements associated with existing operations are
identified in Table 12-7.
4 A '‘round trip' consists of an out and back journey, e.g. a single round trip is made up of the journey from point of origin to
destination and the return journey back to the point of origin.

Chapter 12: Transportation
ERA: Proposed Ranger 3 Deeps Underground Mine 12-18
Table 12-7: 2012 existing ERA heavy vehicle traffic volumes
Consumable /
product
Actual origin Effective
origin
Transport
quantity
Annual round
trips
Average daily
round trips
Sulfuric acid Darwin Darwin 162 kt 1,686 5
Quicklime Mataranka Mataranka 24 kt 393 1
Flocculant
(Magnafloc 139)
Darwin Darwin 340 t 93 <1
Diesel Darwin Darwin 44,000 kL 338 1
Pyrolusite
(Manganese oxide
(IV) powder)
Darwin Darwin
11 kt 126 <1
Alamine 336 Perth /
Adelaide
Mataranka 68 kL 4 <1
ShellSol 2046
(kerosene)
Adelaide Mataranka 1,716 kL 26 <1
Anhydrous
ammonia
Queensland Mataranka 1.8 kt 44 <1
Sodium hydroxide Darwin Darwin 120 kL 7 <1
Miscellaneous Darwin Darwin - 24 <1
Uranium oxide(a) Ranger mine Ranger mine 3.7 kt - -
(a) The transport of uranium oxide is back freighted and is undertaken by a previous delivery that would ordinarily have returned empty. This involves around 102 trips.
Chapter 12: Transportation
ERA: Proposed Ranger 3 Deeps Underground Mine 12-19
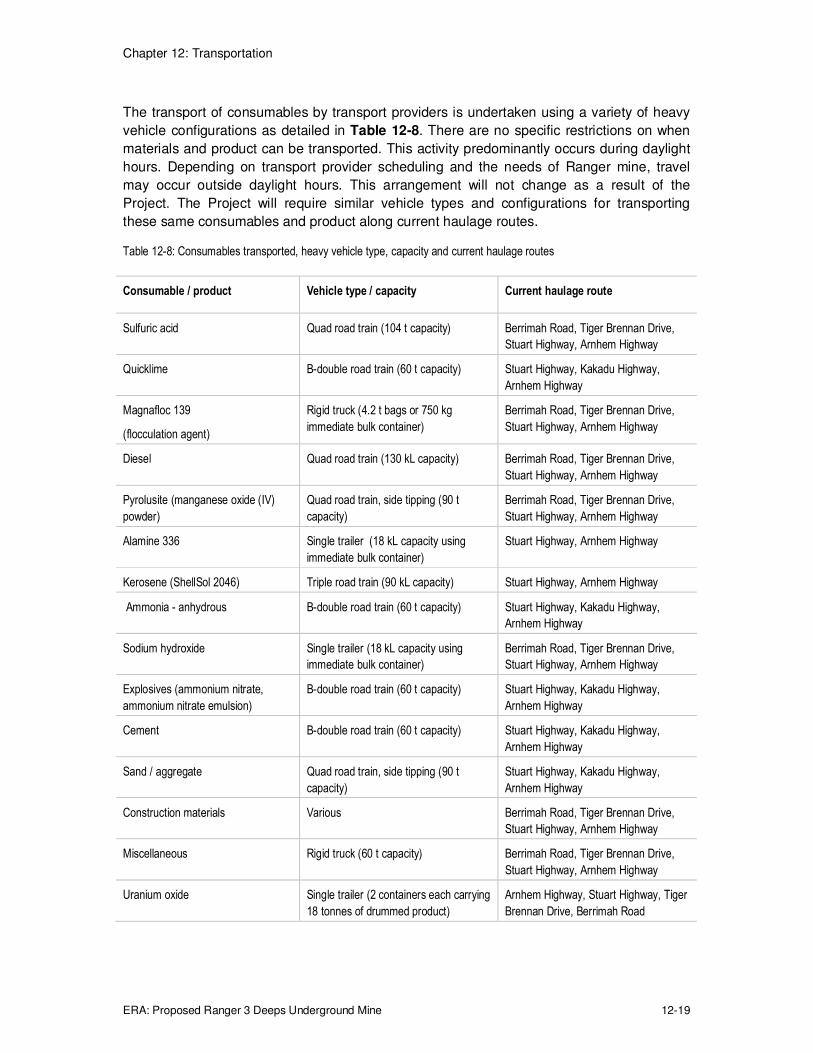
The transport of consumables by transport providers is undertaken using a variety of heavy
vehicle configurations as detailed in Table 12-8. There are no specific restrictions on when
materials and product can be transported. This activity predominantly occurs during daylight
hours. Depending on transport provider scheduling and the needs of Ranger mine, travel
may occur outside daylight hours. This arrangement will not change as a result of the
Project. The Project will require similar vehicle types and configurations for transporting
these same consumables and product along current haulage routes.
Table 12-8: Consumables transported, heavy vehicle type, capacity and current haulage routes
Consumable / product Vehicle type / capacity Current haulage route
Sulfuric acid Quad road train (104 t capacity) Berrimah Road, Tiger Brennan Drive,
Stuart Highway, Arnhem Highway
Quicklime B-double road train (60 t capacity) Stuart Highway, Kakadu Highway,
Arnhem Highway
Magnafloc 139
(flocculation agent)
Rigid truck (4.2 t bags or 750 kg
immediate bulk container)
Berrimah Road, Tiger Brennan Drive,
Stuart Highway, Arnhem Highway
Diesel Quad road train (130 kL capacity) Berrimah Road, Tiger Brennan Drive,
Stuart Highway, Arnhem Highway
Pyrolusite (manganese oxide (IV)
powder)
Quad road train, side tipping (90 t
capacity)
Berrimah Road, Tiger Brennan Drive,
Stuart Highway, Arnhem Highway
Alamine 336 Single trailer (18 kL capacity using
immediate bulk container)
Stuart Highway, Arnhem Highway
Kerosene (ShellSol 2046) Triple road train (90 kL capacity) Stuart Highway, Arnhem Highway
Ammonia - anhydrous B-double road train (60 t capacity) Stuart Highway, Kakadu Highway,
Arnhem Highway
Sodium hydroxide Single trailer (18 kL capacity using
immediate bulk container)
Berrimah Road, Tiger Brennan Drive,
Stuart Highway, Arnhem Highway
Explosives (ammonium nitrate,
ammonium nitrate emulsion)
B-double road train (60 t capacity) Stuart Highway, Kakadu Highway,
Arnhem Highway
Cement B-double road train (60 t capacity) Stuart Highway, Kakadu Highway,
Arnhem Highway
Sand / aggregate Quad road train, side tipping (90 t
capacity)
Stuart Highway, Kakadu Highway,
Arnhem Highway
Construction materials Various Berrimah Road, Tiger Brennan Drive,
Stuart Highway, Arnhem Highway
Miscellaneous Rigid truck (60 t capacity) Berrimah Road, Tiger Brennan Drive,
Stuart Highway, Arnhem Highway
Uranium oxide Single trailer (2 containers each carrying
18 tonnes of drummed product)
Arnhem Highway, Stuart Highway, Tiger
Brennan Drive, Berrimah Road

Chapter 12: Transportation
ERA: Proposed Ranger 3 Deeps Underground Mine 12-20
12.6.3 Historical and Projected ERA Traffic
Over the life of the Project, the highest number of round trips will occur in 2017 (Figure 12-
5). This together with projected background traffic associated with other road users provides
a conservative basis to undertake both the route capacity impact assessment and the
environmental risk assessment.
Figure 12-5: Historical and projected heavy and light vehicle trips to the Ranger mine
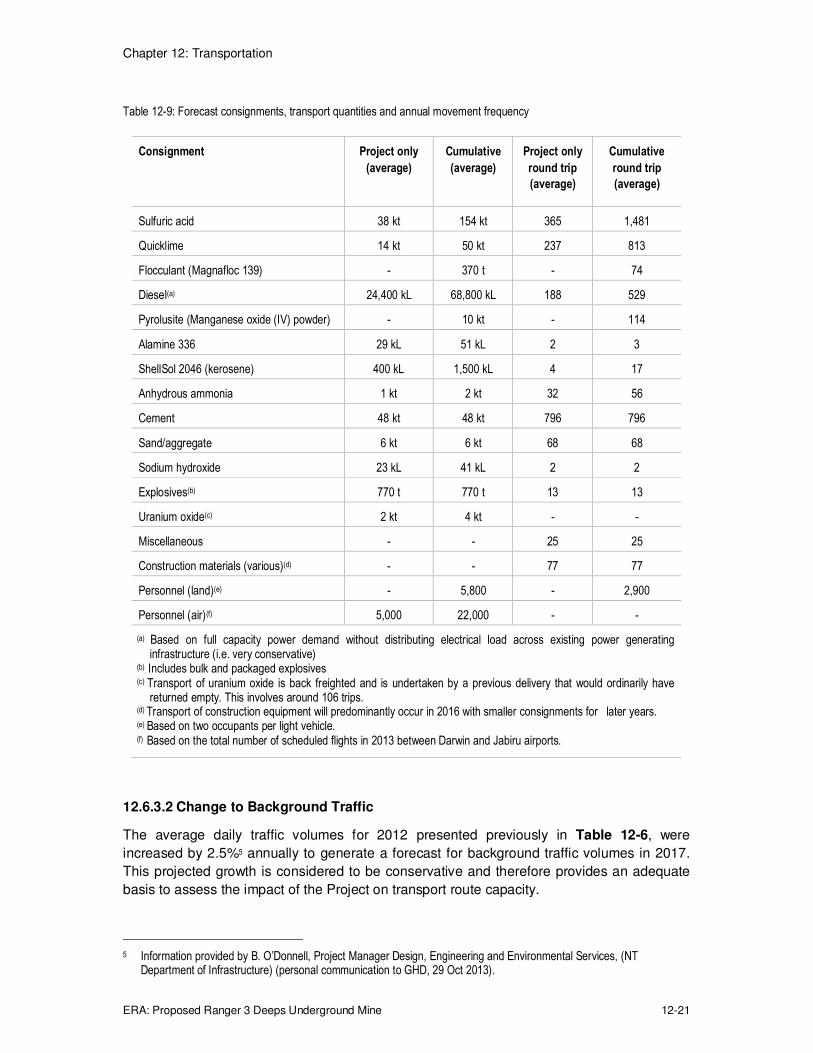
12.6.3.1 Change to Consignment Quantities
The average inventory of consignments between 2016 – 2020 that are required for both the
Project and cumulatively for the existing Ranger operations and the Project are shown in
Table 12-9.
Chapter 12: Transportation
ERA: Proposed Ranger 3 Deeps Underground Mine 12-21
Table 12-9: Forecast consignments, transport quantities and annual movement frequency
Consignment Project only
(average)
Cumulative
(average)
Project only
round trip
(average)
Cumulative
round trip
(average)
Sulfuric acid 38 kt 154 kt 365 1,481
Quicklime 14 kt 50 kt 237 813
Flocculant (Magnafloc 139) - 370 t - 74
Diesel(a) 24,400 kL 68,800 kL 188 529
Pyrolusite (Manganese oxide (IV) powder) - 10 kt - 114
Alamine 336 29 kL 51 kL 2 3
ShellSol 2046 (kerosene) 400 kL 1,500 kL 4 17
Anhydrous ammonia 1 kt 2 kt 32 56
Cement 48 kt 48 kt 796 796
Sand/aggregate 6 kt 6 kt 68 68
Sodium hydroxide 23 kL 41 kL 2 2
Explosives(b) 770 t 770 t 13 13
Uranium oxide(c) 2 kt 4 kt - -
Miscellaneous - - 25 25
Construction materials (various)(d) - - 77 77
Personnel (land)(e) - 5,800 - 2,900
Personnel (air)(f) 5,000 22,000 - -
(a) Based on full capacity power demand without distributing electrical load across existing power generating infrastructure (i.e. very conservative)
(b) Includes bulk and packaged explosives (c) Transport of uranium oxide is back freighted and is undertaken by a previous delivery that would ordinarily have returned empty. This involves around 106 trips.
(d) Transport of construction equipment will predominantly occur in 2016 with smaller consignments for later years. (e) Based on two occupants per light vehicle. (f) Based on the total number of scheduled flights in 2013 between Darwin and Jabiru airports.
12.6.3.2 Change to Background Traffic
The average daily traffic volumes for 2012 presented previously in Table 12-6, were
increased by 2.5%5 annually to generate a forecast for background traffic volumes in 2017.
This projected growth is considered to be conservative and therefore provides an adequate
basis to assess the impact of the Project on transport route capacity.
5 Information provided by B. O’Donnell, Project Manager Design, Engineering and Environmental Services, (NT
Department of Infrastructure) (personal communication to GHD, 29 Oct 2013).

Chapter 12: Transportation
ERA: Proposed Ranger 3 Deeps Underground Mine 12-22
Combining this information with cumulative Ranger mine traffic, the relative contribution of
ERA traffic to total road use was determined and is shown in Table 12-10.
Table 12-10: Projected daily averages in 2017 and expected cumulative contribution from Ranger (round trip)
Road section Other road
user average
daily traffic
Project
average
daily traffic
Ranger mine
average daily
traffic (including
the Project)
Combined
average daily
traffic
Contribution of the
Ranger mine to
average daily
traffic %
Berrimah Road 3,000 2 14 3,014 0.5
Tiger Brennan Drive 8,500 2 14 8,514 0.2
Stuart Highway (between
Tiger Brennan Drive and
Arnhem Highway)
6,800 2 14 6,814 0.2
Stuart Highway, (between
Arnhem Highway and Pine
Creek)
4,300 <1 <1 4,300 0.0
Stuart Highway, (between
Pine Creek and Mataranka) 400 3 5 405 1.3
Arnhem Highway, (between
Stuart Highway and Jabiru) 1,700 2 15 1,715 0.9
Arnhem Highway, (between
Jabiru and Ranger mine) 6001 6 20 620 19.4
Kakadu Highway from
Jabiru to Pine Creek 200 3 5 205 2.6
1 This includes vehicles heading from Jabiru to Ranger mine (estimated to be 100).
12.6.4 Potential Impact to Route Capacity
12.6.4.1 Construction Traffic Volume
As the Project requires a limited amount of new infrastructure, construction related deliveries
will be small in number. These are predominantly associated with surface infrastructure that
will arrive at the Ranger mine as either single units or as modular components to be
assembled on site. The anticipated consignment inventory will consist of, but is not limited to:
� Ventilation stack/fan assemblies;
� Refrigeration units;
� Backfill plant modular components;
� Dewatering plant modular components; and
� Diesel generators.

Chapter 12: Transportation
ERA: Proposed Ranger 3 Deeps Underground Mine 12-23
Construction activity will predominantly occur in 2016. Traffic volumes associated with this
activity are small and therefore will not impact road capacity. Note that construction
personnel will travel to the Project by air in most instances.
12.6.4.2 Operational Traffic Volume
As shown in Table 12-10, cumulative Ranger mine traffic during the Project's peak
assessment year (2017) is less than 4% of the projected road use.
In total, the Ranger mine currently generates approximately 14 round trips per day,
comprising 6 heavy vehicle trips and 8 light vehicle trips. Based on ERA projections (with and
without the Project) to 2020, 2017 generates the highest number of round trips to the Ranger
mine with the Project, equal to around 20 round trips per day. The Project accounts for
approximately five of these round trips.
It is not anticipated that the Project would contribute any additional light vehicles to the road
network in 2017, and so these additional vehicles are all heavy vehicles. This additional
heavy vehicle traffic on the road network represents a comparatively small contribution to
traffic volumes in the study area in 2017.
Using established guidelines published by Austroads, a road capacity assessment was
undertaken Appendix 16. The capacity of a traffic lane is expressed as a number of vehicles
per hour. The road capacity assessment indicates that there is significant spare capacity to
accommodate Ranger mine traffic (with and without the Project) (Table 12-11).
Table 12-11: 2017 estimated hourly volumes and comparison to Austroads capacity guidelines
Road section Lanes each
way
Capacity of
one lane
(vehicles per
hour)
Total volume
(vehicles per
hour)
Spare capacity
(vehicles per
hour)
Berrimah Road 1 900 301 599
Tiger Brennan Drive 2 1,800 851 949
Stuart Highway (between Tiger Brennan
Drive and Arnhem Highway) 2 1,800 681 1,119
Stuart Highway, (between Arnhem
Highway and Pine Creek) 1 1,800 430 1,370
Stuart Highway, (between Pine Creek and
Mataranka) 1 1,800 41 1,759
Arnhem Highway, (between Stuart
Highway and Jabiru) 1 1,800 171 1,629
Arnhem Highway, (between Jabiru and
Ranger mine) 1 1,800 62 1,738
Kakadu Highway from Jabiru to Pine Creek 1 900 21 879

Chapter 12: Transportation
ERA: Proposed Ranger 3 Deeps Underground Mine 12-24
12.7 ASSESSMENT OF RISK
The risk assessment process discussed previously in Section 12.5 considered a range of
consumables and/or materials (14), at a number of locations with possible impacts to the
environment and or public health and safety. This process generated 246 risks, however,
given the repetition of equivalent risks multiplied by up to 14 locations, that number should
not be directly compared to the previously discussed risks arising from the environmental risk
workshop.6
The assessment considered risks to the following receptors:
� Listed threatened and migratory species;
� Environmental values; and
� Public health and safety.
The risk profile includes the following:
� There were 147 risk scenarios that address risks to listed threatened and migratory
species at 14 environmentally sensitive locations, concerning the transport of 14
separate consumables and/or materials;
� There were 68 risk scenarios that address risks to environmental values at 6
environmentally sensitive locations, concerning the transport of 14 separate
consumables and/or materials; and
� There were 31 risk scenarios that address risks to public safety in the study area
concerning the transport of 14 separate consumables and/or materials.
A summary of the cumulative risk profile for each of the environmental receptors is provided
in Table 12-12.
Table 12-12: Summary risk profile
Risk profile Listed threatened
and migratory
species
Environmental
values
Public health and
safety
Total
Critical (Class IV) 0 0 4 4
High (Class III) 21 11 15 47
Moderate (Class II) 14 6 5 25
Low (Class I) 112 51 7 170
Total 147 68 31 246
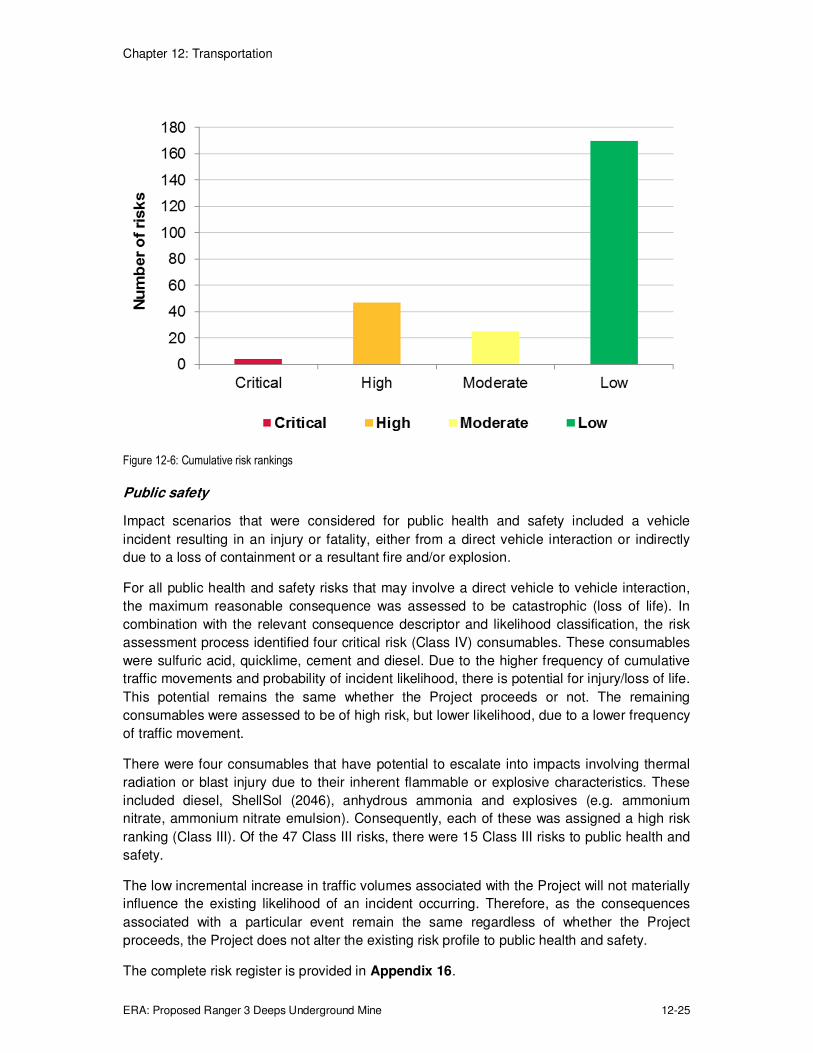
The cumulative risk rankings for all of the environmental receptors are shown in Figure 12-6.
6 By analogy, if the transport risk assessment approach had been applied to the environmental risk areas, instead of one
risk of fauna falling into a vent shaft during construction, there would be up to eight risks; i.e. one for each shaft under construction.
Chapter 12: Transportation
ERA: Proposed Ranger 3 Deeps Underground Mine 12-25
Figure 12-6: Cumulative risk rankings
Public safety
Impact scenarios that were considered for public health and safety included a vehicle
incident resulting in an injury or fatality, either from a direct vehicle interaction or indirectly
due to a loss of containment or a resultant fire and/or explosion.
For all public health and safety risks that may involve a direct vehicle to vehicle interaction,
the maximum reasonable consequence was assessed to be catastrophic (loss of life). In
combination with the relevant consequence descriptor and likelihood classification, the risk
assessment process identified four critical risk (Class IV) consumables. These consumables
were sulfuric acid, quicklime, cement and diesel. Due to the higher frequency of cumulative
traffic movements and probability of incident likelihood, there is potential for injury/loss of life.
This potential remains the same whether the Project proceeds or not. The remaining
consumables were assessed to be of high risk, but lower likelihood, due to a lower frequency
of traffic movement.
There were four consumables that have potential to escalate into impacts involving thermal
radiation or blast injury due to their inherent flammable or explosive characteristics. These
included diesel, ShellSol (2046), anhydrous ammonia and explosives (e.g. ammonium
nitrate, ammonium nitrate emulsion). Consequently, each of these was assigned a high risk
ranking (Class III). Of the 47 Class III risks, there were 15 Class III risks to public health and
safety.
The low incremental increase in traffic volumes associated with the Project will not materially
influence the existing likelihood of an incident occurring. Therefore, as the consequences
associated with a particular event remain the same regardless of whether the Project
proceeds, the Project does not alter the existing risk profile to public health and safety.
The complete risk register is provided in Appendix 16.

Chapter 12: Transportation
ERA: Proposed Ranger 3 Deeps Underground Mine 12-26
Environmental values, listed threatened and migratory species
An assessment of potential impacts to the environment, the biophysical sensitivity of the
receiving environment in which the transport corridors are located has been considered. In
determining biophysical sensitivity, soils, surface water, conservation significant species7 and
habitat have been considered. This includes potential impacts to Ramsar wetlands, migratory
species and Kakadu National Park. In combination with consignment characteristics, credible
loss of containment (release) scenarios and the extent of current controls, the consequence
descriptors outlined in Chapter 5 have been applied. These descriptors are appropriate in
assessing impacts to environmental values, listed threatened and migratory species.
Therefore, the "maximum reasonable consequence"8 derived in the risk assessment process
is an outcome of these fore mentioned aspects. In addition, the maximum reasonable
consequence remains the same whether the Project proceeds or not, as the chemical and
release scenarios are identical in either instance.
Due to the extent of current controls in place in combination with a low frequency of travel,
for the majority of release scenarios considered, the likelihood has been assessed as rare.
Where this is not the case, the likelihood has been determined to be greater due to a higher
frequency of travel. However, this has not resulted in a likelihood rating of more than unlikely.
Therefore, in all cases, while the potential consequences are moderate to high, the likelihood
of these outcomes occurring is typically rare.
Consequently, for the majority of consumables, a release to the environment has been
ranked as a low risk (Class I). Consumables ranked as a medium risk include sulfuric acid
(Class II) with diesel and anhydrous ammonia ranked as high (Class III). Due to their
inherent eco-toxicological characteristics, sulfuric acid, diesel and anhydrous ammonia have
potential for more significant consequence at sensitive locations should a release occur. The
likelihood that a sulfuric acid release event may occur was assessed as unlikely while an
event associated with either diesel or anhydrous ammonia was considered rare.
Within the risks to environmental values and conservation significant species, the transport of
sulfuric acid accounts for 20 of the 25 moderate (Class II) while diesel and anhydrous
ammonia combined, account for 32 of the 47 (Class III) risks (refer Table 12-12).
As with the risk profile for public health and safety, risks to the environment remain the same
whether the Project proceeds or not.
7 As listed under the NT Territory Parks and Wildlife Conservation Act 2006 and Commonwealth Environment Protection
and Biodiversity Conservation Act 1999.
8 The maximum reasonable consequence is the largest realistic or credible consequence from an event, considering the credible failure of controls. It is generally a higher consequence than the "most likely" consequence and less severe than the "worst case" consequence which considers the failure of all controls.
Chapter 12: Transportation
ERA: Proposed Ranger 3 Deeps Underground Mine 12-27
12.8 MITIGATION
ERA has been transporting materials and its product to and from the Ranger mine for more
than 30 years. In that time, ERA has continued to develop transport logistics management,
consistent with regulatory requirements and leading industry practice. The Project will utilise
the same consumables and product transport requirements as used for existing operations,
although consumables quantities will vary.
ERA recognises the importance of road safety through its current risk management activities
and collaboration with transport providers and the NT Department of Transport. In 2012, this
proactive approach to traffic risk management was nationally recognised, with ERA receiving
the Australian Road Safety Foundation's Award for Outstanding Achievement at the Australia
Road Safety Awards.
While current controls are commensurate with the company's traffic risk profile, ERA seek to
continuously improve upon existing practices to mitigate risks that may be more specific to
particular hazards. These include wandering stock and a high proportion of international
(tourist) road users.
As a core business activity, ERA undertakes a rigorous assessment and ongoing evaluation
of contractors who carry out transport activities for Ranger mine operations. Contractor
management seeks to ensure that contractors either meet or exceed regulatory and industry
standards. The controls and the management strategies which underpin this will continue to
be employed for the Project.
There are a range of pre-existing management practices and mitigation measures which are
a fundamental aspect of current transport logistics for the Ranger mine. These same controls
will be utilised for the Project, as described below.
The Bow Tie process discussed in Appendix 16 identified a range of controls that limit the
likelihood that a potential traffic incident will occur. The risk assessment did not identify that
further additional or alternate controls would materially reduce the likelihood or consequence
of a hazardous event.
12.8.1 Project Controls
As an outcome of the collaborative Bow Tie process, 142 controls were identified. Controls
have been categorised into the following areas:
� ERA contractor management system;
� Dangerous goods regulations and code of compliance;
� National heavy vehicle accreditation scheme compliance;
� Hazard identification and risk management; and
� Emergency preparedness and response.

Chapter 12: Transportation
ERA: Proposed Ranger 3 Deeps Underground Mine 12-28
12.8.1.1 Contractor Management System
The transport of consumables is undertaken by suppliers and transport providers on behalf of
ERA. ERA has an established contractor management system to ensure that suppliers and
transport providers meet stringent environment, safety, health and legal requirements.
The contractor management system is designed to systematically identify and evaluate the
systems and processes that its potential contractors have in place to meet regulatory and
ERA standards. ERA requires contractors to have the capability and resources to provide a
level of logistical support that minimises risk to the public and the environment to the greatest
extent practicable.
Specifically, the contractor management system requires that suppliers and transport
providers meet both a pre-qualification process and periodic audits that assess their
performance. This ensures that contractor systems continue to align with ERA requirements
for logistical stewardship. This ongoing management and monitoring process is consistent
with the following:
� AS/NZS ISO 14001:2004 Environmental Management Systems;
� AS/NZS 4801:2001 Occupational Health and Safety Management Systems;
� Rio Tinto freight preparation policy; and
� Code of Practice – Safe Transport of Radioactive Material.
(Australian Radiation Protection and Nuclear Safety Agency 2008)
For the complete list of controls applicable to the ERA contractor management system is
provided in Appendix 16.
12.8.1.2 Dangerous Goods Regulations and Code Compliance
The transport of dangerous goods by road in the NT is regulated by NT WorkSafe. In
particular, operators are required to comply with the requirements of the Transport of
Dangerous Goods by Road and Rail (National Uniform Legislation) Regulations. The
regulations detail specific obligations with regard to (National Transport Commission 2011):
� Design, manufacture and licensing of vehicles, tanks, vessels and equipment;
� Training, competence and licensing of drivers;
� Procedures for marking, stowing and restraining materials during transport;
� Emergency equipment, plans and procedures; and
� Powers of NT WorkSafe to suspend or revoke operator licenses and impose penalties.
The regulations also refer to the Australian Code for the Transport of Dangerous Goods by
Road and Rail. This is the leading technical document in the Australian regulatory system
which is aligned with international best practice in dangerous goods management.
The transport of radioactive material has additional requirements. This activity must comply
with the Australian Code of Practice for the Safe Transport of Radioactive Materials and

Chapter 12: Transportation
ERA: Proposed Ranger 3 Deeps Underground Mine 12-29
where applicable, the NT Radioactive Ores and Concentrates (Packaging and Transport) Act
and regulations.
Compliance with the above regulations and codes provide a robust framework to ensure that
dangerous goods are transported in a manner that eliminates or minimises risk so far as is
reasonably practicable. The contractor management system specifies that transport
providers must adhere to the requirements contained with these regulations and codes.
For the complete list of controls applicable to dangerous goods refer to Appendix 16.
12.8.1.3 National Heavy Vehicle Accreditation Scheme
The Commonwealth Government National heavy vehicle regulator manages the National
heavy vehicle accreditation scheme. The scheme enables heavy vehicle transport operators
to gain formal recognition that their operational management systems meet prescribed
performance requirements (National Heavy Vehicle Regulator 2013). In order to gain this
recognition, compliance with the following accreditation modules is required:
� Mass management: designed to prevent a nominated vehicle from operating in excess
of applicable mass limits;
� Maintenance management: designed to ensure nominated vehicles are effectively
maintained in a roadworthy condition and are regularly serviced; and
� Fatigue management: designed to ensure that the effects of driver fatigue for
nominated drivers are effectively managed.
While the National heavy vehicle accreditation scheme is not currently a mandatory
requirement in the NT, ERA have in place contractual arrangements as managed through
our contractor management system which requires that its transport suppliers demonstrate
conformance with the fore mentioned accreditation modules.
For the complete list of controls applicable to the National heavy vehicle accreditation
scheme refer to Appendix 16.
12.8.1.4 Hazard Identification and Risk Management
ERA has in place an existing health, safety and environment framework aligned with AS/ISO
31000 and Rio Tinto's risk management standard, which is applied to all aspects of its
current operations. This approach is contained within ERA's current integrated health, safety
and environment risk register and links identified hazards with controls that mitigate risks to
an acceptable level. ERA's current risk register recognises light vehicle travel as its greatest
safety risk. In addition, loss of containment scenarios while in transit to the Ranger mine are
well defined and managed accordingly.
The pre-qualification evaluation of its transport providers requires them to demonstrate that
they have a systematic risk management system in place. The controls identified in the Bow
Tie process are the result of collaborative hazard identification, risk management and
continuous improvement between ERA and the transport providers, several of which exceed
requirements under road transport legislation, these controls include:

Chapter 12: Transportation
ERA: Proposed Ranger 3 Deeps Underground Mine 12-30
� GPS-based vehicle monitoring which enables 'real time' surveillance of vehicle location
and speed and is able to detect if location specific speed limits are being exceeded;
� A quarterly industry safety briefing between ERA and transport providers, which
provides a forum to collaboratively engage in transport related issues and the
identification of opportunities for safety improvement;
� Ongoing monitoring of light vehicle travel between Darwin and Ranger mine. This travel
is logged at the Bark Hutt mandatory rest stop.
� The ERA light vehicle committee review road conditions and identify opportunities to
further enhance existing controls where travel between Darwin and Ranger mine
cannot be undertaken by air.
For further information on controls associated with hazard identification and risk
management refer to Appendix 16.
12.8.1.5 Emergency Preparedness and Response
An emergency preparedness plan is designed to provide an effective response in the event
of an emergency. The extent of the response provided depends upon the characteristics of
the consumable or product being transported, the incident type and the potential impacts that
the incident may give rise to.
The pre-qualification process for transport providers requires, emergency response plans
that are appropriate to foreseeable incident scenarios to be in place. These plans are verified
through ongoing audits and conformance checks and augmented by ERA's emergency
response plans which address the types of incident scenarios that the traffic risk assessment
has considered. These plans form part of ERA's business resilience framework which take
into consideration a range of emergency response scenarios. Elements of these plans are
simulated during business resilience exercises in order to test their effectiveness and identify
opportunities to further improve response to incident management.
In addition to specific response strategies, the transport route passes through a number of
emergency service jurisdictions, each with its own disaster management strategy and team.
Depending on the scale of the incident, these teams have the necessary resources and
capability to deploy as required and assist in a range of emergency scenarios.
For further information on controls associated with emergency preparedness refer to
Appendix 16.
12.8.2 Controls Effectiveness
An assessment of the effectiveness of the identified controls was undertaken based on the
following:
� Controls that either prevent or mitigate a hazardous event; and
� The reliability of controls as managed through pre-qualification evaluations and qualification reviews as part of ERA's contractor management system.

Chapter 12: Transportation
ERA: Proposed Ranger 3 Deeps Underground Mine 12-31
12.8.2.1 Controls Compliance
The Bow Tie diagrams for the identified risk events highlight current controls and their role in
preventing an event from occurring, or mitigating the impact once an event has occurred.
These controls were identified from the collective experience of transport providers and
consumable suppliers, supplemented by knowledge of the consumables deliveries for
existing operations at the Ranger mine.
The Bow Tie diagrams demonstrate that for each of the identified risk events, multiple layers
of protection are in place. These include equipment design, procedures, preventative
maintenance programs and emergency response processes. The current controls comply
with, and in some cases exceed legislative requirements, codes of practice, voluntary
accreditation schemes and the risk management practices of the transport industry.
A complete list of controls is provided in Appendix 16.
12.8.2.2 Controls Reliability
The second aspect in assessing controls is to check that the controls are reliable and
achieve their intended function. ERA's risk management framework and the systematic
approach to contractor management, ensures that controls are consistent with regulatory
requirements, and commensurate with ERA's traffic risk profile. A smaller set of controls is
administered directly by government or statutory authorities.
The ongoing reliability of controls and their continued application is achieved through
contractor review and third party auditing. ERA's pre-qualification process requires
contractors to demonstrate that systems are in place to monitor health, safety and
environmental performance through regular inspection and auditing protocols. This approach
is consistent with recognised integrated management systems.
12.9 SUMMARY
The Project will utilise the current road transport network and requires the same
consumables as those currently used for existing Ranger operations, although the quantities
will vary. The characteristics of these consumables are well understood, and their
management is, and will continue to be, commensurate with ERA's understanding and
experience.
The total traffic volume for the Ranger mine is anticipated to consist of up to 20 round trips
per day, of which, the Project will contribute 6 round trips. The route capacity assessment
has determined that these volumes, in addition to forecast other user traffic movement, are
well within the capacity of the road transport network.
The traffic impact assessment considered risks to threatened and migratory species as
identified under the EPBC Act and the Territory Parks and Wildlife Conservation Act, along
with risks to public health and safety. It identified locations along the transport study corridor
that are of greater environmental sensitivity to a spillage of consumables/product or
associated with greater than average crash rates. The relative consequence of these events
has been informed by expertise in transport logistics, and ecological impact assessment.

Chapter 12: Transportation
ERA: Proposed Ranger 3 Deeps Underground Mine 12-32
The likelihood of incidents involving public health and safety, environmental values and
species of conservation significance has been quantified using available traffic data. For
each of the event scenarios considered, using both relevant consequence and quantified
likelihood, risk rankings have been derived.
Extensive preventative and mitigation strategies are currently in place around the transport of
hazardous and dangerous goods and light vehicle travel to and from the Ranger mine. These
controls comply with, and in some cases exceed legislative requirements, codes of practice,
voluntary accreditation schemes and the risk management practices of the transport industry.
These same controls will continue to be employed by the Project. In addition to these
established controls, ERA collaboratively engages with its suppliers, transport providers and
the NT Department of Transport to discuss transport risks, and identify opportunities to
further improve road safety.
The risk assessment identified a total 246 risks across listed threatened and migratory
species, environmental values, and public health and safety. The total number of risks for
listed threatened and migratory species and environmental values is an outcome of
assessing the same risk event at up to 14 separate locations. For example, in consideration
of a release event, for listed threatened and migratory species, diesel was assessed at 14
locations while anhydrous ammonia was assessed at 7 locations. Similarly, the total number
of risks to public safety is an outcome of assessing a primary and secondary event
associated with each of the 14 consumables/product for the entire study road corridor.
The residual risk profile indicates 47 Class III risks and 4 Class IV risks. Of the
consumables/materials and incident scenarios considered, there were no catastrophic
consequences to listed threatened and migratory species or environmental values. The
likelihood of an event associated with threatened and migratory species or environmental
values was assessed as rare in the majority of cases and consequently there were no critical
(Class IV) risks to listed threatened and migratory species or environmental values. Class IV
risks were identified for public health and safety where there is potential for a catastrophic
outcome should a vehicles collision occur.
The remainder of residual risk rankings were either Class I or Class II. The total number of
risks reflects the assessment of a range of consumables at a number of locations for each of
the sensitive receptors considered.
The Project does not materially alter the existing transport risk profile. These risks remain
materially the same whether the Project proceeds or not. The assessment did not identify
any additional controls that would significantly influence these risks. The current controls will
continue to be maintained for the Project, providing a high level of ongoing protection to the
public and the environment.

Chapter 12: Transportation
ERA: Proposed Ranger 3 Deeps Underground Mine 12-33
12.10 REFERENCES
Australian Radiation Protection and Nuclear Safety Agency (2008) Code of Practice - Safe Transport of Radioactive Material. Radiation Protection Series No.2. Australian Capital Territory, ARPANSA Chief Executive Officer.
Battelle (2001) Comparative Risks of Hazardous Materials and Non-Hazardous Materials Truck Shipment Accidents/Incidents, Prepared for Federal Motor Carrier Safety Administration, Columbus Ohio, p 190.
Department of Sustainability Enviornment Water Population and Communities (2012) The Nationally Protected Arnhem Plateau Sandstone Shrubland Complex, viewed 18 November 2013, <http://www.environment.gov.au/system/files/resources/25cdd612-df01-4f66-ae52-81b591f1b3fc/files/arnhem-plateau-shrubland-complex-factsheet.pdf >.
National Heavy Vehicle Regulator (2013) Safety, Accreditation and Compliance, viewed 18 November 2013, <http://www.nhvr.gov.au/safety-accreditation-compliance >.
National Transport Commission (2011) Australian Code for the Transport of Dangerous Goods by Road and Rail, seventh edition. Melbourne, Victoria, National Transport Commission.
Territory Asset Management Services (TAMS) Pty Ltd (2012) Annual Traffic Report, Prepared for the Northern Territory Department of Transport, viewed 18 November 2013, <http://www.transport.nt.gov.au/publications/traffic-reports >.