chapter 10: the programme for international student
TRANSCRIPT
5555
The Programme for International Student Assessment (PISA) was started in 2000 by the Organization for Economic Co-operation and Development (OECD) to assess student ability in reading literacy, mathematics literacy, and scientific
literacy. PISA occurs every three years and 2012 marked the fifth time PISA was administered. In 2012, over half a million 15-year-old students, including 21,000 Canadians, were assessed. Provincially, approximately 1,313, students from 56 schools took part in PISA (Brochu, Deussing, Houme & Chuy, 2012, p. 12)
During each testing cycle, one of the three subject areas assessed (i.e., reading, mathematics or science) is considered a major domain and the other two are minor domains. The subject area identified as the major domain for that year involves a more intensive assessment. This allows information to be provided on several sub-domains. For example, the main focus of in 2012 was mathematics. This was assessed through:
• Three mathematics processes: formulating situations mathematically; employing mathematical concepts, facts, procedures, and reasoning; and interpreting, applying, and evaluating mathematical outcomes;
• Four content areas: quantity, space and shape, change and relationships, and uncertainty and data; and
• Four contexts: personal, educational, societal, and scientific.
Information in this chapter was obtained from Measuring Up: Canadian Results of the OECD PISA Study published by Council of Ministers of Education, Canada. This report can be viewed at http://www.cmec.ca/252/Programs-and-Initiatives/Assessment/Programme-for-International-Student-Assessment-%28PISA%29/PISA-2012/index.html
ChapTer 10: The programme for inTernaTional sTudenT assessmenT
56
Scoring
Two scores can be derived from the PISA assessment data: the mean (or average) score and student proficiency. Proficiency is ranked on a scale from a low of one to six. These proficiency levels are defined in Appendix B. Based on performance, each student is assigned to the highest proficiency level for which s/he would be expected to answer the majority of the assessment questions correctly.
Confidence intervals were used to determine if differences among the provinces were significantly different. PISA uses a 95% confidence interval to represent the actual high and low end points where the actual mean score should fall 95% of the time. Differences were determined to be significantly different if the respective confidence intervals do not overlap. If the confidence intervals overlap then the differences are not considered to be significant.
Assessing mathematical literacy
In 2012, PISA focused on assessing a student’s ability to use mathematical content and language in age appropriate contexts for 15-year-olds. Specifically, mathematical literacy is defined as “an individual’s capacity to formulate, employ, and interpret mathematics in a variety of contexts. It includes reasoning mathematically and using mathematical concepts, procedures, facts, and tools to describe, explain, and predict phenomena. It assists individuals to recognize the role that mathematics plays in the world and to make the well-founded judgments and decisions needed by constructive, engaged and reflective citizens” (Brochu et al, 2012, p. 15).
Since mathematics was the major domain, student performance was assessed on three additional mathematical processes and four sub-domains. These mathematical processes are used in PISA to describe what individuals do to integrate the context of a problem with mathematics to solve it. They are:
(1) Formulating situations mathematically: being able to recognize and identify opportunities to use mathematics and then provide mathematical structure to a problem presented in some contextualized form by translating it into a mathematical form.
(2) Employing mathematical concepts, facts, procedures, and reasoning: being able to employ these elements to solve mathematically formulated problems.
(3) Interpreting, applying, and evaluating mathematical outcomes: being able to reflect upon mathematical solutions, results, or conclusions and interpret them in the context of real-life problems.
5757
The four sub-domains assessed included:
(1) Change and Relationships - the study of temporary and permanent relationships among phenomena, where changes occur within systems of interrelated objects or phenomena when the elements influence one another.
(2) Space and Shape relates to visual phenomena that are encountered everywhere in our world: patterns, properties of objects, positions and orientations, representations of objects, decoding and encoding of visual information, navigation, and dynamic interaction with real shapes and representations.
(3) Quantity involves understanding measurements, counts, indicators, relative size, and numerical trends and patterns. Mathematical literacy in the area of Quantity relies heavily on knowledge and processes related to numbers, applied in a wide variety of settings.
(4) Uncertainty and Data involves recognizing the place of variation in processes, having a sense of the quantification of that variation, acknowledging uncertainty and error in measurement, and knowing about chance. In the traditional areas of probability and statistics, it provides means of describing, modelling, and interpreting uncertainty phenomena, and of making inferences.
58
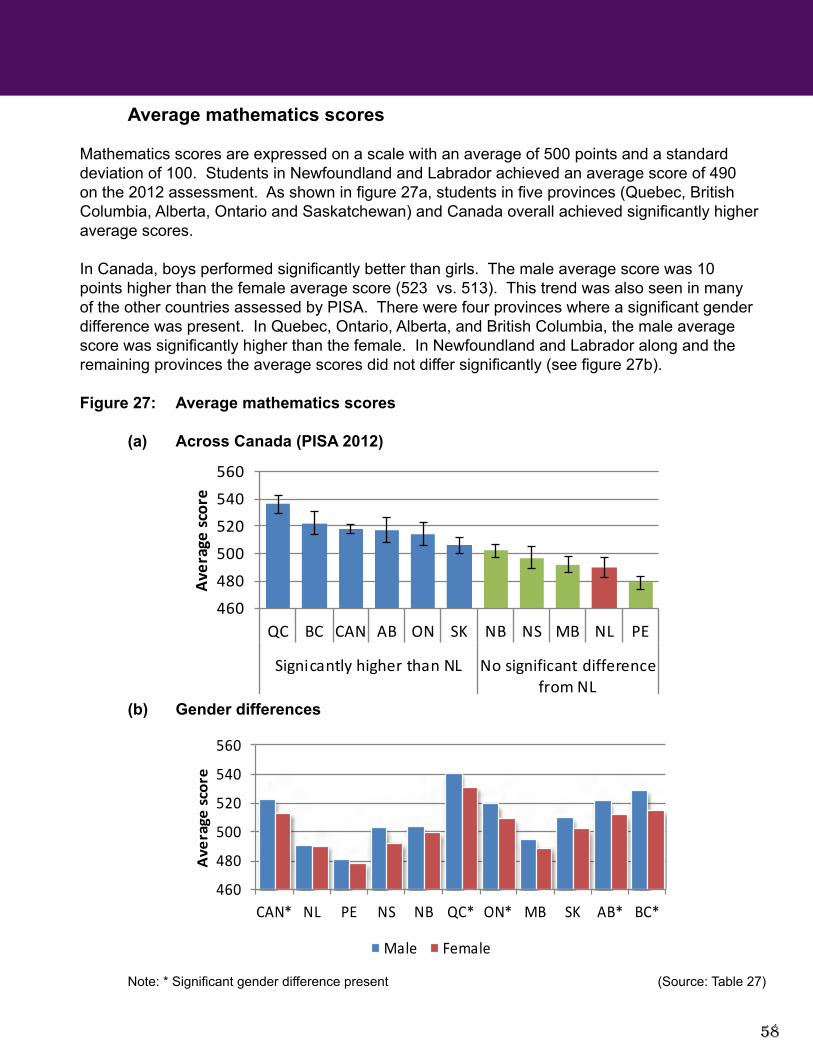
Average mathematics scores
Mathematics scores are expressed on a scale with an average of 500 points and a standard deviation of 100. Students in Newfoundland and Labrador achieved an average score of 490 on the 2012 assessment. As shown in figure 27a, students in five provinces (Quebec, British Columbia, Alberta, Ontario and Saskatchewan) and Canada overall achieved significantly higher average scores.
In Canada, boys performed significantly better than girls. The male average score was 10 points higher than the female average score (523 vs. 513). This trend was also seen in many of the other countries assessed by PISA. There were four provinces where a significant gender difference was present. In Quebec, Ontario, Alberta, and British Columbia, the male average score was significantly higher than the female. In Newfoundland and Labrador along and the remaining provinces the average scores did not differ significantly (see figure 27b).
Figure 27: Average mathematics scores
(a) Across Canada (PISA 2012)
(b) Gender differences
Note: * Significant gender difference present (Source: Table 27)
460
480
500
520
540
560
QC BC CAN AB ON SK NB NS MB NL PE
Signicantly higher than NL No significant differencefrom NL
Aver
age
scor
e
460
480
500
520
540
560
CAN* NL PE NS NB QC* ON* MB SK AB* BC*
Ave
rage
sco
re
Male Female
5959
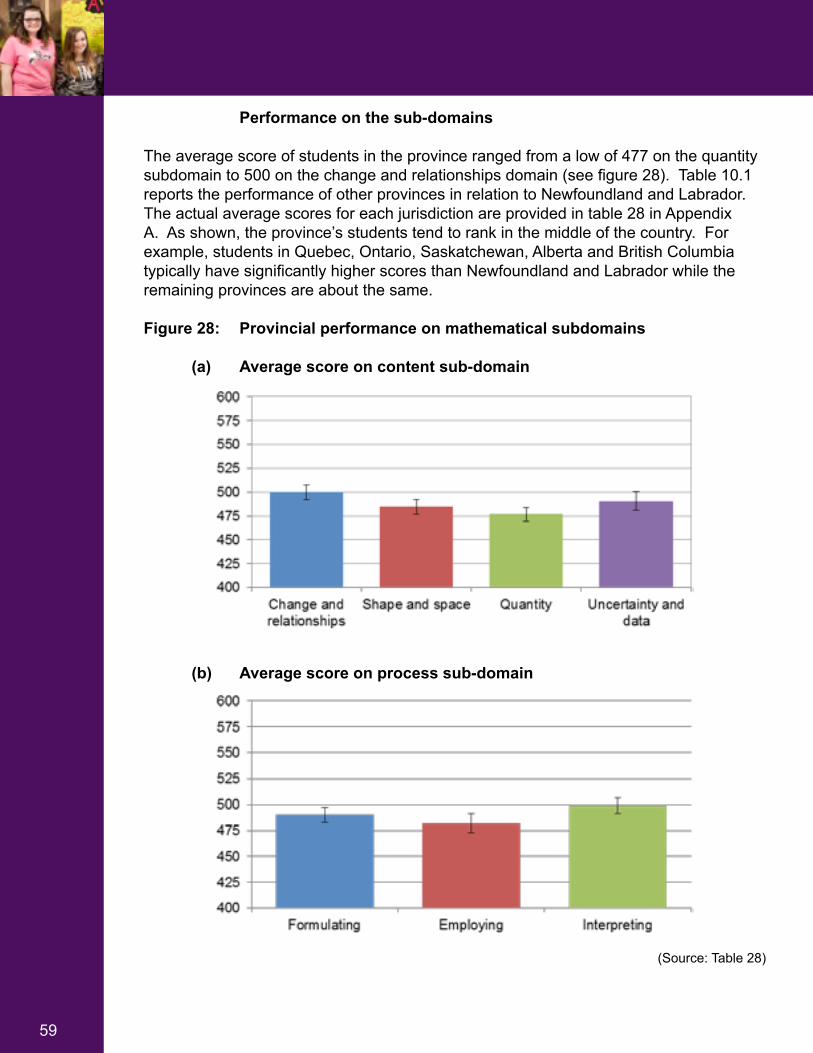
Performance on the sub-domains
The average score of students in the province ranged from a low of 477 on the quantity subdomain to 500 on the change and relationships domain (see figure 28). Table 10.1 reports the performance of other provinces in relation to Newfoundland and Labrador. The actual average scores for each jurisdiction are provided in table 28 in Appendix A. As shown, the province’s students tend to rank in the middle of the country. For example, students in Quebec, Ontario, Saskatchewan, Alberta and British Columbia typically have significantly higher scores than Newfoundland and Labrador while the remaining provinces are about the same.
Figure 28: Provincial performance on mathematical subdomains
(a) Average score on content sub-domain
(b) Average score on process sub-domain
(Source: Table 28)

60
Table 10.1: Significant differences in average scores between Newfoundland and Labrador and other jurisdictions
(a) Content subdomain
Significantly higher than NL
No significant difference from NL
Significantly lower than NL
Change and Relationships
CanadaQuebecOntario
SaskatchewanAlberta
British Columbia
Prince Edward IslandNova Scotia
New BrunswickManitoba
**
Space and Shape
CanadaNew Brunswick
QuebecOntario
SaskatchewanAlberta
British Columbia
Nova ScotiaManitoba Prince Edward Island
Quantity
CanadaNew Brunswick
QuebecOntario
SaskatchewanAlberta
British Columbia
Prince Edward IslandNova Scotia
Manitoba**
Uncertainty and Data
CanadaQuebecOntario
SaskatchewanAlberta
British Columbia
Prince Edward IslandNova Scotia
New BrunswickManitoba
**
6161
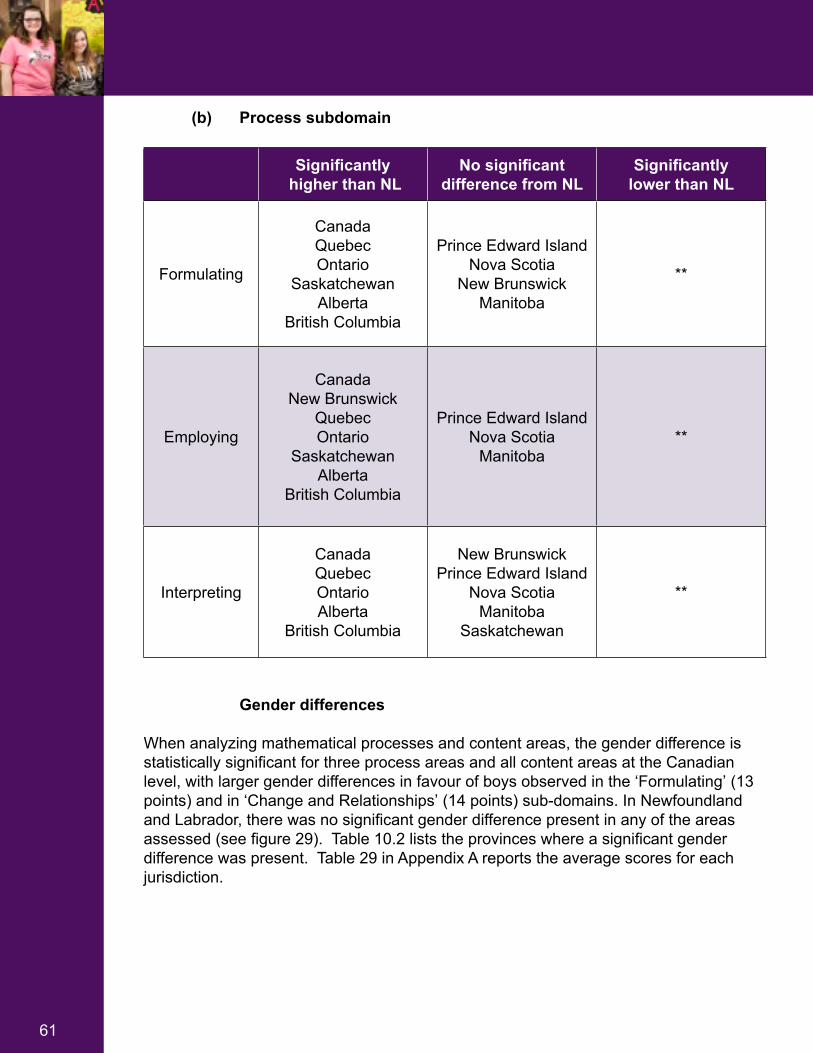
(b) Process subdomain
Significantly higher than NL
No significant difference from NL
Significantly lower than NL
Formulating
CanadaQuebecOntario
SaskatchewanAlberta
British Columbia
Prince Edward IslandNova Scotia
New BrunswickManitoba
**
Employing
CanadaNew Brunswick
QuebecOntario
SaskatchewanAlberta
British Columbia
Prince Edward IslandNova Scotia
Manitoba**
Interpreting
CanadaQuebecOntarioAlberta
British Columbia
New BrunswickPrince Edward Island
Nova ScotiaManitoba
Saskatchewan
**
Gender differences
When analyzing mathematical processes and content areas, the gender difference is statistically significant for three process areas and all content areas at the Canadian level, with larger gender differences in favour of boys observed in the ‘Formulating’ (13 points) and in ‘Change and Relationships’ (14 points) sub-domains. In Newfoundland and Labrador, there was no significant gender difference present in any of the areas assessed (see figure 29). Table 10.2 lists the provinces where a significant gender difference was present. Table 29 in Appendix A reports the average scores for each jurisdiction.
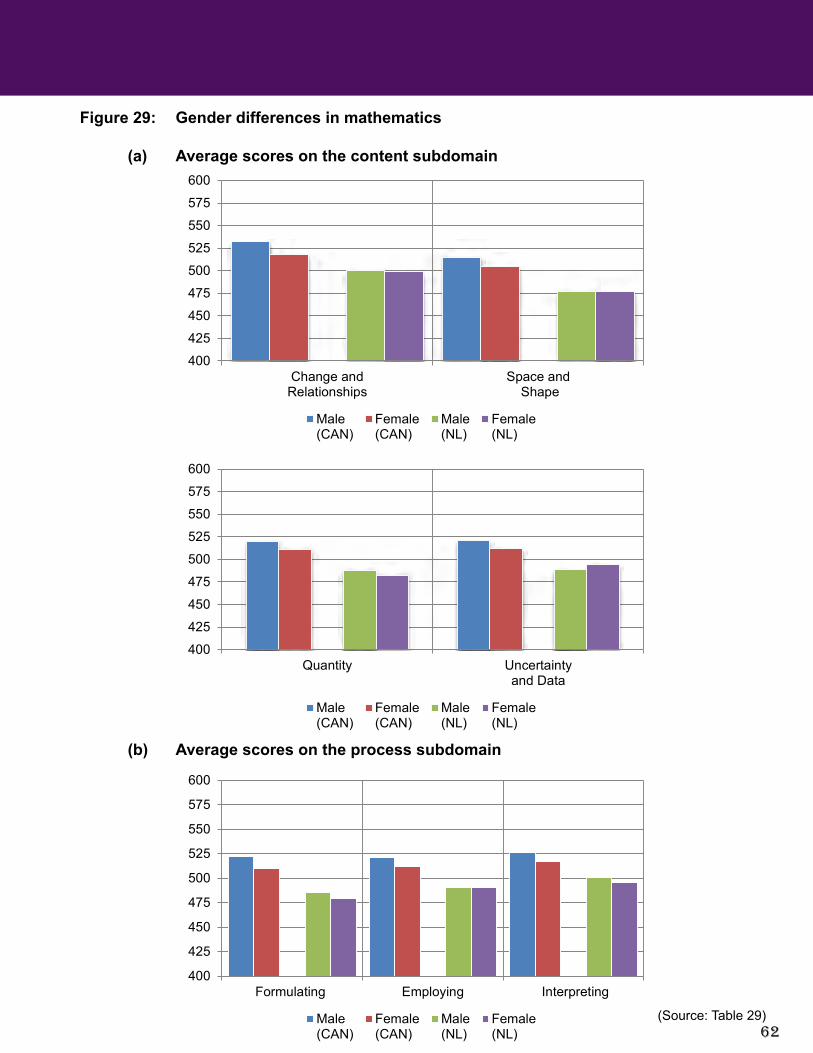
62
Figure 29: Gender differences in mathematics
(a) Average scores on the content subdomain
(b) Average scores on the process subdomain
(Source: Table 29)
400
425
450
475
500
525
550
575
600
Quantity Uncertaintyand Data
Male(CAN)
Female(CAN)
Male(NL)
Female(NL)
400
425
450
475
500
525
550
575
600
Change andRelationships
Space and Shape
Male(CAN)
Female(CAN)
Male(NL)
Female(NL)
400
425
450
475
500
525
550
575
600
Formulating Employing Interpreting
Male(CAN)
Female(CAN)
Male(NL)
Female(NL)
6363
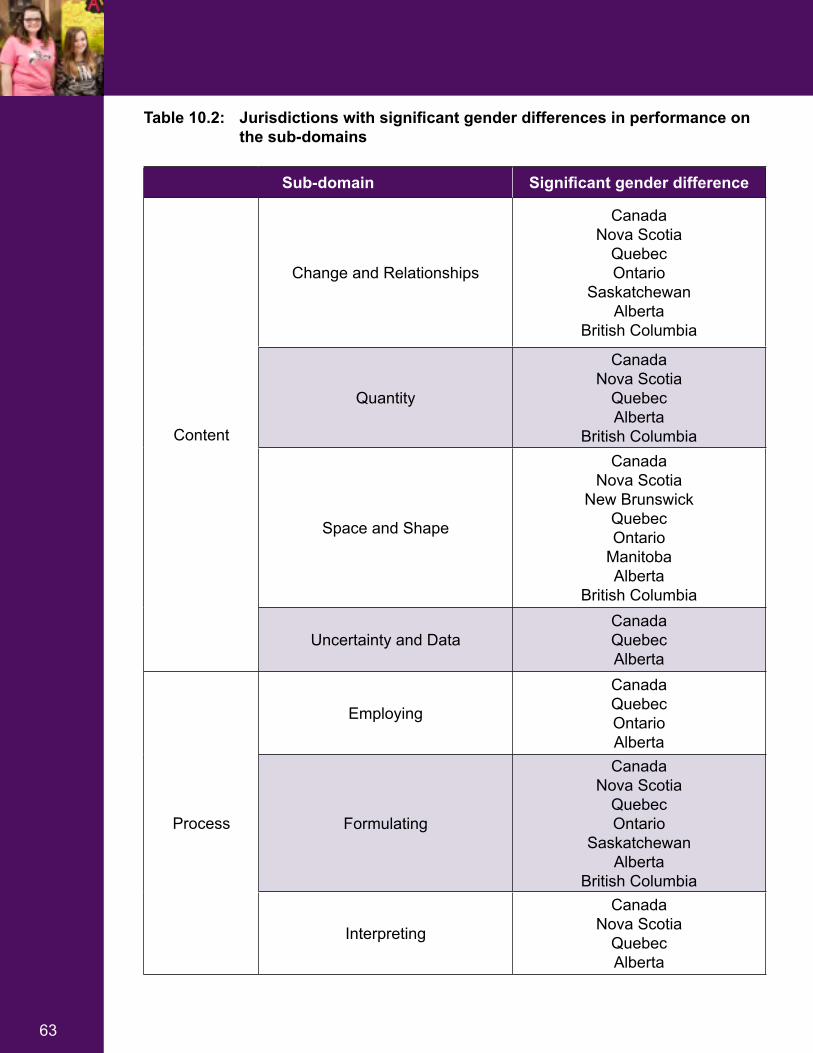
Table 10.2: Jurisdictions with significant gender differences in performance on the sub-domains
Sub-domain Significant gender difference
Content
Change and Relationships
CanadaNova Scotia
QuebecOntario
SaskatchewanAlberta
British Columbia
Quantity
CanadaNova Scotia
QuebecAlberta
British Columbia
Space and Shape
CanadaNova Scotia
New BrunswickQuebecOntario
ManitobaAlberta
British Columbia
Uncertainty and DataCanadaQuebecAlberta
Process
Employing
CanadaQuebecOntarioAlberta
Formulating
CanadaNova Scotia
QuebecOntario
SaskatchewanAlberta
British Columbia
Interpreting
CanadaNova Scotia
QuebecAlberta
64
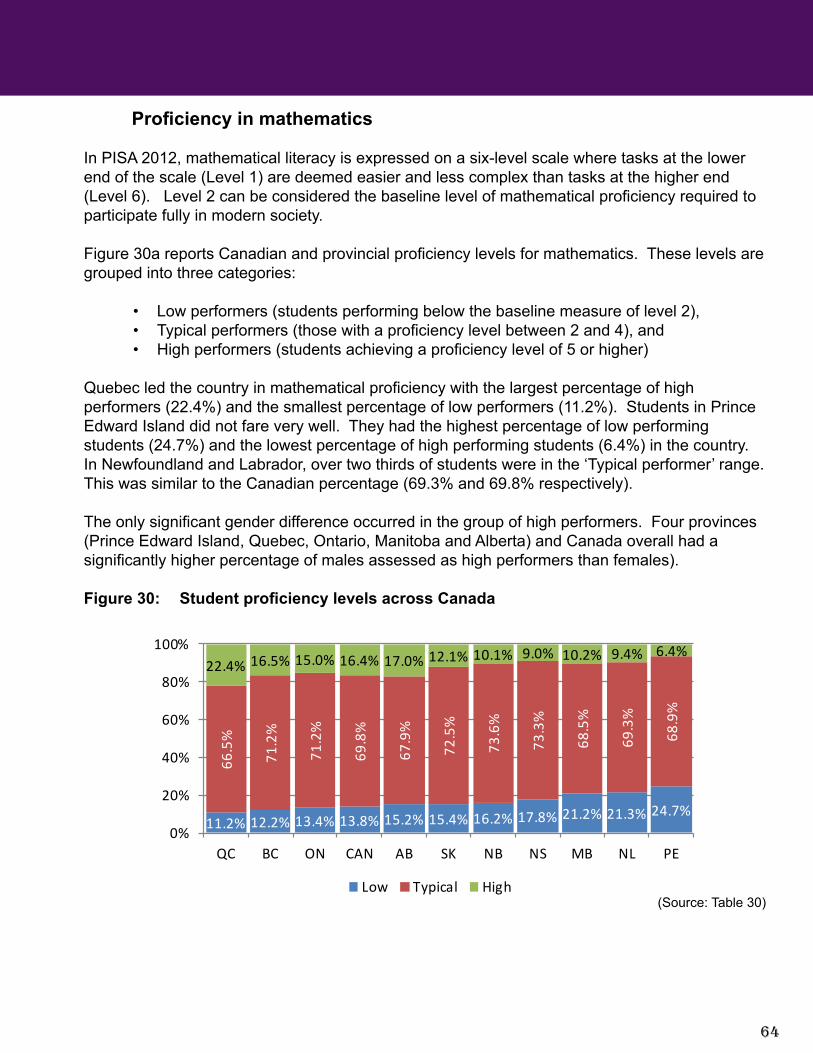
Proficiency in mathematics
In PISA 2012, mathematical literacy is expressed on a six-level scale where tasks at the lower end of the scale (Level 1) are deemed easier and less complex than tasks at the higher end (Level 6). Level 2 can be considered the baseline level of mathematical proficiency required to participate fully in modern society.
Figure 30a reports Canadian and provincial proficiency levels for mathematics. These levels are grouped into three categories:
• Low performers (students performing below the baseline measure of level 2), • Typical performers (those with a proficiency level between 2 and 4), and• High performers (students achieving a proficiency level of 5 or higher)
Quebec led the country in mathematical proficiency with the largest percentage of high performers (22.4%) and the smallest percentage of low performers (11.2%). Students in Prince Edward Island did not fare very well. They had the highest percentage of low performing students (24.7%) and the lowest percentage of high performing students (6.4%) in the country. In Newfoundland and Labrador, over two thirds of students were in the ‘Typical performer’ range. This was similar to the Canadian percentage (69.3% and 69.8% respectively).
The only significant gender difference occurred in the group of high performers. Four provinces (Prince Edward Island, Quebec, Ontario, Manitoba and Alberta) and Canada overall had a significantly higher percentage of males assessed as high performers than females).
Figure 30: Student proficiency levels across Canada
(Source: Table 30)
11.2% 12.2% 13.4% 13.8% 15.2% 15.4% 16.2% 17.8% 21.2% 21.3% 24.7%
66.5
%
71.2
%
71.2
%
69.8
%
67.9
%
72.5
%
73.6
%
73.3
%
68.5
%
69.3
%
68.9
%22.4% 16.5% 15.0% 16.4% 17.0% 12.1% 10.1% 9.0% 10.2% 9.4% 6.4%
0%
20%
40%
60%
80%
100%
QC BC ON CAN AB SK NB NS MB NL PE
Low Typical High
6565
Assessing reading and scientific literacy
In PISA 2012, reading and science were the minor domains with less time devoted to assessing student performance in these areas. Due to this, only the average scores were calculated.
To assess reading, PISA uses the concept of reading literacy. This is “an individual’s capacity to understand, use reflection on, and engage with written texts, in order to achieve one’s goals, develop one’s knowledge and potential, and participate in society” (Brochu, 2012, p. 33). For science, PISA assesses scientific literacy which is defined as “an individual’s scientific knowledge and use of that knowledge to identify questions, acquire new knowledge, explain scientific phenomena and draw evidence based conclusions about science-related issues, an understanding of the characteristic features of science as a form of human knowledge and enquiry, an awareness of how science and technology shape our material, intellectual, and cultural environments, and willingness to engage in science-related issues, and with the ideas of science, as a reflective citizen” (Brochu, 2012, p. 33).
Average reading and science scores
Across Canada, the average reading score ranged from 490 in Prince Edward Island to 535 in British Columbia. In Newfoundland and Labrador, the average score was 503. As shown in figure 31a, only British Columbia had a significantly higher score. The average scores seen in the rest of the provinces and Canada were not significantly different.
For science, average scores ranged from 490 in Prince Edward Island to 544 in British Columbia. For Newfoundland and Labrador, the average score was 514. In comparison to the other provinces, two scored significantly higher (British Columbia and Alberta) and one scored significantly lower (Prince Edward Island). The remaining provinces were in the same range as Newfoundland and Labrador’s (i.e., the average scores were not significantly different (see figure 31b).

66
Figure 31: Student performance across Canada
(a) Average score in reading
(b) Average score in science
(Source: Table 31)
Gender differences in reading and science
Overall, girls performed significantly better than boys on the reading in each province across the country (see figure 32a). This was also the case in each of 65 countries who took part in the assessment. This difference ranged from a low of 26 points in British Columbia to 53 points in Newfoundland and Labrador.
Unlike reading, there were no significant gender differences in the science average scores. As shown in figure 32b, there was virtually no gender gap present. In Newfoundland and Labrador the average score was 518 for girls and 510 for boys.

6767
Figure 32: Gender differences in reading and science
(a) Average score in reading
(b) Average score in science
(Source: Table 32)
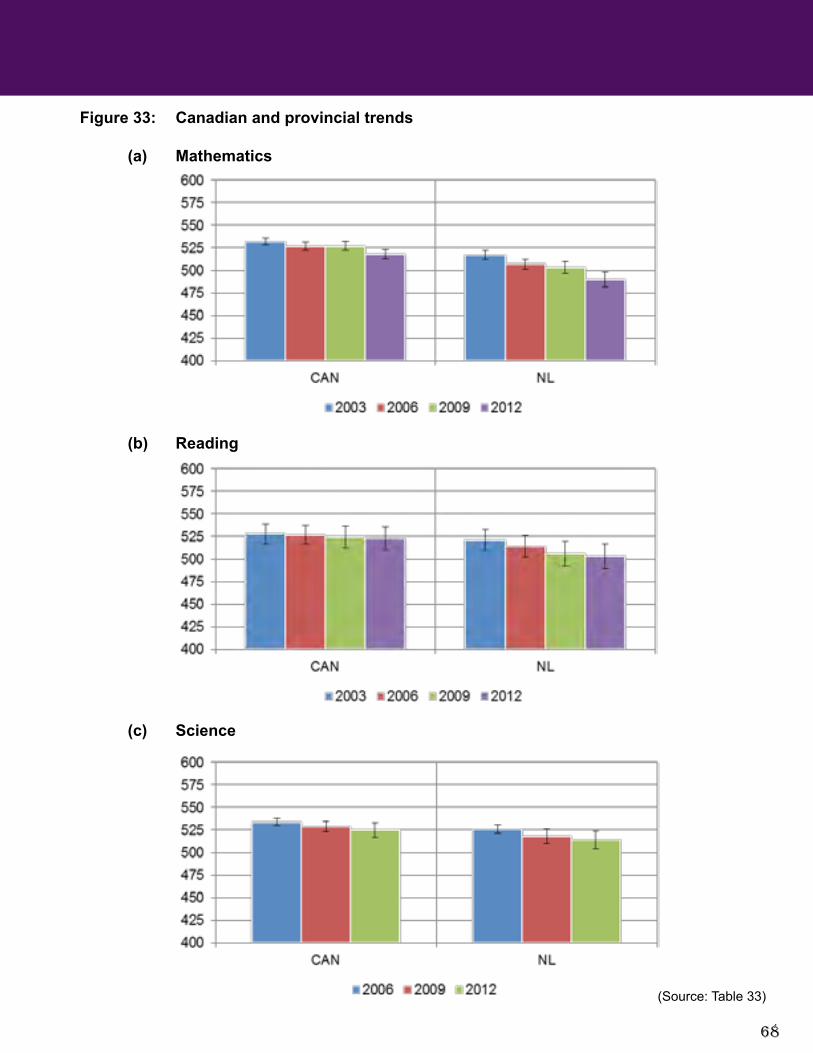
Trends in student performance
With several PISA cycles being completed, multiyear trends across four cycles (from 2003 to 2012) can be examined. Figure 33 shows how students in Newfoundland and Labrador performed in relation to Canada. Table 33 in Appendix A provides information for all of the jurisdictions.
For mathematics, the average score has been on a downward trend in both Canada and many of the provinces. Since 2003, the Canadian average score has declined significantly from 532 to 518 in 2012. The average score declined significantly in all provinces except Quebec and Saskatchewan. The largest declines occurred in Manitoba (36 points), Alberta (32 points), and Newfoundland and Labrador (26 points).
In reading and science, student performance has been consistent for both Canada overall and Newfoundland and Labrador with no significant differences from year to year. For science, only three years of data can be compared,
68
Figure 33: Canadian and provincial trends
(a) Mathematics
(b) Reading
(c) Science
(Source: Table 33)
6969
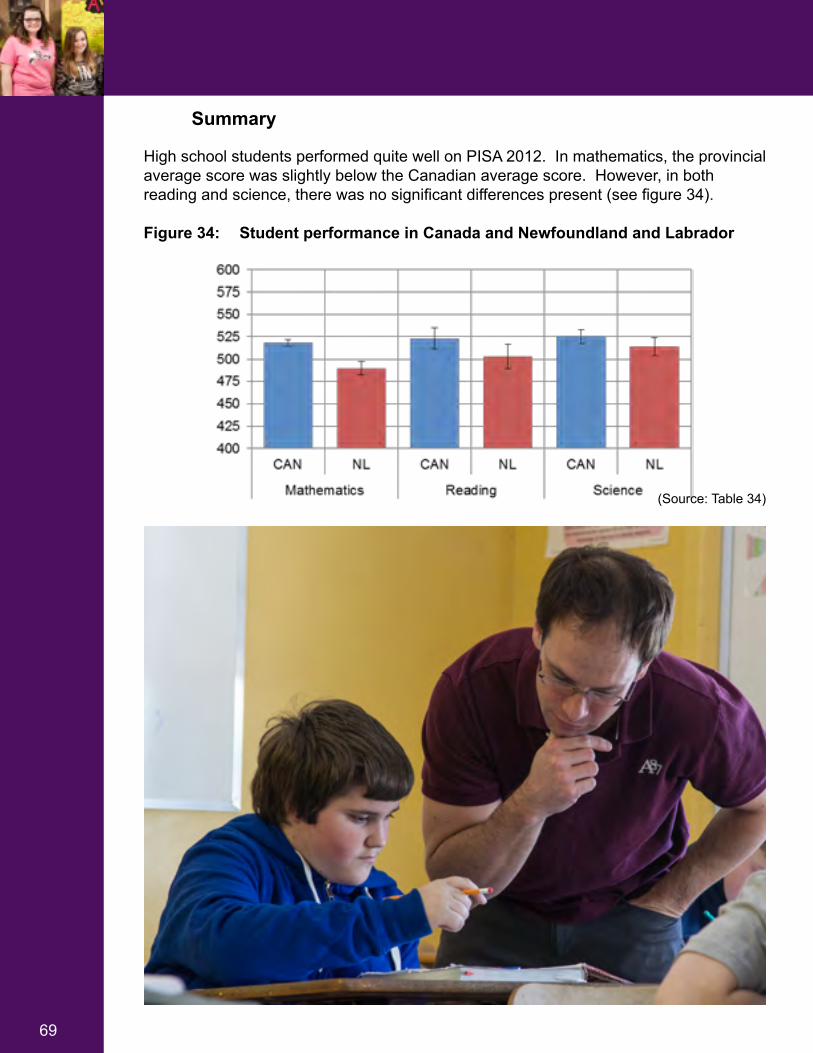
Summary
High school students performed quite well on PISA 2012. In mathematics, the provincial average score was slightly below the Canadian average score. However, in both reading and science, there was no significant differences present (see figure 34).
Figure 34: Student performance in Canada and Newfoundland and Labrador
(Source: Table 34)