chapter 1: national background information · 1 chapter 1: national background information 1.1...
TRANSCRIPT

1
Chapter 1: National Background Information
1.1 Physical and Demographic Context 1.2 Political/ Geographic Structure of the Country 1.3 Industrial and Agricultural Sectors 1.4 Industrial Employment by Major Economic Sectors
1.1 Physical and Demographic Context (Soures of data is statistical yearbook for June 2003 - CAPMAS)
• Location Egypt enjoys a unique geographical location. It is an Arab African country, being situated on the northeastern corner of the African continent. It is also partly an Asian country, being linked to Asia by the Sinai Peninsula, which has always played a vital role over history as a crossing point between the continents of Asia, Africa and Europe. Due to its singular geographical situation, Egypt has always been a connecting link between the world continents. Although Egypt’s position was affected following the discovery of the Cape of Good Hope route, the country later regained its vital role after the digging of the Suez Canal thus representing an ideal gateway to Europe, Africa , MENA region and the rest of the world . Egypt lies between latitudes 22" and 32" and between longitudes 24" and 37" to the east of Greenwich line.
• Geographical Borders Egypt is bounded as follows:
To the north, by the Mediterranean Sea with a 995 km long coast.
To the east, by the Red Sea with a 1941 km long coast.
To the northeast, by 265 km long borders with Palestine and Israel.
To the west, by 1105 km long borders with Libya.
To the south, by 1280 km long borders with Sudan.

2
• Geography of Egypt
The Nile Basin: The River Nile, which is 6690 km long, is the second longest river in the world. It runs through the following countries:
Tanzania
Congo
Burundi
Rwanda
Kenya
Uganda
Ethiopia
Sudan
Egypt
It may be divided into the following climatic regions: -
The Equatorial Plateau, where the weather is hot and rainy the year
round;
The Sudan Valley. Two seasons are distinguished: hot and rainy, and
hot and dry;
The Nubian Desert and Upper Egypt (from Atbara to Cairo): hot and
dry in summer; cold in winter;
Lower Egypt (from Cairo to the Mediterranean): hot and dry in
summer; rainy in winter;
The Ethiopian Plateau: heavy rain in summer;
The Egyptian coasts have total length of approximately 2936 km, of
which 995 km is on the Mediterranean and 1941 km is on the Red
Sea.

3
The Major Geographical Regions are: -
I. The Nile Valley
(4% area of A.R.E.) It begins southern form north of Wadi Halfa to
Mediterranean Sea and it is divided into: -
1. Upper Egypt (Form Wadi Halfa to south of Cairo):
The Nile Valley, south of Aswan is a desert region where the mountainous land
on both sides of the valley is 1000 meters above sea level in the east and 800
meters in the west. This area is an extension of the Sahara Desert, and is the
least fertile part of the Valley .The Nile runs from Aswan to Cairo through a
valley, which is from 2 to 15 km wide. It is widest at Kom Umbou, where it is 15
km wide. On both sides of the Valley, there are chains of rock hills, which are
300 meter above level.
2. Lower Egypt (Extended from south of Cairo to Mediterranean coast in the north):

4
Twenty-five km north of Cairo, the Nile forks into two main branches namely
the Rosetta and Damietta branches between these two branches lays the Delta
which is the most fertile land in the world.

5
II. The Suez Canal Zone:
This Zone extends from the Gulf of Suez to the Mediterranean Sea its length is
about 160 km
III. The Eastern Desert:
(28% of area of Egypt.) It extends from Nile Valley to the Eastern Borders of
Egypt at the Red Sea till Rafah & it is divided into: -
1. The Northern Zone (Sinai desert): Sinai is veritable gateway to Egypt from the east. It is triangular in shape, and
stretches for 400 km from north to south, and 200 km from east to west. It is
generally hot during the summer, stormy and exposed to cold air currents
during the winter.
Sinai is divided into:
i. The Northern Part: Includes the coastal strip, which extends from
Rafah to Port-Said. Water is abundant in this area due to heavy
rainfalls.
ii. The Central Part: This is a steep rocky plateau 3000 feet above sea
level. Water in this part is scarce.
iii. The Southern Part: This is a steep rocky area 10000 feet above sea
level, water are abundant due to heavy rainfall.
2. The Southern Zone: It extends from Southern of Cairo – Suez desert road till the boundaries of
Egypt and Sudan. This is a sterile area characterized by a range of mountains
2000-meters high and stretches along the coast of the Red Sea. It is rich with
minerals and quarries. Kusair, Ghardaka, Ras Gharb and Safaga are small Red
Sea harbours.
IV. The Western Desert:
This desert extends from the Nile Valley in the east to the Egypt-Libyan
boundaries in the north to the southern boundaries of Egypt. It represents two-
thirds of the total land area of Egypt (680000sq km), its average altitude is 500
meters.
The Northern Zone: This is the northern plateau and the region of the Great
Depressions, it includes Siwa Oasis, Qattara Depression, Wadi EI-Natroun and
Baharia Oasis.

6
The Southern Zone: Includes the Farafra, Kharga, Dakhla and Owaynat
Oasis.

7
• Climate Climate is determined by many factors, chief of which are location, terrain and
overall system of atmospheric pressure and water surface. Basically Egypt lies
within the dry tropical region, except for the northern parts that lie within the warm
moderate region, with a climate similar to the Mediterranean region, characterized
by hot dry summers, and moderate winters with little rainfall, increasing along the
coastal areas.
• Water Resources Egypt depends, for its water supply on three fresh water sources namely: surface
water from the River Nile, rain and storm water and subterranean water. While the
Nile remains, for Egypt, as the main source of fresh water, there are additional,
albeit limited resources consisting of the following:
Recycling agricultural drainage water resulting from irrigating cultivated land,
either used as such or mixed with fresh Nile water;
Treated sanitary wastewater;
Quantity of water available for use at present is 61.61 billion cubic meters per
annum, broken down as follows;
53.3 billion cubic meters of Nile water from the Aswan Dam reservoir, to irrigate
cultivated land (old and newly reclaimed);
3.3 billion cubic meters of underground water, in the Delta, Upper Egypt and
Sinai, for drinking purposes;
7.2 billion cubic meters of recycled agricultural drainage water, for non-
consumer purposes;
• Area Egypt has a total area of about 1002000 Sq. kilometers, of which only 35189 Sq.
kilometers, i.e.; 3.6% are populated.
• Population The earliest census in Egypt is dated to be in 3340 BC. In modem times, censuses
began in 1800, when Egypt's population was 2.5 millions.
This estimate was followed by a mid-century 19th count of 4.5 millions.
In 1882, population in Egypt reached 6.7 millions.
In 1996 CAPMAS carried out the twelfth population, Housing and Establishment
Census.

8
The final results of the 1996 Census indicated that, the total population inside
Egypt reached 59.3 millions against 48.3 millions in 1986.
According to the 1996 Census, nearly 40% of the total urban population lived in
Cairo and Alexandria. Cairo, the capital, had a population of nearly 6.8
millions and nearly 3.3 millions in Alexandria.
The population growth rate decreased from 2.8% in the period 1976-1986 to
2.1% in the period 1986-1996.
The estimates of population inside Egypt on 1st of January 2001 reached 64.7
millions and on 1st of July 2003 reached 67.5 millions
The estimates of annual population growth rate in 2001 reached 1.69%
The crude death rate declined from 6.7 per thousand in 1995 to become 6.4 per
thousand in 2002.
Life expectancy at birth for males increased from 62.8 years in 1991 to 67.1 years
in 2001 and from 66.4 years to 71.5 years for females.
The reported crude birth rate declined from 27.9 per thousand in 1995 to 27.4 per
thousand in 2002 (Including Egyptian abroad). ((Statistical year book for year 2002))
The 1996 census by copmpeareson with 1986 census shows the following:
Total number of population as of 1996, is 61492914 against 50405238 according to the
1986 Census, with an increase of 11087676.
Males accounted (30.352million) for 51.2% of the population and females (28.961
million) for 48.8%, reflecting the same percentage of the 1986 census.
The number of people residing within the country rose to 59312914 from 48254238 in
1986; Egyptian expatriates abroad, on temporary immigration basis fell to 2180000
against 2151000 in 1986, in addition to 720000 permanent Egyptian immigrant’s abroad.
According to United Nations’ data, Egypt ranked, in terms of population, seventeenth
among world countries.
Population of Cairo Governorate rise to 6800992 in 1996, with an increase of 720784 at a
percentage of 11.9% compared to the 1986 census. In terms of population, Cairo ranks
the twenty first in the order of world cities. The labor force raised to 17795647
accounting for 35.4%of the total population, compared to 13,400,387 accounting for
34.4% of total population in 1986.
Rate of immigration of population from rural to urban areas decreased by 1 %.

9
Family size decreased to 4.7 persons compared to 4.9 persons according to the 1986
census.

10
Table 1-A: Population Growth Rate
Indicator Rate Year Population Growth Rate
Birth Rate/1000 Mortality Rate /1000 Total Fertility Rate
2.1% 27 6.4 3.4
1996-2000 1999 1999
1996-1998
• Capital Cairo, the capital of Egypt is a time-honored city with an outstanding position among
world capitals. It has an estimated population of 67.3 ranking the seventeenth among
world cities in order of population, and the largest in the Arab world and Africa.
• Language Arabic is the official language of Egypt. Table 1-B: Some Basic Information about Egypt by Census Years (1986 -1996).
Census Years Item 1996 1986
Total population in (000) (excl. Egyptian abroad) 59313 48254 Major cities in urban governorates (Capitals) 4 4 Percentage of population in major cities 18.6 20.2 Number of towns in Lower Egypt (towns and capitals of governorates) 108 90
Number of towns in Upper Egypt (towns and capitals of governorates) 78 70
Percentage of urban population in Lower and Upper Egypt. 23.2 23.1
Number of villages in Lower Egypt. 2468 2467 Number of villages in Upper Egypt. 1664 166.2 Percentage of rural population in Lower and Upper Egypt. 56.8 55.5 Number of towns in frontier governorates 37 31 Percentage of rural population in Lower and Upper Egypt. 1.4 1.2 Total area of Egypt (in 000.sq.km) 1002 1002
Table 1-C: Percentage Distribution of Population by Governorate (1986 and 1996 Censuses)
1986 1996 Governorate
Order Percent to pop Order Percent to pop
Cairo 1 12.58 1 11.50 Alexandria 6 6.06 7 5.60 Port-Said 20 0.83 20 0.90 Suze 21 0.68 21 0.68 Total Urban Gov. 20.15 18.68 Damietta 18 1.54 18 1.54 Dakahlia 3 7.22 4 7.10

11
Sharkia 4 7.08 3 7.20 Kalyoubia 9 5.21 9 5.60 Kafr Al-Sheikh 14 3.75 14 3.70 Al-Gharbia 7 5.98 6 5.70 Al-Monofia 12 4.60 12 4.70 Behera 5 6.73 5 6.73 Ismailia 19 1.13 19 1.20 Total Lower Gov. 43.24 43.47 Al-Giza 2 7.72 2 8.10 Al-Fayoum 15 3.22 15 3.40 Beni Swaif 16 3.00 16 3.10 Menya 8 5.48 8 5.60 Asyout 13 4.59 11 4.70 Sohag 10 5.07 10 5.30 Qena 11 4.10 13 4.10 Aswan 17 1.68 17 1.60 Luxur 22 0.60 22 0.60
Total Upper Egypt Gov. 35.46 36.50 Red Sea 25 0.20 25 0.30 Al-wadi Algdeed 26 0.20 26 0.20 Mersa Matrouh 24 0.30 24 0.40 North Sinai 23 0.40 23 0.40 South Sinai 27 0.10 27 0.10
Total Frontier Egypt Gov. 1.20 1.40
Cairo
Alexan
dria
Port-Said
Suze
1976
1986
19961976
1986
1996
1976 13.85 6.33 0.72 0.53
1986 12.58 6.06 0.83 0.68
1996 11.5 5.6 0.9 0.68
Cairo Alexandria Port-Said Suze
12
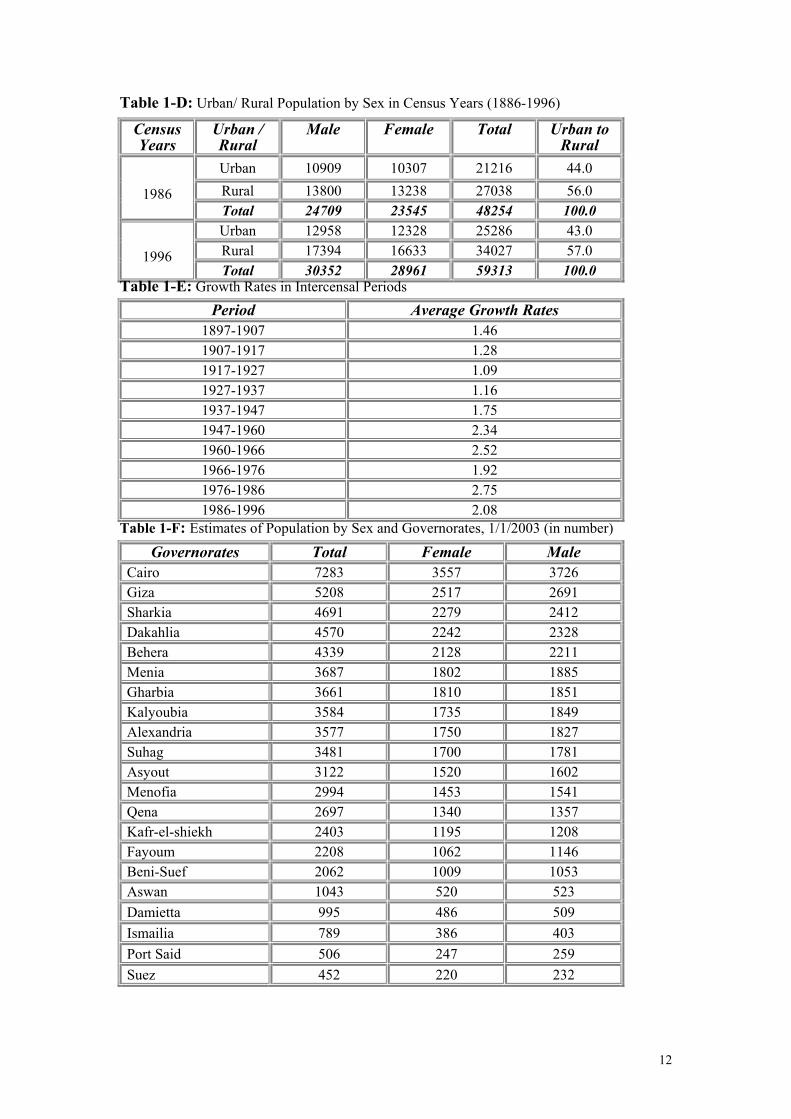
Table 1-D: Urban/ Rural Population by Sex in Census Years (1886-1996)
Census Years
Urban / Rural
Male Female Total Urban to Rural
Urban 10909 10307 21216 44.0 Rural 13800 13238 27038 56.0
1986
Total 24709 23545 48254 100.0 Urban 12958 12328 25286 43.0 Rural 17394 16633 34027 57.0
1996
Total 30352 28961 59313 100.0 Table 1-E: Growth Rates in Intercensal Periods
Period Average Growth Rates 1897-1907 1.46 1907-1917 1.28 1917-1927 1.09 1927-1937 1.16 1937-1947 1.75 1947-1960 2.34 1960-1966 2.52 1966-1976 1.92 1976-1986 2.75 1986-1996 2.08
Table 1-F: Estimates of Population by Sex and Governorates, 1/1/2003 (in number)
Governorates Total Female Male Cairo 7283 3557 3726 Giza 5208 2517 2691 Sharkia 4691 2279 2412 Dakahlia 4570 2242 2328 Behera 4339 2128 2211 Menia 3687 1802 1885 Gharbia 3661 1810 1851 Kalyoubia 3584 1735 1849 Alexandria 3577 1750 1827 Suhag 3481 1700 1781 Asyout 3122 1520 1602 Menofia 2994 1453 1541 Qena 2697 1340 1357 Kafr-el-shiekh 2403 1195 1208 Fayoum 2208 1062 1146 Beni-Suef 2062 1009 1053 Aswan 1043 520 523 Damietta 995 486 509 Ismailia 789 386 403 Port Said 506 247 259 Suez 452 220 232

13
Luxor 392 191 201 North Sinai 280 134 146 Matrouh 240 114 126 Red Sea 172 74 98 El-Wadi El-Gidid 156 75 81 South Sini 60 23 37
Pop inside Egypt 64652 31569 33083 Egyptian’s Abroad 1900 Total population. 66552
Table 1-G: Population Forecasts Broken Down by Sex and Specific Age Groups (1/1/2000)
Age group
Description
Population below 6
Education Age 6-24
Productivity Age
(Working age)
15-64
Old Age 65+
Population (in
thousand)
Male Female Total
4598 4366 8964
13825 12791 26616
18939 18336 37275
1135 1016 2151
% of total population
Male Female Total
14.19 14.12 14.16
42.68 41.38 42.04
58.47 59.32 58.88
3.50 3.29 4.00
Table 1-H: Expectation of Life at Birth, by Sex
YEAR Female Male 1960 53.8 51.6 1976 57.7 52.7 1986 63.5 60.5 1991 66.4 62.8 1996 69.0 56.1 1999 70.5 66.3 2001 71.5 67.1 2006 73.6 69.2 2011 75.5 70.9 2016 77.2 72.5 2021 78.7 73.9
Rate of immigration of population from rural to urban areas decreased by 1%.

14
Family size decreased to 4.6 persons compared to 4.9 persons according to the 1986 census.

15
Education The following results have been achieved due to the efforts excreted in the field of
education. Increasing number of general primary education classes by 5.5 % in 01 / 2002
compared with 94 / 95, and the percentage of AI-Azhar primary classes increased by 19.2 %.
Increasing number of general preparatory classes by 22.8 % in 01/2020 compared with 94 / 95, and increased by 75.5 % in Al-Azhar.
Increasing number of general secondary classes by 32.1 % in 01 / 2002 compared with 94 / 95, and increasing number of classes in AI-Azhar by 58.9 %.
(Soures of data is statistical yearbook for year 2002 - CAPMAS)
Rate of illiteracy dropped by 11%. According to the 1996 census, the number of illiterate persons at the age of ten and above was 17347745 representing, 38.6% of the total population, compared to 17147597 illiterates according to the 1986 Census, representing 49.6%. Table 1-I : Population (10 Years and Over) by Educational Status and Sex in Urban/ Rural
Areas (The final results of the 1996 census) Total Rural Urban Educational
Status Total Female Male Female Male Female Male Illiterate 17646025 11005746 6640279 7721025 4616042 3284721 2024237
Read & Write 8399253 3209817 5189436 151740 2929775 1692677 2259661 Primary 4155224 1829547 2325677 915416 1291568 914131 1034109 Less than University. Certificates (1)
12069101 5026752 7042349 1932839 3397005 3093913 3645344
University 2547995 852998 1694997 121145 442895 731853 1252102
N.S. 13822 6067 7755 3949 4845 2118 2910
TOTAL 44831420 21930927 22900493 12211514 12682130 9719413 10218363
Percentage distribution Illiterate 39.36 50.18 29.00 63.23 36.40 33.80 19.81
Read & Write 18.74 14.64 22.66 12.42 23.10 17.42 22.11 Primary 9.27 8.34 10.16 7.50 10.18 9.41 10.12 Less than University. Certificates (1)
26.92 22.92 30.75 15.83 26.79 31.83 35.67
University 5.68 3.89 7.40 0.99 3.49 7.53 12.25 N.S. 0.03 0.03 0.30 0.03 0.04 0.02 0.03
TOTAL 100.00 100.00 100.00 100.00 100.00 100.00 100.00

16
(1) Excluding primary
1.2 Political/ Geographic Structure of the Country (Soures of data is statistical year book for year 2002 - CAPMAS)
• Country name:
Conventional long form: Arab Republic of Egypt conventional short form: Egypt local long form: Jumhuriyat Misr al-Arabiyah local short form: Misr former: United Arab Republic (with Syria)
• Government type: Republic
• Capital: Cairo, which is the seat of government and is the place where most diplomatic missions, have their offices.
• Administrative divisions: 26 governorates (muhafazat, singular - muhafazah); Al Daqahliyah, Al Bahr al Ahmar, Al Buhayrah, Al Fayyum, Al Gharbiyah, Al Iskandariyah, Al Isma'iliyah, Al Jizah, Al Minufiyah, Al Minya, Al Qahirah, Al Qalyubiyah, Al Wadi al Jadid, Ash Sharqiyah, As Suways, Aswan, Asyut, Bani Suwayf, Bur Sa'id, Dumyat, Janub Sina', Kafr ash Shaykh, Matruh, Qina, Shamal Sina', Suhaj
• [Executive branch: Chief of state: President Mohammed Hosni MUBARAK (since 14 October 1981) head of government: Prime Minister Atef OBEID (since 5 October 1999)
Cabinet: Cabinet appointed by the president Elections:
President nominated by the People's Assembly for a six-year term, the nomination must then be validated by a national, popular referendum; national referendum last held 26 September 1999 (next to be held NA October 2005); prime minister appointed by the president.
• Legislative branch: Bicameral system consists of the People's Assembly or Majlis al-Sha'b (454 seats; 444 elected by popular vote, 10 appointed by the president; members serve five-year terms) and the Advisory Council or Majlis al-Shura - which functions only in a consultative

17
role (264 seats; 176 elected by popular vote, 88 appointed by the president; members serve NA-year terms)
• Elections: People's Assembly - three-phase voting - last held 19 October, 29 October, 8 November 2000 (next to be held NA November 2005); Advisory Council - last held 7 June 1995 (next to be held NA)
• Election results: People's Assembly - percent of vote by party-NDP( National Democratic Party ) 88%, independents 8%, opposition 4%; seats by party - NDP 398, NWP(New wafd party) 7, Tagammu 6, Nasserists 2, LSP( Socialist Liberal party) 1, independents 38, undecided 2; Advisory Council - percent of vote by party - NDP 99%, independents 1%; seats by party - NA
Table 1-J: Percentage of Population and Area by Governorates (1/1/2000): (Soures of data is statistical yearbook for year 2000 – CAPMAS)
Provinces located at North Delta
Governorate Population (%) Total area in (Km2) Cairo 11.5 11.31 2142 19042
Alexandria 5.60 5.55 267936 167550 Al-Behera 6.70 6.72 1012948 694362
Kafr Al-Sheikh 3.80 3.73 343712 374825 Al-Gharbia 5.70 5.68 194221 1942411 Al-Monofia 4.70 4.63 153213 243593 Al-Kalubia 5.60 5.55 100109 107272 Al-Sharkia 7.20 7.24 417955 476428
Al-Dekhailia 7.10 7.08 34709 347100 Damietta 1.50 1.54 58917 66887
Provinces located at Upper Egypt
Governorate Population (%) Total area in (Km2) Al-Giza 8.10 119100
Al-Fayoum 3.40 185600 Beni Swaif 3.10 136941
Menya 5.60 241165 Assiut 4.70 157400 Sohag 5.30 159392 Qena 4.70 174072
Aswan 1.60 100473 Luxur 0.61 22673
Provinces located at Suez Canal Area:
Governorate Population Total area in (Km2)

18
Port Said 0.79 132068 Ismailia 1.22 506696
Suez 0.70 900221

19
Provinces located at Sinai
Governorate Population Total area in (Km2) North Sinai 0.43 405865 South Sinai 0.09 1679100
Provinces located at the Border of the country Governorate Population Total area in (Km2)
Red Sea 0.27 7113 Mersa Matrouh 0.37 171641
Al-wadi Algdeed 0.24 108224
1.3 Industrial and Agricultural Sectors
(Soures of data is statistical year book for year 2000 & year 2002 - CAPMAS)
Industrial & Mining Sector:
Data in this section reflects some achievements in the field of industries. By comparing data of 00/ 2001 with 1995/1996 we can notice the following:
Quantity of iron ore increased by 14 %
Quantity of hydrogenated oil increased by 28 %
Quantity of natural gas increased by 102 %
Quantity of tanned leather increased by 48 %
Sources of data in this section are the Ministry of Industry and related
authorities
The major industries in Egypt are:
Textile and Cotton industry
Mining (Petrol oil, Natural gas, Phosphate, Manganese, Iron)
Fertilizers industries (Phosphate & Nitrogenous fertilizers)
Aluminum industry
Steel and iron industries
Cement industries
Carpet industries
Agricultural Sector:

20
The agricultural sector plays a major role in the structure of the national economy of
Egypt. Agricultural production is closely connected with the livelihood of the people.
In addition, the agricultural exports represent a major part of the foreign trade of
Egypt. Accordingly, the Government initiated programmes for a horizontal expansion
in order to increase the area under cultivation, and a perpendicular expansion, which
increases the yield of the cultivated areas.
The reclaimed area during the period 1952 to 00 /2001 reached 3199 thousand feddan.
The total cultivated areas with winter crops, summer crops and Nile crops were 13188
compared to 12832 and 12000 in 1999 and, 1995 respectively. Moreover, the
production of fish increased by 60% during the comparison period.
The use of agrochemical is decreased than before due to the restricted regulations and
awareness of the public to the harmful impact of chemicals.
Table 1-K: Distributed Insecticides to be used in Agricultural Sector.
Quantity (ton) Governorate
* 2002/01 2001/00 2000/99
Alexandria 1 1 5
Kalyoubia 40 24 18
Menoufia 204 148 112
Gharbia 141 69 52
Kafr- El- Sheikh 259 193 168
Sharkia 198 85 100
Ismailia 3 7 4
Dakahlia 157 72 110
Damietta 23 25 22
Behera 361 308 319
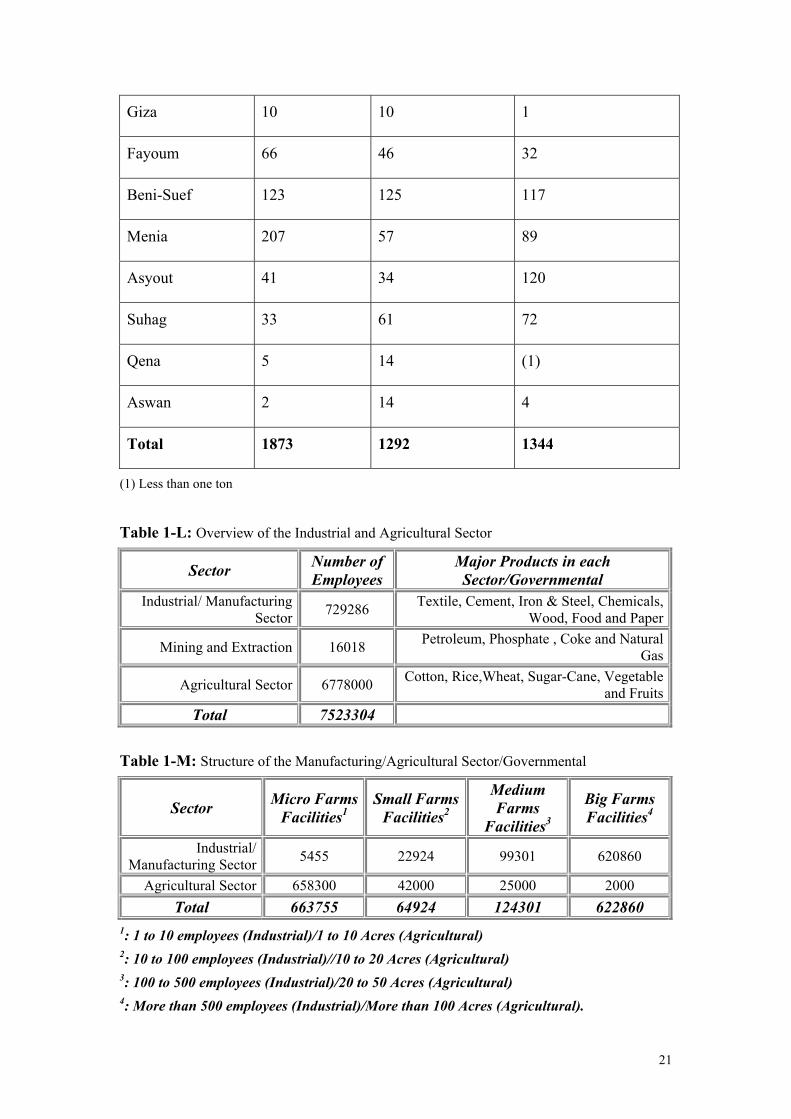
21
Giza 10 10 1
Fayoum 66 46 32
Beni-Suef 123 125 117
Menia 207 57 89
Asyout 41 34 120
Suhag 33 61 72
Qena 5 14 (1)
Aswan 2 14 4
Total 1873 1292 1344
(1) Less than one ton
Table 1-L: Overview of the Industrial and Agricultural Sector
Sector Number of Employees
Major Products in each Sector/Governmental
Industrial/ Manufacturing Sector 729286 Textile, Cement, Iron & Steel, Chemicals,
Wood, Food and Paper
Mining and Extraction 16018 Petroleum, Phosphate , Coke and Natural Gas
Agricultural Sector 6778000 Cotton, Rice,Wheat, Sugar-Cane, Vegetable and Fruits
Total 7523304
Table 1-M: Structure of the Manufacturing/Agricultural Sector/Governmental
Sector Micro Farms Facilities1
Small Farms Facilities2
Medium Farms
Facilities3
Big Farms Facilities4
Industrial/ Manufacturing Sector 5455 22924 99301 620860
Agricultural Sector 658300 42000 25000 2000 Total 663755 64924 124301 622860
1: 1 to 10 employees (Industrial)/1 to 10 Acres (Agricultural) 2: 10 to 100 employees (Industrial)//10 to 20 Acres (Agricultural) 3: 100 to 500 employees (Industrial)/20 to 50 Acres (Agricultural) 4: More than 500 employees (Industrial)/More than 100 Acres (Agricultural).

22
Table 1-N: Services Rendered by the Agrarian Reform co-operative Societies, By Type of Service.
Item 02/01 01/00 00/99 99/98 98/97 97/96 96/95 Seeds 20185 23317 26838 32642 42642 38916 27390
Fertilizers 83724 73582 39967 52477 64180 85187 77192 Insecticides 37566 26634 32778 30574 37697 48609 42043
Total 141475 123533 99583 1155693 144519 172712 146625
Table 1-O : Breakdown of Agricultural Production by Region
Region Major Crops Total Quantity Of Crops 1999
Size of Productive Areas(Feddans) 1999
Delta Cotton 1 3076 539573 Delta&upper Egypt Wheat 2 6.3 1678651
Delta Rice 2 5.6 1501167 Upper Egypt Sugar-Cane 2 13.7 271218
Delta&upper Egypt Vegetables 2 15.2 613732 Delta&upper Egypt Fruits 2 7 429005
1 Metric Qantar in thousands 2 Ton in Million Table 1-P: Breakdown of Industrial Production by Region (1997/1998 for public sector;
1998 for private sector):
No. of Establishments
Value of Production(in 1000 L.E.) No. of Employees
Region
Public Private Public Private Public Private Cairo 262 2135 8241076 12462895 145662 115055 Alexandria 141 1101 9664807 9605785 99474 95036
Port Said 11 94 200477 702142 6352 8783
Suez 12 112 3864070 950853 10767 8287
Damietta 8 102 178696 128992 5366 2618
Dakahlia 34 375 636485 1431275 16607 11379 Sharkia 30 760 291065 10813166 10592 88475 Kalyubia 77 678 4915997 2698249 54458 48146 Kafr.El Sheik 24 153 209560 240423 950 4332 Harbia 44 587 2940081 1286259 58503 27435
Enaufia 17 276 549860 1255614 9049 15527 Behera 45 271 960266 244584 43302 7353 Ismailia 8 100 65033 492696 1365 6648

23
Giza 97 955 3241849 8447853 41326 98763 Beni Suef 14 144 394071 82164 3709 3184 Fayum 12 250 129572 380140 2798 5671
Menia 22 397 437960 117658 6056 6676
Asyut 20 94 2005343 118806 9797 2199 Suhag 10 159 497447 399409 5154 5179 Qena 7 104 2463124 275023 19220 2802 Aswan 14 56 631275 180020 9961 2461 Red Sea 7 13 493353 7265963 3913 6300 El-Wadi El-Gedid 1 14 5911 8218 45 621
Matruh 3 26 145559 1928874 357 2443 South Sinai 1 6 44654 18242 900 140
North Sinai 3 15 96641 3590548 819 3344
Luxur 1 10 8 2836 5 142
Table 1-Q: Some Petroleum Production by Product
(In thousand metric ton)
Product 12/01 01/00 00/99 99/98 98/97 Benzene 5205 2337 2300 2208 2030 Kerosene 928 998 1011 1072 1260 Jet Fuel 900 990 920 939 860 Gas Oil 5809 5552 5989 6007 5889 Fuel Oil 10242 10567 11785 12773 12700 Butane Gas 473 455 486 436 445 Natural Gas 19605 18304 14500 11872 10434 Asphalt 882 881 957 954 714
1.4 Industrial Employment by Major Economic Sectors. (Soures of data is statistical year book for year 2000 - CAPMAS)
Table 1-R: Industrial Employment by Major Economic Sectors (Value in 1000 L.E)
Total Employment Output Value /Year ISIC Rev. 3 Description Public
97/98 Private
98 Public 97/98
Private 98
15 Manufacture of food products 81414 141810 7730745 11970706
16 Manufacture of tobacco products 13662 3779 1913210 289179
17 Manufacture of textiles 169779 89180 3450389 5680221
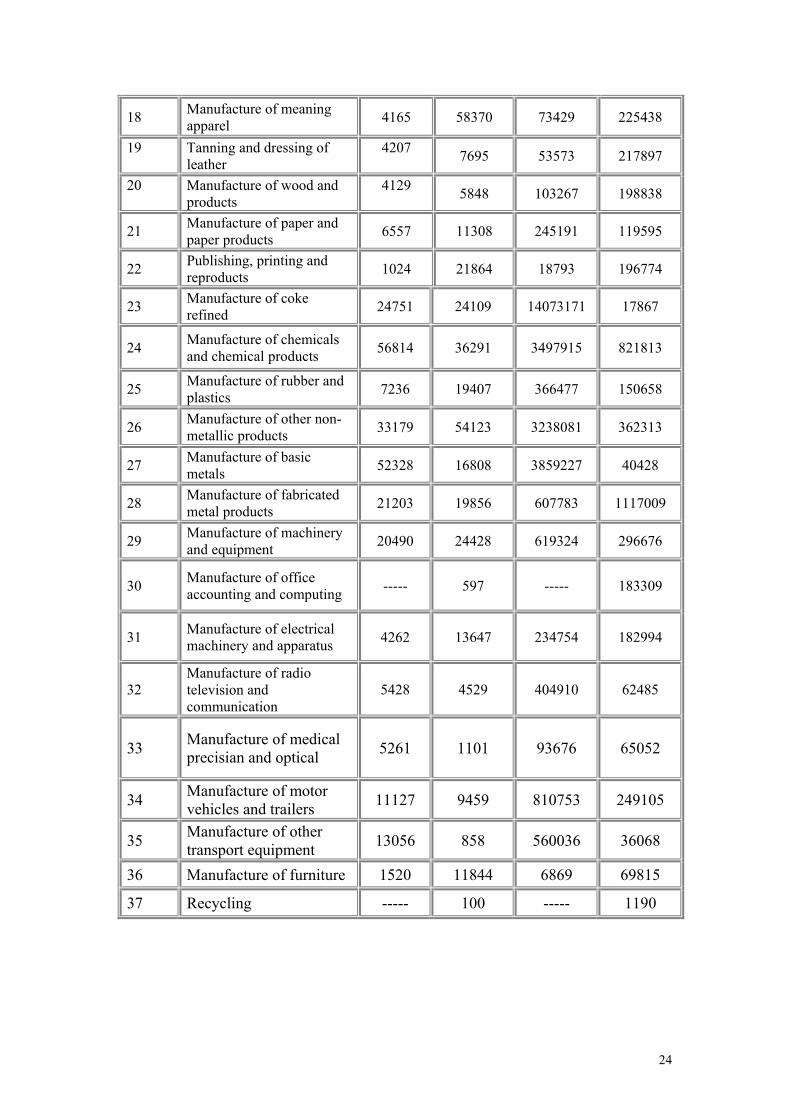
24
18 Manufacture of meaning apparel 4165 58370 73429 225438
19 Tanning and dressing of leather
4207 7695 53573 217897
20 Manufacture of wood and products
4129 5848 103267 198838
21 Manufacture of paper and paper products 6557 11308 245191 119595
22 Publishing, printing and reproducts 1024 21864 18793 196774
23 Manufacture of coke refined 24751 24109 14073171 17867
24 Manufacture of chemicals and chemical products 56814 36291 3497915 821813
25 Manufacture of rubber and plastics 7236 19407 366477 150658
26 Manufacture of other non-metallic products 33179 54123 3238081 362313
27 Manufacture of basic metals 52328 16808 3859227 40428
28 Manufacture of fabricated metal products 21203 19856 607783 1117009
29 Manufacture of machinery and equipment 20490 24428 619324 296676
30 Manufacture of office accounting and computing ----- 597 ----- 183309
31 Manufacture of electrical machinery and apparatus 4262 13647 234754 182994
32 Manufacture of radio television and communication
5428 4529 404910 62485
33 Manufacture of medical precisian and optical 5261 1101 93676 65052
34 Manufacture of motor vehicles and trailers 11127 9459 810753 249105
35 Manufacture of other transport equipment 13056 858 560036 36068
36 Manufacture of furniture 1520 11844 6869 69815
37 Recycling ----- 100 ----- 1190