chapter 1, lesson 7
TRANSCRIPT
77thth Grade Pre-Algebra Grade Pre-Algebra
Chapter 1-7Chapter 1-7
Displaying and Interpreting DataDisplaying and Interpreting Data
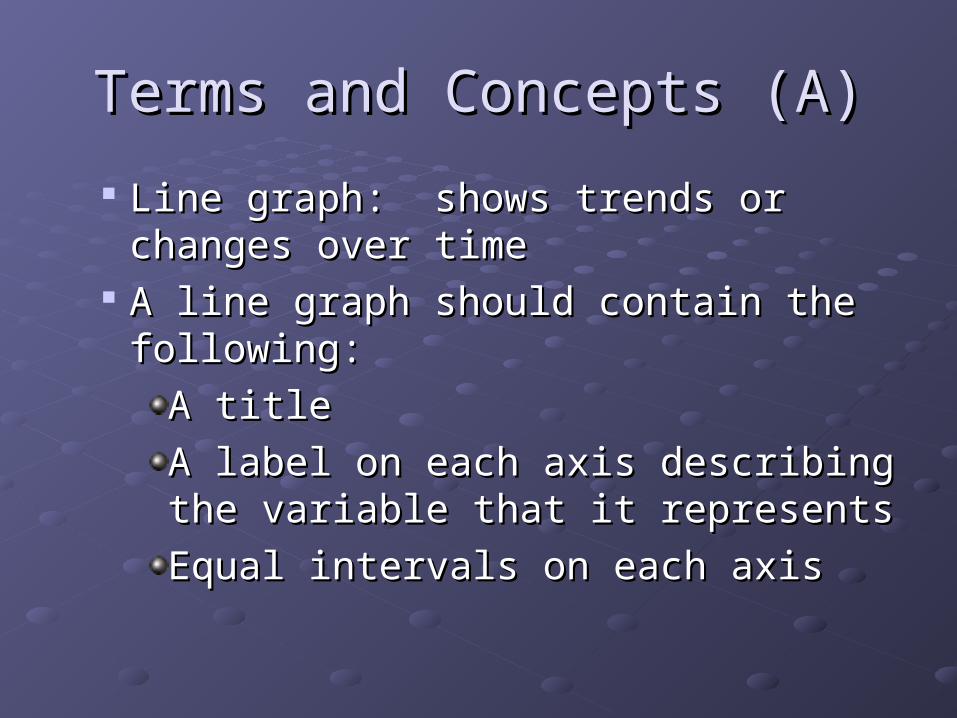
Terms and Concepts (A)Terms and Concepts (A)
Line graph: shows trends or changes Line graph: shows trends or changes over timeover time
A line graph should contain the A line graph should contain the following:following:
A titleA title
A label on each axis describing the A label on each axis describing the variable that it representsvariable that it represents
Equal intervals on each axisEqual intervals on each axis
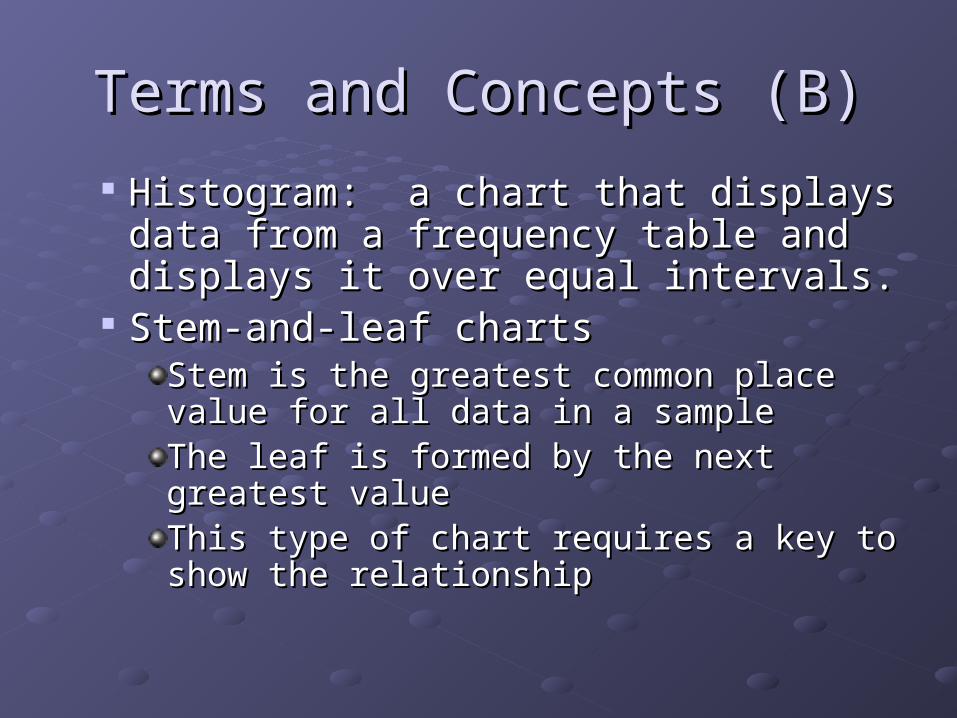
Terms and Concepts (B)Terms and Concepts (B)
Histogram: a chart that displays data Histogram: a chart that displays data from a frequency table and displays it from a frequency table and displays it over equal intervals.over equal intervals.
Stem-and-leaf chartsStem-and-leaf chartsStem is the greatest common place value Stem is the greatest common place value for all data in a samplefor all data in a sampleThe leaf is formed by the next greatest The leaf is formed by the next greatest valuevalueThis type of chart requires a key to show This type of chart requires a key to show the relationshipthe relationship
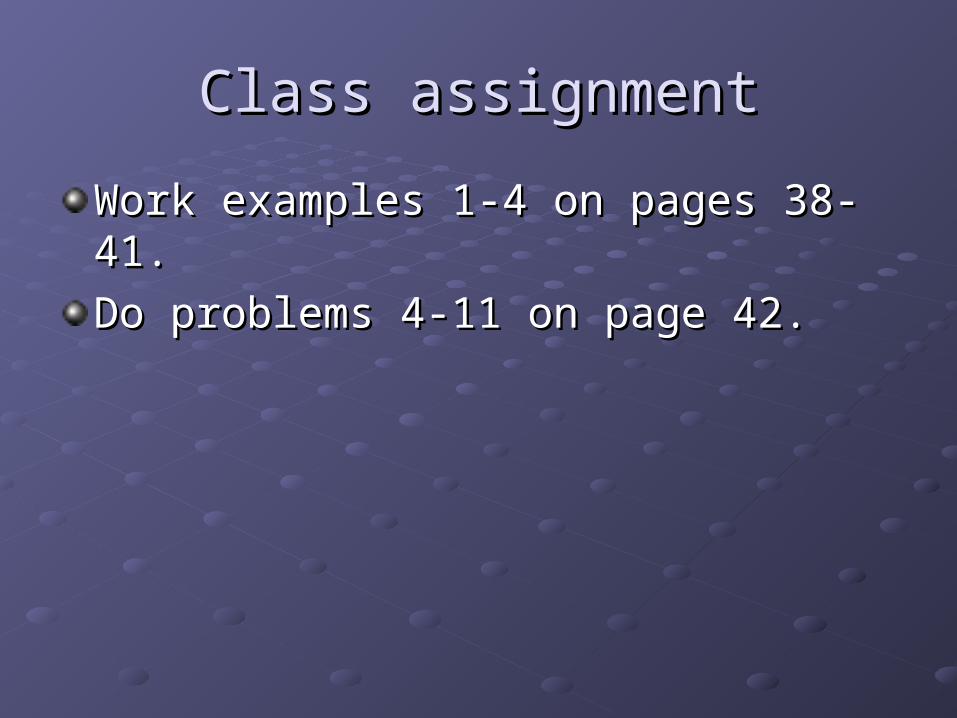
Class assignmentClass assignment
Work examples 1-4 on pages 38-41.Work examples 1-4 on pages 38-41.
Do problems 4-11 on page 42.Do problems 4-11 on page 42.

Homework AssignmentHomework Assignment
Do problems 1-13 (all) on page 7 of the Do problems 1-13 (all) on page 7 of the workbook. workbook.