chapter 1, chapter 2 (section 2.1) quiz review...kevin garnett boston celtics 2,399,148 18.8 83...
TRANSCRIPT

Chapter 1, Chapter 2 (Section 2.1) Quiz Review
Terms➢ Individuals: objects described by a set of data.➢Variable: any characteristic of these individuals
●Categorical Variable: places data into one of several groups or categories.
●Quantitative variable: takes numerical values for which arithmetic operations such as adding and averaging makes sense.
Example
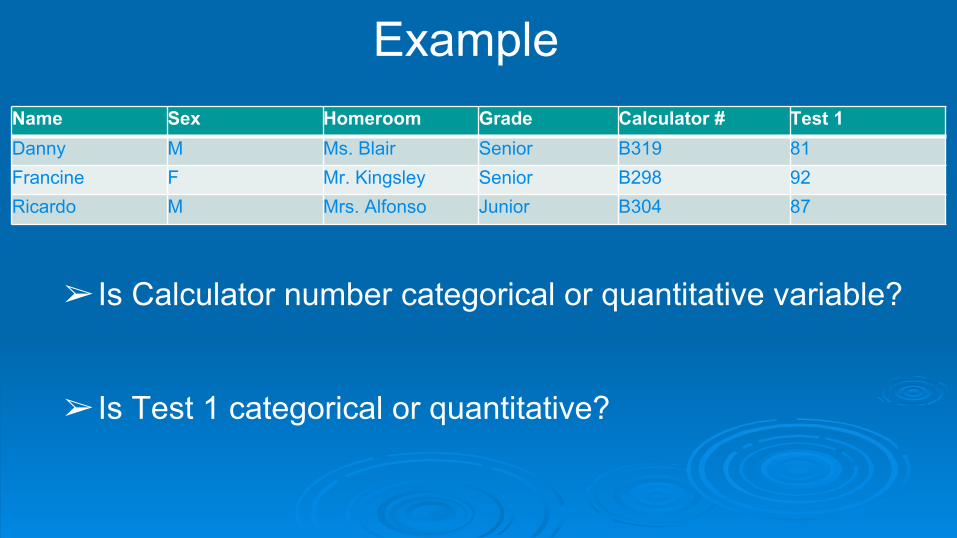
➢ Is Calculator number categorical or quantitative variable?
➢ Is Test 1 categorical or quantitative?
Name Sex Homeroom Grade Calculator # Test 1Danny M Ms. Blair Senior B319 81Francine F Mr. Kingsley Senior B298 92Ricardo M Mrs. Alfonso Junior B304 87

Exercise 1Player Team Votes Points
per Game
Height (inches)
Position
Kevin Garnett Boston Celtics 2,399,148 18.8 83 Forward
LeBron James Cleveland Cavaliers 2,108,831 30.0 80 Forward
Dwight Howard Orlando Magic 2,066,991 20.7 83 Center
Kobe Bryant Los Angeles Lakers 2,004,940 28.3 78 Guard
Carmelo Anthony Denver Nuggets 1,723,701 25.7 80 Forward
In the NBA, the fans vote to decide which player get to play in the NBA All-Star Game. Kevin Garnett of the Boston Celtics led all players, with 2,399,148 votes for the 2008 All-Star Game. The table below provides data about the top five vote-getters that year.
(a)What individuals are measured?

Exercise 1Player Team Votes Points
per Game
Height (inches)
Position
Kevin Garnett Boston Celtics 2,399,148 18.8 83 Forward
LeBron James Cleveland Cavaliers 2,108,831 30.0 80 Forward
Dwight Howard Orlando Magic 2,066,991 20.7 83 Center
Kobe Bryant Los Angeles Lakers 2,004,940 28.3 78 Guard
Carmelo Anthony Denver Nuggets 1,723,701 25.7 80 Forward
In the NBA, the fans vote to decide which player get to play in the NBA All-Star Game. Kevin Garnett of the Boston Celtics led all players, with 2,399,148 votes for the 2008 All-Star Game. The table below provides data about the top five vote-getters that year.
(a)What individuals are measured? NBA basketball players

Exercise 1Player Team Votes Points
per Game
Height (inches)
Position
Kevin Garnett Boston Celtics 2,399,148 18.8 83 Forward
LeBron James Cleveland Cavaliers 2,108,831 30.0 80 Forward
Dwight Howard Orlando Magic 2,066,991 20.7 83 Center
Kobe Bryant Los Angeles Lakers 2,004,940 28.3 78 Guard
Carmelo Anthony Denver Nuggets 1,723,701 25.7 80 Forward
In the NBA, the fans vote to decide which player get to play in the NBA All-Star Game. Kevin Garnett of the Boston Celtics led all players, with 2,399,148 votes for the 2008 All-Star Game. The table below provides data about the top five vote-getters that year.
(b) What variables are recorded?

Exercise 1Player Team Votes Points
per Game
Height (inches)
Position
Kevin Garnett Boston Celtics 2,399,148 18.8 83 Forward
LeBron James Cleveland Cavaliers 2,108,831 30.0 80 Forward
Dwight Howard Orlando Magic 2,066,991 20.7 83 Center
Kobe Bryant Los Angeles Lakers 2,004,940 28.3 78 Guard
Carmelo Anthony Denver Nuggets 1,723,701 25.7 80 Forward
In the NBA, the fans vote to decide which player get to play in the NBA All-Star Game. Kevin Garnett of the Boston Celtics led all players, with 2,399,148 votes for the 2008 All-Star Game. The table below provides data about the top five vote-getters that year.(b) Quantitative or Categorical? In what units is each quantitative variable recorded?
TeamVotesPPGHeightPosition
Exercise 1Player Team Votes Points
per Game
Height (inches)
Position
Kevin Garnett Boston Celtics 2,399,148 18.8 83 Forward
LeBron James Cleveland Cavaliers 2,108,831 30.0 80 Forward
Dwight Howard Orlando Magic 2,066,991 20.7 83 Center
Kobe Bryant Los Angeles Lakers 2,004,940 28.3 78 Guard
Carmelo Anthony Denver Nuggets 1,723,701 25.7 80 Forward
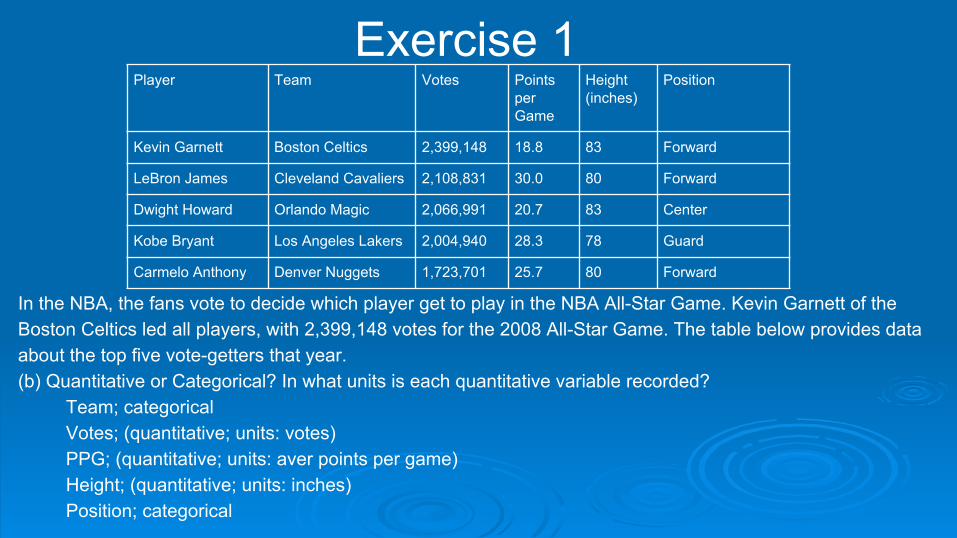
In the NBA, the fans vote to decide which player get to play in the NBA All-Star Game. Kevin Garnett of the Boston Celtics led all players, with 2,399,148 votes for the 2008 All-Star Game. The table below provides data about the top five vote-getters that year.(b) Quantitative or Categorical? In what units is each quantitative variable recorded?
Team; categoricalVotes; (quantitative; units: votes)PPG; (quantitative; units: aver points per game)Height; (quantitative; units: inches)Position; categorical

Exercise 1Player Team Votes Points
per Game
Height (inches)
Position
Kevin Garnett Boston Celtics 2,399,148 18.8 83 Forward
LeBron James Cleveland Cavaliers 2,108,831 30.0 80 Forward
Dwight Howard Orlando Magic 2,066,991 20.7 83 Center
Kobe Bryant Los Angeles Lakers 2,004,940 28.3 78 Guard
Carmelo Anthony Denver Nuggets 1,723,701 25.7 80 Forward
In the NBA, the fans vote to decide which player get to play in the NBA All-Star Game. Kevin Garnett of the Boston Celtics led all players, with 2,399,148 votes for the 2008 All-Star Game. The table below provides data about the top five vote-getters that year.
(c) Which variable or variables do you think most influence the number of votes received by an individual player?
Terms➢ Population: the entire group of individuals about which we want
information
➢ Sample: a part of the population from which we actually collect information, which is then used to draw conclusions about the whole
➢ Sample surveys: measure characteristics of some group of individuals (the population) by studying only some of its members (the sample)● Survey a portion of the group to make a conclusion about the
entire population
Terms
➢Observational studies vs. Experiments●What is the difference between the two?●Specific?

Terms
➢Observational study: a study that observes individuals and measures variables of interest but does not attempt to influence the responses.
➢Experiment: purposely imposes some treatment on individuals in order to observe their responses. The purpose of an experiment is to study whether the treatment causes a change in the response.
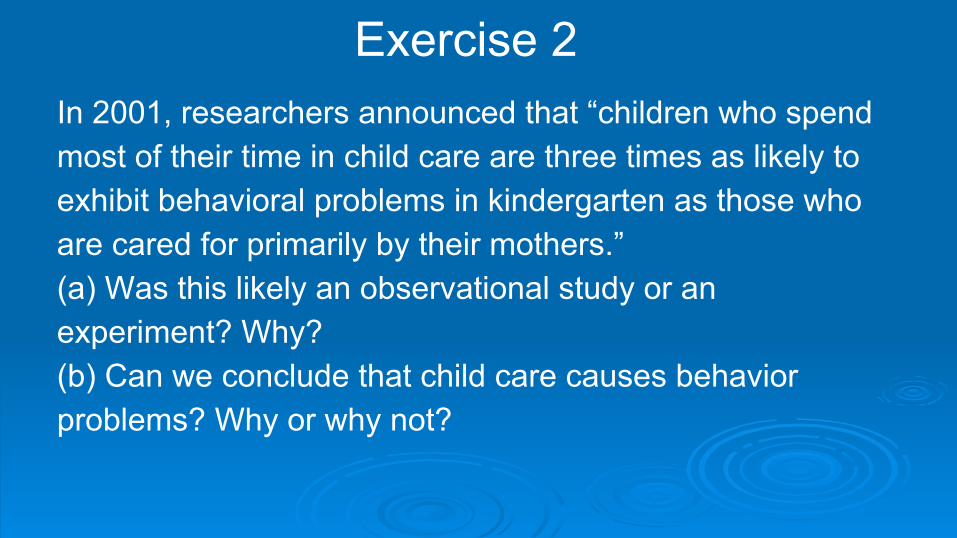
Exercise 2In 2001, researchers announced that “children who spend most of their time in child care are three times as likely to exhibit behavioral problems in kindergarten as those who are cared for primarily by their mothers.”(a) Was this likely an observational study or an experiment? Why?(b) Can we conclude that child care causes behavior problems? Why or why not?

Exercise 2
(a) An observational study. No treatment was imposed - children from different types pre-school training were simply compared.(b) No. There are other possible explanations for the behavioral differences between the children; for example, there may be more children with single parents who are in child care and this could be the reason for the behavioral problems.
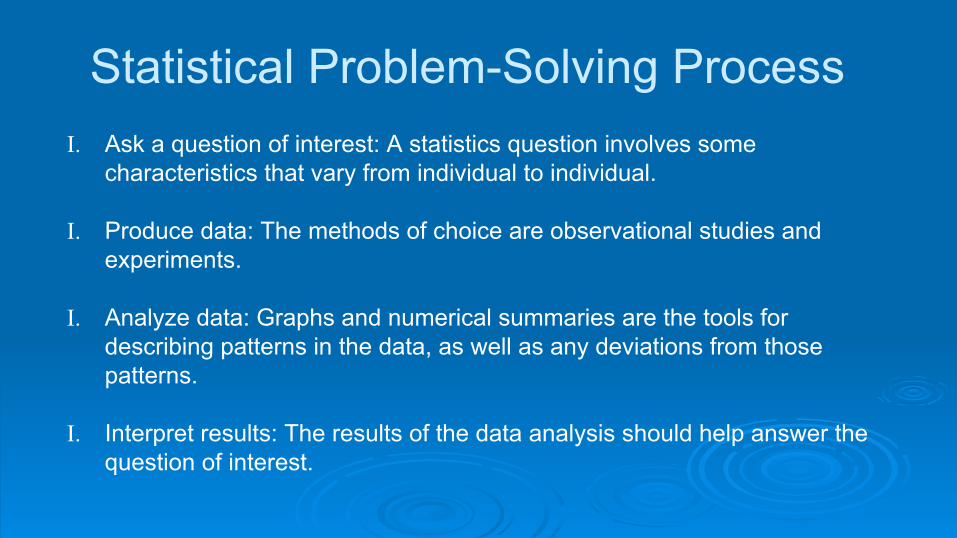
Statistical Problem-Solving ProcessI. Ask a question of interest: A statistics question involves some
characteristics that vary from individual to individual.
I. Produce data: The methods of choice are observational studies and experiments.
I. Analyze data: Graphs and numerical summaries are the tools for describing patterns in the data, as well as any deviations from those patterns.
I. Interpret results: The results of the data analysis should help answer the question of interest.

Types of Graphs➢ Bar graph and Pie Chart: good for
categorical variables
➢ Histograms, Dot Plots, Time Plots, and Stemplots: good for quantitative variables.

Examples of Graphs (cont.)➢ Histograms
➢ Dot Plots

Examples of Graphs (cont.)➢ Time Plots: plots each observation
against the time at which it was measured.
➢ Ogives Stemplots

Interpretation of GraphsWe interpret a graph by describing the:
- SPREAD- CENTER
- SHAPE- PEAKS- ANY UNUSUAL FEATURES
Spread: _____________________________________________________
Center: _____________________________________________________Also known as the ____________

Interpretation of GraphsWe interpret a graph by describing the:
- SPREAD- CENTER
- SHAPE- PEAKS- ANY UNUSUAL FEATURES
Spread: the range, lowest and highest values
Center: point where half the observations are above and half are below (median)

Interpretation of Graphs Cont’dShape:
symmetric: __________________________________________skewed right: _____ side extends farther than ___ side
most observations are on the ____(toward ______ values)
skewed left: ____ side extends farther than ____ sidemost observations are on the _____
(toward ______ values)NOTE: some distributions have shapes that are neither symmetric or skewed
Peaks: which values are ____ commondistributions can have few or many peaks

Interpretation of Graphs Cont’dShape:
symmetric: right and left side are approximate mirror images of each otherskewed right: right side extends farther than left side
most observations are on the left (toward lower values)
skewed left: left side extends farther than right sidemost observations are on the right
(toward higher values)NOTE: some distributions have shapes that are neither symmetric or skewed
Peaks: which values are most commondistributions can have few or many peaks

Unusual FeaturesGaps: areas of a distribution where there
are no observations
Outliers: extreme values that differ greatly from the other observations

1

2
3

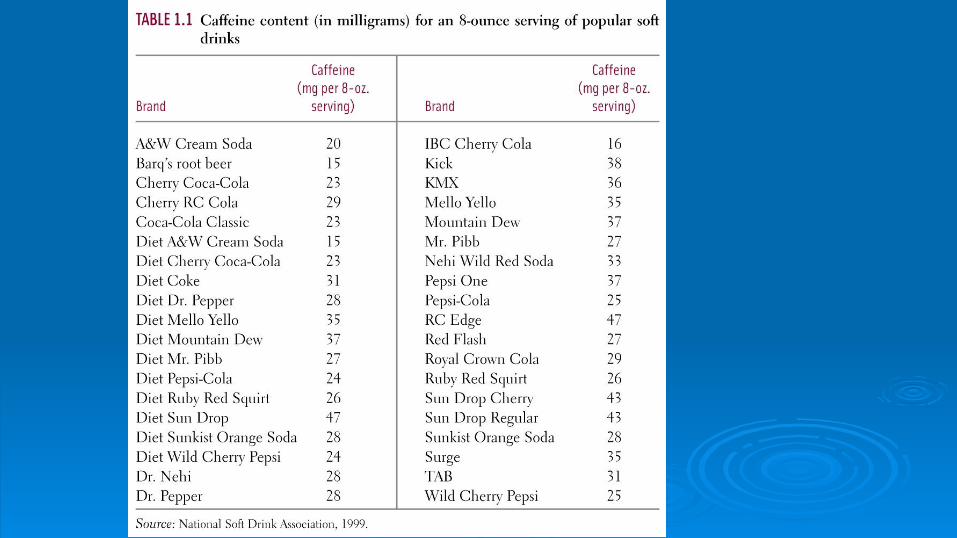
How to construct a stemplot1. Separate each observation into a stem, consisting of all but the
rightmost digit and, a leaf, the final digit. (4 stems is a good minimum)
2. Write the stems vertically in increasing order from top to bottom, and draw a vertical line to the right of the stems.
3. Go through the data, writing each leaf to the right of its stem in increasing order.
4. Title your graph and add a key describing what the stems and leaves represent.
NOTE: Depending on the data we may need to create a split stemplot or round our data before making a stemplot.

Spread: Center: Shape: Peaks:
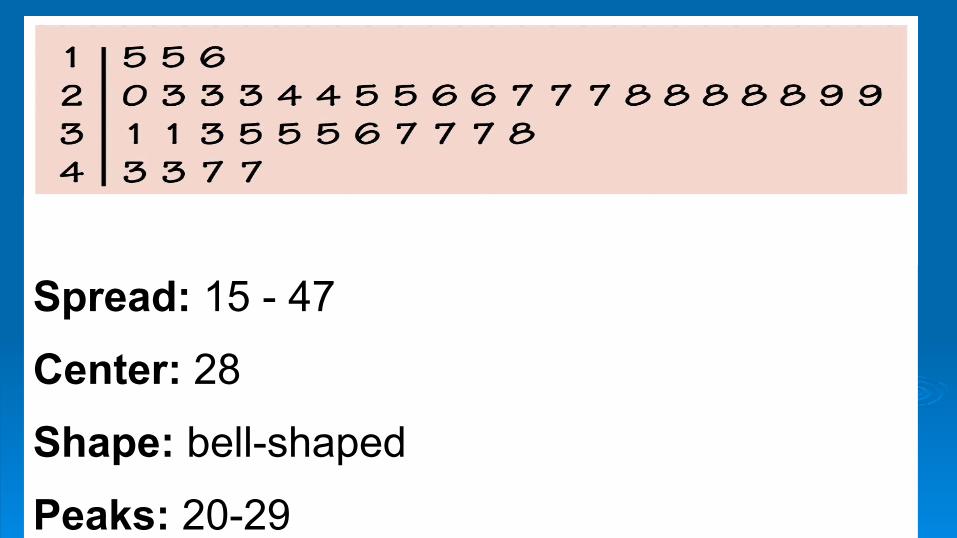
Spread: 15 - 47
Center: 28
Shape: bell-shaped
Peaks: 20-29
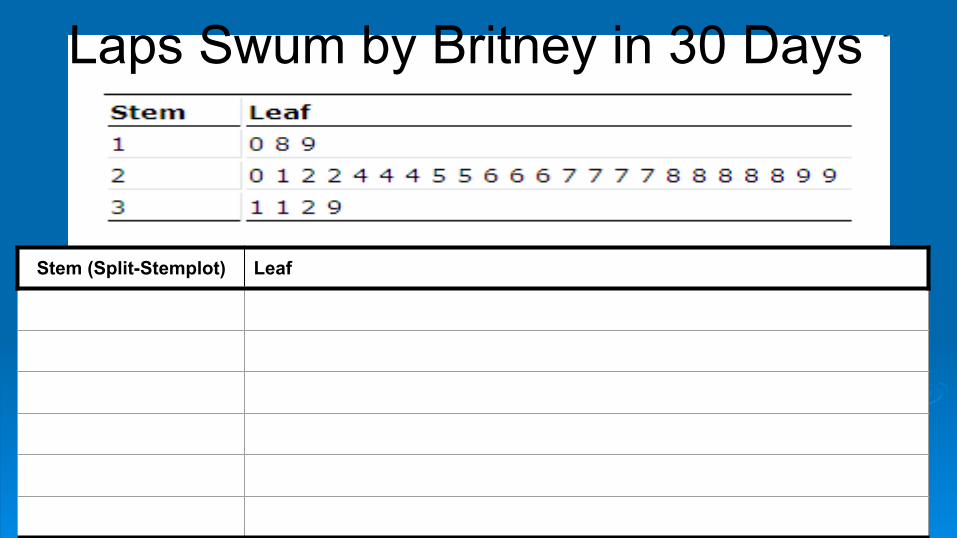
Laps Swum by Britney in 30 Days
Stem (Split-Stemplot) Leaf

Laps Swum by Britney in 30 DaysSpread:
Center:
Shape:
Peaks:
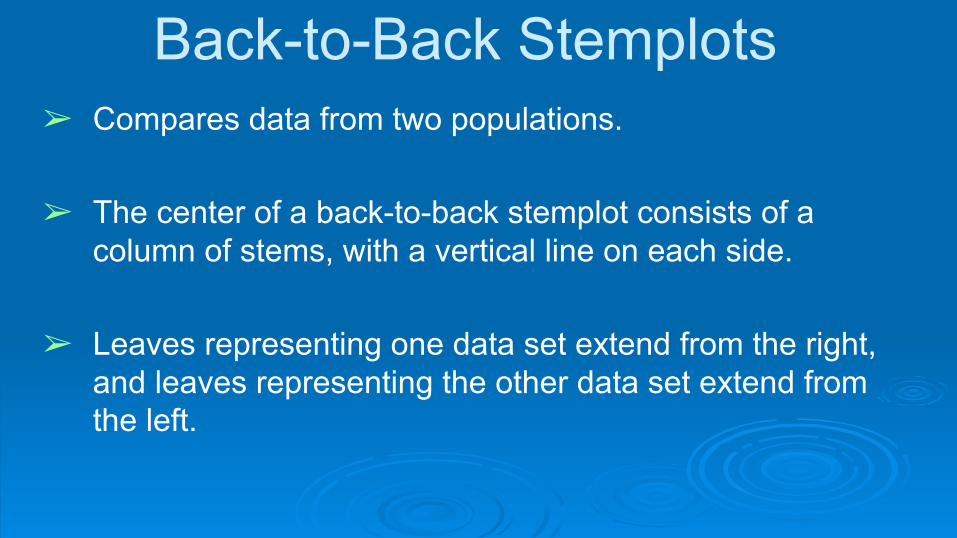
Back-to-Back Stemplots➢ Compares data from two populations.
➢ The center of a back-to-back stemplot consists of a column of stems, with a vertical line on each side.
➢ Leaves representing one data set extend from the right, and leaves representing the other data set extend from the left.

•This back-to-back stemplot shows the amount of cash (in dollars) carried by a random sample of teenage boys and girls. •The boys carried more cash than the girls - a median of $42 for the boys versus $36 for the girls. •Both distributions were roughly symmetric.

Ages of Actors and Actresses when they Won an Oscar
ACTORS ACTRESSES
2 1 4 6 6 6 7 9 9 8 7 5 3 2 2 1 3 0 0 1 1 3 3 4 4 4 5 5 7 7 88 8 7 6 5 4 3 3 2 2 1 0 0 4 1 1 1 2 9
6 6 5 1 5 2 1 0 6 0 1 1 6 7 4
8 0 KEY: 3 2 = 32 yrs old
Spread:Center:Shape:Peaks:
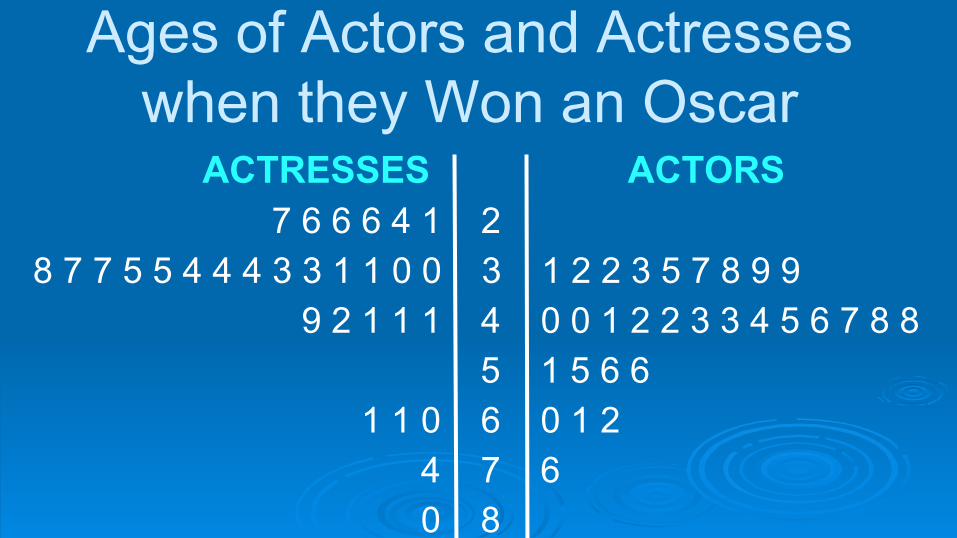
Ages of Actors and Actresses when they Won an Oscar
ACTRESSES ACTORS 7 6 6 6 4 1 2 8 7 7 5 5 4 4 4 3 3 1 1 0 0 3 1 2 2 3 5 7 8 9 9 9 2 1 1 1 4 0 0 1 2 2 3 3 4 5 6 7 8 8 5 1 5 6 6 1 1 0 6 0 1 2 4 7 6 0 8
KEY: 3 2 = 32 yrs old

Dotplots➢ Label horizontal axis starting with minimum value in data
through largest data entry➢ For each occurrence of the value, place a dot above the
corresponding value.➢ Dots should be equal sized
0 1 2 3 4 5 6 7
Histograms
➢Write down your height in inches.➢Collect all data on the whiteboard.➢Create a histogram.➢Describe graph
●Shape, spread, peak, median, mean, mode