chapter 1: basic ideas
TRANSCRIPT
Chapter 1: Basic Ideas
1 Welcome
Welcome to STAT 1107: Elementary Statistics. Elementary Statistics is anoutstanding course as part of a liberal arts education. Everyone can bene�tfrom a better understanding of statistics and data. Everyone. Algebra, Trigand Calculus are very important to many �elds of study; but not all �elds ofstudy. Statistics is important in every day life and decision making. Dailynews presents statistics about issues both important and mundane. What doesthe margin of error in a political poll mean? Which of those side e¤ects from anew medication should I worry about? What past performance data should Iconsider when drafting my fantasy sports team? What past performance datashould I consider when making any decision about the future? Why are cannedsoups and ice cream frequently buy one get one free at the grocery store butgasoline never is?
2 What is Statistics?
Statistics is the science of data! Collecting, classifying, organizing, analyzing,interpreting, making decisions from, etc. Statistics is a part of your everydaylife even if you haven�t always noticed.
Example 1 The average score on Test 1 in STAT 8000 at the University ofNowhere is 75.
Example 2 The tallest ice cream cone was over 9 feet tall and scooped inItaly.(http://www.icecream.com/icecreaminfo).
Example 3 California produces the most ice cream in America (http://www.icecream.com/icecreaminfo).
1
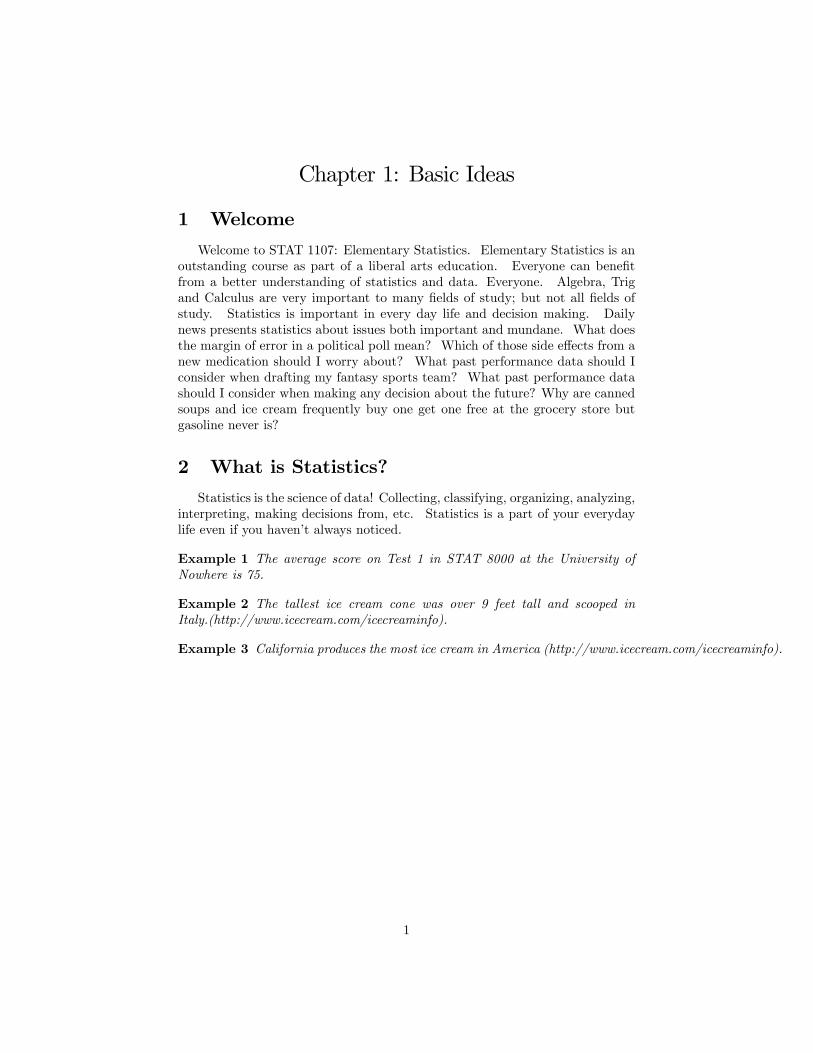
Example 4 How has the price of gold �uctuated in 2016? A Time Seriesstudies changes in variables over time.
http://www.kitco.com/charts/popup/au0365nyb.html
Example 5 Top 5 interstates for most fatal accidents per mile in 2013 (http://commuting.blog.ajc.com/2015/11/06/americas-deadliest-interstate-is-in-georgia-study-says/)I-285 in GeorgiaI-710 in CaliforniaI-240 in OklahomaI-495 in DelawareI-240 in Tennessee
Example 6 Georgia is the seventh-worst state in the country for fatal car acci-dents in total (1,085 incidents in 2013). Texas ranked no. 1, with 3,044 deathsfrom car accidents in 2013.
The �rst example provided here is a work of �ction. I made up the data andit looks nice. I refer to such examples as toy data. Such data sets are good toplay with and can make a point. The other examples are real. As a science, Sta-tistics is very important because of its applications in the real world. I grab lotsof example data from Wikipedia. It is a nice source for pop culture stu¤. Mostall sports data comes from http://www.sports-reference.com/. It contains lotsof data about baseball, basketball, football, hockey and the Olympics. Usingreal data can help answer the timeless question in every statistics/mathematicscourse. What is this good for?
2
3 Raw Data is Ugly
Graphical representations of data always look pretty in newspapers, maga-zines and books. What you haven�t seen is the blood, sweat and tears that itsometimes takes to get those results.
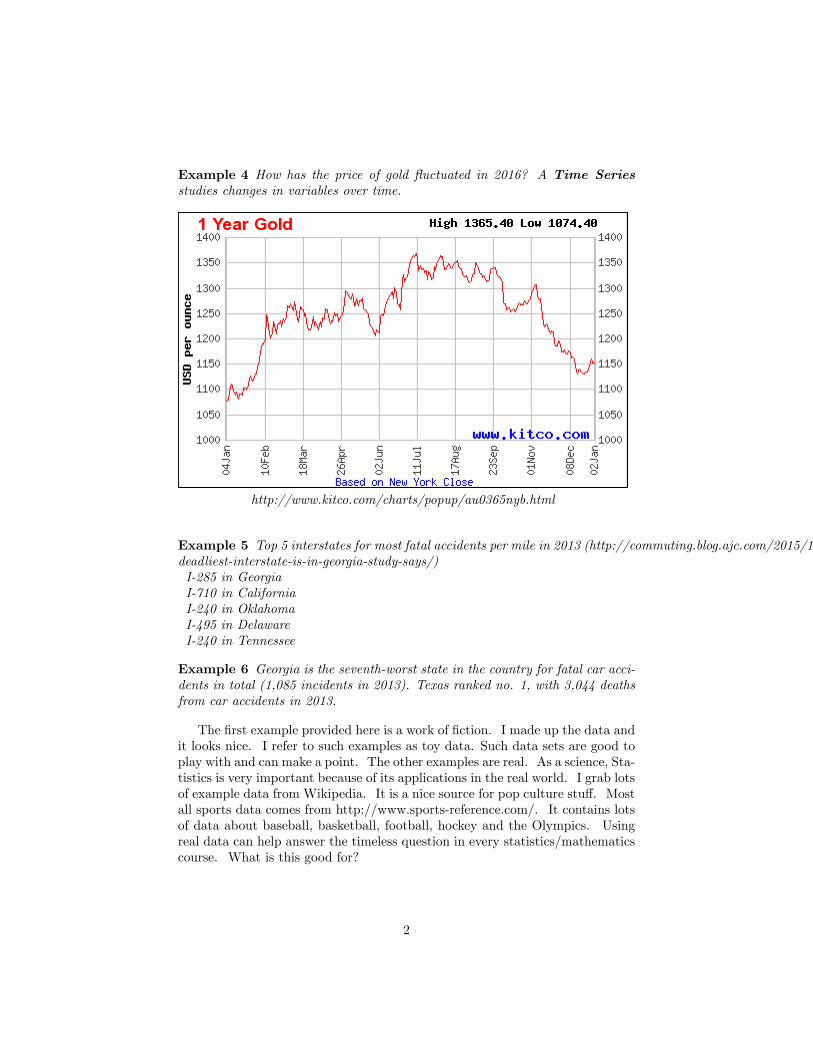
3.1 State of Birth for US Players in NHL
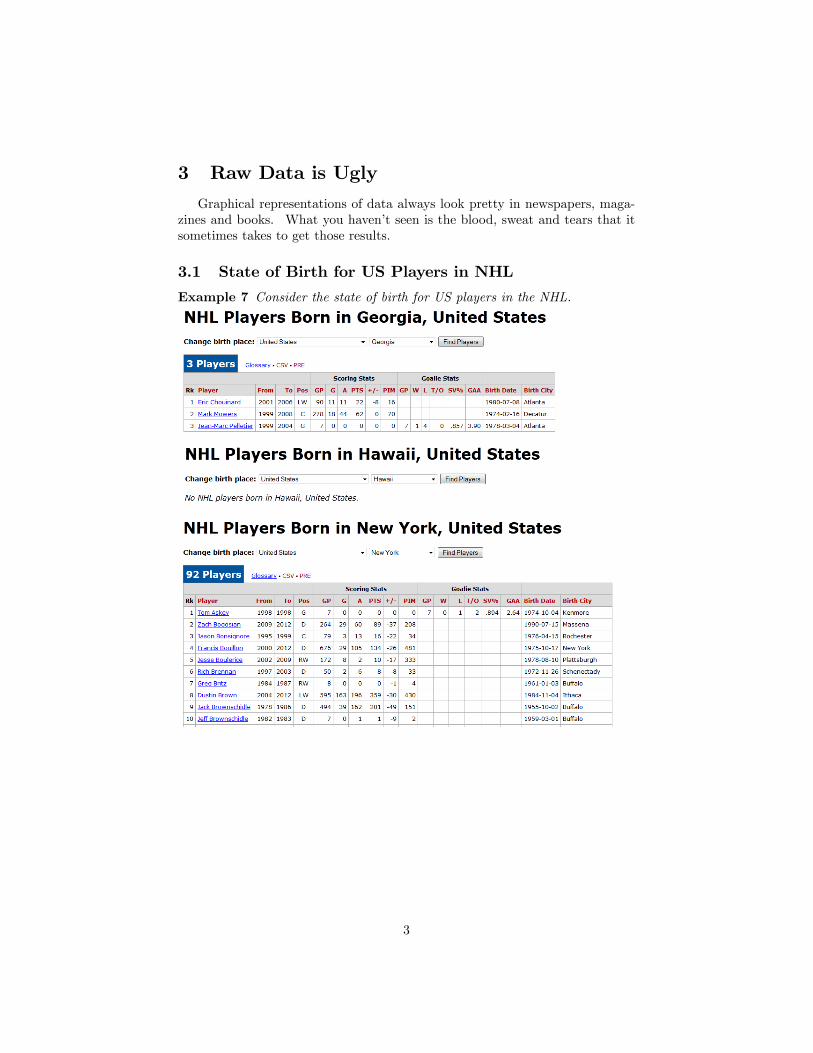
Example 7 Consider the state of birth for US players in the NHL.
3
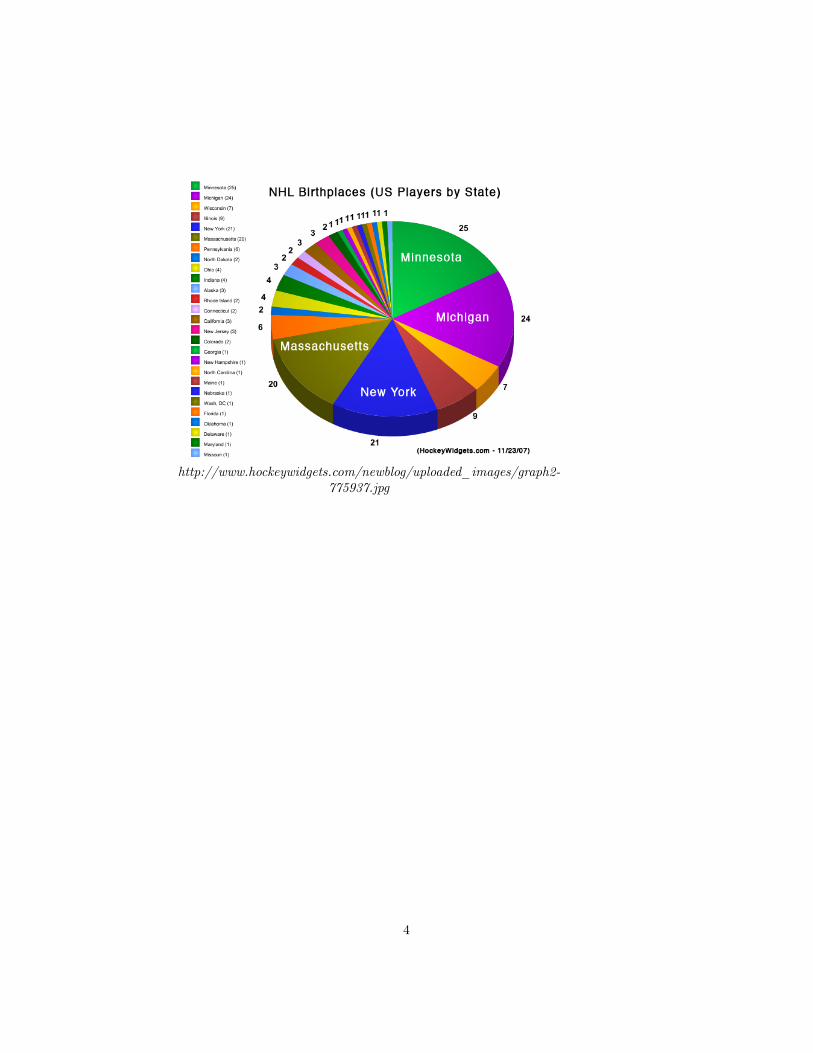
http://www.hockeywidgets.com/newblog/uploaded_images/graph2-775937.jpg
4
3.2 Health Statistics
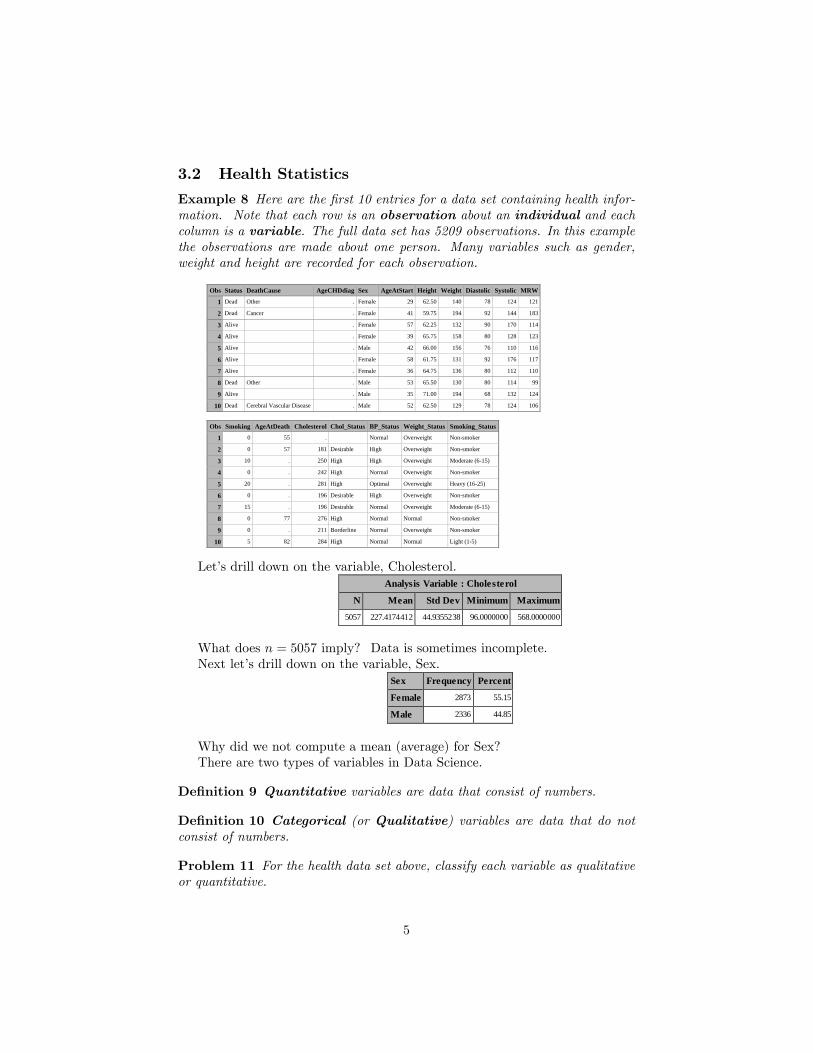
Example 8 Here are the �rst 10 entries for a data set containing health infor-mation. Note that each row is an observation about an individual and eachcolumn is a variable. The full data set has 5209 observations. In this examplethe observations are made about one person. Many variables such as gender,weight and height are recorded for each observation.
Obs Status DeathCause AgeCHDdiag Sex AgeAtStart Height Weight Diastolic Systolic MRW
1 Dead Other . Female 29 62.50 140 78 124 121
2 Dead Cancer . Female 41 59.75 194 92 144 183
3 Alive . Female 57 62.25 132 90 170 114
4 Alive . Female 39 65.75 158 80 128 123
5 Alive . Male 42 66.00 156 76 110 116
6 Alive . Female 58 61.75 131 92 176 117
7 Alive . Female 36 64.75 136 80 112 110
8 Dead Other . Male 53 65.50 130 80 114 99
9 Alive . Male 35 71.00 194 68 132 124
10 Dead Cerebral Vascular Disease . Male 52 62.50 129 78 124 106
Obs Smoking AgeAtDeath Cholesterol Chol_Status BP_Status Weight_Status Smoking_Status
1 0 55 . Normal Overweight Nonsmoker
2 0 57 181 Desirable High Overweight Nonsmoker
3 10 . 250 High High Overweight Moderate (615)
4 0 . 242 High Normal Overweight Nonsmoker
5 20 . 281 High Optimal Overweight Heavy (1625)
6 0 . 196 Desirable High Overweight Nonsmoker
7 15 . 196 Desirable Normal Overweight Moderate (615)
8 0 77 276 High Normal Normal Nonsmoker
9 0 . 211 Borderline Normal Overweight Nonsmoker
10 5 82 284 High Normal Normal Light (15)
Let�s drill down on the variable, Cholesterol.Analysis Variable : Cholesterol
N Mean Std Dev Minimum Maximum
5057 227.4174412 44.9355238 96.0000000 568.0000000
What does n = 5057 imply? Data is sometimes incomplete.Next let�s drill down on the variable, Sex.
Sex Frequency Percent
Female 2873 55.15
Male 2336 44.85
Why did we not compute a mean (average) for Sex?There are two types of variables in Data Science.
De�nition 9 Quantitative variables are data that consist of numbers.
De�nition 10 Categorical (or Qualitative) variables are data that do notconsist of numbers.
Problem 11 For the health data set above, classify each variable as qualitativeor quantitative.
5
Furthermore, there are two types of quantitative variables. Each type cre-ates a very di¤erent probability model with its own set of rules and computations(as we will see in future sections).
De�nition 12 Discrete variables can take one of a �nite number of distinctoutcomes. Discrete random variables jump from one state to the next withnothing in between.
Example 13 The number of unopened cans of Coke in my fridge, the numberof players on a basketball team and the number of cards in a deck are all discretevariables.
De�nition 14 Continuous variables can take any numeric value within arange of values.
Example 15 The number of ounces in a can of Coke, the time it takes (inminutes) to run a mile, the temperature outside are all examples of continuousrandom variables.
Exercise 16 Consider an experiment whose population is the set of all Kenne-saw State University students. Which of these variables are discrete and whichare continuous?
1. number of classes the student is enrolled in this semester;
2. number of required books for classes this semester;
3. weight (in pounds) of required books for classes this semester;
4. cost (in dollars) of required books for classes this semester;
5. height (in inches) of student;
6. GPA;
7. number of miles driven to campus.
A population is the entire collection of data that describe some phenom-enon. The above data contains only 5209 observations and thus is not the pop-ulation of the world, the US or a state. A sample is a subset of a populationfrom which we actually collect data. The above data is a sample.A number that describes a population is called a parameter. A number
that describes a sample is called a statistic.
Example 17 In Fall 2013, the average age of KSU undergraduate studentswas 23 (factbook.kennesaw.edu). Since this describes the population of KSUstudents, this number is a parameter.
Example 18 If we use the students present today as a sample of KSU studentsand �nd their average age to be 21 then that is a statistic.
6
De�nition 19 Using a sample to make an inference about a population is calledinferential statistics.
We frequently use samples when the population is too large to gather. Saywe wish to determine the average number of hours per week students at KSUprepare for classes. It might be very di¢ cult and time consuming to collectthis data from every student. It would be easier to use a sample. One possiblesample is to use is this class. Another sample would be to use all the studentspresent in this classroom whose birthday is in May. A third sample would beto go to the library and use every student present. A fourth sample would beto place an ad in the school paper inviting students to submit information. Thesampling design describes how the sample is selected. Unfortunately not allsamples are equally useful when practicing inferential statistics.
Problem 20 Are any of the above sampling designs good to use to estimate theaverage number of hours per week students at KSU prepare for classes? Explain.
De�nition 21 A sample selected by taking individuals of the population thatare easy to reach is called a convenience sample. Asking students in thisparticular class the average number of hours per week they prepare for classesis a convenience sample.
De�nition 22 A sample selected by taking groups of collected individuals of thepopulation is called a cluster sample. Sampling every student in a ENG 1101,HIST 1101, ART 1101, and STAT 1107 is a cluster sample.
De�nition 23 A systematic sample is one where every kth member of thepopulation is included in the sample. Sampling every 100th student leaving thecommons is a systematic sample.
De�nition 24 A sample consisting of people who choose themselves to respondto an appeal for opinions is a self-selected sample or a voluntary responsesample. Putting an ad in the Sentinel requesting information is a self-selectedsample.
De�nition 25 A strati�ed sample is one where di¤erent types of objects aresample in di¤erent quantities to ensure representative proportion. Sampling1000 students at the Kennesaw campus and 300 students at the Marietta campusis a strati�ed sample.
Self-selected samples almost always provide biased results.
Problem 26 Identify misuses of statistics in the following: A local websiteposted a poll asking readers if Atlantans should approve a 2% increase in salestax to purchase new stadiums for millionaire athletes? Ten people responded,83% said "no�" and 17% said "yes" This website reported that Georgians donot want an increase in sales tax to fund local arts and entertainment.
7
What makes for a good sample? A simple random sample.
De�nition 27 A simple random sample (SRS) of size n is a sample of nindividuals from the population such that every individual has an equal chanceof inclusion.
An SRS is like a lottery selection.
4 Understanding Variation
Knowing an average value (or a predicted average) is a good start to un-derstanding data. But it is not enough. We must also understand how datavaries. The same unit of measurement may not always have the same value ormeaning.
Example 28 The average score on Test 1 in STAT 8000 at the University ofNowhere is 75. Of the 100 students in the class, half scored a 50 and the otherhalf scored 100.
Example 29 The average score on Test 1 in STAT 8000 at the University ofNowhere is 75. Each of the 100 students in the class scored a 75.
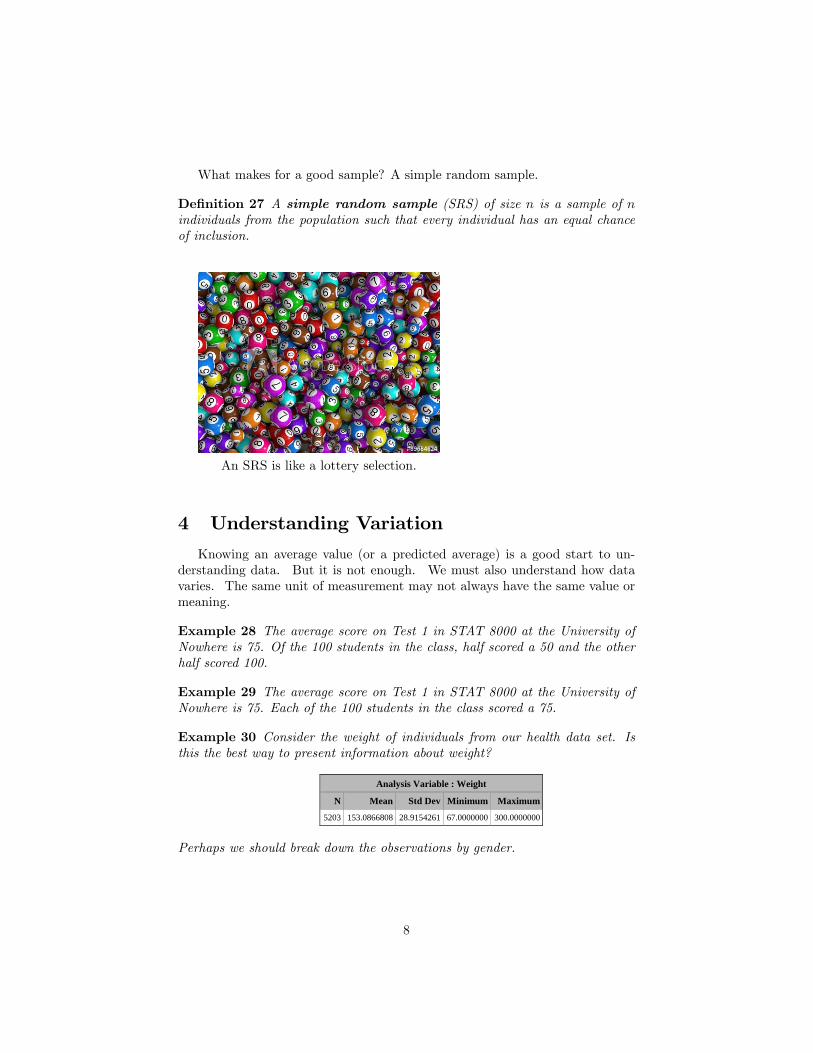
Example 30 Consider the weight of individuals from our health data set. Isthis the best way to present information about weight?
Analysis Variable : Weight
N Mean Std Dev Minimum Maximum
5203 153.0866808 28.9154261 67.0000000 300.0000000
Perhaps we should break down the observations by gender.
8
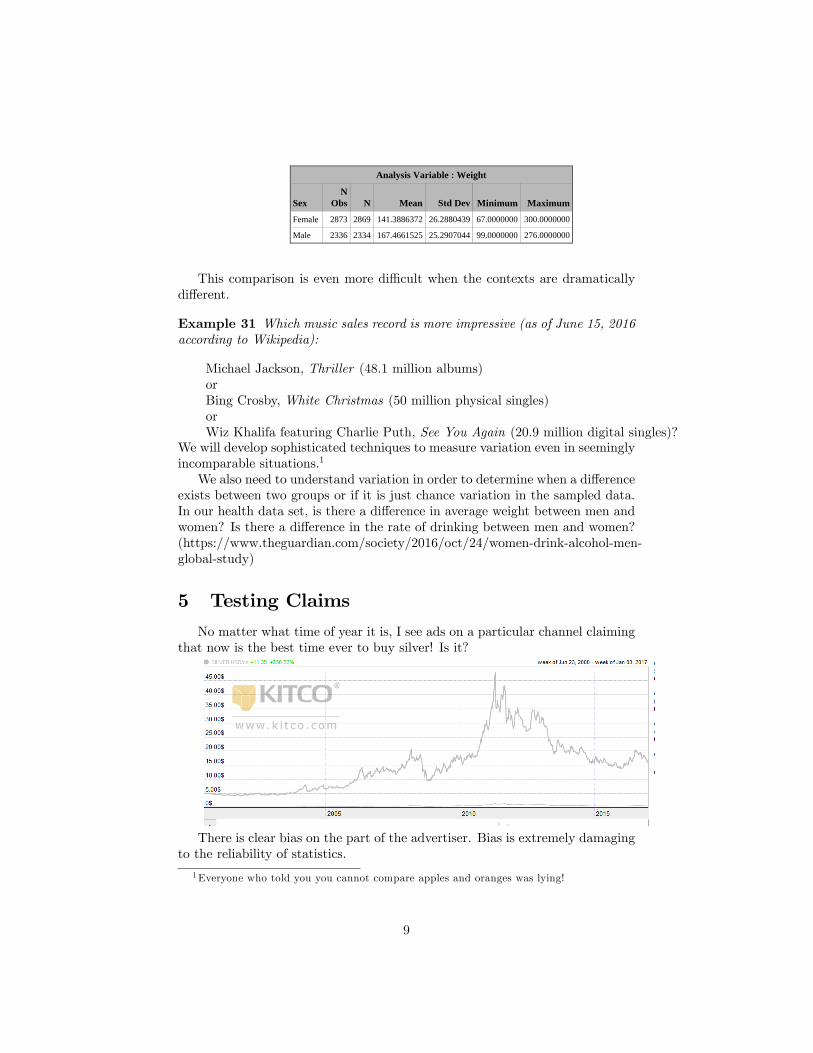
Analysis Variable : Weight
SexN
Obs N Mean Std Dev Minimum Maximum
Female 2873 2869 141.3886372 26.2880439 67.0000000 300.0000000
Male 2336 2334 167.4661525 25.2907044 99.0000000 276.0000000
This comparison is even more di¢ cult when the contexts are dramaticallydi¤erent.
Example 31 Which music sales record is more impressive (as of June 15, 2016according to Wikipedia):
Michael Jackson, Thriller (48.1 million albums)orBing Crosby, White Christmas (50 million physical singles)orWiz Khalifa featuring Charlie Puth, See You Again (20.9 million digital singles)?
We will develop sophisticated techniques to measure variation even in seeminglyincomparable situations.1
We also need to understand variation in order to determine when a di¤erenceexists between two groups or if it is just chance variation in the sampled data.In our health data set, is there a di¤erence in average weight between men andwomen? Is there a di¤erence in the rate of drinking between men and women?(https://www.theguardian.com/society/2016/oct/24/women-drink-alcohol-men-global-study)
5 Testing Claims
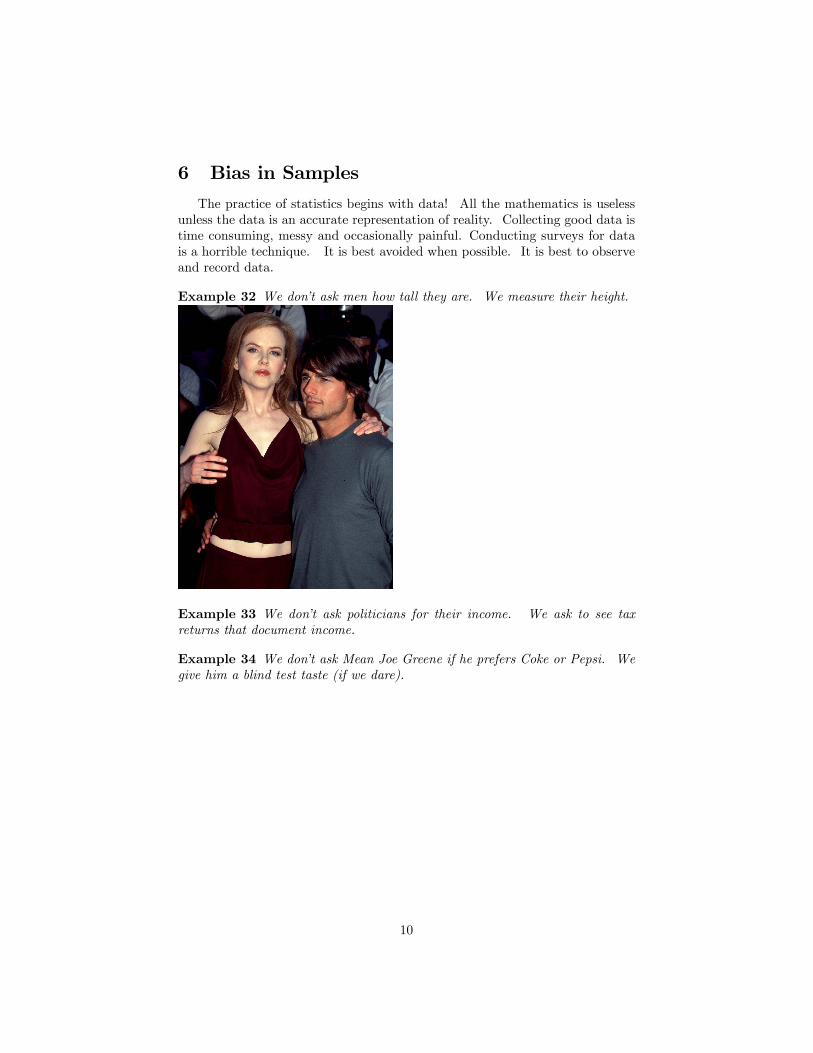
No matter what time of year it is, I see ads on a particular channel claimingthat now is the best time ever to buy silver! Is it?
There is clear bias on the part of the advertiser. Bias is extremely damagingto the reliability of statistics.
1Everyone who told you you cannot compare apples and oranges was lying!
9
6 Bias in Samples
The practice of statistics begins with data! All the mathematics is uselessunless the data is an accurate representation of reality. Collecting good data istime consuming, messy and occasionally painful. Conducting surveys for datais a horrible technique. It is best avoided when possible. It is best to observeand record data.
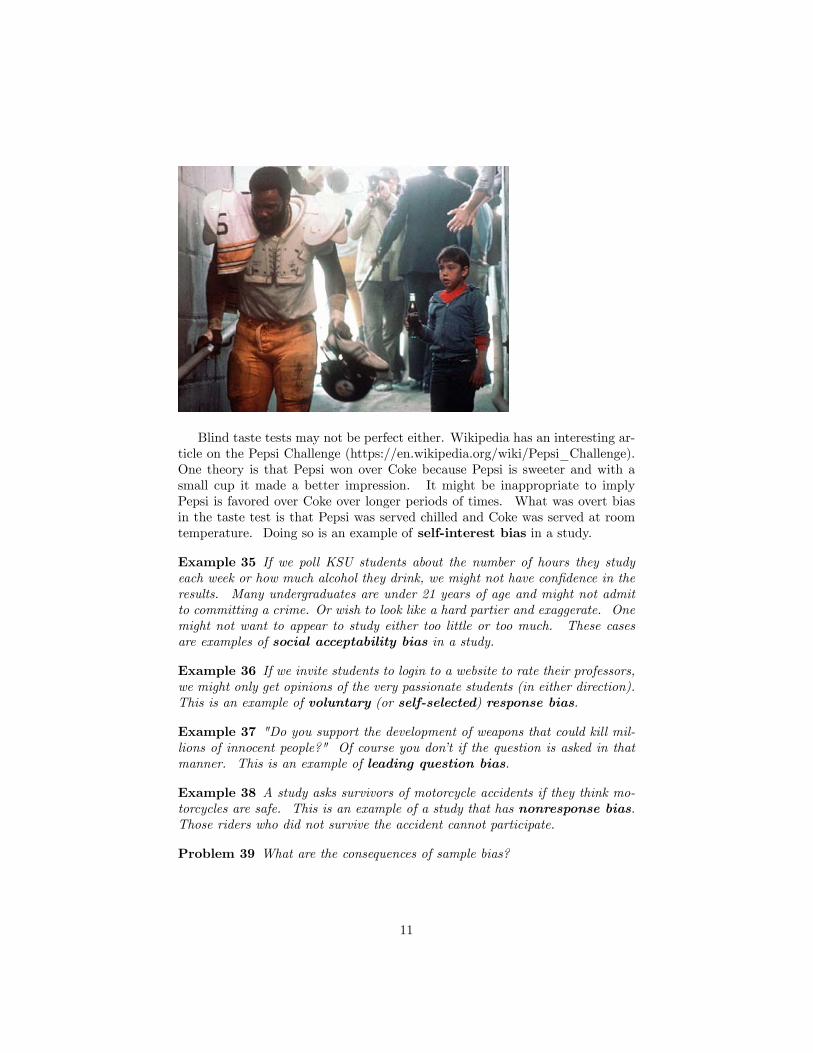
Example 32 We don�t ask men how tall they are. We measure their height.
Example 33 We don�t ask politicians for their income. We ask to see taxreturns that document income.
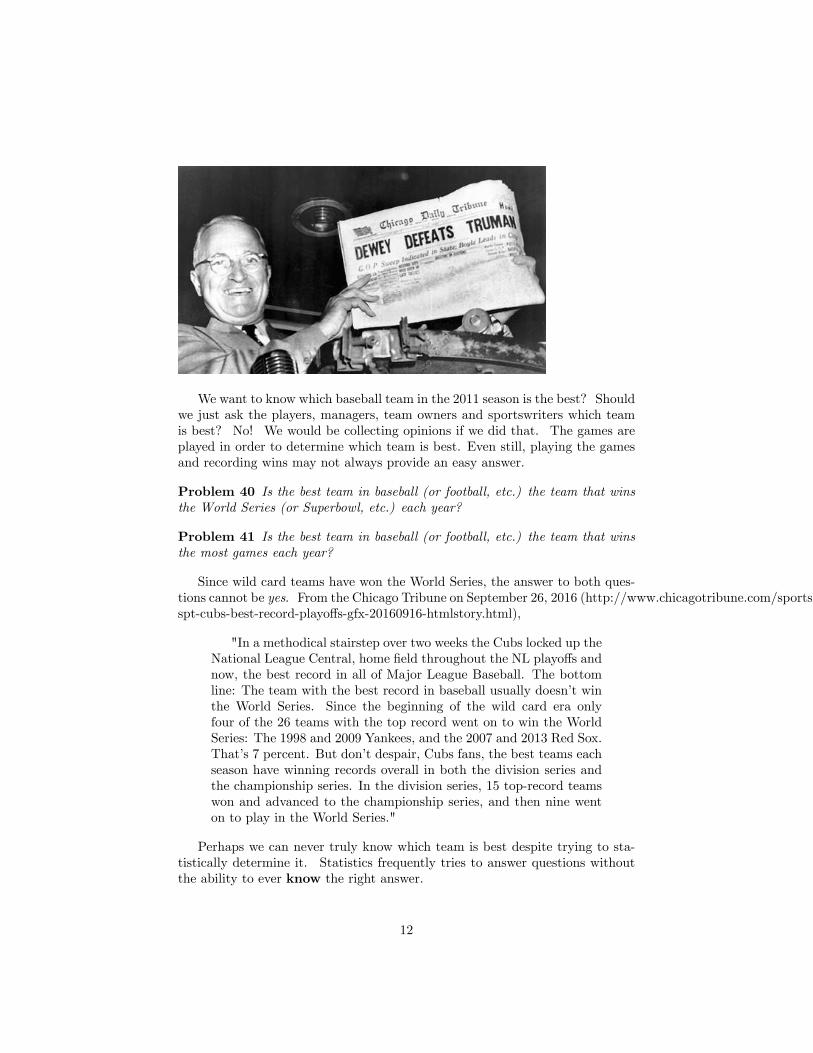
Example 34 We don�t ask Mean Joe Greene if he prefers Coke or Pepsi. Wegive him a blind test taste (if we dare).
10
Blind taste tests may not be perfect either. Wikipedia has an interesting ar-ticle on the Pepsi Challenge (https://en.wikipedia.org/wiki/Pepsi_Challenge).One theory is that Pepsi won over Coke because Pepsi is sweeter and with asmall cup it made a better impression. It might be inappropriate to implyPepsi is favored over Coke over longer periods of times. What was overt biasin the taste test is that Pepsi was served chilled and Coke was served at roomtemperature. Doing so is an example of self-interest bias in a study.
Example 35 If we poll KSU students about the number of hours they studyeach week or how much alcohol they drink, we might not have con�dence in theresults. Many undergraduates are under 21 years of age and might not admitto committing a crime. Or wish to look like a hard partier and exaggerate. Onemight not want to appear to study either too little or too much. These casesare examples of social acceptability bias in a study.
Example 36 If we invite students to login to a website to rate their professors,we might only get opinions of the very passionate students (in either direction).This is an example of voluntary (or self-selected) response bias.
Example 37 "Do you support the development of weapons that could kill mil-lions of innocent people?" Of course you don�t if the question is asked in thatmanner. This is an example of leading question bias.
Example 38 A study asks survivors of motorcycle accidents if they think mo-torcycles are safe. This is an example of a study that has nonresponse bias.Those riders who did not survive the accident cannot participate.
Problem 39 What are the consequences of sample bias?
11
We want to know which baseball team in the 2011 season is the best? Shouldwe just ask the players, managers, team owners and sportswriters which teamis best? No! We would be collecting opinions if we did that. The games areplayed in order to determine which team is best. Even still, playing the gamesand recording wins may not always provide an easy answer.
Problem 40 Is the best team in baseball (or football, etc.) the team that winsthe World Series (or Superbowl, etc.) each year?
Problem 41 Is the best team in baseball (or football, etc.) the team that winsthe most games each year?
Since wild card teams have won the World Series, the answer to both ques-tions cannot be yes. From the Chicago Tribune on September 26, 2016 (http://www.chicagotribune.com/sports/baseball/cubs/ct-spt-cubs-best-record-playo¤s-gfx-20160916-htmlstory.html),
"In a methodical stairstep over two weeks the Cubs locked up theNational League Central, home �eld throughout the NL playo¤s andnow, the best record in all of Major League Baseball. The bottomline: The team with the best record in baseball usually doesn�t winthe World Series. Since the beginning of the wild card era onlyfour of the 26 teams with the top record went on to win the WorldSeries: The 1998 and 2009 Yankees, and the 2007 and 2013 Red Sox.That�s 7 percent. But don�t despair, Cubs fans, the best teams eachseason have winning records overall in both the division series andthe championship series. In the division series, 15 top-record teamswon and advanced to the championship series, and then nine wenton to play in the World Series."
Perhaps we can never truly know which team is best despite trying to sta-tistically determine it. Statistics frequently tries to answer questions withoutthe ability to ever know the right answer.
12
Problem 42 How can I determine the e¤ectiveness of my teaching STAT 1107?Should I rely on end-of-semester student evaluations? Check out the web siteRate Your Professor?
7 Making Sound Data-based Decisions (Predict-ing the Future)
A key skill in statistics is to predict the unknown (or a future event) byanalyzing patterns in data sets. It is a safe bet that retail stores in a mallshould hire extra help starting around Thanksgiving. It is also a safe bet tonot count on that job lasting past the �rst week of January.Predicting the future based on past results works only up to a point. Sales
of VHS tapes steadily rose for many, many years. Then they didn�t whileDVD sales rose. Now, the format of choice is Blu-ray. Unforeseen eventsor catastrophes wreak havoc with predictions. Wayne Gretksy led his team inscoring in his �rst 14 seasons as a professional hockey player. It seams naturalto predict he would do so again in his 15th season. However a back injuryprevented him from playing as many games as he usually did.
8 Chance
Elvis Presley and David Bowie share the same birthday (January 8). Is thissurprising? Is this meaningful? Understanding probability is key to using datato make predictions or estimations.How many people do you need in a room to have a 50% chance that at least
two will share a birthday (disregarding year)?
9 Literacy and Homework
Mark Twain once said that "the man who doesn�t read good books has noadvantage over the man who can�t read them." Reading and writing are criticalskills for this class! Yes, this Statistics class! One must be careful with wordsand pay attention to their meaning. We rarely "solve for x" in this course. Weanalyze scenarios in order to determine what is going on and apply the besttechnique available. That requires reading skills.Vern Law, the 1960 Cy Young winner, one said "experience is a hard teacher
because she gives the test �rst, the lesson afterward." This class is much easiersince the lessons and homework are provided before the tests. Of course, youmust actually do the homework for the lesson to occur before the test!
13
10 Exercises
1. Identify �ve misuses of statistics in the following statement.A sports reporter on the local country radio station asked his listenersto call in and answer the following question: Do you support the use ofrandom drug tests to catch cheaters who soil the reputation of Baseball byusing steroids? The DJ reported that twenty people responded, 87% saidyes and 13% said no. The DJ concluded that Americans overwhelminglysupport random drug testing.
2. Navidi/Monk Section 1.1: 7-9, 17-20, 25, 26, 28, 29
3. Navidi/Monk Section 1.2: 5-10, 15-24, 33-40, 42, 47a, 47b, 48a, 48b,
4. Navidi/Monk Section 1.4: 10-13, 15-19, 21
14