chapter 1
DESCRIPTION
Vertical stress from surface loadingsTRANSCRIPT

CHAPTER 1 VERTICAL STRESSES DISTRIBUTION IN SOIL

LESSON OUTCOMES
At the end of this chapter, student should be able to:
a) Explain the meaning of total stress, effective stress and
overburden pressure.
b) Describe the concept of soil response to stress: elastic, plastic and
elasto-plastic.
c) Conduct empirical analysis and evaluate different stresses in soil
due to point load, line load, strip load, triangular strip load, uniformly
loaded circular area & uniformly loaded rectangular area using
Boussinesq Theory, Fadum’s and Newmark Chart.

The Kissing Silos
What?
Why?
How?

REVISION : STRESS CONCEPT
In ECG303, you have learned about stresses in soil.
• Stress is defined as the intensity of loading per unit area.
You also should be able to differentiate in between total stress and
effective stress.
Total stress, σ Effective stress, σ’
The stress carried by the soil particles
and pore water, u in the soil void.
The stress carried by soil particles
alone.
σ=σ’+u σ’=σ-u
Short term analysis before pore water
dissipates.
Long term analysis.
Soil deformation, strength and stability
depend on effective stress because
water cannot resist shear stress.
Undrained condition. Drained condition.
REMEMBER : STRESS
CONCEPTWILL BE USED
THROUGHOUT THIS COURSE

OVERBURDEN PRESSURE • Pressure or stress imposed on the soil by the weight of overlying
material, also known as lithostatic pressure.
• The vertical stress imposed at point
x is σ=ϒz • If there is surcharge on the surface,
the total vertical stress at point x now is
σ=ϒz+q
Depth, z Unit weight of soil, ϒ (kN/m3)
x
Surcharge, q
Single layer
The total vertical stress imposed at point x is
σ=ϒ1z1 + ϒ2z2 + ϒ3z3
z1
ϒ3
x
ϒ1
ϒ2
z2
z3
Multiple layer

OVERBURDEN PRESSURE
• If the ground water is at the ground level, then total vertical
stress is σ=ϒsatz
• And, the pore water pressure at
point x is u=ϒwz
• Therefore, the effective vertical stress
is σ’= σ-u σ’= ϒsatz – ϒwz or σ’= ϒ’ z where ϒ’=(ϒsat –ϒw)
Saturated soil
Depth, z Saturated unit weight, ϒsat (kN/m3)
x
GWL
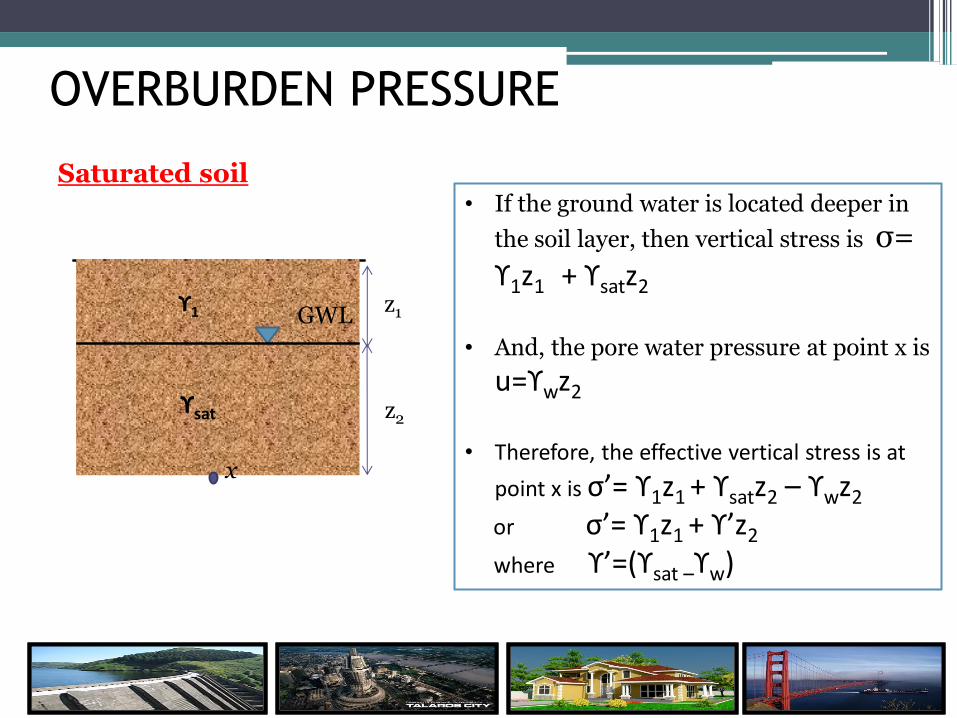
OVERBURDEN PRESSURE
• If the ground water is located deeper in
the soil layer, then vertical stress is σ= ϒ1z1 + ϒsatz2
• And, the pore water pressure at point x is
u=ϒwz2
• Therefore, the effective vertical stress is at
point x is σ’= ϒ1z1 + ϒsatz2 – ϒwz2 or σ’= ϒ1z1 + ϒ’z2
where ϒ’=(ϒsat –ϒw)
Saturated soil
z1
ϒsat
x
GWL
z2
ϒ1

SOIL RESPONSE TO STRESS
Foundation soil fails in supporting the
load.
An engineer must
ensure that a
geotechnical structure
must not collapse
under exposed
loading→ have to
determine stress and
strain in soil due to
external load.

SOIL RESPONSE TO STRESS
• In mechanics, material response can be demonstrate
using stress-strain curve.
a) Elastic –
recovers its original
configuration during
unloading.
b) Plastic –
permanent deformation
(irrecoverable)
c) Yield point –
beyond this point, the
material start to behave
plastically.

SOIL RESPONSE TO STRESS
What is soil behaviour? • Soil is very complex material. In general, soil is behaving
as an elasto-plastic material.
• Elasto-plastic material undergoes both elastic and
plastic deformation during loading.
• At small strains, soil behave like
an elastic material and thereafter
like an elastoplastic material

SOIL RESPONSE TO STRESS
WHY it is IMPORTANT????????
• Calculate settlement • Proposed suitable foundation system • Remedial work to strengthen up the soil • Suggest for other construction site

STRESSES IN SOIL FROM
SURFACE LOAD.
• Point load • Vertical load transferred from
an electric power pole line.
• Line Load • Long brick wall
• Circular load • Water tannk

STRESSES IN SOIL FROM
SURFACE LOAD.
• Strip load • Long road embankment
• Triangular load • Side of an embankment
• Rectangular load • Structural foundation

STRESSES IN SOIL FROM
SURFACE LOAD.
What factors affecting the stress distribution in soil? 1 - Size and shape of foundation. 2 – Type of Load distribution. 3 - Contact pressure (surcharge load) 4 - Modulus of elasticity – Type of soil. 5 - Rigid boundary – stress increased is considered if the depth is less than 4B.

STRESSES CHANGES IN
SOIL FROM SURFACE LOAD.
Why need to learn? To know how surface stresses are distributed in the soil and resulting deformation.
Soil is elastic plastic material, so how to calculate stress?
To do stress analysis on soil, we must assumed that • soil is elastic and modulus of elasticity is constant. • Soil mass is homogeneous, isotropic. • Soil is semi-infinite (elastic half space)
By using this assumptions, we can apply Boussinesq’s Equation.

CHANGE IN VERTICAL
STRESSES UNDER POINT LOAD
Where Ip is the Influence Factor
Or alternatively, Ip can be obtained from Table 1.1.
Depth,
x
𝐼𝑃 =3
2𝜋
1
1 + 𝑥𝑧
2
52
Point load, P (kN) ∆𝜎𝑧=𝑃
𝑧2× 𝐼𝑃

Table 1.1 Influence Factor for Point Load
VERTICAL STRESSES
UNDER POINT LOAD
x/z x/z x/z

VERTICAL STRESSES UNDER
POINT LOAD
• Figure shows the distribution of pressure form point load (After Craig, 2001).

VERTICAL STRESSES UNDER
POINT LOAD - Example P1=1200 kN
P2=600 kN
x1=2m x2=6m
Load z x x/z Ip P Δσz (kN/m2)
P1 2 2 1 0.0844 1200 25.32
P2 2 6 3 0.0015 600 0.225
Vertical stress increased at Point A is 25.55 kN/m2
Solution (You can tabulated answer for simplicity)
z=2m

CHANGE IN VERTICAL STRESSES
UNDER LINE LOAD
(kN/m)
Where IL is the Influence Factor
𝐼𝐿 =2
𝜋
1
1 + 𝑥𝑧
2
12
Alternatively, IL can be obtained from Table 1.2.
∆𝜎𝑧=𝑃
𝑍× 𝐼𝐿
P (kN/m)

Table 1.2 Influence Factor, IL for Line Load
VERTICAL STRESSES
UNDER LINE LOAD
x/z x/z x/z

VERTICAL STRESSES UNDER
LINE LOAD -Example TWO (2) parallel line loads of 100 kN/m and 50 kN/m respectively and 2 m apart, act vertically on a horizontal soil surface. Calculate the vertical stress increase at depth of 2 m directly at the middle points between them.
Q1=100 kN/m Q2=50 kN/m
x1=1m x2=1m z=2m
Load z x x/z IL P Δσz (kN/m2)
Q1 2 1 0.5 0.2733 100 13.655
Q2 2 1 0.5 0.2733 50 6.83
Vertical stress increased is 20.485
Solution
Sketch out the situation

VERTICAL STRESSES
UNDER CIRCULAR LOAD
Where Ic is the Influence Factor
𝐼𝐶 = 1 −1
1 + 𝑎𝑧
2
32
Alternatively, Ic can be obtained from Table 1.3.
x
radius
∆𝜎𝑧= 𝑃 × 𝐼𝐶
P (kN/m2)

VERTICAL STRESSES
UNDER CIRCULAR LOAD Table 1.3 Influence Factor, Ic for Circular Load
x/a

VERTICAL STRESSES UNDER
CIRCULAR LOAD - Example
𝜎𝑧 = 𝑄𝐼𝐶
𝐼𝐶 = 1 −1
1 + 𝑎𝑧
2
32
A circular area with radius 1.6 m, induced a soil pressure at the surface of 100 kPa. Calculate the pressure at a depth of 3.2 m directly under the center of the circular area.
z x z/a x/a A B Ic (A+B) Δσz
(kN/m2)
3.2 0 2 0 0.106 0.179 0.285 28.5
Solution
Radius = a = 1.6m Top value
Bottom value

VERTICAL STRESSES UNDER
UNIFORM STRIP LOAD
Where IS is the Influence Factor
𝐼𝑠 =𝛼 + sin 𝛼 𝑐𝑜𝑠 𝛼 + 2𝛽
𝜋
Alternatively, Ip can be obtained from Table 1.4.
2b P
(kN/m2)
∆𝜎𝑧=𝑃
𝑍× 𝐼𝑆

VERTICAL STRESSES UNDER
UNIFORM STRIP LOAD
Table 1.4 Influence Factor, Is for Uniform Strip Load
x/b
z/b 0.10 0.20 0.40 0.60 0.80 1.00 1.25 1.50 2.00 3.00 5.00 10.00
0.00 1.000 1.000 1.000 1.000 1.000 0.500 0.000 0.000 0.000 0.000 0.000 0.000
0.20 0.997 0.996 0.992 0.979 0.979 0.500 0.059 0.011 0.002 0.000 0.000 0.000
0.40 0.977 0.973 0.955 0.906 0.773 0.498 0.178 0.059 0.011 0.001 0.000 0.000
0.60 0.937 0.928 0.896 0.825 0.691 0.495 0.258 0.120 0.030 0.004 0.000 0.000
0.80 0.881 0.869 0.829 0.755 0.638 0.489 0.305 0.173 0.056 0.010 0.001 0.000
1.00 0.818 0.805 0.766 0.696 0.598 0.480 0.332 0.214 0.084 0.017 0.002 0.000
1.20 0.755 0.743 0.707 0.646 0.564 0.466 0.347 0.243 0.111 0.026 0.004 0.000
1.40 0.696 0.685 0.653 0.602 0.534 0.455 0.354 0.263 0.135 0.037 0.005 0.000
1.60 0.642 0.633 0.605 0.562 0.515 0.440 0.356 0.276 0.155 0.048 0.008 0.000
1.80 0.593 0.585 0.563 0.526 0.497 0.425 0.353 0.284 0.172 0.060 0.010 0.000
2.00 0.550 0.543 0.524 0.494 0.455 0.409 0.348 0.288 0.185 0.071 0.013 0.001
2.50 0.462 0.456 0.445 0.426 0.400 0.370 0.328 0.285 0.205 0.095 0.022 0.002
3.00 0.396 0.393 0.385 0.372 0.355 0.334 0.305 0.274 0.211 0.114 0.032 0.003
3.50 0.345 0.343 0.338 0.329 0.317 0.302 0.281 0.258 0.210 0.127 0.042 0.004
4.00 0.306 0.304 0.301 0.294 0.285 0.275 0.259 0.242 0.205 0.134 0.051 0.006
5.00 0.248 0.247 0.245 0.242 0.237 0.231 0.222 0.212 0.188 0.139 0.065 0.010
6.00 0.208 0.208 0.207 0.205 0.202 0.198 0.192 0.186 0.171 0.136 0.075 0.015
8.00 0.158 0.157 0.157 0.156 0.155 0.153 0.150 0.147 0.140 0.122 0.083 0.025
10.00 0.126 0.126 0.126 0.126 0.125 0.124 0.123 0.121 0.117 0.107 0.082 0.032
15.00 0.085 0.085 0.085 0.084 0.084 0.084 0.083 0.083 0.087 0.078 0.069 0.041
20.00 0.054 0.064 0.064 0.063 0.063 0.063 0.063 0.063 0.062 0.061 0.056 0.041
50.00 0.025 100.00 0.013
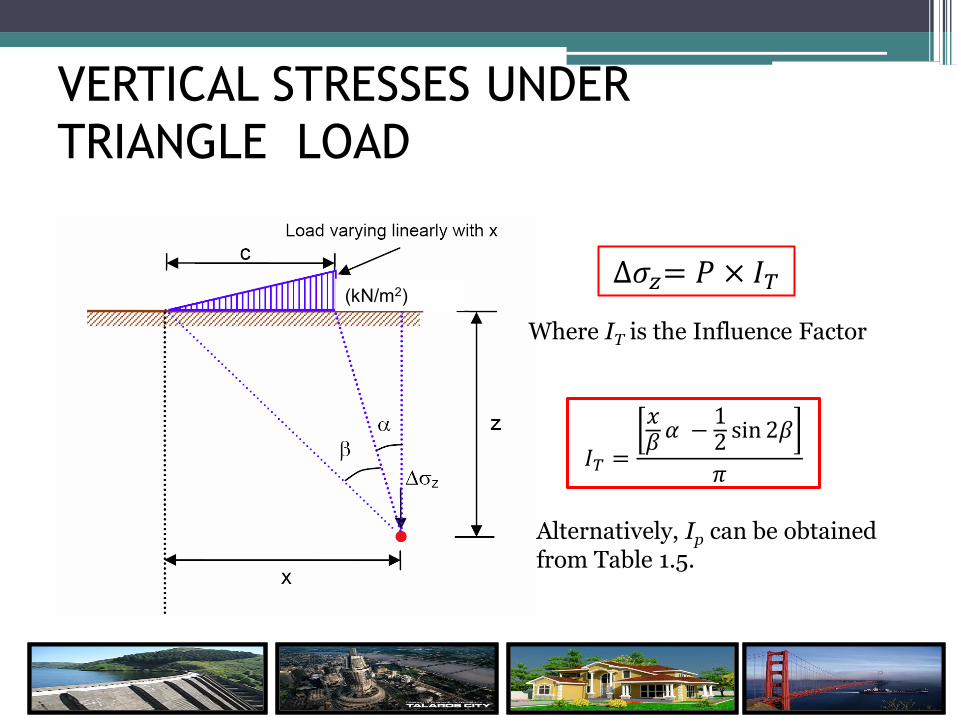
VERTICAL STRESSES UNDER
TRIANGLE LOAD
(kN/m2)
Where IT is the Influence Factor
Alternatively, Ip can be obtained from Table 1.5.
𝐼𝑇 =
𝑥𝛽𝛼 −
12sin 2𝛽
𝜋
∆𝜎𝑧= 𝑃 × 𝐼𝑇

VERTICAL STRESSES UNDER
TRIANGLE LOAD
x/c
z/c -2.00 -1.50 -1.00 -0.50 0.00 0.20 0.40 0.60 0.80 1.00 1.25 1.50 2.00
0.00 0.000 0.000 0.000 0.000 0.000 0.200 0.400 0.600 0.800 0.500 0.000 0.000 0.000
0.20 0.000 0.000 0.000 0.002 0.061 0.209 0.395 0.577 0.697 0.437 0.050 0.009 0.001
0.40 0.000 0.001 0.003 0.013 0.110 0.227 0.372 0.497 0.527 0.379 0.136 0.042 0.007
0.60 0.001 0.003 0.008 0.031 0.140 0.023 0.334 0.409 0.414 0.328 0.177 0.080 0.018
0.80 0.003 0.006 0.016 0.049 0.155 0.225 0.294 0.339 0.337 0.285 0.187 0.106 0.032
1.00 0.005 0.011 0.025 0.064 0.159 0.211 0.258 0.286 0.283 0.250 0.184 0.121 0.046
1.20 0.008 0.016 0.034 0.075 0.157 0.195 0.227 0.245 0.243 0.221 0.175 0.126 0.057
1.40 0.011 0.021 0.041 0.083 0.151 0.179 0.202 0.215 0.213 0.197 0.165 0.127 0.066
1.60 0.015 0.026 0.048 0.087 0.143 0.165 0.182 0.190 0.189 0.178 0.154 0.124 0.072
1.80 0.018 0.031 0.053 0.089 0.135 0.152 0.164 0.171 0.170 0.161 0.143 0.120 0.076
2.00 0.021 0.035 0.057 0.089 0.127 0.140 0.150 0.155 0.015 0.148 0.134 0.115 0.078
2.50 0.028 0.042 0.062 0.086 0.110 0.117 0.122 0.125 0.124 0.121 0.113 0.103 0.078
3.00 0.033 0.046 0.062 0.080 0.095 0.100 0.103 0.105 0.104 0.102 0.095 0.091 0.074
3.50 0.037 0.048 0.060 0.073 0.084 0.087 0.089 0.090 0.090 0.089 0.085 0.081 0.069
4.00 0.038 0.048 0.058 0.067 0.075 0.077 0.078 0.079 0.079 0.076 0.076 0.073 0.064
5.00 0.039 0.045 0.051 0.057 0.061 0.062 0.063 0.063 0.063 0.062 0.062 0.060 0.055
6.00 0.037 0.041 0.046 0.049 0.052 0.052 0.530 0.053 0.053 0.052 0.052 0.051 0.048
8.00 0.032 0.035 0.037 0.038 0.039 0.039 0.040 0.040 0.040 0.039 0.039 0.039 0.038
10.00 0.028 0.029 0.030 0.031 0.032 0.032 0.032 0.032 0.032 0.032 0.032 0.031 0.031
15.00 0.020 0.020 0.021 0.021 0.021 0.021 0.021 0.021 0.021 0.021 0.021 0.021 0.021
20.00 0.015 0.016 0.016 0.016 0.016 0.016 0.016 0.016 0.016 0.016 0.016 0.016 0.016
50.00 0.006 0.006 0.006 0.006 0.006 0.006 0.006 0.006 0.006 0.006 0.006 0.006 0.006
Table 1.5 Influence Factor, Is for Triangle Load

VERTICAL STRESSES UNDER TRIANGLE
& STRIP LOAD - Example
A 6 m high embankment with unit weight of 20 kN/m3 is as shown below. Determine the increase in vertical stress at depth of 3.2 m at points A upon completion of the embankment.
6 m 8 m

c z x z/c x/c IT σz (kN/m2)
8 3.2 14 0.4 1.75 0.0245 120(0.0245) =2.94
Triangular load Embankment loading, 𝑞 = 𝛾𝐻 = 20 6 = 120𝑘𝑁/𝑚2
By referring to table 1.5, no value 1.75 at row x/c. So, need to interpolate IT. Interpolation technique:
2.00 1.50
0.007 0.042 IT
1.75
Refer row z/c=0.4
First, write down the equation 2.00 − 1.50
0.007 − 0.042=2.00 − 1.75
0.007 − 𝐼𝑇
Then rearrange, (2-1.5)(0.007-IT) = (2-1.75)(0.007-0.042)
3.5x10⁻³ – 0.5IT = -8.75x10⁻³
IT = 0.0245
?

x/c
z/c -2.00 -1.50 -1.00 …….... 1.25 1.50 2.00
0.20 0.000 0.000 0.000 …….... 0.050 0.009 0.001
0.40 0.000 0.001 0.003 …….... 0.136 0.042 0.007
0.60 0.001 0.003 0.008 …….... 0.177 0.080 0.018
1.75
?
2.00 1.50
0.007 0.042 IT
1.75
Triangle load
Transfer the value into this diagram

b z x z/b x/b IS σz (kN/m2)
6 3.2 3 0.53 0.5 0.885 120(0.885)=106.2
Strip load Embankment loading, 𝑞 = 𝛾𝐻 = 20 6 = 120𝑘𝑁/𝑚2
By referring to table 1.4, no value 0.5 at row x/b and no value of 0.53 at row z/b. So, need to interpolate IS three 5(3) times. Interpolation 1: (refer to z/b=0.4 and x/b between 0.4 &0.6)
First, write down the equation 0.6 − 0.4
0.906 − 0.955=
0.6 − 0.5
0.906 − 𝑎
Then rearrange, (0.6-0.4)(0.906-a) = (0.6-0.5)(0.906-0.955)
0.1812– 0.2a = -4.9x10⁻³
a = 0.9305
0.6 0.4
0.906 0.955 a
0.5
Refer row z/b=0.6

x/b
z/b 0.10 0.20 0.40 0.60 0.80
0.00 1.000 1.000 1.000 1.000 1.000
0.20 0.997 0.996 0.992 0.979 0.979
0.40 0.977 0.973 0.955 0.906 0.773
0.60 0.937 0.928 0.896 0.825 0.691
0.80 0.881 0.869 0.829 0.755 0.638
Strip load
0.53
0.5
a Interpolation 1
Interpolation 3
Interpolation 2 b
c

Interpolation 2: (refer to z/b=0.6 and x/b between 0.4 &0.6)
0.6 0.4
0.825 0.896 b
0.5
Refer row z/b=0.6
First, write down the equation 0.6 − 0.4
0.825 − 0.896=
0.6 − 0.5
0.825 − 𝑏
Then rearrange, (0.6-0.4)(0.825-b) = (0.6-0.5)(0.825-.896)
0.165– 0.2b = -7.1x10⁻³
b = 0.8605 Interpolation 3: (refer to z/b between 0.4&0.6 and and x/b = 0.5)
0.6 0.4
0.8605 0.9305 IS
0.53
Refer row z/b=0.6
First, write down the equation 0.6 − 0.4
0.8605 − 0.9305=
0.6 − 0.53
0.8605 − 𝐼𝑆
Then rearrange,
(0.6-0.4)(0.8605-IS) = (0.6-0.53)(0.8605-0.9305)
0.1721– 0.2IS = -4.9x10⁻³
IS = 0.885

Total vertical stress induced in the soil mass due to surface loading is : = Triangular + Strip = 2.94 + 106.2 = 109.14 kN/m2

VERTICAL STRESSES UNDER
RECTANGULAR LOAD
Where IR is the Influence Factor
Alternatively, IR can be obtained from Table 1.6 or by Using Fadum’s Chart.
𝐼𝑅 =1
4𝜋
2𝑚𝑛 𝑚2 + 𝑛2 + 1
𝑚2 + 𝑛2 +𝑚2𝑛2 + 1
𝑚2 + 𝑛2 + 2
𝑚2 + 𝑛2 + 1
+ tan−12𝑚𝑛 𝑚2 + 𝑛2 + 1
𝑚2 + 𝑛2 −𝑚2𝑛2 + 1
Where m=Longer span, L/z n=Shorter span, B/z (L or B can be interchangeable)
∆𝜎𝑧= 𝑃 × 𝐼𝑅

VERTICAL STRESSES UNDER
RECTANGULAR LOAD
Table 1.6 Influence Factor, IR for Rectangular Load
L/z
B/z 0.7 0.2 0.3 0.4 0.5 0.6 0.7 0.8 0.9 1.0 1.4 2.0 3.0 5.0
0.1 0.0047 0.0092 0.0132 0.0168 0.0198 0.0222 0.0242 0.0258 0.0270 0.0279 0.0301 0.0311 0.0315 0.0316 0.0316
0.2 0.0092 0.0179 0.0259 0.0328 0.0387 0.0435 0.0474 0.0504 0.0528 0.0547 0.0589 0.0610 0.0620 0.0620 0.0620
0.3 0.0132 0.0259 0.0374 0.0474 0.0560 0.0630 0.0686 0.0731 0.0766 0.0794 0.0856 0.0887 0.0898 0.0901 0.0902
0.4 0.0168 0.0328 0.0474 0.0602 0.0711 0.0801 0.0873 0.0931 0.0977 0.1013 0.1094 0.1134 0.1150 0.1154 0.1154
0.5 0.0198 0.0387 0.0560 0.0711 0.0840 0.0947 0.1034 0.1104 0.1158 0.1202 0.1300 0.1350 0.1368 0.1374 0.1375
0.6 0.0222 0.0435 0.0629 0.0801 0.0947 0.1069 0.1168 0.1247 0.1310 0.1361 0.1475 0.1533 0.1555 0.1561 0.1562
0.7 0.0240 0.0474 0.0686 0.0873 0.1034 0.1168 0.1277 0.1365 0.1436 0.1491 0.1620 0.1686 0.1711 0.1719 0.1720
0.8 0.0258 0.0504 0.0731 0.0931 0.1104 0.1247 0.1365 0.1461 0.1537 0.1598 0.1739 0.1812 0.1841 0.1849 0.1850
0.9 0.0270 0.0528 0.0766 0.0977 0.1158 0.1311 0.1436 0.1537 0.1619 0.1684 0.1836 0.1915 0.1947 0.1956 0.1958
1.0 0.0279 0.0547 0.0794 0.1013 0.1202 0.1361 0.1491 0.1598 0.1684 0.1752 0.1914 0.1999 0.2034 0.2044 0.2046
1.4 0.0301 0.0589 0.0856 0.1094 0.1300 0.1475 0.1620 0.1739 0.1836 0.1914 0.2102 0.2206 0.2250 0.2263 O.2266
2.0 0.0311 0.0610 0.0887 0.1134 0.1350 0.1533 0.1686 0.1812 0.1915 0.1999 0.2206 0.2325 0.2378 0.2395 0.2399
3.0 0.0315 0.0618 0.0898 0.1150 0.1368 0.1555 0.1711 0.1841 0.1947 0.2034 0.2250 O.2378 0.2420 0.2461 0.2465
5.0 0.0316 0.0620 0.0901 0.1154 0.1374 0.1561 0.1719 0.1849 0.1956 0.2044 0.2263 0.2395 0.2461 0.2486 0.2491
0.0316 0.0620 0.0902 0.1154 0.1375 0.1562 0.1720 0.1850 0.1958 0.2046 0.2266 0.2399 0.2465 0.2492 0.2500

VERTICAL STRESSES UNDER
RECTANGULAR LOAD
FADUM’S CHART
• The influence values referred to this chart is strictly for corner of a rectangular loaded foundation only.
• For points other than the corner, value of IR may be obtained by superpositions of rectangles

VERTICAL STRESSES UNDER
RECTANGULAR LOAD
SUPERPOSITIONS OF RECTANGLES
(a) Ir = Ir directly from table 1.6 or Fadum’s Chart (b) Ir = Ir AFIE + FBGI + GCHI +HDEI (c) Ir = Ir AEFD + EBCF (d) Ir = Ir GIAE – GHBE – GIDF +GHCF

VERTICAL STRESSES UNDER
RECTANGULAR LOAD - Example
Find the vertical stress at z = 2.5 m for a rectangular loading of q = 100kPa as shown below points R, S, T & U.
(Solid line denotes rectangular loading area)
Loaded area
Unloaded area

VERTICAL STRESSES UNDER
RECTANGULAR LOAD - Example
Point L B z L/z (m)
B/z (n)
IR σz
(kN/m2)
R
2 1.5 2.5 0.8 0.6 0.128 25.6
S
3 1 2.5 1.2 0.4 0.108 (0.108)(100) x 2 =21.6
T 4 1
1 1
2.5 2.5
1.6 0.4
0.4 0.4
0.112 0.06
(0.112-0.06)(100)
x 2 = 10.4
1.5=B
2=L
1=B
4=L
3=L
1=B
Consider half space
Consider half space
Where m=Longer span, L/z n=Shorter span, B/z (L or B can be interchangeable)

Point L B z L/z (m)
B/z (n)
IR σz
(kN/m2)
U (refer
dimension from question)
Box 1 4 3 2.5 1.6 1.2 0.205 20.5
Box 2
3 1 2.5 1.2 0.4 0.108 10.8
Box 3 4 1 2.5 1.6 0.4 0.112 11.2
Box 4 1 1 2.5 0.4 0.4 0.06 6
VERTICAL STRESSES UNDER
RECTANGULAR LOAD - Example
3
1
4 1
1 1
3
4
3
1 2
4

VERTICAL STRESSES UNDER
RECTANGULAR LOAD - Example
U
The vertical stress increment at point U is : = [box 1] – [box 2]-[box 3]+[box4] = 20.5 – 10.8 – 11.2 + 6 = 4.5 kN/m2
3
1 2
4

VERTICAL STRESSES UNDER
IRREGULAR SHAPE AREA
Value of n and I can be calculated from
Newmark’s Influence Chart
∆𝜎𝑧= 𝑄nI
Where Q= load per unit area n= number of influence units I=Influence value
The vertical stress are:

VERTICAL STRESSES UNDER
IRREGULAR SHAPE AREA - Example
Find the vertical stress at point U at a depth of 10 m with q= 100 kPa using Newmark’s Influence Chart.
Newmark’s Influence Chart

1. By using the depth scale at the bottom right of the chart, scaled out the foundation and draw with point U at the center of the chart.,
i.e. length AB=32mm depth = 10 m as given so, the scaled is 1 m=3.2mm if 4m= 12.8mm if 6m= 19.2mm if 10m =32mm if 1m= 3.2mm 2. Calculate the numbers of segment
covered by the foundation. For example 46. 3. Use the stress equation
U
VERTICAL STRESSES UNDER
IRREGULAR SHAPE AREA - Example
𝜎𝑧 = 𝑄nI 𝜎𝑧 = 100(46)(0.005)
σz= 23 kN/m2
Given z=10m

SUMMARY OF THE TOPIC VERTICAL STRESS
a) Explain the total stress and effective stress analysis.
b) Solve total stress and effective stress problems due to overburden pressure.
c) Analyze the empirical analysis for -point load, -line load, -strip load, -circular load -rectangular load by -using Boussinesq theory, -using Fadum’s Chart -using Newmark’s Chart.
- able to define x, a, b, c, L, B parameter
- know how to read table for influence factor
- able to do interpolation
HAPPY REVISING. DO WELL IN your
ASSESSMENTS!!!