chap 8 a four-step process for valuing real options
TRANSCRIPT

Chap 8
A Four-Step Process for Valuing Real Options
A Four-Step Process for Valuing Real Options
To avoid this complexity, we use two assumptions.
The first is the MAD (marketed asset disclaimer) that uses the present value of the underlying risky asset without flexibility as if it were a marketed security.
The second, is that properly anticipated prices (or cash flows) fluctuate randomly.

A four-step process
Step 1 is a standard net present value analysis of the project using traditional techniques.
We forecast the entity-free cash flows over the life of the project; or if the investment is an acquisition, we value the target company whose cash flows are expected to last indefinitely.

The second step is to build an event tree, based on the set of combined uncertainties that drive the volatility of the project.
An event tree does not have any decisions built into it. We assume that in most cases, the multiple
uncertainties that drive the value of a project can be combined, via a Monte Carlo analysis, into a single uncertainty.
When we combine all uncertainties into the single uncertainty of the value of the project, we call this the consolidated approach for dealing with uncertainty.


Samuelson’s proof that properly anticipated
prices fluctuate randomly If the cycle evolves as expected, investors
receive their required return – exactly. Only deviations from the expected cycle will
keep the stock price from changing as expected. But these deviations are caused by random
events. Consequently, deviations from the expected rate
of return are also random.

Samuelson starts his proof by assuming that the spot price of an asset, St+1, follows a stationary autoregressive scheme, assuming that the coefficient of adjustment, a, is less than one and that the error term is distributed normally with mean zero and standard deviation sigma (σ).

1
( )
( ) 0t t
t
t t t
E S S
VAR S
S aS
1
2 2 21
( ) ( ),since ( ) 0
( ) ( ( )) ( )
t t t
t t t t t
E S aE S E
VAR S E aS aE S E

2 1 1
1
21
( )t t t
t t t
t t t
S aS
a aS
a S a
2
2 1( ) ( ),since ( ) ( ) 0t t t tE S a E S E E
2 2 22 1
2 2 21 1
2 2 2
2 2
( ) ( ( ))
( 2 )
( 1)
t t t t t
t t t t
VAR S E a S a a E S
E a a
a
a

Covariance between error terms of adjacent time periods is zero
(i.e., E(εt,εt-1) = COV(εt, εt-1) = 0)
Also, the squared error terms from one time period are equal to those of the next period, therefore, E(εt )2 = E(εt+1 )2 =
2


1 2
2
1,
( ) ( ) ( )
( )
t t t t T
t T
a
S E S E S E S
VAR S T
3 3
3 21 2 3
3 21 2 3
( )
( )
( )
,since ( ) ( ) ( ) 0
t T t t
t t t
t t t t t
t t t t t t t
F E S
F E S
E a S a a
a S E a E a E

3 21 3 1 1 2 3
3 21 1 2 1 3
( )
,since ( ) ( ) 0
t t t t t t
t t t t t t
F E a S a a
a S a E a E
3 3 2
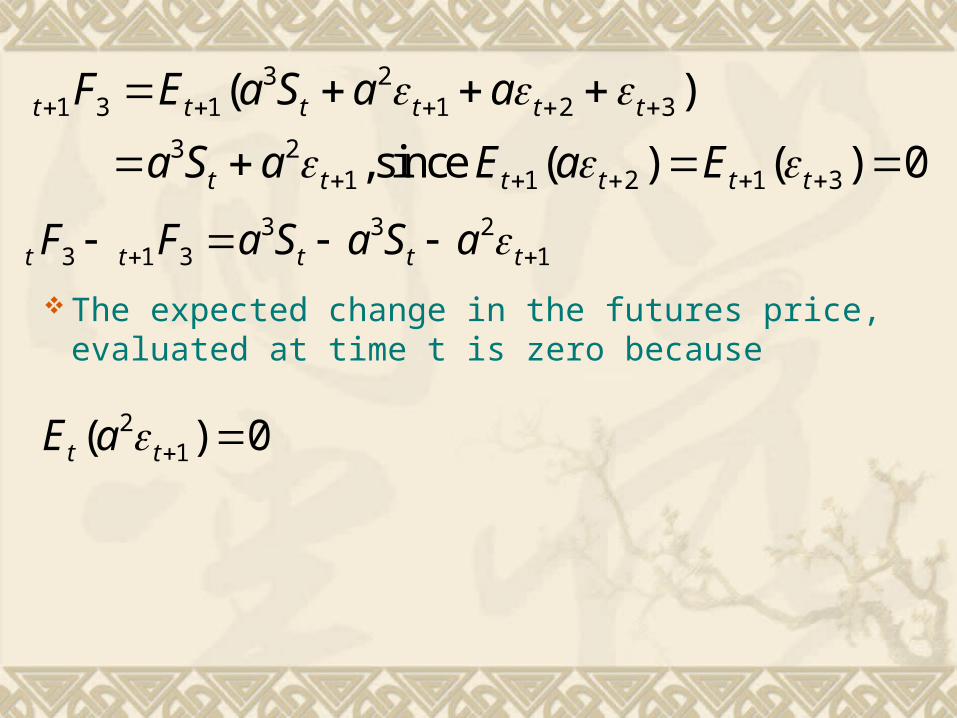
3 1 3 1t t t t tF F a S a S a
The expected change in the futures price, evaluated at time t is zero because
21( ) 0t tE a

2 2 4 21 3 3 1 1
4 21 3 3
2 22 3 1 3
23 3 2 3
[ ] [( ) ]
[ ]
[ ]
[ ]
t t t t
t t
t t
t t
VAR F F E a a
VAR F F a
VAR F F a
VAR F F
Note that with a< 1, the variance increases as o
ne gets closer to maturity. But if a = 1, the futures price is a random walk w
ith zero drift and with a standard deviation of a , constant across time.


Numerical examples to demonstrate Samuelson’s proof
21)(
u
buoddPV
2
2
1)(
u
buevenPV
2
2
2 22 2
1 1$100 $200
1.2 1.2( ) ( )
1 1 1 11 1
1.2 1.2
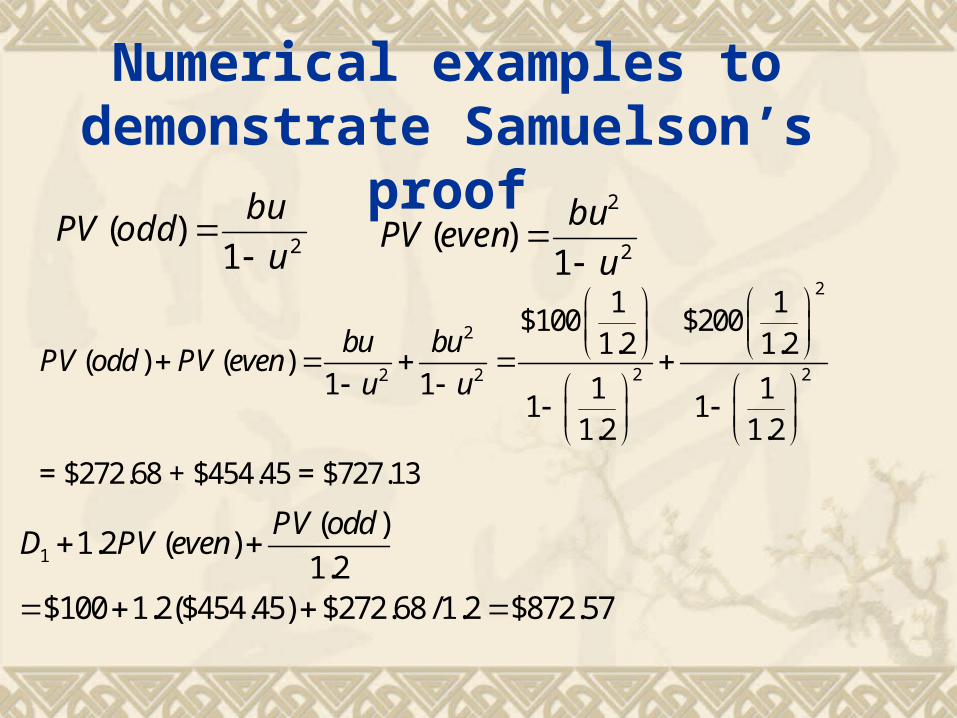
= $272.68 + $454.45 = $727.13
bu buPV odd PV even
u u
1
( )1.2 ( )
1.2$100 1.2($454.45) $272.68 /1.2 $872.57
PV oddD PV even
Empirical evidence in support of Samuelson’s proof
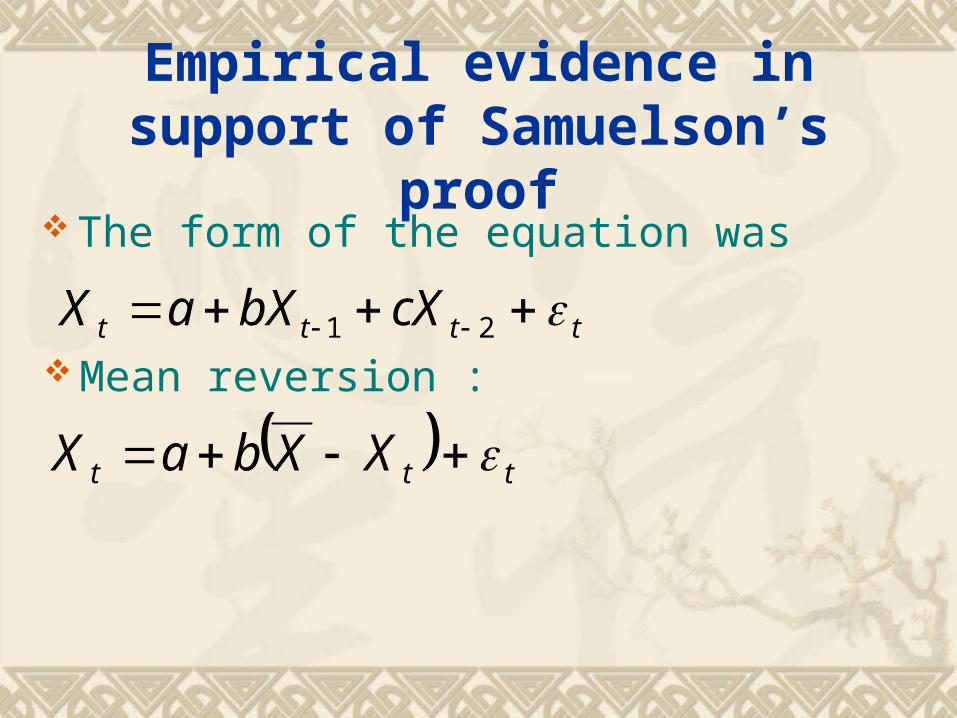
The form of the equation was
tttt cXbXaX 21
Mean reversion :
ttt XXbaX

