changing dynamics in the global seaborne thermal coal...
TRANSCRIPT
Changing Dynamics in the Global Seaborne Thermal Coal Markets & Stranded Asset Risk
“Climate Change poses risks to which financial market regulators and company boards have, to-date, given little attention.”
Dr Martin Parkinson, August 2015
Tim Buckley, Director of Energy Finance Studies, Australasia
November 2015
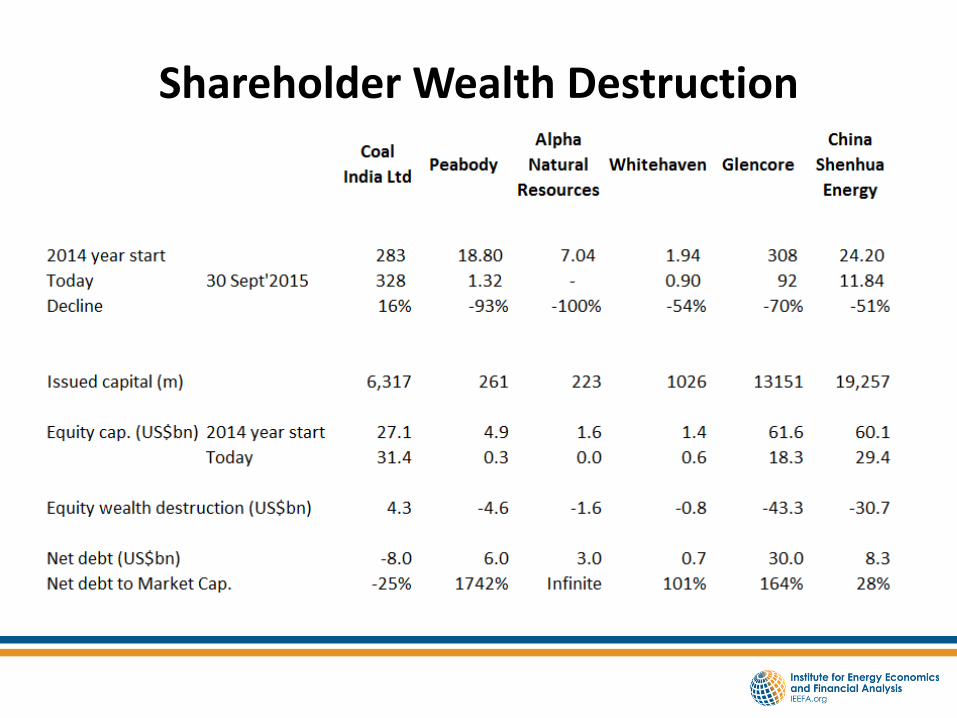
Shareholder Wealth Destruction
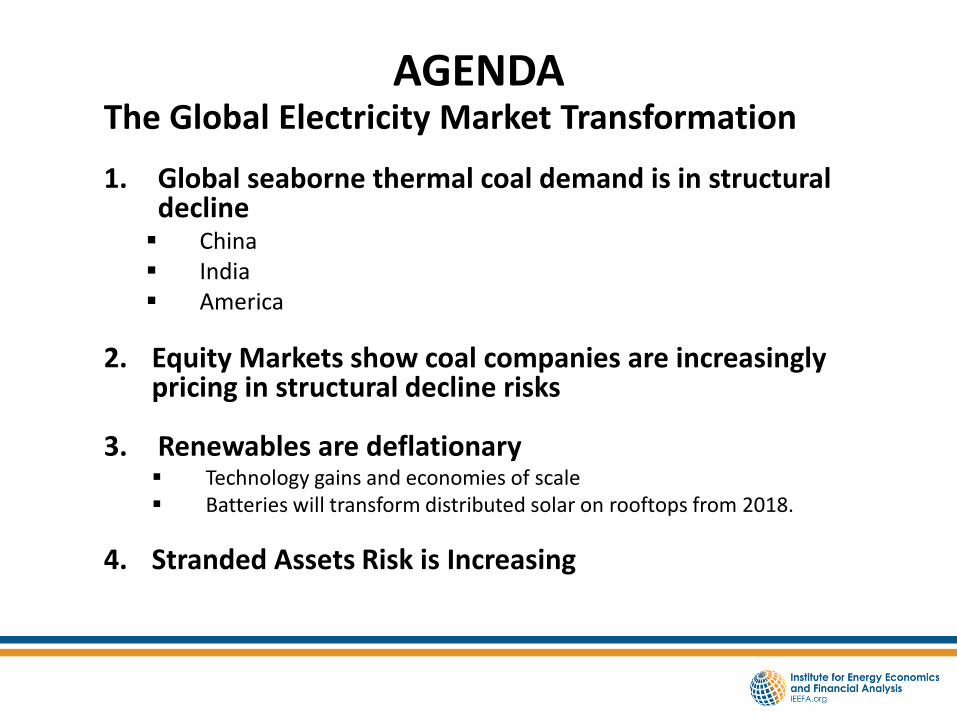
AGENDAThe Global Electricity Market Transformation
1. Global seaborne thermal coal demand is in structural decline China India America
2. Equity Markets show coal companies are increasingly pricing in structural decline risks
3. Renewables are deflationary Technology gains and economies of scale Batteries will transform distributed solar on rooftops from 2018.
4. Stranded Assets Risk is Increasing
3
1. A long cyclical downturn or structural decline?
China, India and the US are the three largest coal consuming nations globally.
Each are undergoing a rapid electricity transformation, away from coal.
4
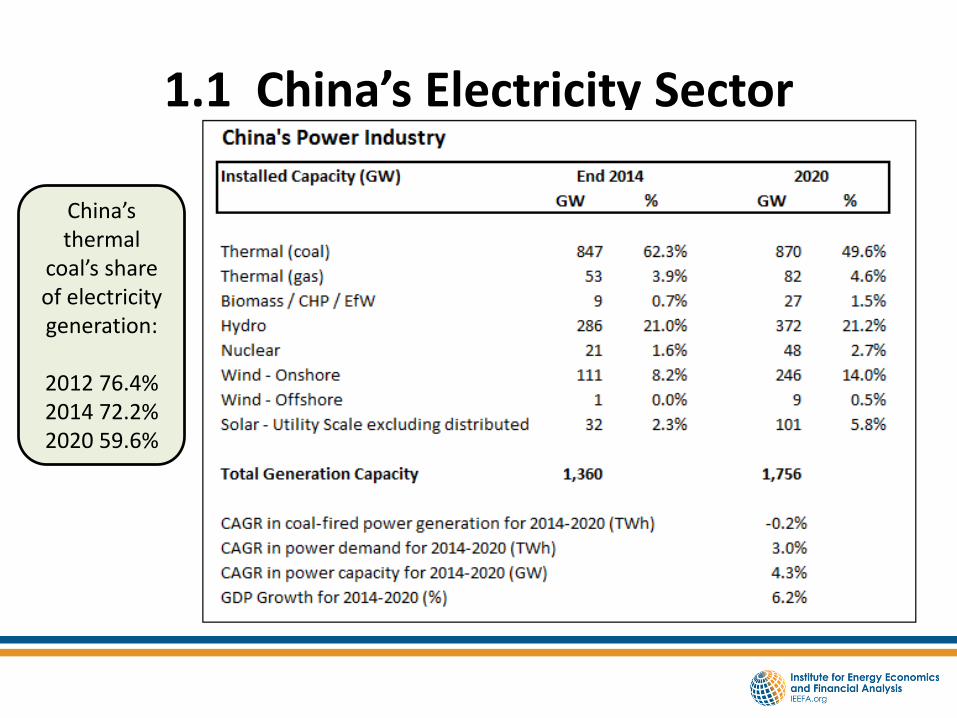
1.1 China’s Electricity Sector
5
China’s thermal
coal’s share of electricity generation:
2012 76.4%2014 72.2%2020 59.6%
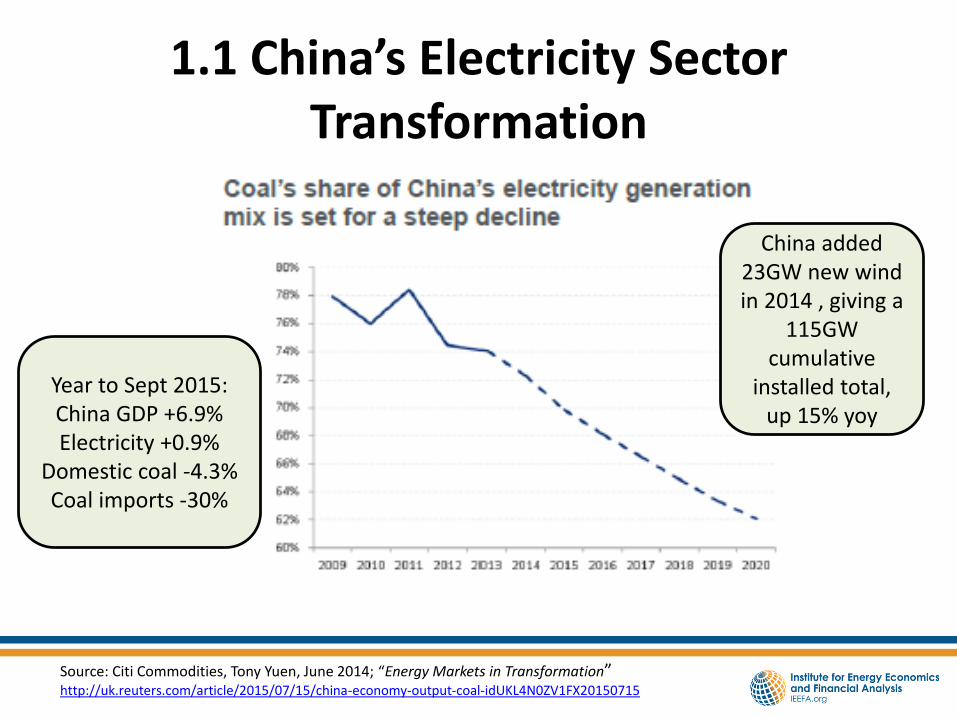
1.1 China’s Electricity Sector Transformation
China added 23GW new wind in 2014 , giving a
115GW cumulative
installed total, up 15% yoy
Year to Sept 2015:China GDP +6.9%Electricity +0.9%
Domestic coal -4.3%Coal imports -30%
Source: Citi Commodities, Tony Yuen, June 2014; “Energy Markets in Transformation”http://uk.reuters.com/article/2015/07/15/china-economy-output-coal-idUKL4N0ZV1FX20150715 6
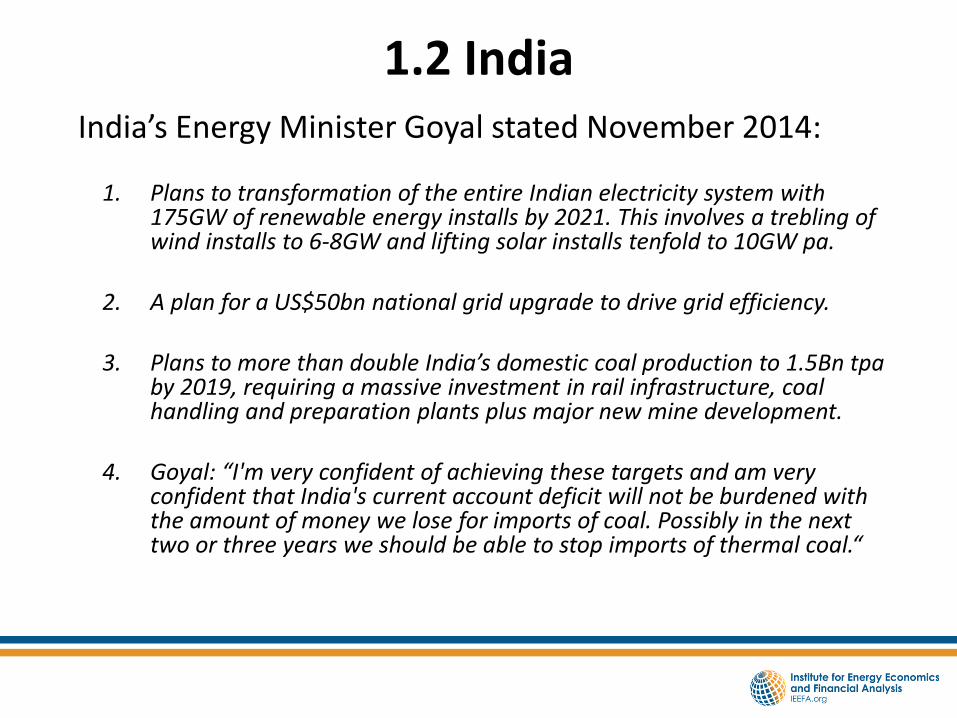
1.2 IndiaIndia’s Energy Minister Goyal stated November 2014:
1. Plans to transformation of the entire Indian electricity system with 175GW of renewable energy installs by 2021. This involves a trebling of wind installs to 6-8GW and lifting solar installs tenfold to 10GW pa.
2. A plan for a US$50bn national grid upgrade to drive grid efficiency.
3. Plans to more than double India’s domestic coal production to 1.5Bn tpa by 2019, requiring a massive investment in rail infrastructure, coal handling and preparation plants plus major new mine development.
4. Goyal: “I'm very confident of achieving these targets and am very confident that India's current account deficit will not be burdened with the amount of money we lose for imports of coal. Possibly in the next two or three years we should be able to stop imports of thermal coal.“
7
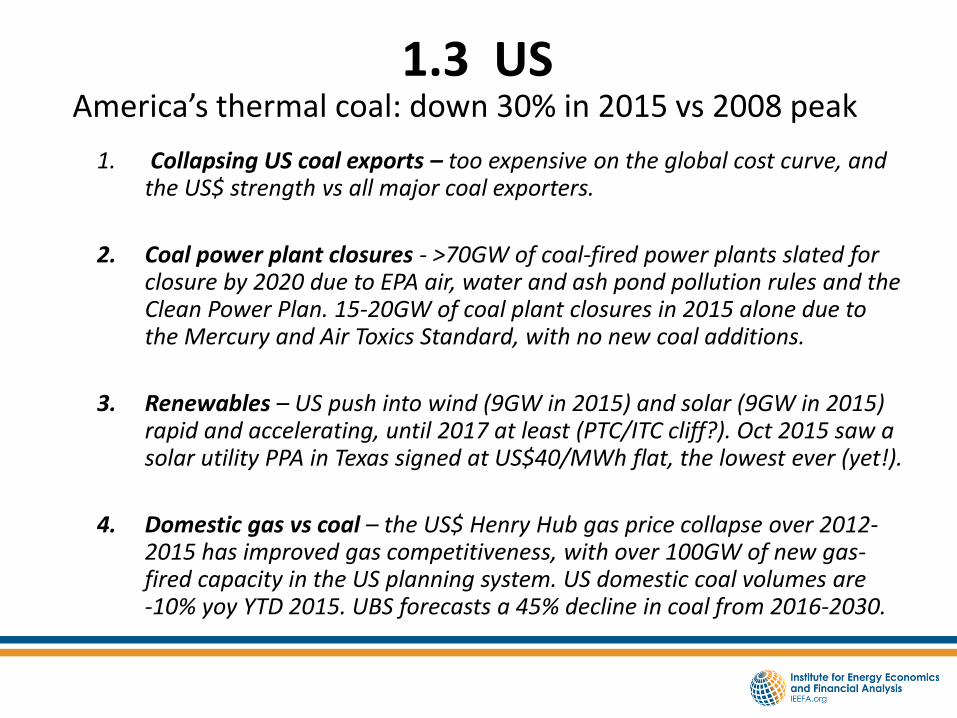
1.3 US
8
America’s thermal coal: down 30% in 2015 vs 2008 peak
1. Collapsing US coal exports – too expensive on the global cost curve, and the US$ strength vs all major coal exporters.
2. Coal power plant closures - >70GW of coal-fired power plants slated for closure by 2020 due to EPA air, water and ash pond pollution rules and the Clean Power Plan. 15-20GW of coal plant closures in 2015 alone due to the Mercury and Air Toxics Standard, with no new coal additions.
3. Renewables – US push into wind (9GW in 2015) and solar (9GW in 2015) rapid and accelerating, until 2017 at least (PTC/ITC cliff?). Oct 2015 saw a solar utility PPA in Texas signed at US$40/MWh flat, the lowest ever (yet!).
4. Domestic gas vs coal – the US$ Henry Hub gas price collapse over 2012-2015 has improved gas competitiveness, with over 100GW of new gas-fired capacity in the US planning system. US domestic coal volumes are -10% yoy YTD 2015. UBS forecasts a 45% decline in coal from 2016-2030.

1.4 Thermal Coal Export Price Collapse
Newcastle Export 6,000kcal Thermal US$/t
Forwards out to October 2021 have thermal coal
under US$48/t
9
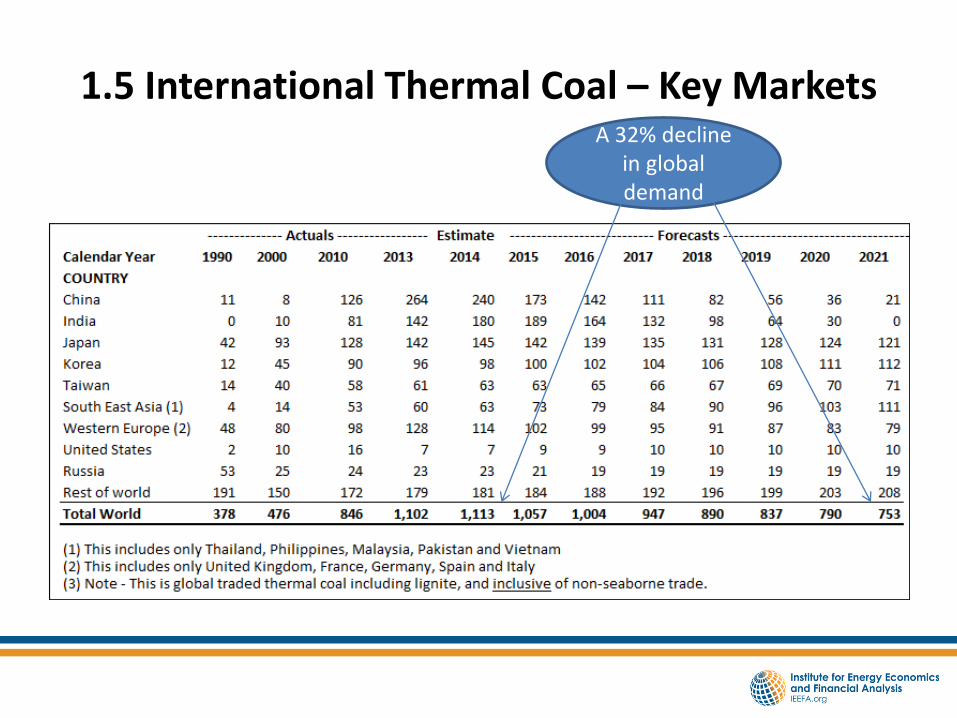
1.5 International Thermal Coal – Key Markets
10
A 32% decline in global demand
2. Structural decline?
The Equity markets are factoring in structural decline as an increasingly likely probability.
Coal Equities are proving to be a wealth hazard!
11
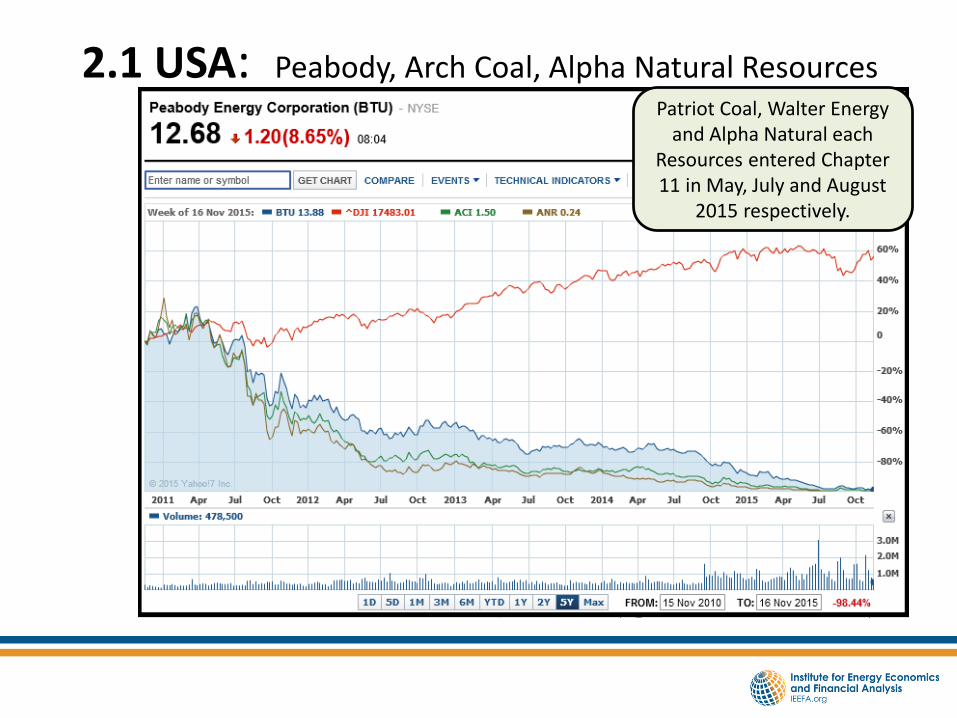
2.1 USA: Peabody, Arch Coal, Alpha Natural Resources
12
Patriot Coal, Walter Energy and Alpha Natural each
Resources entered Chapter 11 in May, July and August
2015 respectively.
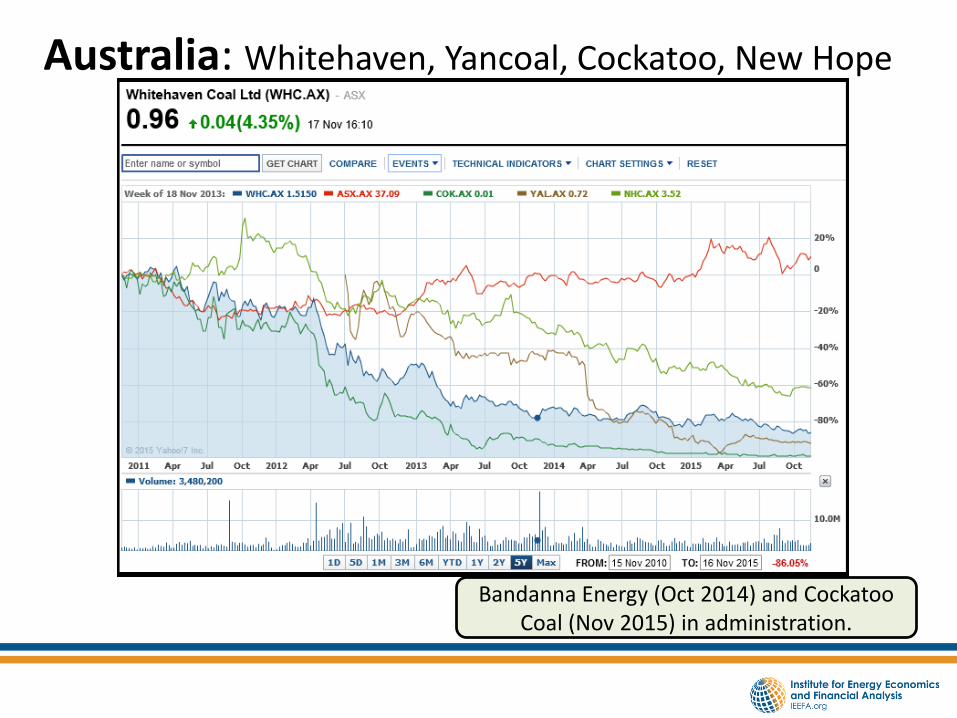
Australia: Whitehaven, Yancoal, Cockatoo, New Hope
13
Bandanna Energy (Oct 2014) and Cockatoo Coal (Nov 2015) in administration.
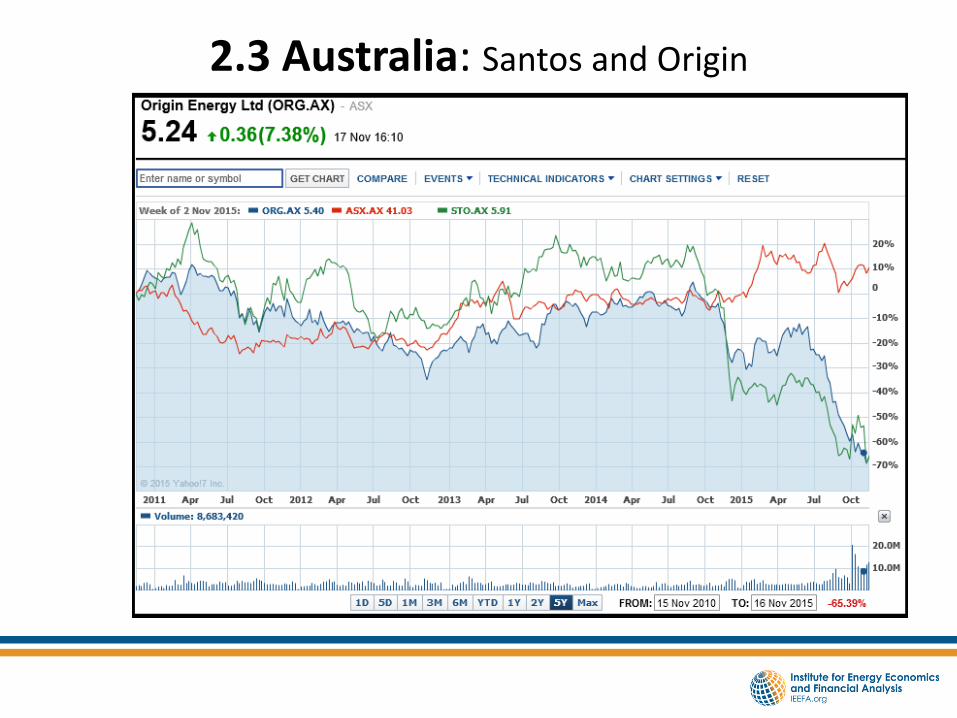
2.3 Australia: Santos and Origin
14
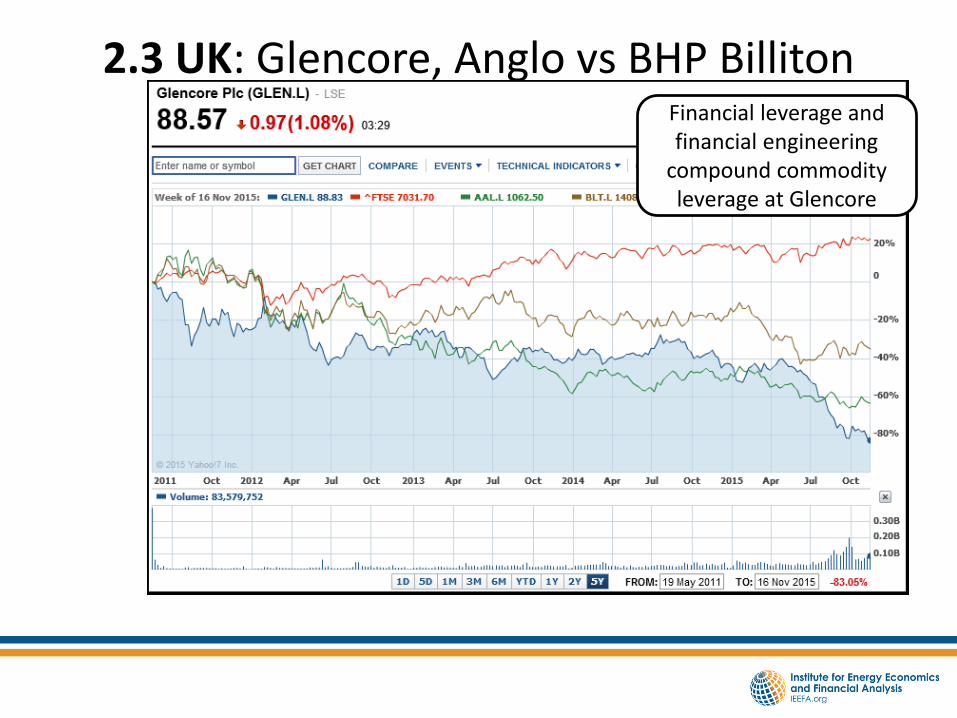
2.3 UK: Glencore, Anglo vs BHP Billiton
15
Financial leverage and financial engineering
compound commodity leverage at Glencore
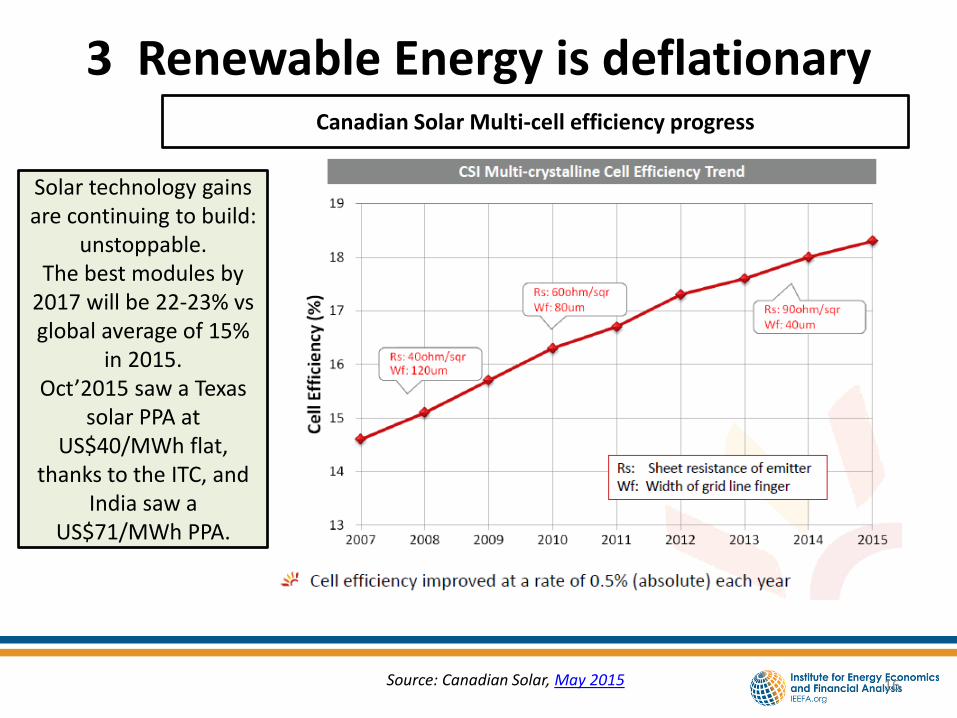
3 Renewable Energy is deflationary
Source: Canadian Solar, May 2015
Solar technology gains are continuing to build:
unstoppable.The best modules by
2017 will be 22-23% vs global average of 15%
in 2015.Oct’2015 saw a Texas
solar PPA at US$40/MWh flat,
thanks to the ITC, and India saw a
US$71/MWh PPA.
Canadian Solar Multi-cell efficiency progress
16

3.2 Storage is coming, rapidly
Source: Navigant Research, IEEFA NYU Conference, March 2015 17
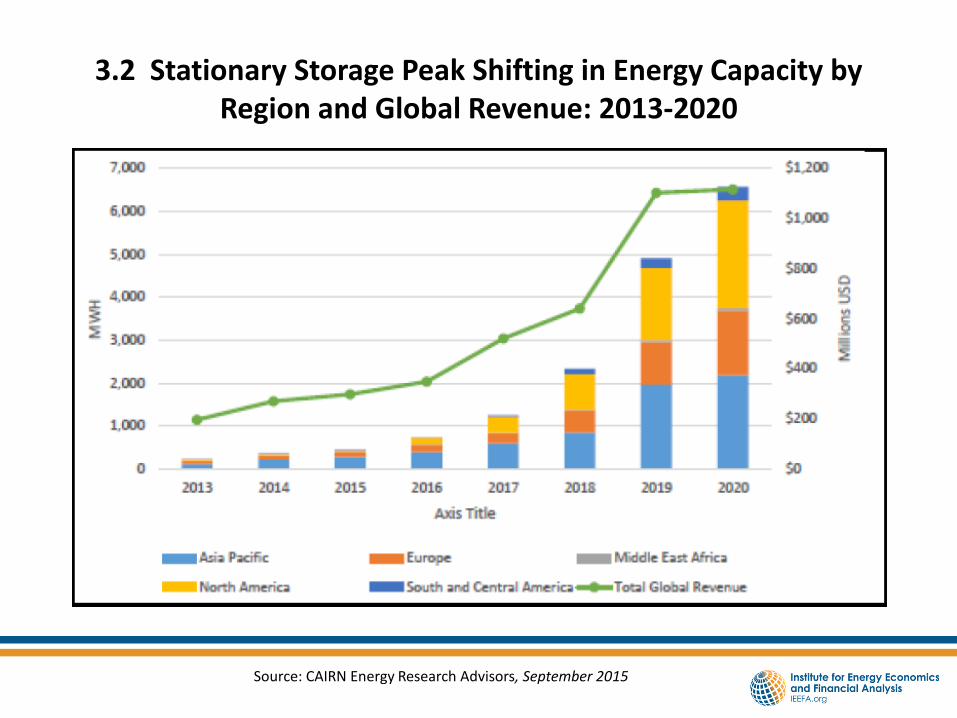
3.2 Stationary Storage Peak Shifting in Energy Capacity by Region and Global Revenue: 2013-2020
18Source: CAIRN Energy Research Advisors, September 2015
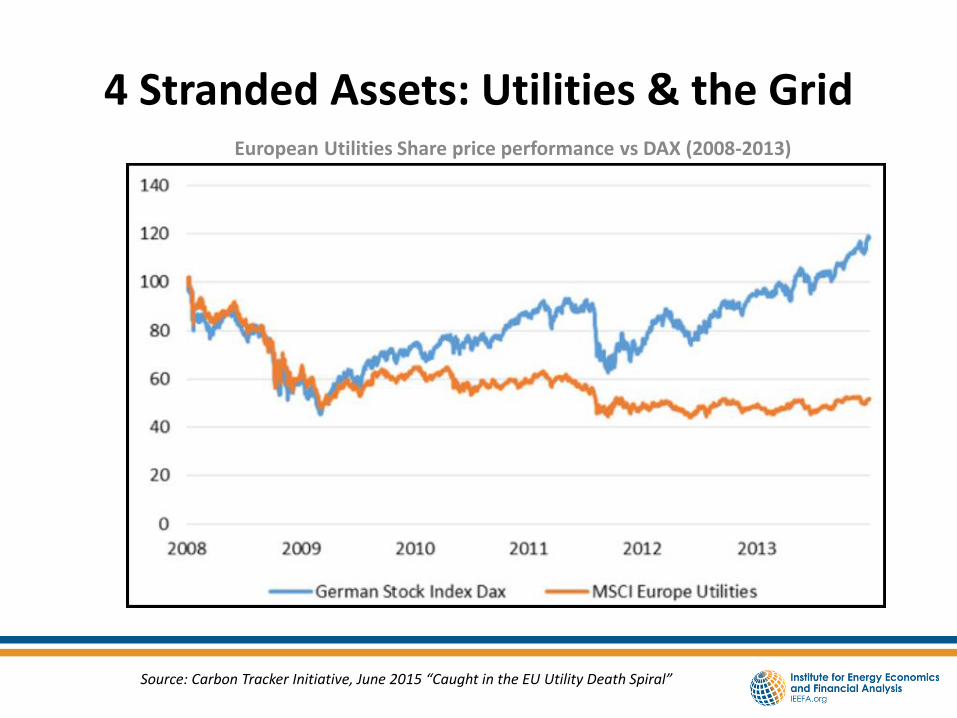
4 Stranded Assets: Utilities & the Grid
19Source: Carbon Tracker Initiative, June 2015 “Caught in the EU Utility Death Spiral”
European Utilities Share price performance vs DAX (2008-2013)
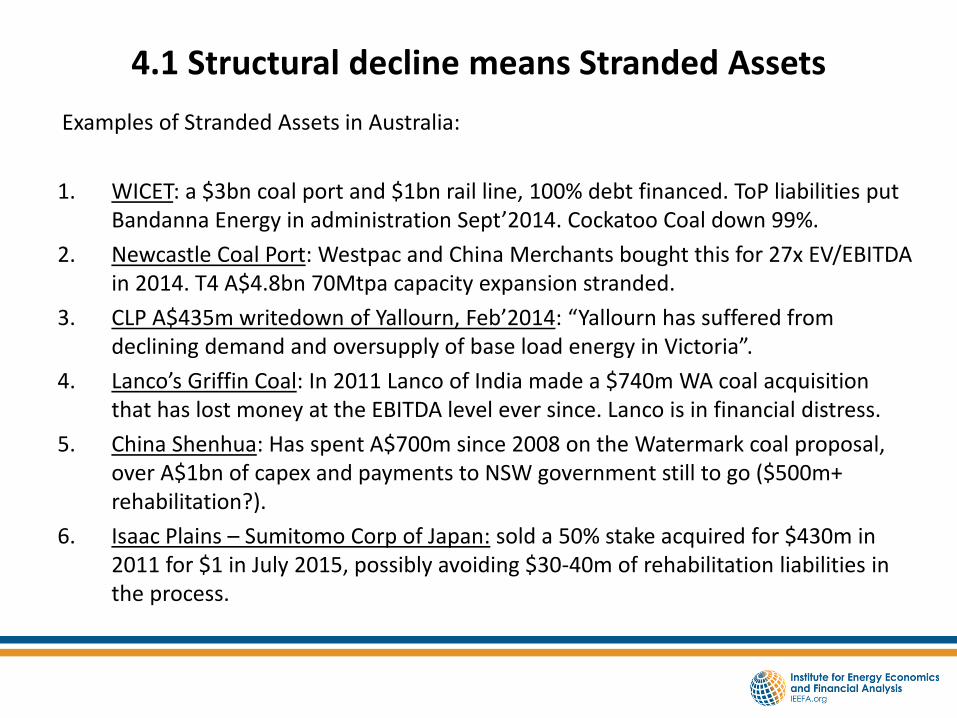
4.1 Structural decline means Stranded Assets
Examples of Stranded Assets in Australia:
1. WICET: a $3bn coal port and $1bn rail line, 100% debt financed. ToP liabilities put Bandanna Energy in administration Sept’2014. Cockatoo Coal down 99%.
2. Newcastle Coal Port: Westpac and China Merchants bought this for 27x EV/EBITDA in 2014. T4 A$4.8bn 70Mtpa capacity expansion stranded.
3. CLP A$435m writedown of Yallourn, Feb’2014: “Yallourn has suffered from declining demand and oversupply of base load energy in Victoria”.
4. Lanco’s Griffin Coal: In 2011 Lanco of India made a $740m WA coal acquisition that has lost money at the EBITDA level ever since. Lanco is in financial distress.
5. China Shenhua: Has spent A$700m since 2008 on the Watermark coal proposal, over A$1bn of capex and payments to NSW government still to go ($500m+ rehabilitation?).
6. Isaac Plains – Sumitomo Corp of Japan: sold a 50% stake acquired for $430m in 2011 for $1 in July 2015, possibly avoiding $30-40m of rehabilitation liabilities in the process.
20
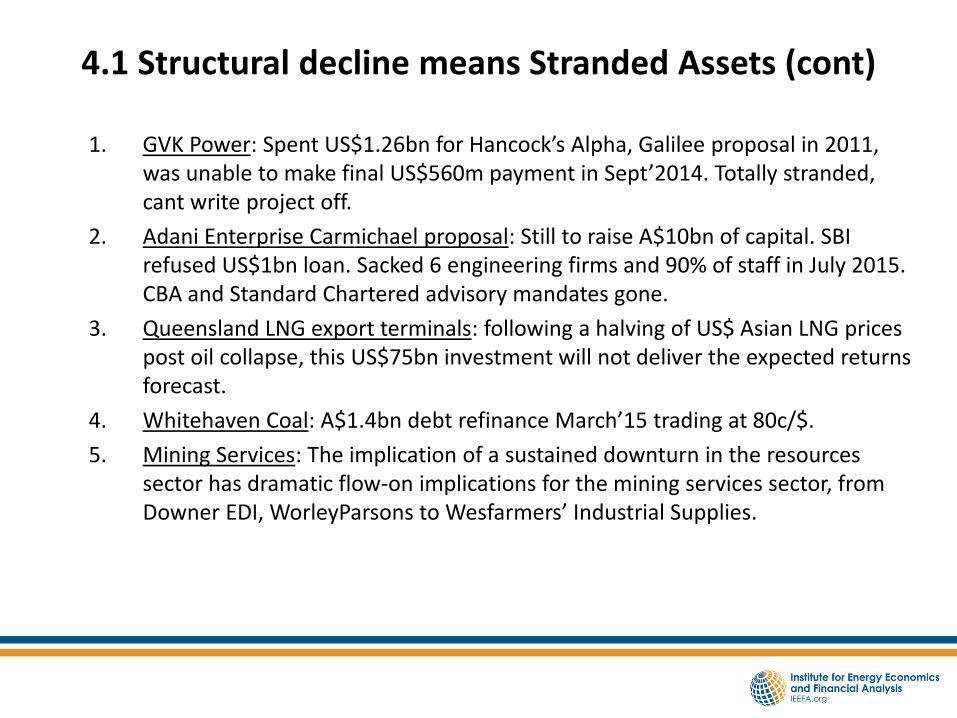
4.1 Structural decline means Stranded Assets (cont)
1. GVK Power: Spent US$1.26bn for Hancock’s Alpha, Galilee proposal in 2011, was unable to make final US$560m payment in Sept’2014. Totally stranded, cant write project off.
2. Adani Enterprise Carmichael proposal: Still to raise A$10bn of capital. SBI refused US$1bn loan. Sacked 6 engineering firms and 90% of staff in July 2015. CBA and Standard Chartered advisory mandates gone.
3. Queensland LNG export terminals: following a halving of US$ Asian LNG prices post oil collapse, this US$75bn investment will not deliver the expected returns forecast.
4. Whitehaven Coal: A$1.4bn debt refinance March’15 trading at 80c/$.
5. Mining Services: The implication of a sustained downturn in the resources sector has dramatic flow-on implications for the mining services sector, from Downer EDI, WorleyParsons to Wesfarmers’ Industrial Supplies.
21
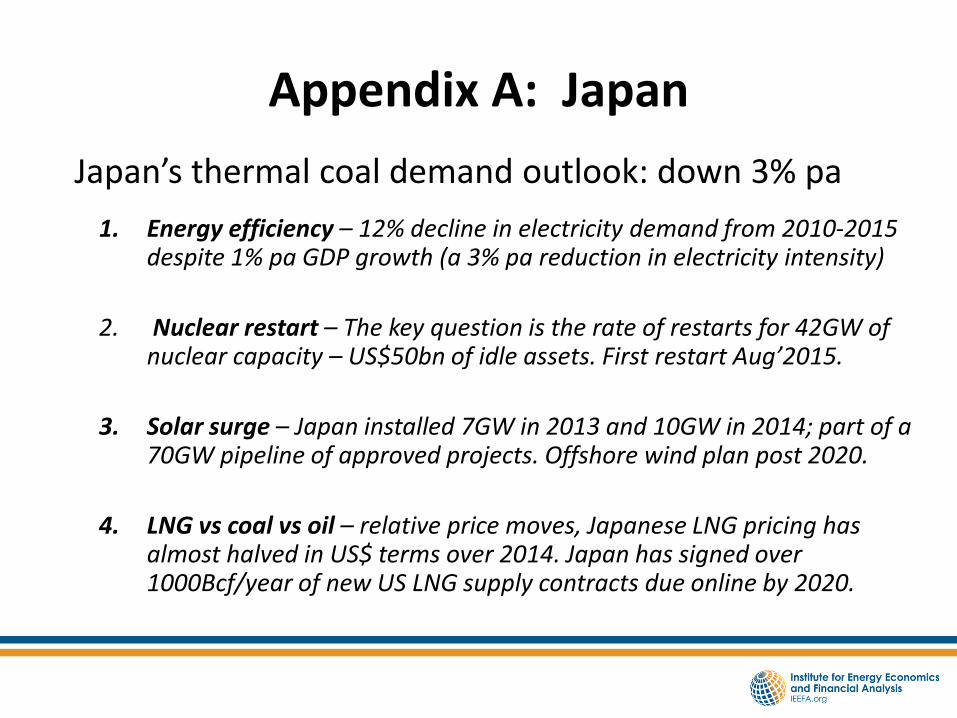
Appendix A: Japan
22
Japan’s thermal coal demand outlook: down 3% pa
1. Energy efficiency – 12% decline in electricity demand from 2010-2015 despite 1% pa GDP growth (a 3% pa reduction in electricity intensity)
2. Nuclear restart – The key question is the rate of restarts for 42GW of nuclear capacity – US$50bn of idle assets. First restart Aug’2015.
3. Solar surge – Japan installed 7GW in 2013 and 10GW in 2014; part of a 70GW pipeline of approved projects. Offshore wind plan post 2020.
4. LNG vs coal vs oil – relative price moves, Japanese LNG pricing has almost halved in US$ terms over 2014. Japan has signed over 1000Bcf/year of new US LNG supply contracts due online by 2020.
Appendix B: Korea
23
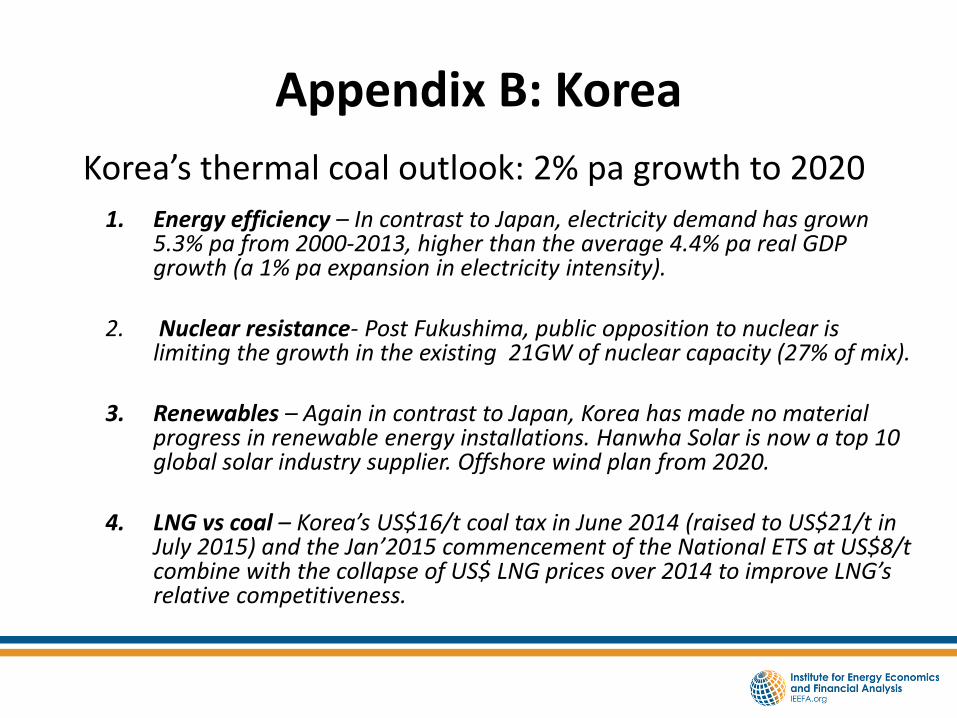
Korea’s thermal coal outlook: 2% pa growth to 2020
1. Energy efficiency – In contrast to Japan, electricity demand has grown 5.3% pa from 2000-2013, higher than the average 4.4% pa real GDP growth (a 1% pa expansion in electricity intensity).
2. Nuclear resistance- Post Fukushima, public opposition to nuclear is limiting the growth in the existing 21GW of nuclear capacity (27% of mix).
3. Renewables – Again in contrast to Japan, Korea has made no material progress in renewable energy installations. Hanwha Solar is now a top 10 global solar industry supplier. Offshore wind plan from 2020.
4. LNG vs coal – Korea’s US$16/t coal tax in June 2014 (raised to US$21/t in July 2015) and the Jan’2015 commencement of the National ETS at US$8/t combine with the collapse of US$ LNG prices over 2014 to improve LNG’s relative competitiveness.
Appendix C: EU
24
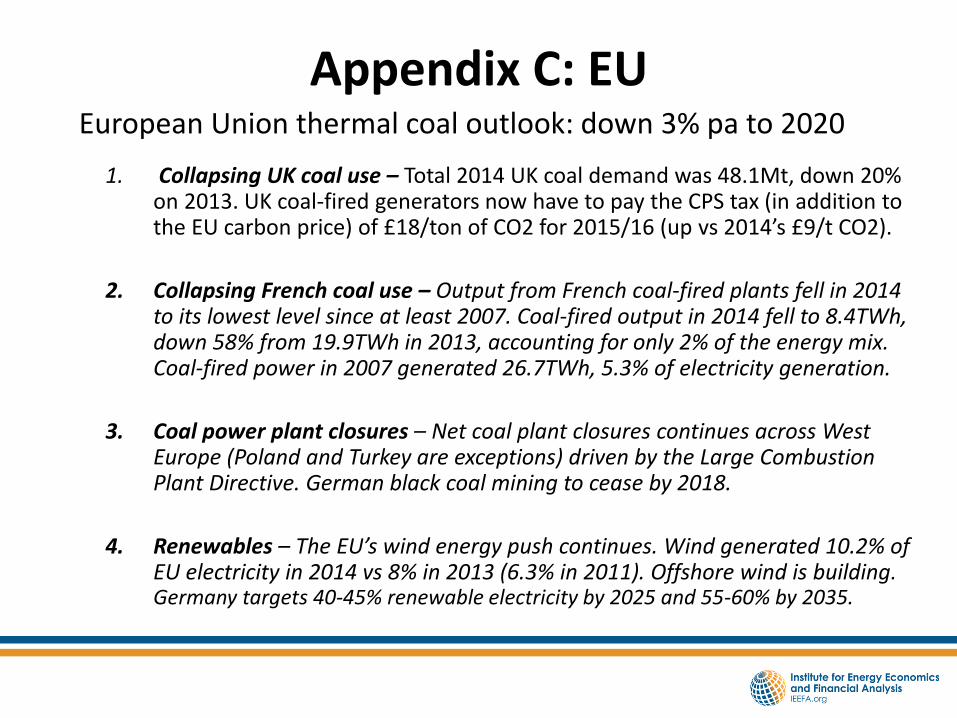
European Union thermal coal outlook: down 3% pa to 2020
1. Collapsing UK coal use – Total 2014 UK coal demand was 48.1Mt, down 20% on 2013. UK coal-fired generators now have to pay the CPS tax (in addition to the EU carbon price) of £18/ton of CO2 for 2015/16 (up vs 2014’s £9/t CO2).
2. Collapsing French coal use – Output from French coal-fired plants fell in 2014 to its lowest level since at least 2007. Coal-fired output in 2014 fell to 8.4TWh, down 58% from 19.9TWh in 2013, accounting for only 2% of the energy mix. Coal-fired power in 2007 generated 26.7TWh, 5.3% of electricity generation.
3. Coal power plant closures – Net coal plant closures continues across West Europe (Poland and Turkey are exceptions) driven by the Large Combustion Plant Directive. German black coal mining to cease by 2018.
4. Renewables – The EU’s wind energy push continues. Wind generated 10.2% of EU electricity in 2014 vs 8% in 2013 (6.3% in 2011). Offshore wind is building. Germany targets 40-45% renewable electricity by 2025 and 55-60% by 2035.
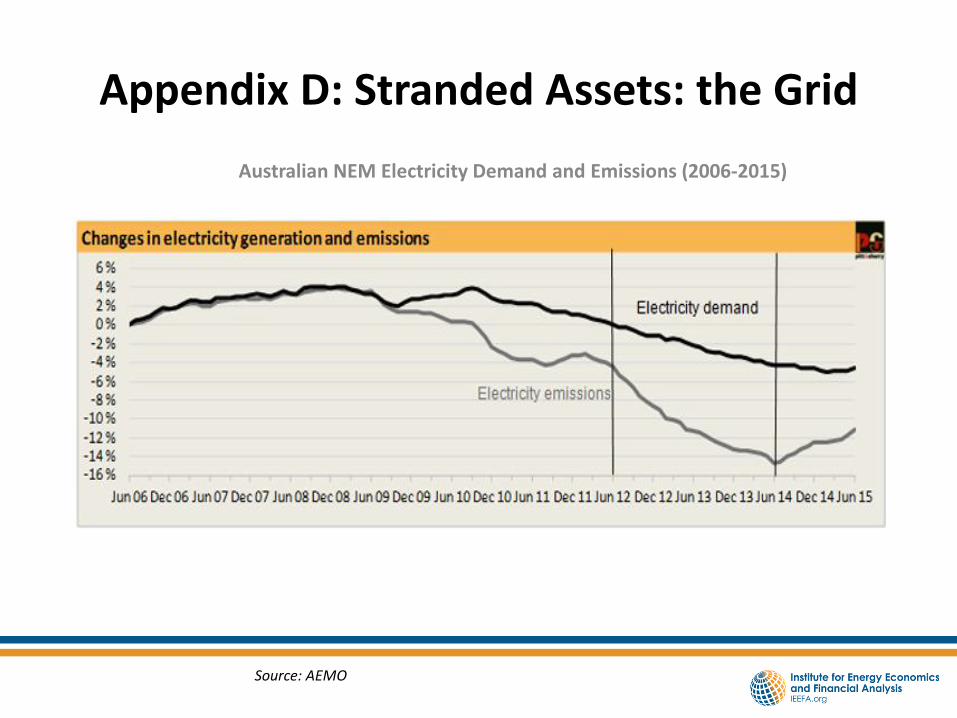
Appendix D: Stranded Assets: the Grid
25Source: AEMO
Australian NEM Electricity Demand and Emissions (2006-2015)
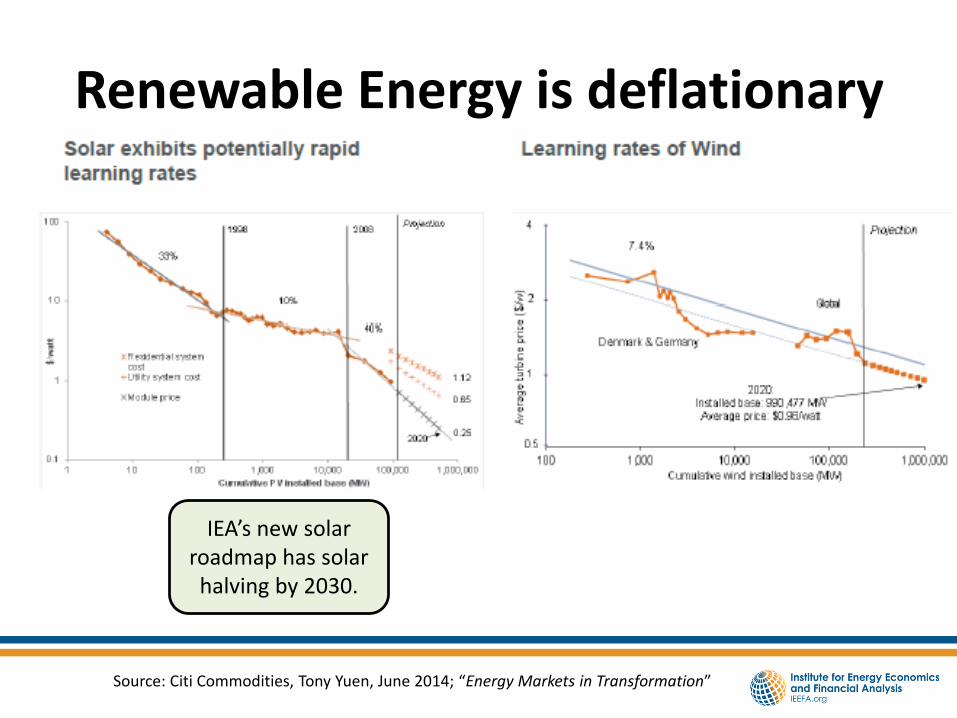
Renewable Energy is deflationary
26Source: Citi Commodities, Tony Yuen, June 2014; “Energy Markets in Transformation”
IEA’s new solar roadmap has solar halving by 2030.
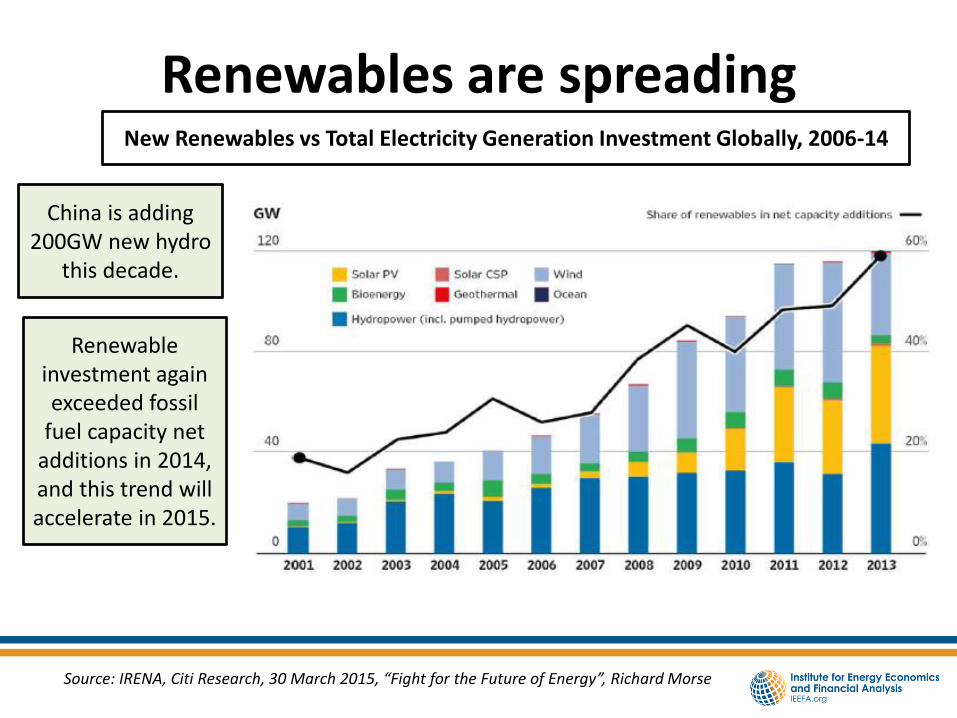
Renewables are spreading
27Source: IRENA, Citi Research, 30 March 2015, “Fight for the Future of Energy”, Richard Morse
New Renewables vs Total Electricity Generation Investment Globally, 2006-14
Renewable investment again exceeded fossil
fuel capacity net additions in 2014, and this trend will accelerate in 2015.
China is adding 200GW new hydro
this decade.
28
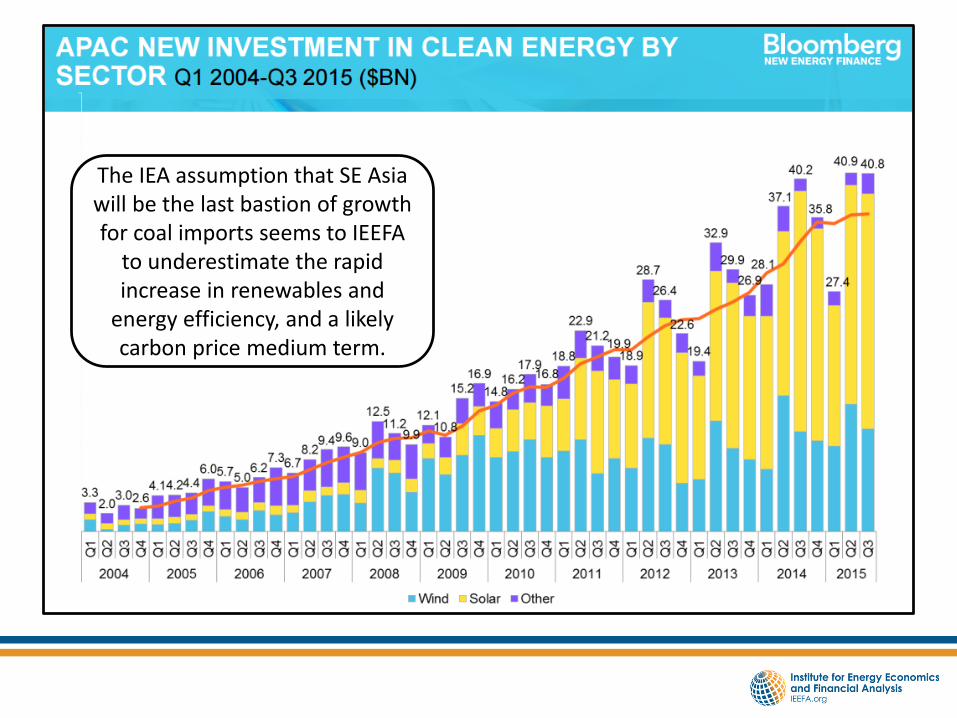
The IEA assumption that SE Asia will be the last bastion of growth for coal imports seems to IEEFA
to underestimate the rapid increase in renewables and
energy efficiency, and a likely carbon price medium term.
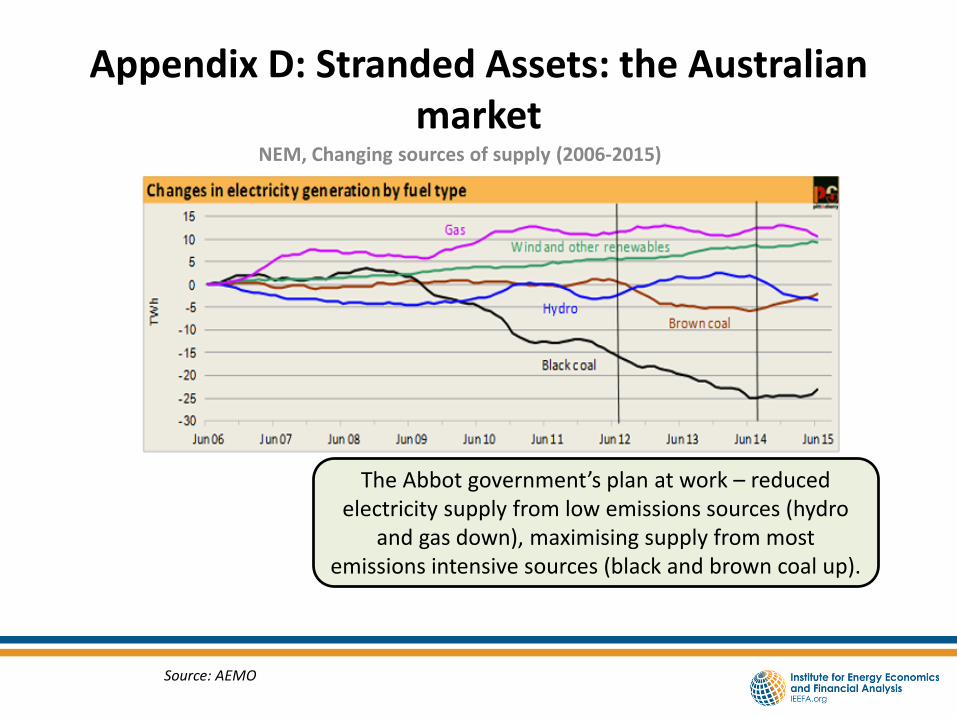
Appendix D: Stranded Assets: the Australian market
29Source: AEMO
NEM, Changing sources of supply (2006-2015)
The Abbot government’s plan at work – reduced electricity supply from low emissions sources (hydro
and gas down), maximising supply from most emissions intensive sources (black and brown coal up).
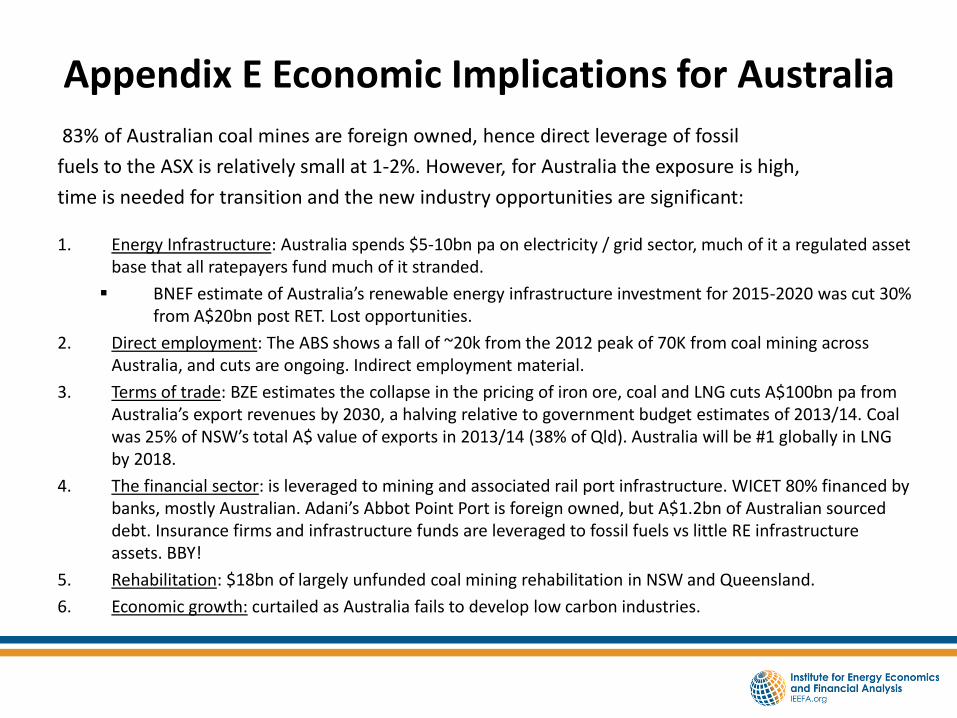
Appendix E Economic Implications for Australia
83% of Australian coal mines are foreign owned, hence direct leverage of fossil
fuels to the ASX is relatively small at 1-2%. However, for Australia the exposure is high,
time is needed for transition and the new industry opportunities are significant:
1. Energy Infrastructure: Australia spends $5-10bn pa on electricity / grid sector, much of it a regulated asset base that all ratepayers fund much of it stranded.
BNEF estimate of Australia’s renewable energy infrastructure investment for 2015-2020 was cut 30% from A$20bn post RET. Lost opportunities.
2. Direct employment: The ABS shows a fall of ~20k from the 2012 peak of 70K from coal mining across Australia, and cuts are ongoing. Indirect employment material.
3. Terms of trade: BZE estimates the collapse in the pricing of iron ore, coal and LNG cuts A$100bn pa from Australia’s export revenues by 2030, a halving relative to government budget estimates of 2013/14. Coal was 25% of NSW’s total A$ value of exports in 2013/14 (38% of Qld). Australia will be #1 globally in LNG by 2018.
4. The financial sector: is leveraged to mining and associated rail port infrastructure. WICET 80% financed by banks, mostly Australian. Adani’s Abbot Point Port is foreign owned, but A$1.2bn of Australian sourced debt. Insurance firms and infrastructure funds are leveraged to fossil fuels vs little RE infrastructure assets. BBY!
5. Rehabilitation: $18bn of largely unfunded coal mining rehabilitation in NSW and Queensland.
6. Economic growth: curtailed as Australia fails to develop low carbon industries.
30