changes in vegetation condition and surface fluxes during the north american monsoon experiment...
Post on 19-Dec-2015
215 views
TRANSCRIPT

Changes in vegetation condition and surface fluxes during the North American Monsoon Experiment (NAME) 2004
Russell Scott, USDA-ARSChris Watts, U. of Sonora

Motivation
The NAM results in large changes to surface cover (i.e., It gets green!)
But, few observations have ever quantified this effect in terms of changing surface energy balance, especially south of the border (where things are really happening!)
September
Tucson

Surface energy balance
Rn = SW(1-albedo) + LWn= λE + H
EH
G

Goals and Methodology
0 5 10 15 20
-4
-2
0
2
4
6
8
Vertical Wind Speed
Water vapor density
Eddy covariance used to determine patch- or ecosystem-scale heat, water and carbon dioxide flux
hour
Use micrometeorological techniques to quantify changes in surface energy balance over a variety of representative biomes within the core NAM region in NAME 2004 experiment
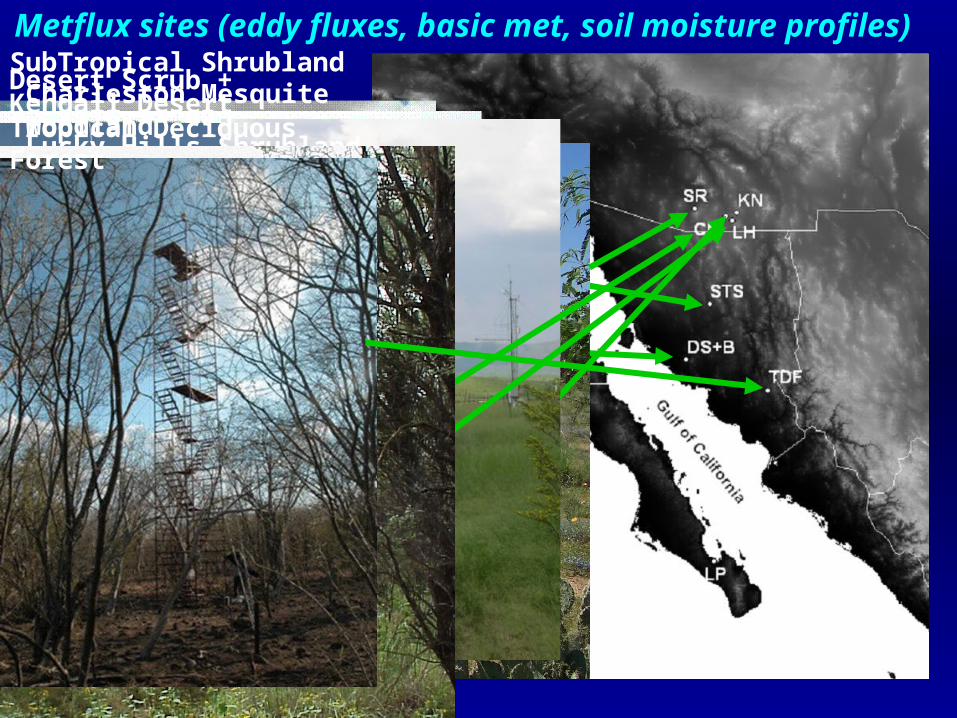
Desert Scrub + BuffelgrassSubTropical Shrubland
Santa Rita Mesquite SavannaKendall Desert Grassland
Lucky Hills Shrubland
Charleston Mesquite WoodlandTropical Deciduous Forest
Metflux sites (eddy fluxes, basic met, soil moisture profiles)

Observations - Results
Big Picture • Vegetation response
Site Details: • Precipitation
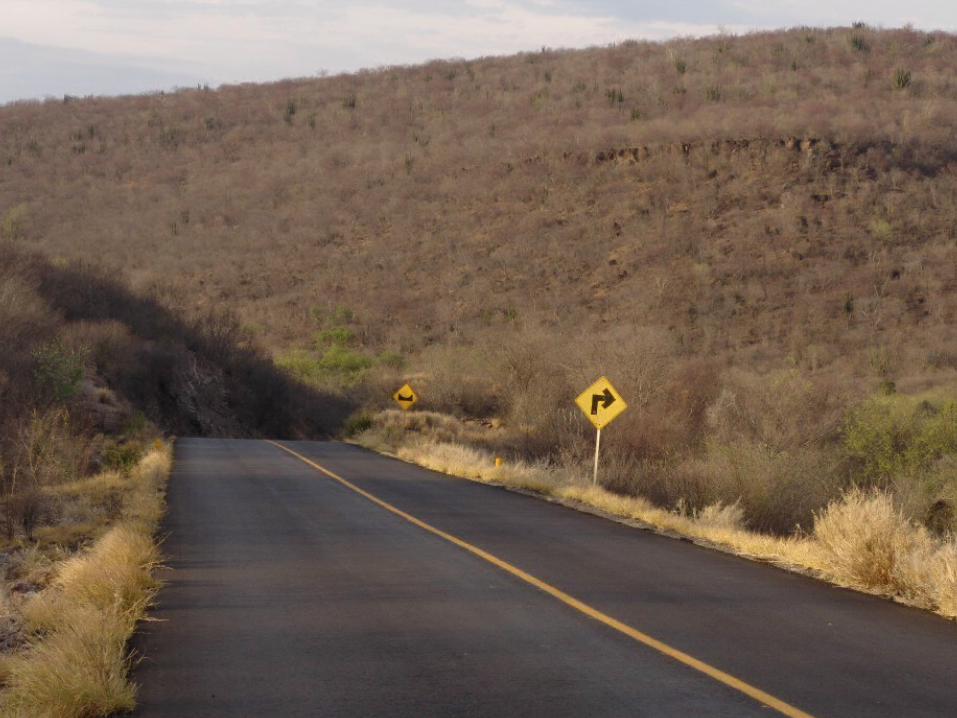
• Vegetation
• Albedo
• Surface temperature
• Rn/Rs
• Evaporation
• Evaporative fraction

JuneJulyAugustSeptemberSPOT NDVI
10-day compositesTucson
Core of the veg changes


Southern sites greater and more intense precipitationBut all sites still had dry periods
Tropical Cyclones
Mean- 350 mm, 60% in July-Sept10016090160 mm
430210170 mm

Enhanced Vegetation Index
Much larger increases in VI observed for Sonora sites

Albedo Albedo Tesopaco TDF 9 12
Rayon STS 15 17
CM riparian woodland 10 8
SR savannah 15 14
KN grassland 18 17
LH desert shrub 18 17
Pre PostMonsoon
• 2-fold difference in broadband albedo
• But monsoon changes are very smallIncreased absorption in visible bandsCountered by decreases in near-infrared

Daytime LST from MODIS-Aqua
Sonoran sites LST drops by 25 ºC with Monsoon onset, much more than for the Arizona sites
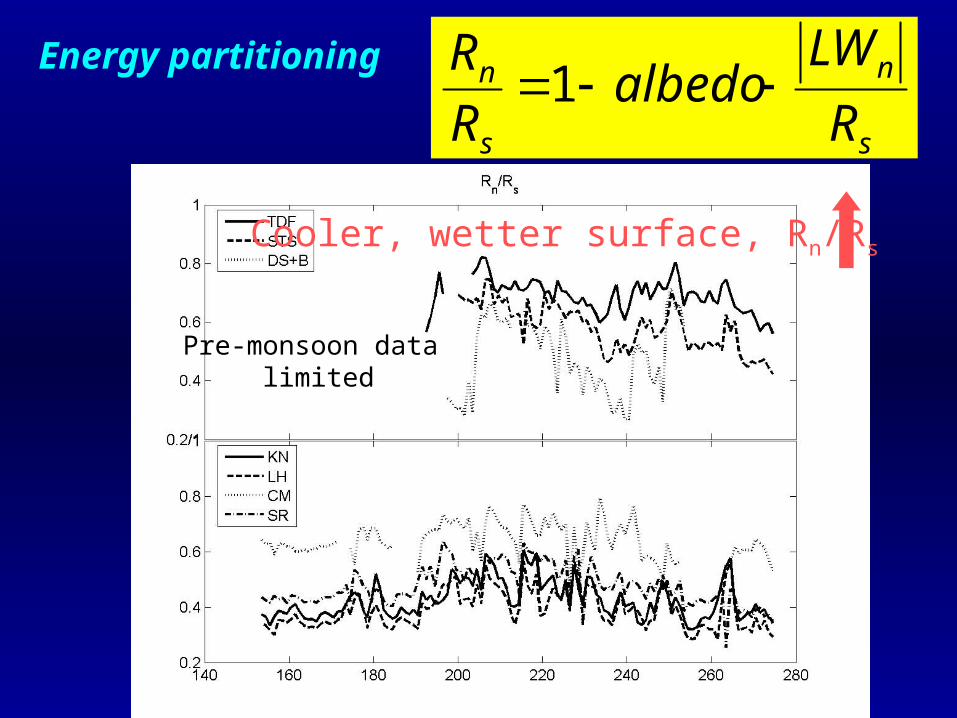
Pre-monsoon data limited
s
n
s
n
R
LWalbedo
R
R1
Energy partitioning
Cooler, wetter surface, Rn/Rs
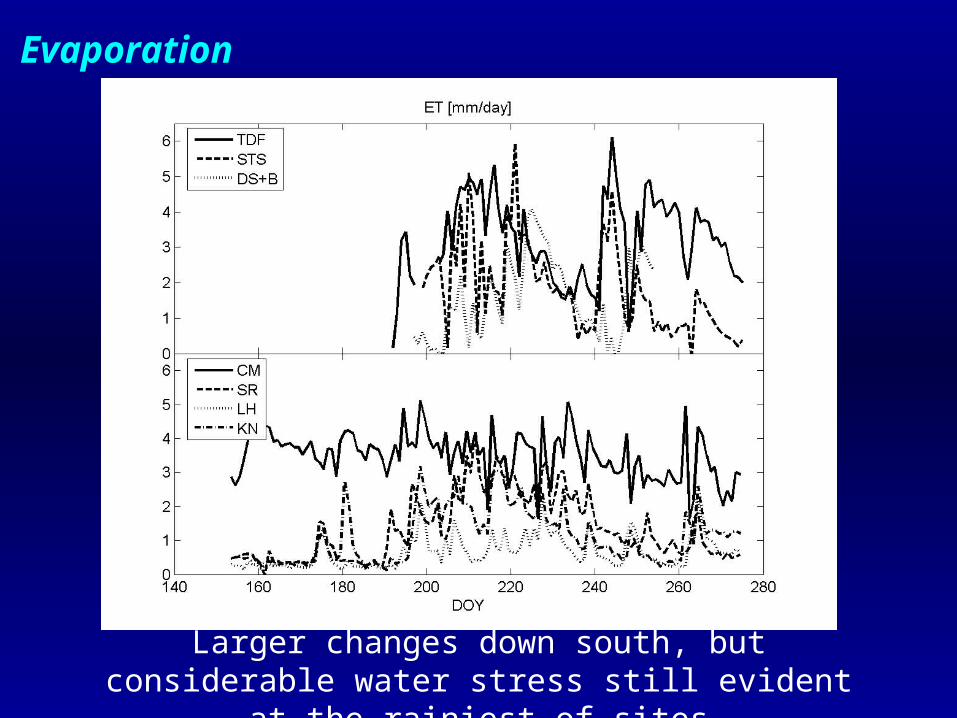
Larger changes down south, but considerable water
stress still evident at the rainiest of sites
Evaporation

Evaporative Fraction
λE + H
λE
Water limitation still evident even at rainiest site

SummarySummary
We developed a network of sites across a gradient of NAM forcing:
1) to better understand the land surface response in terms of energy, water and CO2 exchange
2) to help improve the understanding of the land-atmosphere feedback in the NAM region
