changes in the ice stream flow regime near siple dome
TRANSCRIPT
Changes in the Configuration of Ice Stream Flow from the West Antarctic Ice Sheet
Robert W. Jacobel St. Olaf College
Northfield, MN 55057
Theodore A. Scambos NSIDC, University of Colorado
Boulder, CO 80302
Charles R. Raymond Anthony M. Gades
University of Washington Seattle, WA 98195
Surface-based ice-penetrating radar profiles on the northeast flank of Siple Dome support the hypothesis that a curvilinear scar first observed in AVHRR satellite imagery represents the margin of a formerly active ice stream. The scar defines the southwestern boundary of an ice stream flowing from ice stream C to ice stream D, close to where it enters the Ross Ice Shelf. Our studies show that the scar coincides with a trough and upward step in surface topography approximately 5 kilometers across, underlain by a zone of disturbed internal stratigraphy revealed by the radar. Burial depth of the disturbed zone enables us to calculate the time of shut-down as occurring prior to approximately 1.3 KYBP. The configuration of the ice streams draining the West Antarctic Ice Sheet into the Ross Ice Shelf evidently changes with time, and attempts to predict the evolution of the ice sheet must incorporate this observation.
Introduction Discharge of ice from the West Antarctic Ice Sheet (WAIS) is largely controlled by ice streams. These fast-moving currents of ice are 30 to 70 km wide and flow several hundred kilometers from the interior to the bounding ice shelves that in most cases form the interface to the ocean. Ice stream speeds (up to 2.2 km/a) are more than an order of magnitude larger than those of the surrounding ice, and thus as the main discharge channels to the ocean, ice streams play a pivotal role in the mass balance of the ice sheet. Therefore, an understanding of their ongoing changes and their potential response to recent climate change is central to assessing the stability of the WAIS and its potential effect on sea level in the future (e.g., Hughes, 1977; Shabtaie and Bentley, 1987; Alley and Whillans, 1991; Bindschadler, 1992, and references contained therein).
(Jacobel, Scambos, Raymond and Gades)
2
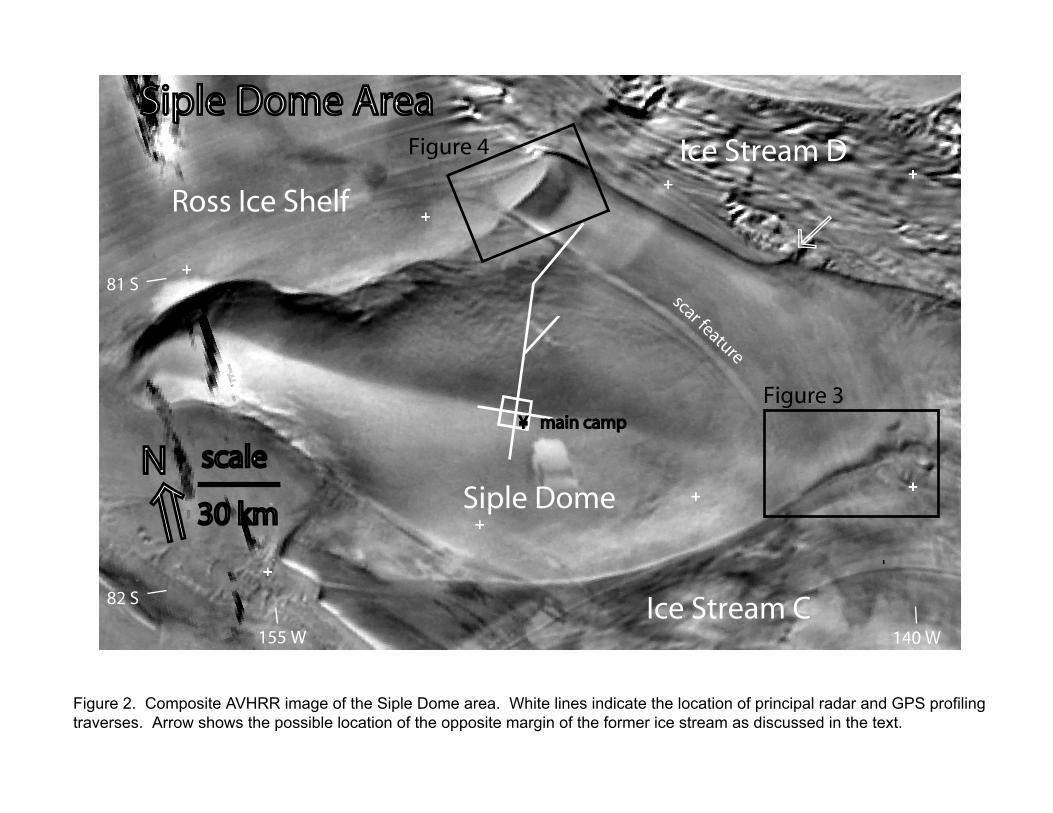
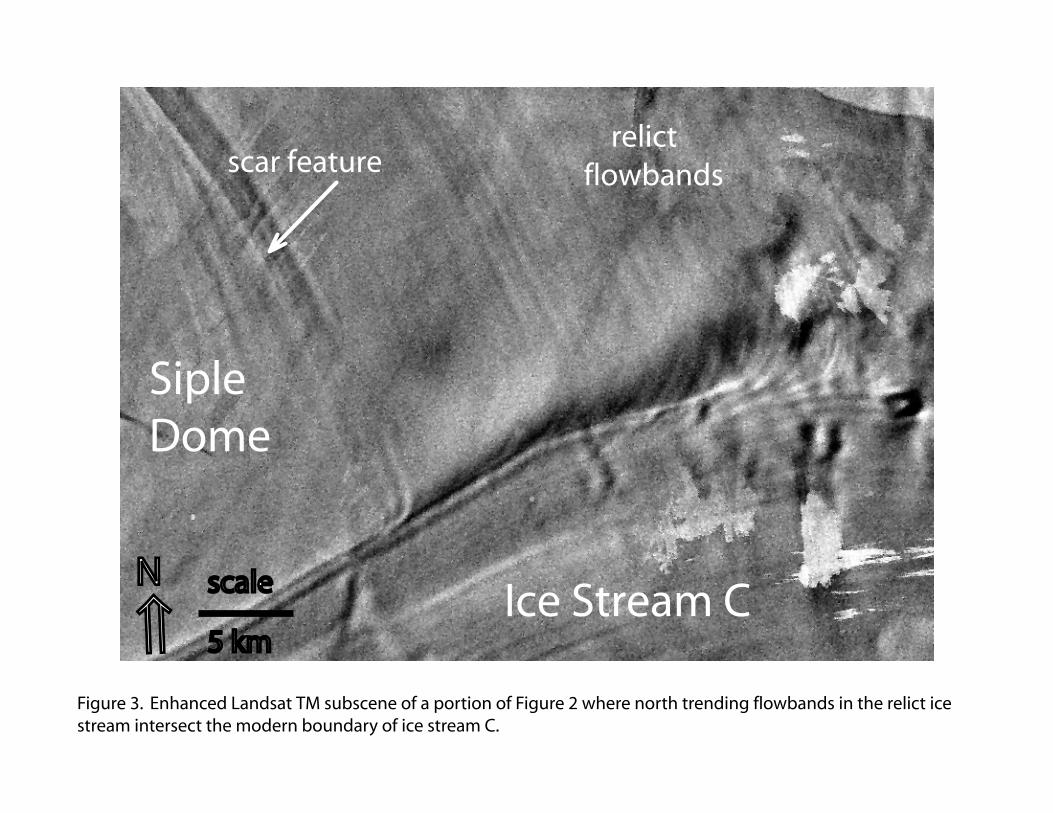
To date, the ice stream system which drains the WAIS into the Ross Ice Shelf has been viewed as a nearly parallel series of five major ice streams (labeled ‘A’ through ‘E’) with intervening ridges of slow-moving ice (Figure 1). Unlike typical glaciers, however, their margins do not seem to be controlled by the underlying bed topography. Four of these are presently active; ice stream C appears to have stopped rapid flow about 130 years ago (Retzlaff and Bentley, 1993). The reasons for this shut-down are not yet well understood, but probably relate to changes in basal lubrication (Alley et al., 1995). It has long been hypothesized that ice streams may be transient features (Shabtaie and Bentley, 1988), and it is now well documented that they can change their mass flux on time scales as short as a few decades (Alley and Whillans, 1991). Nevertheless, the working paradigm for ice streams generally considers their configuration as fixed, and models of ice sheet evolution have been extrapolated forward and backward in time on this basis (e.g., MacAyeal, 1992). Surface Morphology Satellite imagery of the region suggests a more complex behavior. Advanced Very High Resolution Radiometry (AVHRR) and Landsat Thematic Mapper (Landsat TM) imagery of the eastern Ross Embayment clearly shows the boundaries and surface morphology of the ice streams and interstream ridges, but it also depicts a variety of other features apparently related to past ice dynamics (Bindschadler and Vornberger, 1990; Stephenson and Bindschadler, 1990; Scambos and Bindschadler, 1991). These authors all noted features that they suggested might be related to either additional relict ice streams, or former extensions of existing ice streams. In particular, the region to the north and east of Siple Dome, a broad topographic high at the western end of the ridge separating ice streams C and D, is traversed by a curvilinear “scar”-like feature which Bindschadler and Vornberger (1990) suggested might be a relict ice stream margin. Figure 2 is an enhanced-resolution composite of 6 AVHRR scenes of the Siple Dome area. This image has been enhanced by combining 6 scenes acquired by the NOAA-10, -11, and -12 satellites on December 3 and December 8, 1992 using a data cumulation technique (Albertz and Zelianeos, 1988). The scenes were roughly georegistered, and then coregistered to within ~0.25 pixel size. They were then summed on a subpixel-sized grid and filtered, yielding an image with improved radiometric and spatial resolution. The path of the scar running northwestward from the north margin of ice stream C across the northeast flank of Siple Dome to the Ross Ice Shelf is clearly visible. The distinctive surface morphology of actively streaming ice is visible on ice stream D, which shows abundant crevassing at the surface, long curvilinear ridges and troughs (called flowbands) and an undulated surface at the scale of a few ice thicknesses - in this case, 0.5 to 3 km. Similar features are visible on ice stream C, but are subdued due to burial and relaxation flow since the cessation of ice streaming. In the region northeast of Siple Dome, the AVHRR scene shows even less surface undulation than for ice stream C, and flowbands are not apparent. However, enhanced Landsat TM imagery does reveal faint flowlines within the smooth ice region north and east of the scar feature that run parallel to it (Figure 3). The high angle of intersection of these flow lines with the modern margin of ice steam C (Figure 3) indicates that the source area for these flow lines had to include some of what is
(Jacobel, Scambos, Raymond and Gades)
3
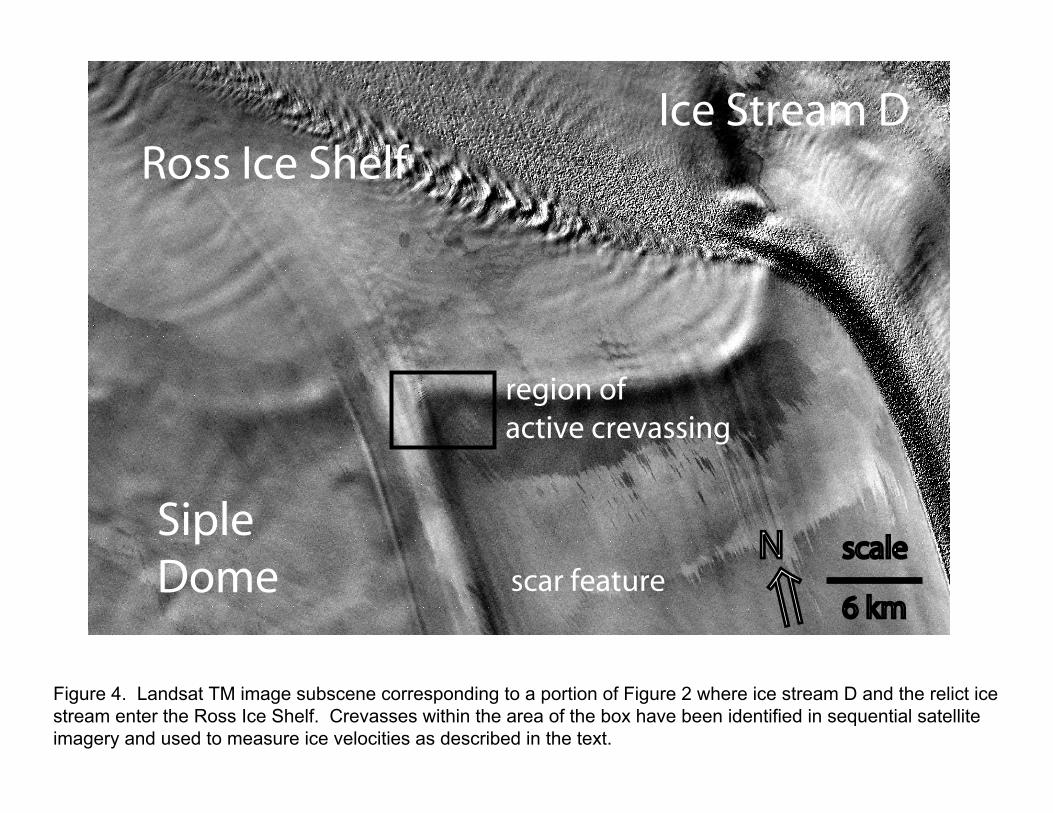
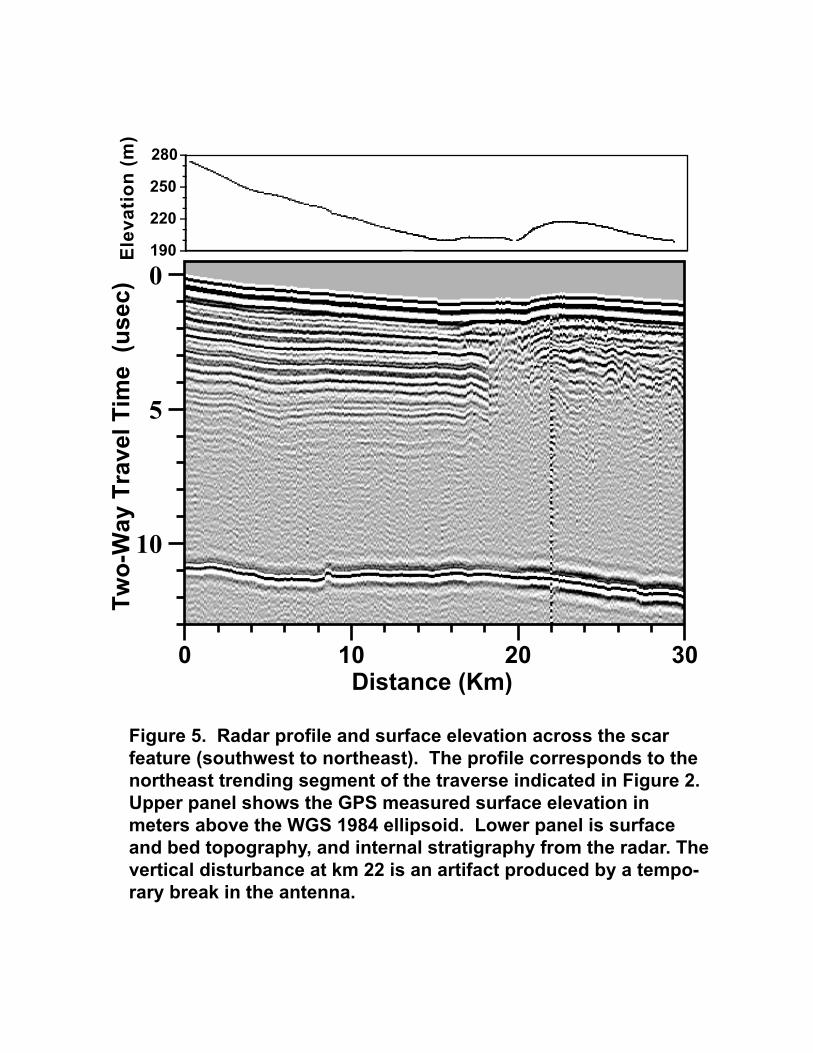
presently defined as the upper reaches of ice stream C. Correspondingly, the northerly flow direction in the source area would have been quite different than the more recent westerly flow of ice stream C. Evidently, ice stream C has captured this area after motion to the north had ceased, thereby truncating the earlier flow lines. Subsequently, the drag from westerly motion in ice stream C has deformed the earlier flow lines in the proximity of its margin (Figure 3), as earlier noted by Scambos and Bindschadler (1991). Figure 4 is an enhanced Landsat TM image of the area where the relict ice stream enters the Ross Ice Shelf. Flow features extend from the scar onto the floating ice, seen here as the generally brighter area north and to either side of the region outlined by the box. In this and other enhanced Landsat TM images, the scar appears to be crevasse-free along most of its length. However, the area just before it enters the Ross Ice Shelf (box) has a train of about 9 active crevasses. While the crevasses are not resolved in the figure at this magnification, they are easily identified at full resolution, and have been tracked in repeat Landsat TM scenes by Jacobel et al. (1994). Using the methods of Bindschadler and Scambos (1991), they obtain velocities of 20 to 30 m/a - an order of magnitude less than ice stream D in this area (Scambos et al., 1995), but also nearly an order of magnitude larger than typical interstream ridge ice (Thomas et al., 1984). This shows that at least one area of the relict ice stream may be partially active today. Despite the strong morphological evidence of one relict margin and several ice stream-like features, there is no clear evidence of a second scar, i.e., an opposite margin, in Figure 2 or in Landsat TM imagery. However, a very subtle change in the surface texture approximately 50 km northward of the scar may mark the opposite side of the former ice stream. The southern margin of ice stream D deviates to the south abruptly where it is intersected by this change in surface texture. Internal Stratigraphy Figure 5 shows a portion of the results of a radar traverse from the summit of Siple Dome across the scar feature. The profile corresponds to the 30 km long segment trending to the northeast as indicated in Figure 2. The scar (approximately km 18-23 in Figure 5) corresponds to a trough and upward step in the surface topography with a span of about 5 km, which is consistent with changes in the surface slope depicted in the imagery. The approximate depth scale for the two-way travel time uses a measured average velocity of 85.2 meters per microsecond. The ice thickness here is about 920 meters and the bed is generally smooth under the step in surface height, as it is throughout the profile. In contrast, the smooth and continuous internal stratigraphy found within Siple Dome to the southeast is abruptly broken under the step (approximately km 18 in the figure) where the layering is disturbed. Internal stratigraphy is again evident on the northeast side of the step, but is more strongly folded in patterns similar to those found in ice stream ice (Jacobel et al., 1993). The pattern of internal layer echoes (spacing and brightness) is different on either side of the disturbed zone throughout most of the ice thickness. Further, the character of the bed echo changes across the scar feature with the echo amplitude in the former ice stream nearly double that of the ridge ice. An exception to these differences on either side of the scar occurs in the uppermost layers which appear to be continuous.

(Jacobel, Scambos, Raymond and Gades)
4
These radar observations prove that the scar is a dynamic boundary, and together with the enhanced satellite image-based evidence, support the hypothesis of a former ice stream margin and ice stream channel crossing Siple Dome. The zone of highly disturbed internal stratigraphy would be expected at an ice stream margin. Discontinuity in the pattern of internal layers from the ridge ice to the former ice stream must arise from the different origins and dynamic history of the ice on either side of the margin. The difference in bed echo strengths across the scar is also consistent with a different origin and thermodynamic regime for the ice. Given that the uppermost internal reflectors are continuous across the relict margin zone, as they appear to be in Figure 5 and in other profiles we have measured, it is possible to calculate the shut-down date of streaming flow in this channel. Doing this precisely requires determining the deepest layers which are in fact continuous, and an accurate age-depth relation for the ice. The radar record in Figure 5 shows several layers continuous across the former ice stream margin. These begin just below the air wave arrivals (first three dark bands), and extend down to approximately 1.5 microseconds. Between 1.5 and 2.2 microseconds layers appear to be continuous across the scar, but they are more deformed. Below this, a pattern of more abrupt breaks in the layering is evident. Data from a second profile across this section at a higher transmitter frequency show a similar pattern with somewhat more detail in the upper section. In these data it appears that the continuous layers may extend as low as 2.2 microseconds. Internal layers from the southwest side of the relict margin, assumed to be isochrones (Whillans, 1976), can be traced back to the summit of Siple Dome where accumulation rates have been determined and a 160 m core has recently been drilled. Using an approximate age-depth relation based on core samples from Siple Dome (R. Alley, pers. comm.) the lowest layer clearly continuous across the relict margin at 1.5 microseconds corresponds to approximately 1.3 KYBP as the burial age of this horizon. This means that shearing across this margin had ceased prior to this time. A less conservative estimate using the layers down to 2.2 microseconds which may be continuous across the margin, and an extrapolation of the age depth scale from the core, gives an age of approximately 1.7 KYBP as the time of shut-down of this ice stream. Because a continuous layer implies a minimum age (the shut down occurred prior to this time), we use the more conservative 1.3 KYBP throughout the discussion which follows because it encompasses the earlier date. Discussion A likely sequence of events is then as follows: Prior to 1.3 KYBP ice from the upper reaches of modern ice stream C flowed to the north across the flank of Siple Dome and into the Ross Ice Shelf near the present outlet of ice stream D. The channel to the south of Siple Dome may or may not have been active at this time. About 1.3 KYBP flow in the channel to the north slowed. The channel to the south then underwent significant change, expanding its north margin, and in so doing truncating flow features in the channel to the north. Flow lines of this relict channel were subsequently dragged along with flow to the west near the modern margin of ice stream C. Finally, ice stream C became inactive about 130 years ago. The implications of a relatively recent change in ice stream configuration are important for our understanding of the response of the WAIS to environmental change. The paradigm of ice discharge through permanent fast-moving ice streams separated by stable slow-moving ridge ice is evidently incomplete and must be modified to include an understanding of how ice streams

(Jacobel, Scambos, Raymond and Gades)
5
migrate and other time-dependent behavior. At the least, it appears that large areas of the inter-ice stream ridges have not always been ridges, and that ice streams are not forever ice streams. Further, flow rates within recently-streaming channels are not insignificant, and may need to be factored into ice sheet mass balance calculations as well. Models of the evolution of the WAIS in response to climate change will need to include these phenomena to describe more accurately what has happened in the past and to predict changes in the future. Acknowledgments We would like to acknowledge the efforts of our coworkers, Nadine Nereson and Howard Conway who were essential members of the field team. This project was supported by grants from the National Science Foundation: OPP 9316338 to St. Olaf College, OPP 9316807 to the University of Washington, and OPP 9317007 to NSIDC, University of Colorado Boulder.

(Jacobel, Scambos, Raymond and Gades)
6
References Albertz, J., and K. Zelianeos. Enhancement of satellite image data by data cumulation. Proceedings ISPRS, 27(B3), 1-10, 1988. Alley, R.B., S. Anandakrishnan, C.R. Bentley and N. Lord. A water-piracy hypothesis for the stagnation of ice stream C. Annals of Glaciology, 20, 187-194, 1995. Alley, R.B. and I.M. Whillans. Changes in the West Antarctic Ice Sheet. Science, 254(5034), 959-963, 1991. Bindschadler, R.A., ed. First annual West Antarctic Ice Sheet (WAIS) science workshop. NASA Conference Publication 3222, 1992. Bindschadler, R.A. and T.A. Scambos. Satellite-image-derived velocity field of an Antarctic ice stream. Science, 252(5003), 242-246, 1991. Bindschadler, R.A. and P.L. Vornberger. AVHRR imagery reveals Antarctic ice dynamics. EOS, 71(23), 741-742, 1990. Hughes, T. West Antarctic ice streams. Reviews of Geophysics and Space Physics, 15(1), 1-46, 1977. Jacobel, R.J., C.W. Dorsey and A.M. Harner. Ice velocities near a relict flow feature on Siple Dome. Antarctic Journal, XXIX(5), (in press), 1994. Jacobel, R.J., A.M. Gades, D.L. Gottschling, S.M. Hodge and D.L. Wright. Interpretation of radar-detected internal layer folding in West Antarctic ice streams. Journal of Glaciology, 39(133), 528-537, 1993. MacAyeal, D.R. Irregular oscillations of the West Antarctic Ice Sheet. Nature, 359, 29-32, 1992. Retzlaff, R. and C.R. Bentley. Timing of stagnation of ice stream C, West Antarctica, from short-pulse radar studies of buried surface crevasses. Journal of Glaciology, 39(133), 553-561, 1993. Scambos, T.A., K.A. Echelmeyer, M.A. Fahnestock and R.A. Bindschadler. Development of enhanced ice flow at the southern margin of ice stream D. Annals of Glaciology, 20, 313-318, 1995. Scambos, T.A. and R.A. Bindschadler. Feature maps of ice streams C, D, and E, West Antarctica. Antarctic Journal, XXVI(5), 312-314, 1991.
(Jacobel, Scambos, Raymond and Gades)
7
Shabtaie, S. and C.R. Bentley. Ice-thickness map of the West Antarctic ice streams by radar sounding. Annals of Glaciology, 11, 126-136, 1988. Shabtaie, S. and C.R. Bentley. West Antarctic ice streams draining into the Ross Ice Shelf, configuration and mass balance. Journal of Geophysical Research, 92(B2), 1311-1336, 1987. Stephenson, S.N. and R.A. Bindschadler. Is ice-stream evolution revealed by satellite imagery? Annals of Glaciology, 14, 273-277, 1990. Thomas, R.H., D.R. MacAyeal, D.H. Eilers and D.R. Gaylord. Glaciological studies on the Ross Ice Shelf, Antarctica 1973-1978. Antarctic Research Series, 42, paper 2, 21-53, 1984. Whillans, I.M. Radio echo layers and the recent stability of the West Antarctic Ice Sheet. Nature, 264(5582), 152-155, 1976.

(Jacobel, Scambos, Raymond and Gades)
8
Figure Captions
Figure 1. Generalized location map of Siple Dome and the ice streams draining the West Antarctic Ice Sheet into the Ross Sea. Figure 2. Composite AVHRR image of the Siple Dome area. White lines indicate the location of principal radar and GPS profiling traverses. Arrow shows the possible location of the opposite margin of the former ice stream as discussed in the text. Figure 3. Enhanced Landsat TM subscene of a portion of Figure 2 where north trending flowbands in the relict ice stream intersect the modern boundary of ice stream C. Figure 4. Landsat TM image subscene corresponding to a portion of Figure 2 where ice stream D and the relict ice stream enter the Ross Ice Shelf. Crevasses within the area of the box have been identified in sequential satellite imagery and used to measure ice velocities as described in the text. Figure 5. Radar profile and surface elevation across the scar feature (southwest to northeast). The profile corresponds to the northeast trending segment of the traverse indicated in Figure 2. Upper panel shows the GPS measured surface elevation in meters above the WGS 1984 ellipsoid. Lower panel is surface and bed topography, and internal stratigraphy from the radar. The vertical disturbance at km 22 is an artifact produced by a temporary break in the antenna.

ROSS ICE SHELF
Siple Dome
scale
200 km
Figure 1. Generalized location map of Siple Dome and the ice streams draining the West Ant-arctic Ice Sheet into the Ross Sea.
Siple Dome
Ice Stream D
Ice Stream C
Ross Ice Shelf
scar feature
140 W155 W
82 S
81 S
scalescale
30 km30 km
¥ main camp¥ main camp
Siple Dome AreaSiple Dome AreaFigure 4
Figure 3
⇑⇑NN
←
Figure 2. Composite AVHRR image of the Siple Dome area. White lines indicate the location of principal radar and GPS profiling traverses. Arrow shows the possible location of the opposite margin of the former ice stream as discussed in the text.
Ice Stream C
SipleDome
scar feature relictflowbands
scalescale
5 km5 km⇑⇑NN
Figure 3. Enhanced Landsat TM subscene of a portion of Figure 2 where north trending flowbands in the relict ice stream intersect the modern boundary of ice stream C.
Ross Ice ShelfIce Stream D
scar feature
region ofactive crevassing
SipleDome
scalescale
6 km6 km⇑⇑NN
Figure 4. Landsat TM image subscene corresponding to a portion of Figure 2 where ice stream D and the relict ice stream enter the Ross Ice Shelf. Crevasses within the area of the box have been identified in sequential satellite imagery and used to measure ice velocities as described in the text.
18141062-2-6-10-10
190
220
250
280
Ele
vatio
n (m
)
0302010
0
5
01
Two-
Way
Tra
vel T
ime
(use
c)
Figure 5. Radar profile and surface elevation across the scar feature (southwest to northeast). The profile corresponds to the northeast trending segment of the traverse indicated in Figure 2. Upper panel shows the GPS measured surface elevation in meters above the WGS 1984 ellipsoid. Lower panel is surface and bed topography, and internal stratigraphy from the radar. The vertical disturbance at km 22 is an artifact produced by a tempo-rary break in the antenna.
Distance (Km)