changes in chemical and sensory properties of … changes in chemical and sensory properties of...
TRANSCRIPT
Instructions for use
Title Changes in Chemical and Sensory Properties of Migaki-Nishin (Dried Herring Fillet) during Drying
Author(s) Shah, A. K. M. Azad; Tokunaga, C.; Ogasawara, M.; Kurihara, H.; Takahashi, Koretaro
Citation Journal of Food Science, 74(7): S309-S314
Issue Date 2009-09
Doc URL http://hdl.handle.net/2115/43810
Rights The definitive version is available at www.blackwell-synergy.com
Type article (author version)
File Information JFS74-7_S309-S314.pdf
Hokkaido University Collection of Scholarly and Academic Papers : HUSCAP

1
Changes in Chemical and Sensory Properties of Migaki-Nishin (Dried Herring Fillet)
during Drying
A.K.M. AZAD SHAH
Division of Marine Life Science, Graduate School of Fisheries Sciences, Hokkaido University,
Hakodate 041-8611, Japan
C. TOKUNAGA
Food Creation Center, Kyowa Hakko Food Specialties Co., Ltd. Ibaraki 300-0398, Japan
M. OGASAWARA
Food Creation Center, Kyowa Hakko Food Specialties Co., Ltd. Ibaraki 300-0398, Japan
H. KURIHARA
Division of Marine Life Science, Graduate School of Fisheries Sciences, Hokkaido University,
Hakodate 041-8611, Japan
AND
K. TAKAHASHI
Division of Marine Life Science, Graduate School of Fisheries Sciences, Hokkaido University,
Hakodate 041-8611, Japan
Corresponding author:
A. K. M. Azad Shah
Division of Marine Life Science
Graduate School of Fisheries Sciences
Hokkaido University
3-1-1 Minato-cho, Hakodate 041-8611, Japan
Tel.: +81-138-40-5562; Fax: +81-138-40-5560
E-mail: [email protected]
Running title: Sensory properties of migaki-nishin ….…..
Journal section: Sensory and Food Quality

2
ABSTRACT: Migaki-nishin is a Japanese term that refers to dried herring fillets. It is widely consumed
in Japan due to its characteristic flavor enhancing properties. This study was conducted to investigate
the changes in chemical and sensory properties of migaki-nishin during drying. Chemical analyses
showed that extractive nitrogen and amount of peptides increased significantly (P < 0.05) up to the
eighth day of drying and then slightly decreased by the tenth day. Glutamic acid, alanine, glycine, and
histidine were the most abundant free amino acids and the largest increase was found in samples
dried for 10 days. A decrease in Hunter’s L* value (lightness) and increase in b* value (yellowness) as
well as browning intensity suggested that nonenzymatic browning occurred in migaki-nishin during
drying. Fluorescence spectrophotometric determination also revealed that Maillard reactions
progressed throughout the drying period. In addition, available lysine content and free amino groups
decreased significantly (P < 0.05) as drying progressed. Sensory evaluation showed that addition of
water-soluble extracts to Japanese noodle soup (mentsuyu) linearly enhanced the flavor
characteristics such as thickness, mouthfulness and continuity with the increased length of drying time.
These results suggest that during the drying period, proteolysis as well as Maillard reaction products
increased markedly, which might contribute to the characteristic taste and flavor of migaki-nishin.
Keywords: Herring, seafood processing, peptides, Maillard reaction, taste

3
Introduction
Migaki-nishin is a Japanese term that refers to dried herring (Clupea pallasii) fillets. It remarkably
enhances the characteristic taste and flavor of savory dishes like noodles by enhancing flavor
characters, such as thickness, mouthfulness, and continuity. These flavor characters are often called
koku (a Japanese term). To the best of our knowledge, Japan is the only migaki-nishin producing
country, and processing of herring fillet is carried out based on experience. Processors are usually
selling their products after 10 d drying of herring fillet. There is a need for reliable data on the
processing of migaki-nishin to help decide the proper drying time and quality of the final product or the
stage at which optimum taste and flavor are developed.
The flavor of fish and shellfish principally originates from extractive components (Konosu and
Yamaguchi 1982). It is also well known that amino acids and peptides contribute to the taste of a wide
variety of foods. Some amino acids and peptides have been shown to be important in either
intensifying or masking the flavor of certain foods (Maga 1994).
In the case of dried seafood products nonenzymatic browning is an important factor enhancing
flavor, nutrition, and possibly safety. Nonenzymatic browning takes place during processing and
storage. Nonenzymatic browning is a result of reactions between products of lipid oxidation such as
carbonyl compounds and amino compounds (Koizumi and others 1959; Takiguchi 1992).
Nonenzymatic browning is more prominent in fatty fish than lean fish muscle because fatty fish
contains high amount of polyunsaturated fatty acids, which are highly susceptible to oxidation.
Furthermore, the high content of highly reactive free amino acids such as taurine, lysine, and
methionine in species like Atlantic short finned squid greatly contribute to Maillard browning reaction
during the processing and storage (Haard and Arcilla 1985), and this reaction is of considerable
importance in the dried fish products (Haard 1995).

4
However, to the best of our knowledge, no study has so far been reported concerning biochemical
changes that are responsible for the characteristic taste and flavor of migaki-nishin during drying.
Therefore, the present study was aimed to evaluate the changes in chemical and sensory properties of
migaki-nishin during drying.
Materials and Methods
Migaki-nishin sample
Migaki-nishin was obtained from Iwasaki Suisan Ltd., Hakodate, Japan. Herring (Clupea pallasii)
was captured at the coast of Kamchatka Peninsula, Russia, in October 2006. It was kept frozen for
approximately 2 to 3 mo until it was processed. Upon arrival in the factory, herring was thawed, gutted,
washed, and then filleted for drying. Herring fillets were dried using huge electric fans. Room
temperature and relative humidity were maintained at approximately 14°C and 45%, respectively.
During drying, samples were randomly taken for analysis at days 2, 4, 6, 8, and 10. Samples were
minced to uniformity and used for analyses.
Preparation of water-soluble extracts (WSE)
Water-soluble extracts (WSE) were prepared following the method described by Hondo and
Mochizuki (1968). Distilled water (80 mL) was added to 20 g of minced migaki-nishin sample and then
homogenized. The resulting slurry was heated at 100°C for 10 min. After being cooled, the slurry was
filtered, using filter paper (Advantec Nr 1, Toyo Roshi Kaisha Ltd., Tokyo, Japan). The resulting filtrate
was made up to 100 mL and was used as WSE. The WSE were freeze-dried and stored at –50°C until
used.

5
Chemical analyses
Proximate composition (moisture, crude protein, and ash) was determined based on the AOAC
(1995) methods. Total lipid was extracted according to the method of Bligh and Dyer (1959). Extractive
nitrogen content of WSE was determined by the Dumas method (AOAC 1995; Schmitter and Rihs
1989), and an automatic nitrogen analysis system (Thermo Electron Corp., Waltham, Mass., U.S.A).
Free and total amino acid compositions of WSE were determined before and after hydrolyzing with 6N
HCl at 115°C for 24 h and then analyzed with an amino acid analyzer (JEOL JLC-500/V, Nihon Denshi
Datem Co. Ltd., Tokyo, Japan). Amounts of peptides were calculated by subtraction of the free amino
acid concentration from the total amino acid concentration in the hydrolyzed WSE. The WSE were
analyzed on HPLC (Hitachi 655A, Hitachi, Ltd., Tokyo, Japan) with a gel filtration column (TSK-GEL
G2000SW, Tosoh Corp., Tokyo, Japan) and it was filtered through 0.45 µm filters prior to injection. The
mobile phase consisted of an aqueous solution of 45% acetonitrile (Wako Pure Chemical Industries
Ltd., Osaka, Japan) containing 0.1% trifluoroacetic acid. Flow rate was 0.8 mL/min. UV absorbance at
214 nm was monitored to visualize chromatographic profile. To analyze the coloration of WSE, the
HPLC was connected with fluorescence spectrophotometer (Hitachi F-2500, Hitachi
High-Technologies Corporation, Tokyo, Japan). Detection wavelengths at λ ex 350 nm and λ em 440
nm were used to determine Maillard reaction products (Yeboah and others 1999). Aprotinin (MW 6500
Da), oxidized insulin chain B (MW 3495 Da), glycylglycylglycine (MW 189 Da) and glycine (MW 75 Da)
were used to prepare calibration curve and to determine molecular weight.
Color measurement
Changes in color of the migaki-nishin samples were measured by Hunter’s L*, a* and b* values
using a color difference meter (Nippon Denshoku Kogyo Co. Ltd., Tokyo, Japan). The color variations
6
of each sample were compensated for by recording the average of three reading taken on the surface
of the sample.
Browning intensity
Approximately 5 g of sample were homogenized in 30 mL of cold 7% trichloroacetic acid for 2 min,
centrifuged at 4000 g for 20 min, and then filtered. This procedure was repeated 3 times. The
supernatants were then combined and made up to 100 mL. The absorbance at 420 nm (A420) was
measured to express the browning intensity (A420/g) of the migaki-nishin samples.
Available lysine content
Available lysine content was determined following the method described by Carpenter (1960). An
accurately weighed sample (containing 30–50 mg of nitrogen) was derivatized with NaHCO3 and
ethanolic 1-fluoro-2,4-dinitrobenzene (FDNB) solution (2.5% v/v), and then hydrolyzed with 8.1 N HCl
at 120°C for 20 h. Absorbance of the reaction product of ε-DNP-lysine was measured
spectrophotometrically at 435 nm. Available lysine content was expressed as g/16 g of N.
Determination of free amino groups
Free amino groups were determined by the method of Benjakul and Morrissey (1997). One gram
of sample was accurately weighed and homogenized with 29 mL of 1.0% SDS at 8000 rpm for 1 min.
The mixture was incubated at 85°C for 15 min and then centrifuged at 10,000 × g at room temperature
for 10 min. The reaction mixture containing 125 µL of supernatant and 2.0 mL of 0.2125 M phosphate
buffer pH 8.2 was mixed with 1.0 mL of 0.01% (w/v) 2,4,6-trinitrobenzenesulfonic acid (TNBS) solution
and incubated at 50°C for 30 min in the dark. To terminate the reaction, 2.0 mL of 0.1 M sodium sulfite
7
were added. The absorbance was measured at 420 nm. Free amino groups were calculated as
micromoles of leucine per gram dry matter.
Sensory evaluation
Sensory evaluation was carried out by adding WSE to mentsuyu (a Japanese noodle soup)
following the method of Ueda and others (1997) with some modifications. Mentsuyu was prepared
according to the method of Shah and others (2009). It was diluted with 6 volumes of distilled water and
used as a control solution. The WSE were dissolved in mentsuyu at a concentration of 0.10% (w/v)
and then warmed to 60°C in a water bath. About 50 mL of sample and control solutions were served in
opaque disposable plastic cups at the same time. Panel members were instructed to put an adequate
volume in the mouth, and then to expectorate. The panelists were asked to judge the intensities of the
test samples using a scale of 17, where 3 points was given to the control solution. Scoring was done
on the basis of saltiness, umami, thickness, mouthfulness and continuity. Sensory evaluation was
performed in the separated sensory booths. The panel was composed of 5 trained assessors (3 males
and 2 females; ages between 26 and 37 y) from the Food Creation Center, Kyowa Hakko Food
Specialties Co., Ltd. Ibaraki, Japan. All the panel members had extensive experience in tasting and
agreed on the intensities of saltiness, umami, thickness, mouthfulness, and continuity in mentsuyu.
Statistical analysis
For each measurement, analyses were repeated 3 times, data were pooled, and the mean and
standard deviation were determined. Data were subjected to one-way analysis of variance (ANOVA)
followed by Duncan’s multiple range test to identify differences among the means at P < 0.05 using

8
STATGRAPHICS Plus version 2.1 (StatPoint, Inc., Virginia, USA). We used a linear regression model
to analyze the relationship between sensory attributes and drying time.
Results and Discussion
Changes in proximate composition
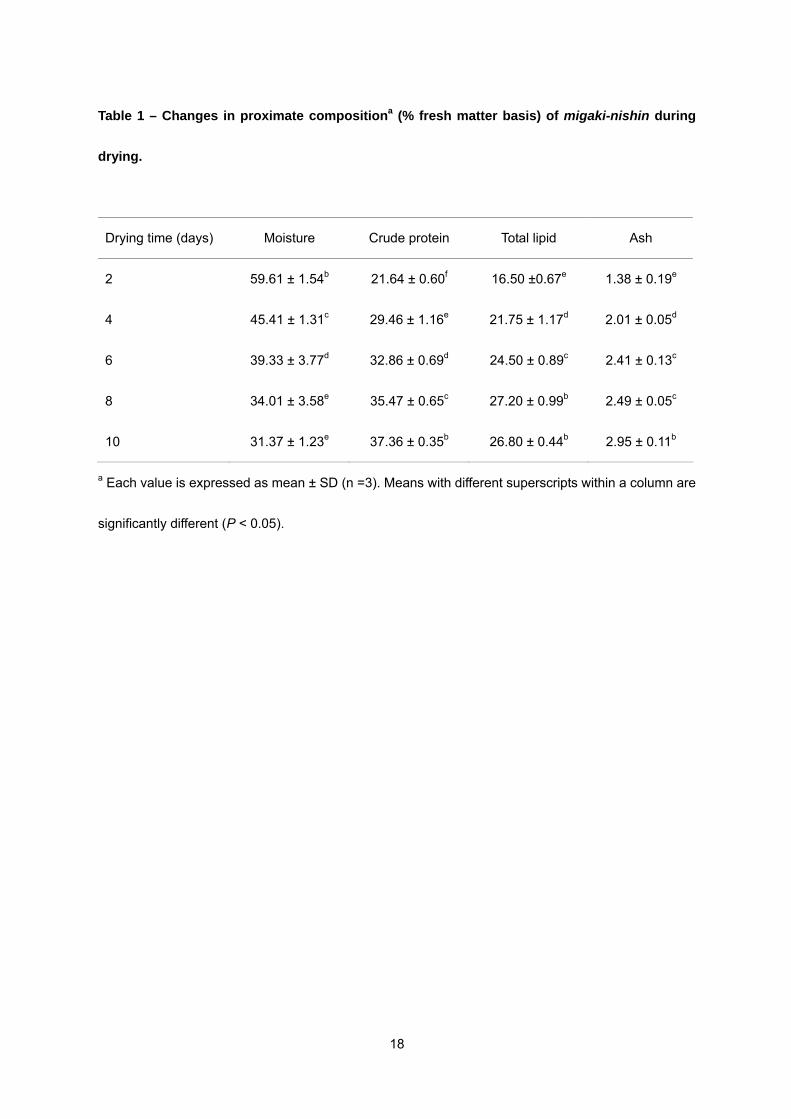
Changes in proximate composition (percent fresh matter basis) of migaki-nishin are shown in
Table 1. The moisture contents of migaki-nishin ranged from 31.37% to 59.61%. The highest crude
protein content was observed in the 10th day of drying migaki-nishin. Total lipid content increased
significantly (P < 0.05) from 16.50% to 27.20% by the 8th day of drying while it decreased slightly to
26.80% by the 10th day of drying. Aro and others (2005) also reported that the lipid content of pickled
herring decreased significantly (P < 0.05) from 13.8% to 11.5% during 12 mo of storage. The ash
content increased significantly (P < 0.05) from 1.38% to 2.95% during the drying period. Decrease of
moisture content with corresponding increase in crude protein, total lipid, and ash content can be
explained by increased dehydration of migaki-nishin during the drying period.
Changes in chemical components
Changes in extractive nitrogen content of migaki-nishin during drying are shown in Figure 1.
Extractive nitrogen mainly comprises of water-soluble peptides, free amino acids, and nucleotides.
The extractive nitrogen content of WSE increased significantly (P < 0.05) from 13.61% to 14.61% by
the 8th day of drying. It then decreased slightly to 14.32% by the 10th day of drying. This result
suggests that some free amino acids especially lysine or other nucleotides might be interacted with
lipid oxidation products such as carbonyl compounds. Changes in free amino acid composition of
migaki-nishin during drying are presented in Table 2. Total amount of free amino acids significantly
9
increased (P < 0.05) from 711.53 to 1211.36 mg/100 g dry matter, probably as a result of proteolysis.
Glycine, alanine, histidine, and lysine were the most abundant free amino acids, although most of the
individual amino acid contents fluctuated during the drying period. These free amino acids were also
found to be predominant in dried sardine (Takiguchi 1999) and dried skipjack (Fuke and others 1989).
The concentrations of glutamic acid, alanine, valine, and leucine significantly (P < 0.05) increased
while lysine decreased during drying. Notably concentrations of glutamic acid (desirable for umami) as
well as glycine and alanine (desirable for their sweet taste) were higher in samples dried for 10 d than
in samples dried for 2 d. It was postulated that the delicious taste of migaki-nishin is due to these
amino acids. Glutamic acid and glycine are recognized as taste active amino acids in abalone, sea
urchin, snow crab, scallop and short-necked clam irrespective of their amounts (Fuke and Konosu
1991). Yamaguchi and Kimizuka (1979) also reported that addition of glutamic acid to synthetic
extracts not only increases umami but also improves overall attributes by imparting continuity,
complexity, fullness, and mildness.
As shown in Figure 1, amount of peptides increased significantly (P < 0.05) from 2.52 to 3.70
g/100 g dry matter during the first 8 d of drying period then slightly decreased by the 10th day (3.59
g/100 g dry matter). However, there was no significant difference between the amount of peptides in
the 8th and 10th days dried sample. This result suggests that proteolysis occurred in migaki-nishin up
to 8 d of drying period and then it was terminated. The importance of peptides in the sensory
perception of food has been recognized for long time. Itou and others (2006) reported that peptide
content increased remarkably in narezushi (a fermented mackerel product) during processing and this
was thought to be responsible for the umami taste of narezushi. Moreover, Ishii and others (1995)
reported that amount of peptides increased during low temperature heating of beef, enhancing
preferable taste of meat. Gel filtration chromatograms of WSE in migaki-nishin during drying are

10
shown in Figure 2. It can be observed from the chromatograms that concentration of peak 3 was
increased gradually up to 8 d WSE then slightly decreased in the WSE of 10 d. Average molecular
weight of this peak was 1.3 KDa. This result suggests that protein hydrolysis was progressed up to 8 d
drying period and then it was terminated.
Changes in coloration and browning intensity
Changes in color components and browning intensity of migaki-nishin during drying are presented
in Figure 3. During drying, the L* value (lightness) decreased significantly (P < 0.05) from 36.60 to
28.41 within 4 d of drying and slowly thereafter. However, no significant change in the L* value
(lightness) was observed in the later stages of drying period (P > 0.05). Hunter’s a* value (redness)
was mostly stable while b* value (yellowness) gradually increased (P < 0.05) throughout the drying
period. Changes in L*- and b*- values might be attributed to non-enzymatic browning reaction, which
progressed continuously during drying of migaki-nishin. Takiguchi (1999) also reported that Hunter’s
a*- and b*- values increased gradually in the pulverized niboshi (boiled and dried anchovy) throughout
the storage period at 25°C; while these values increased rapidly in the frozen sample after thawing.
The increase in absorbance at 420 nm was used as an indicator of browning development in the
final stage of the browning reaction (Ajandouz and others 2001). The browning intensity of
migaki-nishin muscle increased significantly (P < 0.05) throughout the drying period (Figure 3). As
migaki-nishin contains very small amounts of carbohydrate, secondary lipid oxidation products such as
aldehyde or other carbonyl compounds might react with free amino acids during drying.
Coloration of WSE was also analyzed using a fluorescence spectrophotometer. From the
chromatogram, Maillard reaction products with molecular weights ranging from 12.5 KDa to 31 KDa
and 0.3 KDa to 4 KDa were observed (Figure 4). Concentration of Maillard reaction products especially
11
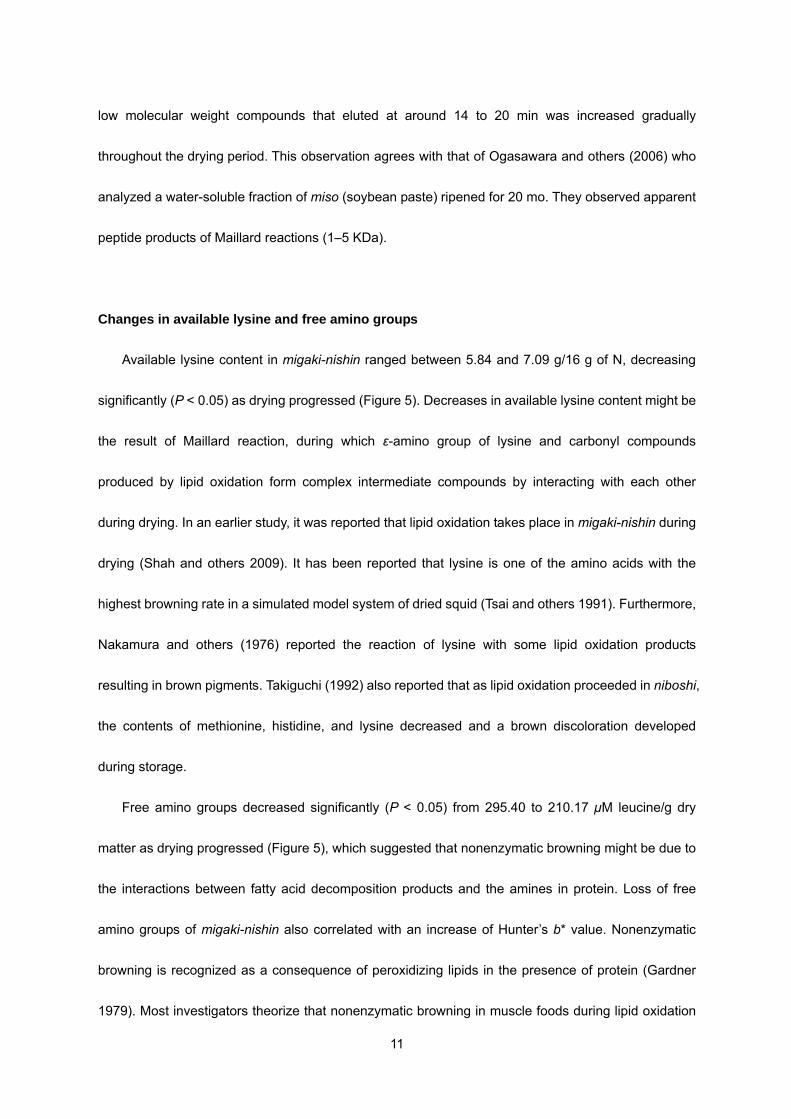
low molecular weight compounds that eluted at around 14 to 20 min was increased gradually
throughout the drying period. This observation agrees with that of Ogasawara and others (2006) who
analyzed a water-soluble fraction of miso (soybean paste) ripened for 20 mo. They observed apparent
peptide products of Maillard reactions (1–5 KDa).
Changes in available lysine and free amino groups
Available lysine content in migaki-nishin ranged between 5.84 and 7.09 g/16 g of N, decreasing
significantly (P < 0.05) as drying progressed (Figure 5). Decreases in available lysine content might be
the result of Maillard reaction, during which ε-amino group of lysine and carbonyl compounds
produced by lipid oxidation form complex intermediate compounds by interacting with each other
during drying. In an earlier study, it was reported that lipid oxidation takes place in migaki-nishin during
drying (Shah and others 2009). It has been reported that lysine is one of the amino acids with the
highest browning rate in a simulated model system of dried squid (Tsai and others 1991). Furthermore,
Nakamura and others (1976) reported the reaction of lysine with some lipid oxidation products
resulting in brown pigments. Takiguchi (1992) also reported that as lipid oxidation proceeded in niboshi,
the contents of methionine, histidine, and lysine decreased and a brown discoloration developed
during storage.
Free amino groups decreased significantly (P < 0.05) from 295.40 to 210.17 µM leucine/g dry
matter as drying progressed (Figure 5), which suggested that nonenzymatic browning might be due to
the interactions between fatty acid decomposition products and the amines in protein. Loss of free
amino groups of migaki-nishin also correlated with an increase of Hunter’s b* value. Nonenzymatic
browning is recognized as a consequence of peroxidizing lipids in the presence of protein (Gardner
1979). Most investigators theorize that nonenzymatic browning in muscle foods during lipid oxidation

12
starts with the condensation of aldehydes with amines via Schiff base reaction pathways (Pokorny
1981; Kikugawa and others 1984).
Changes in sensory properties
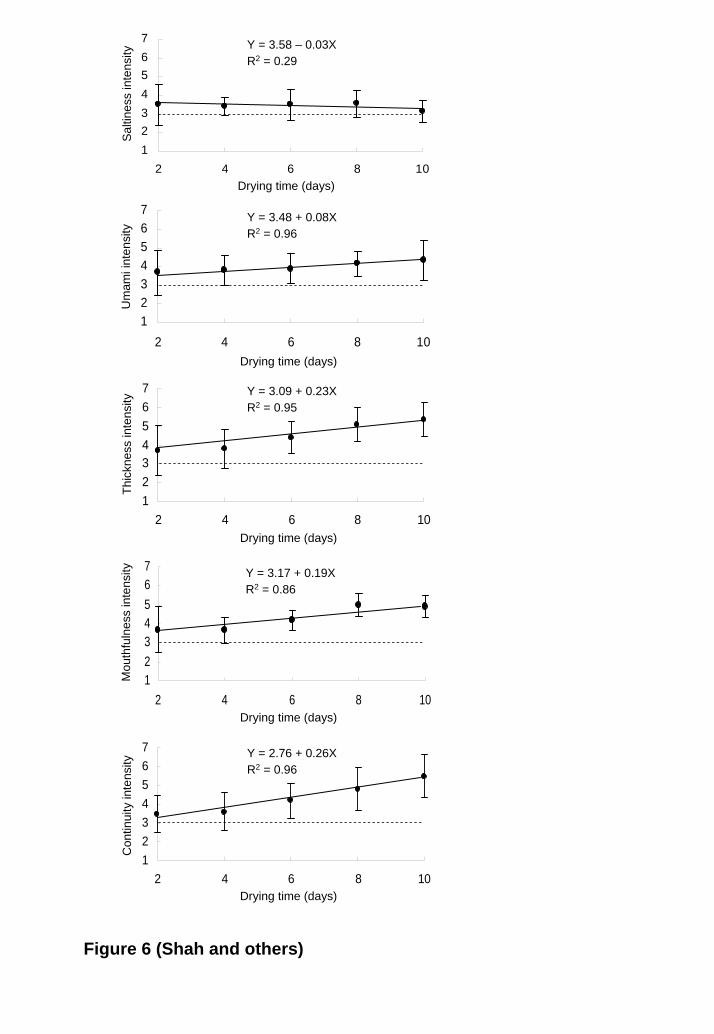
The relationships between drying time and perceived taste or flavor intensity of water-soluble
extracts in mentsuyu are shown in Figure 6. The WSE had no taste but acquired a faint aroma in
distilled water at a concentration of 0.10% (data not shown). The addition of WSE to mentsuyu did not
show any significant influence on saltiness intensity (P > 0.05) with the increase of drying time.
However, addition of WSE to mentsuyu showed a positive significant relationship (P < 0.05) between
the umami intensity and drying time. Furthermore, addition of WSE to mentsuyu showed a positive
significant (P < 0.05) relationship between drying time and flavor characteristics such as thickness,
mouthfulness, and continuity. These results suggest that the flavor enhancement of WSE in mentsuyu
is linearly dependent on the drying time of migaki-nishin. Ogasawara and others (2006) reported that
peptide products of Maillard reactions contain key substances that give the characteristic flavor
(mouthfulness and continuity) of miso ripened for extended periods. It has also been reported that
pyrazines and some peptides generated together in certain foods during the process of boiling or
aging for a long period that brought koku (Ogasawara 2003). The multivalent taste-modulating Maillard
reaction product alapyridaine in beef broth enhances sweetness and umami character (Ottinger and
Hofmann 2003). Glutathione reportedly has a characteristic flavor that includes continuity,
mouthfulness, and thickness in an umami solution (Ueda and others 1997).
Conclusion

13
Drying of herring fillets causes changes such as increase of extractive nitrogen, free amino acids,
and peptides while at the same time decreasing available lysine and free amino groups as drying
progresses. Significant increase of browning intensity and Maillard reaction products suggest that
Maillard reaction progressed throughout the drying period. Thus, it can be concluded that during the
drying period, proteolysis as well as Maillard reaction products markedly increased, which might have
a contribution to the characteristic taste and flavor of migaki-nishin.
Acknowledgments
The 1st author thanks the Ministry of Education, Culture, Sports, Science and Technology of
Japan for providing him a scholarship. The authors also thank the sensory panel members of Food
Creation Center, Kyowa Hakko Food Specialties Co., Ltd. Ibaraki, Japan, for their sensory
assessments.
References
Ajandouz EH, Tchiakpe LS, Dalle Ore F, Benajiba A, Puigserver A. 2001. Effects of pH on
caramelization and Maillard reaction kinetics in fructose-lysine model systems. J Food Sci
66:926–31.
AOAC Assn. of Official Analytical Chemists. 1995. Official methods of analysis. Virginia: AOAC Intl.
Aro TL, Larmo PS, Backman CH, Kallio HP, Tahvonen RL. 2005. Fatty acids and fat-soluble vitamins
in salted herring (Clupea harengus) products. J Agric Food Chem 53:1482–8.
Benjakul S, Morrissey MT. 1997. Protein hydrolysates from Pacific whiting solid wastes. J Agric Food
Chem 45:3423–30.

14
Bligh EG, Dyer WJ. 1959. A rapid method of total lipid extraction and purification. Can J Physiol
Pharmacol 37:911–7.
Carpenter KJ. 1960. The estimation of the available lysine in animal-protein foods. Biochem J
77:604–10.
Fuke S, Konosu S. 1991. Taste-active components in some foods: A review of Japanese research.
Physiol Behavior 49:863–8.
Fuke S, Watanabe K, Sakai H, Konosu S. 1989. Extractive components of dried skipjack
(Katsuobushi). Nippon Shokuhin Kogyo Gakkaishi 36:67–70.
Gardner HW. 1979. Lipid hydroperoxide reactivity with proteins and amino acids: A review. J Agric
Food Chem 27:220–9.
Haard NF, Arcilla R. 1985. Precursors of Maillard browning in Atlantic short finned squid. Can Inst
Food Sci Technol 18:326–31.
Haard NF. 1995. Chemical reactions in dried fish. In: Fish Drying in Indonesia. Canberra: ACIAR
Workshop, No. 59. p 67–75.
Hondo S, Mochizuki T. 1968. Studies on the degradation process of soybean protein during miso
making, part II, changes in peptides during the miso making. Nippon Shokuhin Kogyo Gakkaishi
15:414–7.
Ishii K, Tsuchida M, Nishimura T, Okitani A, Nakagawa A, Hatae K, Shimada A. 1995. Changes in the
taste and taste components of beef during heating at a low temperature for a long time. J Home
Econ Japan 46:229–34.
Itou K, Kobayashi S, Ooizumi T, Akahane Y. 2006. Changes of proximate composition and extractive
components in narezushi, a fermented mackerel product, during processing. Fish Sci
72:1269–76.

15
Kikugawa K, Ido Y, Mikami A. 1984. Studies on peroxidized lipids VI. Fluorescent products derived
from the reaction of primary amines, malondialdehyde and monofunctional aldehydes. J Am Oil
Chem Soc 61:1574–81.
Koizumi C, Kurobe S, Nonaka J. 1959. On the browning of dried fish products. Bull Jap Soc Sci Fish
25:368–72.
Konosu S, Yamaguchi K. 1982. The flavor components in fish and shellfish. In: Martin RE, Flick GL,
Hebard CE, Ward CR, editors. Chemistry and Biochemistry of Marine Food Products. Westport,
Conn.: AVI Publishing. p 367–404.
Maga JA. 1994. Umami flavour of meat. In: Shahidi F, editor. Flavour of meat and meat products.
London: Blackie Academic & Professional. p 98–115.
Nakamura T, Toyomizu M, Sasaki T. 1976. Discoloration reaction of dimer from autoxidized methyl
linoleate with lysine. Nippon Suisan Gakkaishi 42:777–82.
Ogasawara M, Yamada Y, Egi M. 2006. Taste enhancer from the long-term ripening of miso (soybean
paste). Food Chem 99:736–41.
Ogasawara M. 2003. The aspect of “koku” in the natural seasoning industry. Koryo 217:113–8.
Ottinger H, Hofmann T. 2003. Identification of the taste enhancer alapyridaine in beef broth and
evaluation of its sensory impact by taste reconstitution experiments. J Agric Food Chem
51:6791–6.
Pokorny J. 1981. Browning from lipid-protein interaction. Prog Food Nutr Sci 5:421–8.
Schmitter B, Rihs T. 1989. Evaluation of a macrocombustion method for total nitrogen determination in
feedstuffs. J Agric Food Chem 37:992–4.
Shah AKMA, Tokunaga C, Kurihara H, Takahashi K. 2009. Changes in lipids and their contribution to
the taste of migaki-nishin (dried herring fillet) during drying. Food Chem 115:1011–8.

16
Takiguchi A. 1992. Lipid oxidation and brown discoloration in niboshi during storage at ambient and
low temperatures. Nippon Suisan Gakkaishi 58:489–94.
Takiguchi A. 1999. The effect of lipid oxidation in frozen pulverized niboshi (boiled and dried sardine)
on color browning and formation of free amino acid. Food Sci Technol Res 5:204–9.
Tsai CH, Kong MS, Pan BS. 1991. Water activity and temperature effects on nonenzymatic browning
of amino acids in dried squid and simulated model system. J Food Sci 56:665–70.
Ueda Y, Yonemitsu M, Tsubuku T, Sakaguchi M. 1997. Flavor characteristics of glutathione in raw and
cooked foodstuffs. Biosci Biotechnol Biochem 61:1977–80.
Yamaguchi S, Kimizuka A. 1979. Psychometric studies on the taste of monosodium glutamate. In: Filer
Jr. LJ, editor. Glutamic acid. New York: Raven Press. p 35–54.
Yeboah FK, Alli I, Yaylayan VA. 1999. Reactivities of D-glucose and D-fructose during glycation of
bovine serum albumin. J Agric Food Chem 47:3164–72.

17
Figure Captions
Figure 1 – Changes in extractive nitrogen and peptides of migaki-nishin during drying. The values
represent means of triplicates ± SD. abc Means with different letters in each line indicate significant
differences (P < 0.05).
Figure 2 – Gel filtration chromatograms of water-soluble extracts from migaki-nishin during drying.
Figure 3 – Changes in color components and browning intensity of migaki-nishin during drying. The
values represent means of triplicates ± SD. abc Means with different letters in each line indicate
significant differences (P < 0.05).
Figure 4 – Gel filtration chromatograms of water-soluble extracts in migaki-nishin during drying.
Figure 5 – Changes in available lysine and free amino groups of migaki-nishin during drying. The
values represent means of triplicates ± SD. abc Means with different letters in each line indicate
significant differences (P < 0.05).
Figure 6 – Relationships between drying time and perceived taste or flavor intensity of water-soluble
extracts in mentsuyu. Taste or flavor intensity was scored on a 7-point scale where 3 points were
assigned to the control (mentsuyu). Bars represent mean ± SD (n = 5).
18
Table 1 – Changes in proximate compositiona (% fresh matter basis) of migaki-nishin during
drying.
Drying time (days) Moisture Crude protein Total lipid Ash
2 59.61 ± 1.54b 21.64 ± 0.60f 16.50 ±0.67e 1.38 ± 0.19e
4 45.41 ± 1.31c 29.46 ± 1.16e 21.75 ± 1.17d 2.01 ± 0.05d
6 39.33 ± 3.77d 32.86 ± 0.69d 24.50 ± 0.89c 2.41 ± 0.13c
8 34.01 ± 3.58e 35.47 ± 0.65c 27.20 ± 0.99b 2.49 ± 0.05c
10 31.37 ± 1.23e 37.36 ± 0.35b 26.80 ± 0.44b 2.95 ± 0.11b
a Each value is expressed as mean ± SD (n =3). Means with different superscripts within a column are
significantly different (P < 0.05).

19
Table 2 – Changes in free amino acid compositionA (mg/100 g dry matter) of migaki-nishin
during drying.
Amino acid Drying time (days)
2 4 6 8 10
Aspartic acid 5.88 ± 1.30b 11.04 ± 1.33a 4.13 ± 1.07b 4.54 ± 1.60b 4.76 ± 1.86b
Threonine 19.86 ± 1.09bc 21.85 ± 0.89b 26.97 ± 0.24a 18.43 ± 2.90c 18.57 ± 2.40bc
Serine 19.95 ± 1.82c 38.07 ± 1.50a 25.50 ± 0.60b 15.84 ± 2.96d 16.26 ± 3.26cd
Glutamic acid 12.22 ± 0.43d 30.89 ± 1.30b 20.33 ± 1.90c 24.14 ± 4.26c 64.50 ± 1.37a
Glycine 179.41 ± 5.85d 236.74 ± 7.74b 185.68 ± 5.27d 253.10 ± 9.91a 211.98 ± 3.78c
Alanine 149.72 ± 7.16d 281.96 ± 6.97b 217.33 ± 12.88c 287.33 ± 21.28b 448.26 ± 18.65a
Valine 15.00 ± 0.69d 17.12 ± 0.23c 18.18 ± 0.85c 23.05 ±1.42b 45.92 ± 1.66a
Cystine ND ND ND ND ND
Methionine 7.87 ± 0.68c 9.72 ± 0.87c 9.57 ± 0.37c 12.52 ± 1.69b 16.18 ± 1.29a
Isoleucine 7.20 ± 0.28c 8.68 ± 0.34bc 8.00 ± 0.90c 10.10 ± 1.14b 23.31 ± 1.51a
Leucine 15.62 ± 0.47d 17.92 ± 0.29c 16.49 ± 0.79cd 21.96 ± 1.61b 47.73 ± 1.74a
Tyrosine 4.91 ± 0.48c 6.44 ± 1.03b 6.38 ± 0.97b 7.45 ± 0.53b 18.69 ± 0.20a
Phenylalanine 5.27 ± 0.40c 7.01 ± 0.70bc 7.75 ± 0.53b 8.54 ± 0.93b 26.49 ± 2.60a
Histidine 61.53 ± 0.49b 43.22 ± 2.83c 55.07 ± 7.06b 62.49 ± 4.85b 73.90 ± 7.18a
Lysine 187.77 ± 7.32b 133.00 ± 7.61d 235.62 ± 2.62a 103.13 ± 2.90e 146.55 ± 3.59c
Arginine 9.39 ± 0.68b 9.89 ± 1.31ab 10.49 ± 0.96ab 6.24 ± 1.92c 11.98 ± 1.28a
Hydroxyproline ND ND ND ND ND
Proline 9.93 ± 0.64d 14.73 ± 1.88c 16.95 ± 0.70bc 17.69 ± 1.23b 36.28 ± 2.04a
Total 711.51 ± 18.23c 888.28 ± 22.78b 864.44 ± 11.81b 876.56 ± 17.68b 1211.36 ± 2.74a
A Each value is expressed as mean ± SD (n = 3). Means with different superscripts within a row are
significantly different (P < 0.05).
ND = not detected.

12.0
12.5
13.0
13.5
14.0
14.5
15.0
2 4 6 8 101.01.52.02.53.03.54.04.55.0Extractive nitrogen
Peptides
Pept
ides
(g/1
00 g
dry
mat
ter)
Extra
ctiv
e ni
troge
n (%
)
Drying time (days)
aa
b bc
aab
bcc c
Figure 1 (Shah and others)

2 days 4 days 10 days6 days 8 days
1
2
34
Retention time (min)
Abso
rban
ce a
t 214
nm
Figure 2 (Shah and others)

05
10152025303540
2 4 6 8 10Drying time (days)
0.00
0.02
0.04
0.06
0.08
0.10
L* a* b* A 420 nm
Valu
es
Brow
ning
(A42
0/g)
a
b b bcc
aab
b
cc
ccbba aaaa
a
Figure 3 (Shah and others)

0 300 600 900 1200 1500 1800s
0
5
2 days
0 5 10 15 20 25 30 0 300 600 900 1200 1500 1800s
0
5
4 days
0 5 10 15 20 25 30
0 300 600 900 1200 1500 1800s
0
5
6 days
0 5 10 15 20 25 30 0 300 600 900 1200 1500 1800s
0
5
8 days
0 5 10 15 20 25 30 0 300 600 900 1200 1500 1800s
0
5
10 days
0 5 10 15 20 25 30
Retention time (min)
Fluo
resc
ence
inte
nsity
at
λex
350
nm
and
λem
440
nm
Figure 4 (Shah and others)

1.0
2.0
3.0
4.0
5.0
6.0
7.0
8.0
2 4 6 8 10100
150
200
250
300
350Available lysineFree amino groups
Avai
labl
e ly
sine
(g/1
6 g
of N
)
µMle
ucin
e/g
dry
mat
ter
Drying time (days)
a aa
c c
abb
bc c
Figure 5 (Shah and others)
Sal
tines
s in
tens
ity
1234567
2 4 6 8 10Drying time (days)
Y = 3.58 – 0.03XR2 = 0.29
1234567
2 4 6 8 10
Um
ami i
nten
sity
Drying time (days)
Y = 3.48 + 0.08XR2 = 0.96
Thic
knes
s in
tens
ity
1234567
2 4 6 8 10Drying time (days)
Y = 3.09 + 0.23XR2 = 0.95
1234567
2 4 6 8 10Drying time (days)
Con
tinui
ty in
tens
ity
Y = 2.76 + 0.26XR2 = 0.96
Mou
thfu
lnes
s in
tens
ity
1234567
2 4 6 8 10Drying time (days)
Y = 3.17 + 0.19XR2 = 0.86
Figure 6 (Shah and others)