chamber building - mccibd.org · fy17 stood 12.9 per cent lower at tk.13,752 crore, compared to...
TRANSCRIPT


Chamber Building122-124 Motijheel, C/A, Dhaka-1000, Bangladesh
Phone : +880-2-9565208-10 & +880-2-9574129-31 (PABX), Fax : +880-2-9565211-12
Email : [email protected], [email protected], Web : www.mccibd.org
VISION
MISSION
VALUES
CORE COMPETENCIES - ORGANISATION
CORE COMPETENCIES – PEOPLE
Be the leading voice serving responsible business
Become the leading Chamber for providing research and analysis related to business in Bangladesh
Fairness
Research based Policy Advocacy
Professional
Team Player
Integrity
Networking
Innovative
Proactive
Respect
Business Intelligence
Adaptable
Communication & Interpersonal Skills
Equal Opportunity
Attract quality membership, representative of a cross section of business
Effectively respond to changing business environment
Collaborate with local and international institutions
Engage and communicate regularly with our stakeholders
Promote best practices that benefit business and society
DISCLAIMERThe Quarterly Review is published for private circulation by Metropolitan Chamber of Commerce and Industry, Dhaka. The Chamber assumes no responsibility for the correctness of items quoted in the publication although every effort is made to give information from sources believed to be reliable.
CHAMBER COMMITTEE FOR 2017
PRESIDENT
VICE-PRESIDENT
SECRETARY-GENERAL
MEMBERS
MS. NIHAD KABIR
MR. GOLAM MAINUDDIN
MR. M. ANIS UD DOWLA
MR. TABITH M. AWAL
MR. TAPAN CHOWDHURY
MS. SIMEEN HOSSAIN
MR. A.K.M. RAFIQUL ISLAM, FCA
MR. RUBAIYAT JAMIL
MR. HABIBULLAH N. KARIM
MR. HASAN MAHMOOD, FCA
MR. SYED NASIM MANZUR
MR. FRANCOIS DE MARICOURT
MR. FAROOQ AHMED
MR. SYED TAREQUE MD. ALI

Contents
QUARTERLY REVIEWJuly-September 2017 (Q1 of FY18)
Executive Summary 3
Remittances 17
Capital Market 13
Exchange Rate 20
Industry 7
Services Sector 9
Foreign Direct Investment (FDI) 18
Exports 15
Overseas Employment Situation 21
Chamber’s Projection on Some Selected Economic Indicators 23
Agriculture 5
Foreign Aid 18
Public Finance 14
Foreign Exchange Reserves 20
Monetary and Credit Developments 10
Balance of Payments 19
Imports 16
Price Situation 21
Concluding Observations 24

Quarterly Review | 3
July-September 2017 (Q1 of FY18)
EXECUTIVE SUMMARYGeneral
Bangladesh’s economy is progressing well, but below its true potential, as infrastructure bottlenecks and shortage of power and energy generally prevent its performance at full capacity. However, the major macroeconomic indicators like per capita income, foreign currency reserve, import and export, and foreign direct investment show a strong positive trend alongside surpassing of the FY17 revenue collection target compared to the previous fiscal year (FY16).
The country achieved a stable average annual growth of 6.16 per cent during the last 12 years (2004-2015). According to BBS estimate, the economy grew at 7.24 per cent in FY17, which is 0.13 percentage point above the GDP growth of 7.11 per cent achieved in the previous fiscal (FY16). During the Seventh Five Year Plan (SFYP) period, Bangladesh plans to achieve 7.40 per cent GDP growth per annum and reach its goal of becoming a middle-income country by 2021. To achieve this target, it will need to significantly increase the rate of export growth, generate more investments, improve the overall infrastructure, in particular its roads, railways and port facilities, increase power and gas production, and remove all other infrastructure bottlenecks.
Agriculture
The agriculture sector employed about 47.5 per cent of Bangladesh’s total labour force and accounted for about 14.79 per cent of GDP in the just concluded fiscal year (FY17). Due to strong government support in terms of timely availability of inputs and finance, the sector recorded a higher growth of 3.40 per cent in
FY17 compared to 2.79 per cent in FY16.
Industry
The industry sector growth decelerated to 10.50 per cent in FY17 from the previous year’s 11.09 per cent. However, the share of the industry sector in GDP increased by 0.94 percentage point to 32.48 per cent in FY17 from 31.54 per cent in FY16.
Manufacturing sub-sector grew by 10.96 per cent in FY17, 0.73 percentage point lower than the previous fiscal year’s 11.69 per cent. The large and medium scale industries sub-sector grew by 11.32 per cent in FY17, compared to 12.26 per cent in FY16. The small scale manufacturing industries performed better than in the previous fiscal, growing by 9.21 per cent in FY17 as against 9.06
per cent in FY16.
Construction
The construction sub-sector performed better in FY17, growing at 9.32 per cent during the fiscal, compared to 8.56 per cent in FY16. The real estate, renting and business activities also performed better in the period when it marked a 4.78 per cent growth
compared to 4.47 per cent in FY16.
Power
Frequency of power outages across the country has been on the rise in recent weeks despite a substantial increase in the country’s overall electricity generation. Unofficial estimate puts the current demand for electricity at around 10,000 mw. The maximum generation in 2017 was 9,507 mw on 18 October 2017, which was also the maximum generation in BPDB’s history. In October 2017, total installed capacity rose to 13,621 mw, and derated/present capacity to 12,922 mw, but production remained low because of gas shortage and also because of shutting down of some power
stations due to maintenance.
Services
The services sector performed better in FY17 compared to the previous fiscal. Despite the sluggish investment situation prevailing in the quarter under review, the services sector growth increased by 0.25 percentage point to 6.50 per cent in FY17 from 6.25 per cent in FY16. Notable among the well-performing services sub-sectors in FY17 were wholesale & retail trade; hotel & restaurants; transport, storage & communication; real estate, renting & business activities; construction; and community, social
& personal services.
Money and Capital Market
Broad money (M2) grew by 11.73 per cent at the end of August 2017 compared with the 14.59 per cent growth achieved at the end of August 2016. Domestic credit, on the other hand, recorded 13.66 per cent growth at the end of August 2017, while a lower rate of 12.94 per cent growth was recorded at the end of August 2016.
Among components of domestic credit, private sector credit registered a growth of 17.84 per cent during the period between August 2016 and August 2017, compared with a relatively lower growth of 16.21 per cent during the period between August 2015 and August 2016. Public sector credit, on the other hand, recorded a negative growth of 8.08 per cent at the end of August 2017, compared with the decrease of 1.48 per cent at the end of August 2016. Within public sector credit, however, credit to government (net) recorded a negative growth of 10.62 per cent, and credit to other public sector recorded a growth of 9.82 per cent, during the period.
Total liquid assets of scheduled banks stood at Tk.253,324 crore as of end August 2017 compared with Tk.267,194 crore as of end June 2017. The minimum required liquid asset of the scheduled banks was Tk.166,961 crore as of end August 2017.
Interest rates on bank deposits increased further in August 2017 following higher credit growth particularly in the private sector. The interest rate on deposits rose to 4.93 per cent in August from 4.89 per cent in July 2017. On the other hand, the interest rate on
July-September 2017 (Q1 of FY18)
Quarterly Review | 4
lending decreased to 9.46 per cent in August 2017 from 9.51 per cent in July 2017. Overall spread, however, decreased only slightly to 4.53 per cent in August 2017 from 4.62 per cent in the previous month as the banks slashed their interest rates on lending more than what they paid to their depositors.
The disbursement of industrial term loans during April-June of FY17 stood 12.9 per cent lower at Tk.13,752 crore, compared to Tk.15,783 crore during the immediate previous quarter (January-March) of FY17. However, the recovery of industrial term loans also decreased by 21.3 per cent to Tk.11,446 crore during April-June of FY17, compared to Tk.14,547 crore in the previous quarter.
The disbursement of agricultural credit and non-farm rural credit by banks increased by 22.99 per cent to Tk.4,235.74 crore in Q1 of FY18 from Tk.3,443.85 crore in the corresponding period of the previous fiscal. The improvement in disbursement was partly the result of strong monitoring by the BB and also holding of surplus liquidity by banks due to the dull business situation. The recovery also increased by 28.83 per cent to Tk.4,563.81 crore in Q1 of FY18 from Tk.3,542.39 crore in Q1 of FY17.
Investor participation significantly increased in the country’s capital market in the first quarter (Q1) of the present fiscal year (FY18). Both Dhaka and Chittagong Stock Exchanges witnessed some increase both in the key index and turnover.
Public Finance
During July-August of FY18, the NBR’s tax revenue collection was Tk.27,161 crore, which was 23.4 per cent higher than the collection of Tk.22,015 crore in the corresponding period of FY17, thanks to a boost in receipts in August 2017. NBR tax revenue collection in August 2017 stood at Tk.14,972 crore which was higher by Tk.2,783 crore or 22.8 per cent against the collection of Tk.12,189 crore during the previous month of the same fiscal (July 2017).
The implementation rate of the ADP in the quarter under review was higher than in the same quarter of the previous year. In July-September of FY18, 57 ministries and divisions could spend Tk.167.55 billion or 10.21 per cent of the total allocation of Tk.1,640.85 billion. In the corresponding period of the last fiscal, Tk.107.89 billion was spent, which was 8.75 per cent of the total outlays (Tk.1,233.46 billion).
Export and Import
Export earnings (merchandise) in the first quarter of the current fiscal year (Q1 of FY18) grew by 7.23 per cent to US$8.663 billion from US$8.079 billion in the corresponding quarter of the previous fiscal year. The export earnings, however, fell short of the strategic target (US$8.916 billion) by 2.84 per cent.
Import payments (C&F) in the first two months (July-August) of FY18 stood at US$9,027 million, which is 33.95 per cent higher than import payments during the corresponding months of FY17.
The value of Imports increased mainly because of a surge in rice import, increase in the prices of crude oil in the international market and substantial depreciation of the taka against all major currencies.
Remittances
Remittance inflows in Q1 of FY18 increased by 4.37 per cent to US$3.389 billion compared to US$3.247 billion in the corresponding quarter of the previous fiscal year.
Foreign Aid
The disbursement of foreign aid in July-September of FY18 increased significantly by 71.1 per cent to US$857.10 million from US$500.95 million in the same period of the previous fiscal year mainly due to Japan’s huge contribution of US$305.78 million. On the other hand, the commitment of foreign aid was US$941.51 million in July-September of FY18. In the same period last fiscal, they confirmed US$12.03 billion worth of assistance where Russia alone signed a US$11.38 billion-loan deal with Bangladesh for bankrolling the Rooppur Nuclear Power Plant project.
Foreign Direct Investment (FDI)
In July-August of FY18, the net FDI increased by 9.59 per cent to US$320 million from US$2928 million in the same period of FY17.
Balance of Payments (BoP)
The trade deficit increased more than three times to US$1.810 billion in the first two months of FY18 due to lower export earnings, and higher import payments. The deficit in trade in services, too, widened in July-August of FY18. Because of higher trade and services deficit and the fall in primary income, the current account balance turned into a deficit in July-August of in FY18. The financial account, however, posted a sizeable surplus during July-August of FY18 - US$416 million, because of the higher inflow of foreign investment and comparatively low pressure on external debt repayment. The net inflow of FDI increased by 9.59 per cent to US$320 million in July-August of FY18. The overall balance posted a deficit of US$206 million in July-August against a surplus amount of US$1.176 billion during the corresponding
months of FY17.
Exchange Rate and Foreign Exchange Reserve
Between end-June 2017 and end-September 2017, the Taka depreciated by 0.25 per cent in terms of US dollar. Gross foreign exchange reserves stood at US$32.817 billion (with ACU liability of US$0.56 billion) as of end September 2017, as compared to US$33.596 billion (with ACU liability of US$1.19 billion) as of end August 2017. The reserve (less ACU liability) is equivalent to import liability of 7.85 months.

Quarterly Review | 5
July-September 2017 (Q1 of FY18)
Domestic Production The target of domestic food grains (rice and wheat) production for FY18 was set by the Department of Agricultural Extension (DAE) at 37.51 million metric tons (mmt), which is 2.51 per cent higher than that of FY17 (36.59 mmt). This target is also 5.10 per cent higher than the actual production in FY17 (35.69 mmt). The crop-specific production targets in FY18 for aman, aus, boro and wheat are 14.08 mmt, 2.40 mmt, 19.56 mmt, and 1.47 mmt, respectively.
1.1 Food Situation
Inflation
In September 2017, the general point to point inflation increased by 0.23 percentage point to 6.12 per cent from 5.89 per cent in the previous month (August). The inflation in September hit the two-year-high mainly due to an increase in the prices of some food and essential items.
The food inflation increased by 0.55 percentage point to 7.87 per cent in September 2017 from 7.32 per cent in August 2017. This was the highest in 38 months on the back of the massive production loss of the staple rice. Non-food inflation, however, fell by 0.31 percentage point to 3.44 per cent in September 2017 from 3.75 per cent in the previous month (August).
A comparison of inflation data for urban and rural areas shows that the inflation rate in September of FY18 was higher in rural areas than in urban areas.
Data on agricultural production for the first quarter of the present fiscal (Q1 of FY18) is yet to be available because the harvesting of the three major crops – aman, aus and boro - will be spread over the coming months of the fiscal. The sector employed about 47.5 per cent of Bangladesh’s total labour force and accounted for about 14.79 per cent of GDP in FY17. Due to strong government support in terms of timely availability of inputs and finance, the sector recorded a higher growth of 3.40 per cent in FY17 compared to 2.79 per cent in FY16. However, production of crops fell in FY17 due to crop losses in the back-to-back disasters – flashfloods in haor areas and Chalan Beel in Natore, intense rainfall in almost all parts of the country and fungal disease blast attacks.
1.0 AGRICULTURE
Actual production in FY17 fell 2.46 per cent short of the target for the year due to early floods in the haor areas. Also, aus and aman production in FY18 suffered a setback due to heavy floods in the northwestern region of the county. However, according to DAE, the setback has largely been overcome by replantation through supply of seedlings and other support services to the farmers in the affected areas. The latest monitoring report of the DAE shows that the area achieved for aus and aman plantation was 10.92 lakh and 57.74 lakh hectares, respectively, which marginally exceeded the target area for the respective crops. Production will depend on yield performance of these two crops.
Food Grains Import As of 12 October 2017, about 328 thousand metric tons (tmt) of rice was imported by the public sector. The private sector imported about 822.20 tmt in that period. Over the same period of last year, there was no rice import by the public sector, while the private sector import of rice was 2.50 tmt. Regarding other food grains, however, up to the fortnight ending 28 October 2017, about 1,785.50 tmt of wheat was imported by the private sector, while no wheat was imported by the public sector. Over the same period of the previous year, a total of 1,445.30 tmt of wheat was imported by the private sector, and the public sector imported about 80.70 tmt.
Domestic Procurement
In order to provide price incentive to farmers, boro procurement started from 2 May 2017 and continued up to 31 August 2017, when the procurement date was extended till 31 October 2017. The procurement target was set at 0.70 mmt of paddy at Tk.24.00 per kg, 0.70 mmt of parboiled rice at Tk.34.00 per kg and 0.10 mmt of white rice at Tk.33.00 per kg. As of 12 October 2017, about 275 tmt of boro rice was procured from the domestic market and a further 291.20 tmt was contracted.
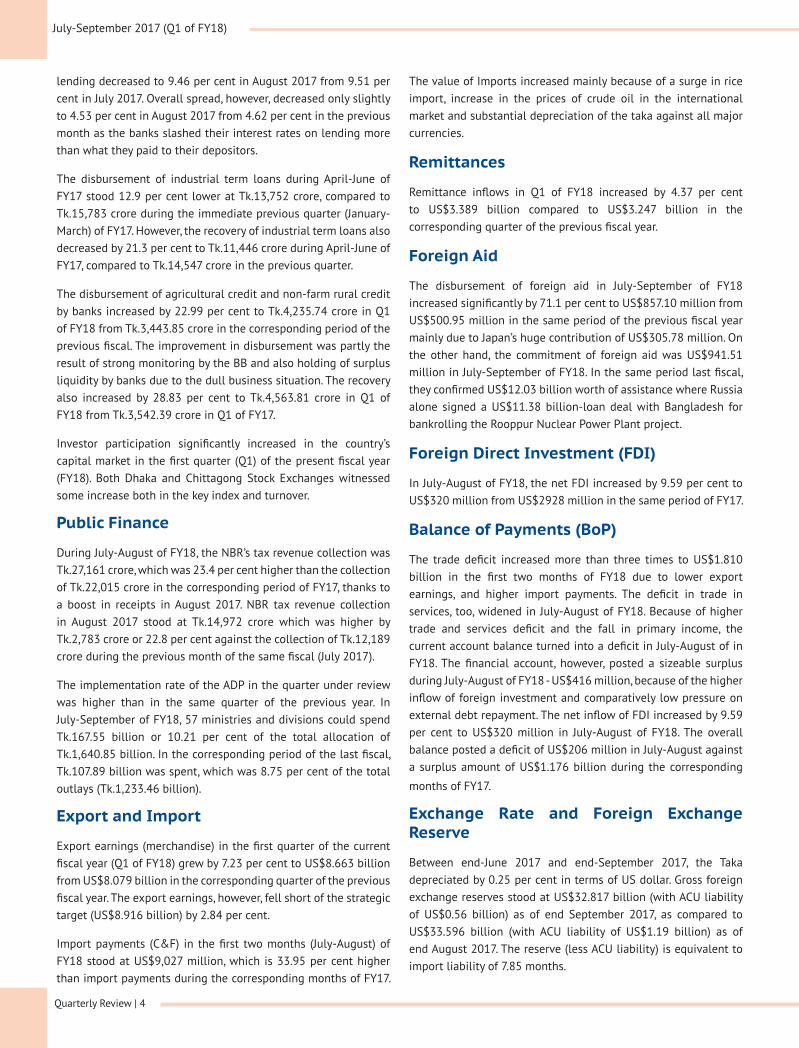
Public Distribution
The government has enhanced its efforts to ease the hardship of poor households by distributing subsidized grains through public food distribution system (PFDS), mainly open market sale (OMS)
July-September 2017 (Q1 of FY18)
Quarterly Review | 6
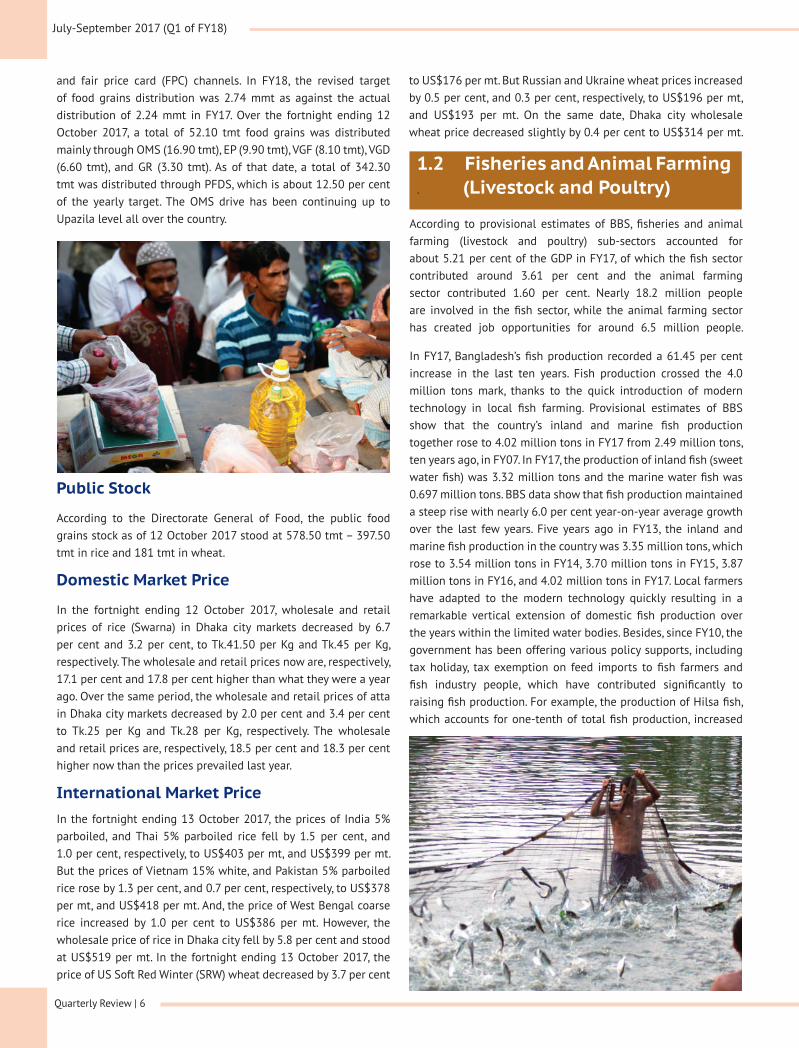
1.2 Fisheries and Animal Farming . (Livestock and Poultry)
According to provisional estimates of BBS, fisheries and animal farming (livestock and poultry) sub-sectors accounted for about 5.21 per cent of the GDP in FY17, of which the fish sector contributed around 3.61 per cent and the animal farming sector contributed 1.60 per cent. Nearly 18.2 million people are involved in the fish sector, while the animal farming sector has created job opportunities for around 6.5 million people.
In FY17, Bangladesh’s fish production recorded a 61.45 per cent increase in the last ten years. Fish production crossed the 4.0 million tons mark, thanks to the quick introduction of modern technology in local fish farming. Provisional estimates of BBS show that the country’s inland and marine fish production together rose to 4.02 million tons in FY17 from 2.49 million tons, ten years ago, in FY07. In FY17, the production of inland fish (sweet water fish) was 3.32 million tons and the marine water fish was 0.697 million tons. BBS data show that fish production maintained a steep rise with nearly 6.0 per cent year-on-year average growth over the last few years. Five years ago in FY13, the inland and marine fish production in the country was 3.35 million tons, which rose to 3.54 million tons in FY14, 3.70 million tons in FY15, 3.87 million tons in FY16, and 4.02 million tons in FY17. Local farmers have adapted to the modern technology quickly resulting in a remarkable vertical extension of domestic fish production over the years within the limited water bodies. Besides, since FY10, the government has been offering various policy supports, including tax holiday, tax exemption on feed imports to fish farmers and fish industry people, which have contributed significantly to raising fish production. For example, the production of Hilsa fish, which accounts for one-tenth of total fish production, increased
and fair price card (FPC) channels. In FY18, the revised target of food grains distribution was 2.74 mmt as against the actual distribution of 2.24 mmt in FY17. Over the fortnight ending 12 October 2017, a total of 52.10 tmt food grains was distributed mainly through OMS (16.90 tmt), EP (9.90 tmt), VGF (8.10 tmt), VGD (6.60 tmt), and GR (3.30 tmt). As of that date, a total of 342.30 tmt was distributed through PFDS, which is about 12.50 per cent of the yearly target. The OMS drive has been continuing up to Upazila level all over the country.
Public Stock
According to the Directorate General of Food, the public food grains stock as of 12 October 2017 stood at 578.50 tmt – 397.50 tmt in rice and 181 tmt in wheat.
Domestic Market Price
In the fortnight ending 12 October 2017, wholesale and retail prices of rice (Swarna) in Dhaka city markets decreased by 6.7 per cent and 3.2 per cent, to Tk.41.50 per Kg and Tk.45 per Kg, respectively. The wholesale and retail prices now are, respectively, 17.1 per cent and 17.8 per cent higher than what they were a year ago. Over the same period, the wholesale and retail prices of atta in Dhaka city markets decreased by 2.0 per cent and 3.4 per cent to Tk.25 per Kg and Tk.28 per Kg, respectively. The wholesale and retail prices are, respectively, 18.5 per cent and 18.3 per cent higher now than the prices prevailed last year.
International Market PriceIn the fortnight ending 13 October 2017, the prices of India 5% parboiled, and Thai 5% parboiled rice fell by 1.5 per cent, and 1.0 per cent, respectively, to US$403 per mt, and US$399 per mt. But the prices of Vietnam 15% white, and Pakistan 5% parboiled rice rose by 1.3 per cent, and 0.7 per cent, respectively, to US$378 per mt, and US$418 per mt. And, the price of West Bengal coarse rice increased by 1.0 per cent to US$386 per mt. However, the wholesale price of rice in Dhaka city fell by 5.8 per cent and stood at US$519 per mt. In the fortnight ending 13 October 2017, the price of US Soft Red Winter (SRW) wheat decreased by 3.7 per cent
to US$176 per mt. But Russian and Ukraine wheat prices increased by 0.5 per cent, and 0.3 per cent, respectively, to US$196 per mt, and US$193 per mt. On the same date, Dhaka city wholesale wheat price decreased slightly by 0.4 per cent to US$314 per mt.
Quarterly Review | 7
July-September 2017 (Q1 of FY18)
2.0 INDUSTRY
2.1 Manufacturing Industries
Data on the country’s industry sector are yet to be available for the quarter under review. However, the sector grew by 10.50 per cent in the immediate past fiscal (FY17), compared to 11.09 per cent in FY16. Besides, the share of the industry sector in GDP increased by 0.94 percentage point to 32.48 per cent in FY17 from 31.54 per cent in the previous fiscal year.
There are 62.1 million people in the country’s total workforce, employed in sectors like garments, agriculture, manufacturing and the services sectors (Quarterly Labour Force Survey, 2015-16). In the garments sector alone, the number of workers at present is 4.4 million. Bangladesh’s competitive advantage lies in its young workforce. The average age of most of the workers is below 40, which is a dividend for the country.
The manufacturing sub-sector grew by 10.96 per cent in FY17, compared to the previous fiscal year’s 11.69 per cent. The large and medium scale industries sub-sector grew by 11.32 per cent in FY17, compared to 12.26 per cent in FY16. The small scale manufacturing industries performed better than the previous fiscal, grew by 9.21 per cent in FY17 from 9.06 per cent.
Data on manufacturing industries are not available beyond April 2017. During July-April of FY17, the general index of industrial production of medium and large scale industries (Base: 2005-06=100) rose to 287.08 points, registering a 9.91 per cent increase over 261.20 points during the corresponding period of FY16. According to industry sources, industrial activity went down due to disruption in the supply of power and gas in some industrial units and weaker consumer confidence caused by slower business activity. Among medium and large-scale manufacturing industries, general indices that recorded an increase in July-April of FY17 were: leather & related products (51.34%), non-metalic mineral products (32.46%), pharmaceuticals & medicinal chemical (28.38%), textile (23.23%), fabricated metal products except
to 0.5 million tons in FY17 from 0.4 million tons a year ago. The Department of Fisheries (DoF) has a target to increase the per capita fish intake to 60 grams by 2021 from the current level of 56 grams. Moreover, the DoF forecasts that fish production will cross the target of 4.2 million tons by 2021 as modern technology is helping higher production in the country’s limited water bodies.
Bangladesh, one of the largest fish producing countries in the world, meets a major portion of protein by domestic fish production. According to the United Nations’ Food and Agriculture Organisation (FAO), Bangladesh is the fourth largest inland fish producer in the world after China, India and Myanmar. According to the DoF, Bangladesh has become almost self-sufficient in fish production, which will help overcome the malnutrition problem of the younger generation. The DoF is implementing different programs for increasing export earning, alleviating poverty and cutting animal protein deficiency from the fisheries sources. It also works to increase production in internal open water, close water, and extended tidal water bodies across the country. Besides, the government has formulated the Fisheries Resource Plan (2009-2021) to fulfill the target of achieving food sufficiency, employment generation and poverty alleviation for a prosperous future of the country under the Vision 2021. Moreover, the formulation of an action plan is underway to achieve the sustainable development goals (SDGs). According to a recent FAO forecast, Bangladesh would be the top nation among four other fish farming countries in the world by 2022 through successful fish farming.
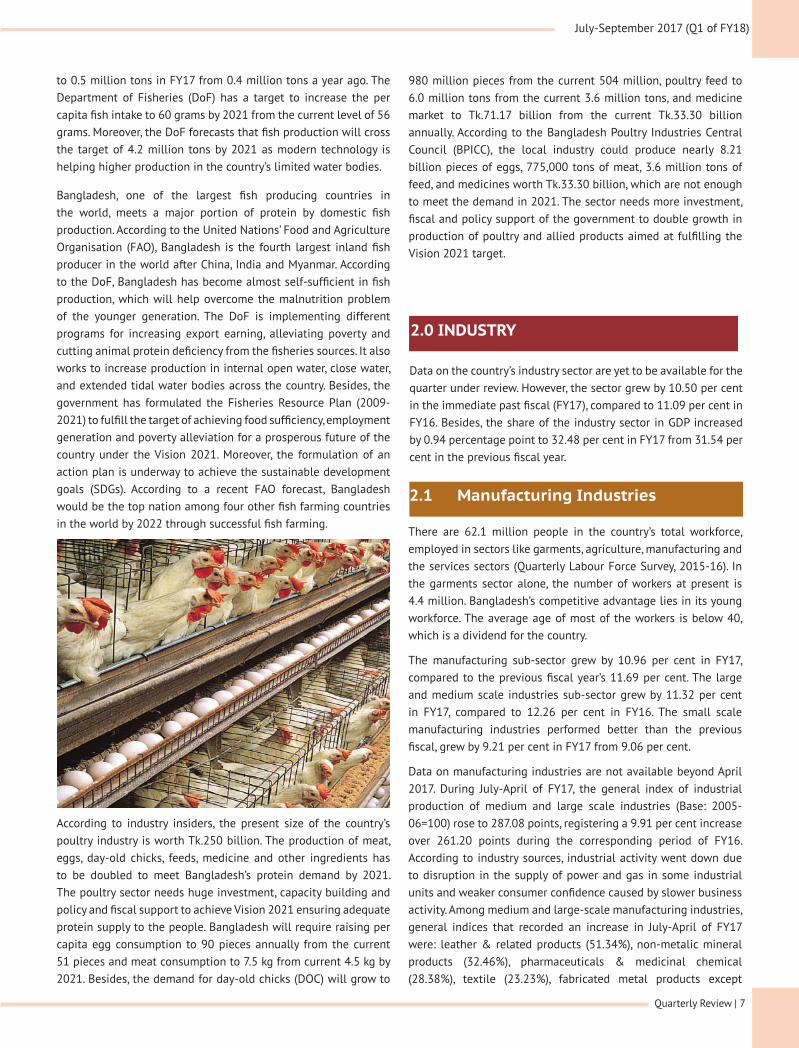
According to industry insiders, the present size of the country’s poultry industry is worth Tk.250 billion. The production of meat, eggs, day-old chicks, feeds, medicine and other ingredients has to be doubled to meet Bangladesh’s protein demand by 2021. The poultry sector needs huge investment, capacity building and policy and fiscal support to achieve Vision 2021 ensuring adequate protein supply to the people. Bangladesh will require raising per capita egg consumption to 90 pieces annually from the current 51 pieces and meat consumption to 7.5 kg from current 4.5 kg by 2021. Besides, the demand for day-old chicks (DOC) will grow to
980 million pieces from the current 504 million, poultry feed to 6.0 million tons from the current 3.6 million tons, and medicine market to Tk.71.17 billion from the current Tk.33.30 billion annually. According to the Bangladesh Poultry Industries Central Council (BPICC), the local industry could produce nearly 8.21 billion pieces of eggs, 775,000 tons of meat, 3.6 million tons of feed, and medicines worth Tk.33.30 billion, which are not enough to meet the demand in 2021. The sector needs more investment, fiscal and policy support of the government to double growth in production of poultry and allied products aimed at fulfilling the Vision 2021 target.
July-September 2017 (Q1 of FY18)
Quarterly Review | 8
Frequency of power outages across the country has been on the rise in recent weeks despite a substantial increase in the country’s overall electricity generation. Businesses were bearing the brunt of frequent load shedding while industrial output was being hampered and residents were suffering from the scorching heat during the quarter under review. As of 29 September 2017, total actual generation during day peak hours was 5,548 megawatt (mw) and during evening peak hours it was 8,187 mw. Unofficial estimate puts the current demand for electricity at around 10,000 mw. The maximum generation in 2017 was 9,507 mw on 18 October 2017 and it was also the maximum generation in BPDB’s history. In October 2017, total installed capacity rose to 13,621 mw, and derated/present capacity rose to 12,922 mw, but production remained low because of gas shortage and also because of shutting down of some power stations for maintenance.
2.3 Power
machinery (22.53%), chemicals & chemical products (11.99%), tobacco products (7.35), and wearing apparel (3.11%). On the other hand, there was some decrease in the indices of basic metals (17.09%), and food products (3.90%).
2.2 Construction
Data on the country’s construction sector are not available for Q1 of FY18. However, according to BBS, the sector grew by 9.32 per cent in FY17, compared to 8.56 per cent in FY16. The real estate, renting and business activities also performed better in FY17 when it marked a 4.78 per cent growth compared to 4.47 per cent in FY16. In spite of the tremendous potential of the construction and real estate sector, factors like land value distortion, and absence of secondary property market, asset securitization and sale of mortgages, and backward linkage industries such as cement, ceramic, brick manufacturing industries, etc. adversely affected its development.
In recent times, however, real estate business saw an improvement, thanks to property price corrections, falling interest on home loans and return of political stability. The sector appears to have been recovering in the last few months. An increasing number of customers were placing new bookings. Most of the realtors were selling flats and plots at a low profit margin to maintain their cash flow. The realtors hope that the recent cut in lending rates by banks and financial institutions would help raise the apartment sales further.
On the other hand, the prices of key construction materials, including steel rods and bricks, have marked a significant rise in recent times, triggering anxiety among the realtors. The price of
rods has been constantly increasing for the last several months mainly due to the high cost of raw materials. Moreover, the congestion of cargoes at Chittagong seaport has led to an increase in transport cost. The disruption in gas supply to some steel mills was also responsible for the price hike. As a result, the price of rods increased by a range between Tk.4,000 and Tk.5,000 per tonne in the last three to four months. The 500W grade rods were being sold at a range between Tk.57,500 and Tk.58,000 per tonne recently, which ranged between Tk.52,000 and Tk.53,000 in early June. A surge in the price of raw materials in the global market was another reason for the rod price hike in the local market. Meanwhile, the price of bricks and sand also rose in recent weeks due to the rise in transport cost and other disruptions following the flood. The cement price has, however, remained stable.
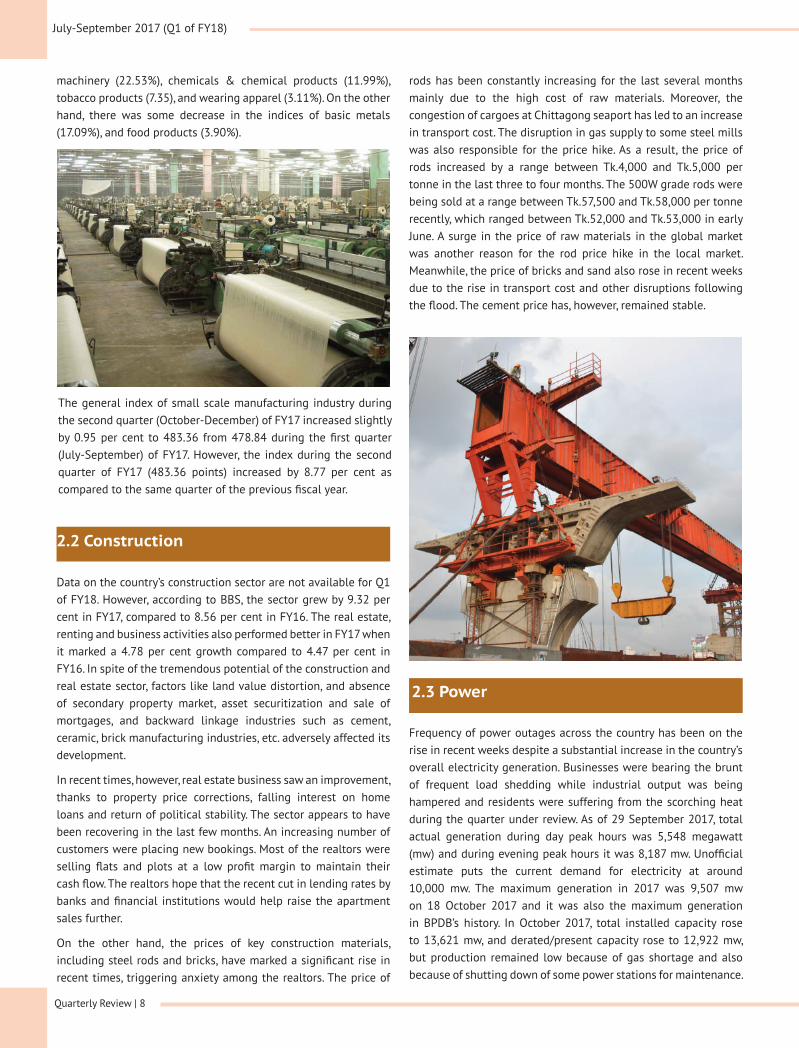
The general index of small scale manufacturing industry during the second quarter (October-December) of FY17 increased slightly by 0.95 per cent to 483.36 from 478.84 during the first quarter (July-September) of FY17. However, the index during the second quarter of FY17 (483.36 points) increased by 8.77 per cent as compared to the same quarter of the previous fiscal year.

Quarterly Review | 9
July-September 2017 (Q1 of FY18)
3.0 SERVICES SECTOR
According to the BPDB website, the 13,621 mw installed capacity of power plants comprised of coal 250 mw (1.84%), gas 8,529 mw (62.62%), HFO 2,794 mw (20.51%), HSD 1,158 mw (8.5%), Hydro 230 mw (1.69%), and imported 660 mw (4.84%).
To produce more power, local conglomerate United Group recently won a build-operate-own (BOO) contract to build another 200 mw furnace oil-fired power plant in Mymensingh. According to the contract, United Group will have to set up the plant within nine months of signing the contract. The plant will run at 80 per cent plant factor with 12 per cent discount factor. To purchase all the electricity produced at the plant over the next 15 years, the government will pay Tk.176.40 billion.
Data on services sector for the first quarter of the present fiscal (Q1 of FY18) is yet to be available. However, in FY17 the sector witnessed, according to BBS, a better performance compared to the previous fiscal. Despite the sluggish investment situation in the country, the growth of services sector increased by 0.25 percentage point to 6.50 per cent in FY17 from 6.25 per cent in FY16. Notable among the well-performing sub-sectors in FY17 are wholesale & retail trade; hotel & restaurants; transport, storage & communication; real estate, renting & business activities; construction; and community, social & personal services.
It is worth noting that the share of the services sector in GDP, which was at its peak at 55.59 per cent in FY06, has been steadily declining thereafter, dropping to 52.73 per cent in FY17. Among the different services sub-sectors, the wholesale & retail trade held the highest share in GDP (13.94%) in FY17 compared to 13.99 per cent in FY16. The GDP shares of certain other sub-sectors in FY17 were: transport, storage & communication 11.25 per cent; community, social & personal services 8.86 per cent; construction 7.39 per cent; real estate, renting & business activities 6.48 per cent; public administration & defence 3.72 per cent; financial intermediations 3.41 per cent; and education 2.48 per cent.
undertaken another project to generate rooftop power from the government’s buildings. The buildings include Uttara Haji Camp, Bangladesh Institute of Bank Management (BIBM) Building and Indoor Stadium in Mirpur. The power distribution companies have initiated such rooftop solar projects as part of the government’s plan to generate 10 per cent electricity by 2020 in line with the United Nations’ Sustainable Development Goals (SDGs). The goal no-7 of the SDGs is to ensure access to green and modern energy for the people. Under the theme, the government has already finalized a national plan to generate 3,168 mw power from renewable energy sources by 2021. Of this, about 1,000 mw of electricity will come from the rooftops of buildings in Dhaka city.
The first commercial project of rooftop solar power generation is expected to produce electricity in the city from June 2018 as Dhaka Power Distribution Company Ltd (DPDC) has awarded a build-own-operate basis (BOO) contract to the Bengal Group to buy electricity from the maiden project at Tk.9.80 per unit. According to DPDC, the rooftop solar project was now in progress and residents were expected to get electricity from June next year according to the schedule. The capacity of the rooftop solar project is 750 kilowatt. Matsaya Bhaban at Ramna, Shikkha Bhaban at Abdul Gani Road, and Shilpakala Acedemy at Segunbaghicha are among the six government buildings which will be brought under the project. The DPDC has arranged the rooftops of these buildings under a long term rent and handed over those to the Bengal Group to set up rooftop solar panels. Many believe that the project will be commercially viable as the commercial rate of electricity tariff is almost the same.
The DPDC has undertaken another project to use its own office and sub-station buildings in the city to generate electricity of another 750 kilowatt in the same way. The DPDC had earlier installed a rooftop plant at Bangladesh Secretariat’s Cabinet Division building on a pilot basis. Besides, DESCO, the power distribution company, operating in north-western and eastern parts of the city, has

July-September 2017 (Q1 of FY18)
Quarterly Review | 10
Total liquid assets of scheduled banks stood lower at Tk.253,324 crore as of end August 2017 compared with Tk.267,194 crore as of end June 2017. The minimum required liquid asset of the scheduled banks was Tk.166,961 crore as of end August 2017 (Table 2).
Table 1: Monetary and Credit Indicators
ParticularsOutstanding Stock (Taka in crore) % Changes in Outstanding Stock
August 2015R August 2016R August 2017P August 2016 over
August 2015August 2017 over August 2016
Total Domestic Credit 709552 801359 910786 12.94 13.66
Credit to Public Sector 131375 129434 118979 (-) 1.48 (-) 8.08
Net Credit to Government Sector 115687 113324 101287 (-) 2.04 (-) 10.62
Credit to Other Public Sector 15688 16110 17692 2.69 9.82
Credit to Private Sector 578177 671925 791807 16.21 17.84
Reserve Money (RM) 151834 182719 230196 20.34 25.98
Broad Money (M2) 805378 922883 1031152 14.59 11.73
Note: P=Provisional; R=Revised Source: Bangladesh Bank
Table 2: Liquidity Position of Scheduled Banks
Notes: P=Provisional; R=Revised; *= SLR does not apply to Specialized banks (except BASIC Bank) as exempted by the government
(Taka in crore)
Bank GroupAs of end June,
2017R As of end August, 2017P
Total Liquid Total Liquid Assets Minimum Required Liquid Assets Excess Liquidity
1 2 3 4 5 (3-4)
State owned banks 109029 98630 50274 48356
Private banks (other than Islamic) 107163 104012 84928 19084
Private banks (Islamic) 29188 28568 22332 6236
Foreign banks 20122 20492 7738 12754
Specialized banks* 1692 1722 1689 33
Total 267194 253324 166961 86363
4.0 MONETARY AND CREDIT DEVELOPMENTS
According to BB data, broad money (M2) grew by 11.73 per cent at the end of August 2017 compared with the 14.59 per cent growth achieved at the end of August 2016. Domestic credit, on the other hand, recorded 13.66 per cent growth at the end of August 2017, while a lower rate of growth of 12.94 per cent was recorded at the end of August 2016.
Among components of domestic credit, private sector credit registered a growth of 17.84 per cent during the period between August 2016 and August 2017, compared with a relatively lower growth of 16.21 per cent during the period between August 2015
Source: Bangladesh Bank
and August 2016. Public sector credit, on the other hand, recorded a negative growth of 8.08 per cent at the end of August 2017, compared with the decrease of 1.48 per cent at the end of August 2016. Within public sector credit, however, credit to government (net) recorded a negative growth of 10.62 per cent, and credit to other public sector recorded a growth of 9.82 per cent, during the period (Table 1).

Quarterly Review | 11
July-September 2017 (Q1 of FY18)
Table 3: Interest Rate (weighted average) movements in FY17 and July-August of FY18
Notes: P=Provisional, R=Revised, NA=Not Available Source: Bangladesh Bank
Month/Quarter Repo Reverse
RepoLending
RateDeposit
RateInterest
Rate Spread
FY17R
July 6.75 4.75 10.32 5.48 4.84
August 6.75 4.75 10.24 5.44 4.80
September 6.75 4.75 10.11 5.39 4.72
October 6.75 4.75 10.03 5.33 4.70
November 6.75 4.75 9.94 5.29 4.65
December 6.75 4.75 9.93 5.22 4.71
January 6.75 4.75 9.85 5.13 4.72
February 6.75 4.75 9.77 5.08 4.69
March 6.75 4.75 9.70 5.01 4.69
April 6.75 4.75 9.62 4.97 4.65
May 6.75 4.75 9.66 4.93 4.73
June 6.75 4.75 9.56 4.84 4.72
FY18P
July 6.75 4.75 9.51 4.89 4.62
August 6.75 4.75 9.46 4.93 4.53
( in per cent )
4.1 Interest Rate Developments
Bangladesh Bank data show that, of the total liquid assets of scheduled banks as of end August 2017, some 4.88 per cent was held in the form of Cash in tills and Balances with Sonali Bank, 24.38 per cent in the form of CRR, 3.43 per cent in the form of Excess Reserves, 2.85 per cent in the form of Balances with Bangladesh Bank in Foreign Currency and the remaining 64.46 per cent in the form of Unencumbered approved securities.
Bangladesh Bank (BB) employs repo, reverse repo, and BB bill rates as policy instruments for influencing financial and real sector prices. Between 1 February 2013 and 13 January 2016, the repo and reverse repo rates remained unchanged at 7.25 per cent and 5.25 per cent, respectively. The rates were lowered down to 6.75 per cent and 4.75 per cent, respectively, with effect from 14 January 2016 (Table 3).
Interest rates on bank deposits increased further in August 2017 following higher credit growth particularly in private sector. The interest rate on deposits rose to 4.93 per cent in August from 4.89 per cent in July 2017 (Table 3). The rising trend in deposit rates recorded in the last couple of months after the containing of fall since January 2015, when weighted average interest rate on deposits was 7.26 per cent. Most banks receive deposits offering higher interest rates to increase their deposit growth more than that of credits, according to BB. Currently, bank deposits recorded slower growth than that of credits as depositors feel discouraged from keeping their money with the banks mainly due to ‘the lowest’ interest rates. On the other hand, the interest rate on lending decreased to 9.46 per cent in August 2017 from 9.51 per cent in July 2017. Overall spread, however, decreased slightly to 4.53 per cent in August 2017 from 4.62 per cent in the previous month as the banks slashed their interest rates on lending more than that of deposits.

July-September 2017 (Q1 of FY18)
Quarterly Review | 12
Data on SME loans are not available for Q1 of FY18. According to BB data, total SME loans by all banks and non-bank financial institutions (NBFIs) increased by 13.88 per cent to Tk.182,706 crore at the end of June 2017 from Tk.160,494 crore at the end of June 2016. The disbursement of SME loans was 23.3 per cent of total loans disbursed by all banks and NBFIs at the end of June 2017 (Table 5).
4.3 SME Loans
Table 5: Outstanding Position of SME Loans (Taka in crore)
Quarter Type of Loans SOBs PBs FBs SBs NBFIs Total
April-June of FY16PTotal LoansSME LoansPercentage
11683729541(+25.3)
465050120891(+26.0)
258811971(+7.6)
222511700(+7.6)
493096391
(+13.0)
679328160494(+23.6)
July-September of FY17PTotal LoansSME LoansPercentage
11906129685(+24.9)
469025121393(+25.9)
256502027(+7.9)
22251958
(+4.3)
469146595
(+14.1)
682901160658(+23.5)
October-December of FY17PTotal LoansSME LoansPercentage
12383629774(+24.0)
503053132954(+26.4)
251492413(+9.6)
21842594
(+2.7)
488536904
(+14.1)
722733172639(+23.9)
January-March of FY16PTotal LoansSME LoansPercentage
12504629930(+23.9)
523442134136(+25.6)
266162276(+8.6)
21842849
(+3.9)
511937374
(+14.4)
748139174565(+23.3)
April-June of FY16PTotal LoansSME LoansPercentage
12883331260(+24.3)
550089139925(+25.4)
294032501(+8.5)
23194851
(+3.7)
536188169
(+15.2)
785137182706(+23.3)
% change of SME loans at the end of June 2017 over end of June 2016 +5.82 +15.74 +26.89 -49.94 +27.82 +13.88
Notes: P=Provisional, R=Revised; SOBs= State Owned Banks, PBs= Private Banks, FBs= Foreign Banks, SBs= Specialized Banks,
Table 4: Disbursement and Recovery of Industrial Term Loans
Notes: LSI=Large Scale Industries, MSI=Medium Scale Industries and SSCI=Small Scale & Cottage Industries P=Provisional; R=Revised; Figures in parentheses indicate the percentage change over the previous quarter
Source: BB
Quarter Disbursement (Tk. in crore) Recovery (Tk. in crore)
LSI MSI SSCI Total LSI MSI SSCI Total
April-June of FY16R 11921 2493 2341 16755 (-8.3) 9088 2718 965 12771 (+2.7)
July-September of FY17R 9929 1977 1139 13045 (-22.1) 8757 2393 1273 12423 (-2.7)
October-December of FY17P 14175 3068 2332 19575 (+50.1) 9846 2137 1696 13679 (+10.1)
January-March of FY17P 11875 2297 1611 15783 (-19.4) 11069 2186 1292 14547 (+6.3)
April-June of FY17P 10303 1781 1668 13752 (-12.9) 8190 1992 1264 11446 (-21.3)
4.2 Industrial Term Loans
Data on industrial term loans are available only up to the fourth quarter (April-June) of FY17. According to BB data, the disbursement of industrial term loans during April-June of FY17 stood 12.9 per cent lower at Tk.13,752 crore, compared to Tk.15,783 crore during the immediate previous quarter (January-March) of FY17 (Table 4). The recovery of industrial term loans also decreased by 21.3 per cent to Tk.11,446 crore during April-June of FY17, compared to Tk.14,547 crore in the previous quarter (January-March of FY17).
Notes: P=Provisional, R=Revised; SOBs= State Owned Banks, PBs= Private Banks, FBs= Foreign Banks, SBs= Specialized Banks,
NBFIs= Non-bank Financial Institutions; Figures in parentheses indicate SME loans as percentage of total loans
Source: Bangladesh Bank

Quarterly Review | 13
July-September 2017 (Q1 of FY18)
4.4 Agricultural Credit and Non-farm .....Rural Credit
The Bangladesh Bank (BB) has set a target of Tk.20,400 crore for disbursement of agricultural credit and non-farm rural credit for FY18, which is 16.24 per cent higher than that of the previous fiscal year (Tk.17,550 crore). The disbursement of agricultural credit and non-farm rural credit in FY17 (Tk.20,999 crore) also surpassed their annual target as the BB strengthened its monitoring and supervision from the very beginning of the fiscal.
Disbursement and Recovery of Agricultural Credit and Non-farm Rural Credit
Month FY18P FY17R
Disbursement Recovery Disbursement Recovery
July 1574.07 1613.61 1056.00 945.65
August 1219.98 1252.17 1006.63 1189.85
September 1441.69 1698.03 1381.22 1406.89
Total of Q1
4235.74(+22.99)
4563.81(+28.83)
3443.85(+7.65)
3542.39(+13.62)
Notes: P=Provisional, R=Revised; Figures in parentheses indicate the percentage change over the same period of the previous fiscal year
Source: Bangladesh Bank
(in crore Taka)
Table 6:
5.0 CAPITAL MARKET
Investor participation significantly increased in the country’s capital market in the first quarter (Q1) of the present fiscal year (FY18). On 28 September 2017, the last trading day of the quarter, the key index of Dhaka Stock Exchange, DSEX, rose by 0.22 per cent over the previous day and settled at 6,092.84. Whereas the shariah-based index, DSES, and the blue chip index, DS30, lost, respectively, by 0.32 per cent to close at 1,345.86 and by 0.02 per cent to 2,177.61. Of the 331 issues traded, 131 advanced, 160 declined and 40 remained unchanged on DSE and the turnover stood at Tk.6.25 billion. Also, the Chittagong Stock Exchange (CSE) ended marginally higher with its Selective Categories Index (CSCX) advancing 0.12 per cent to settle at 11,412.65. Of 241 issues traded, 83 advanced, 135 declined and 23 remained unchanged and the turnover stood at Tk.2.93 billion.
In the quarter under review, the disbursement of agricultural credit and non-farm rural credit by banks increased by 22.99 per cent or Tk.791.89 crore to Tk.4,235.74 crore from Tk.3,443.85 crore in the corresponding period of the previous fiscal (Table 6). The improvement in disbursement was partly the result of strong monitoring by the BB and partly because of holding surplus liquidity by banks due to the dull business situation. In this backdrop, the central bank has recently asked banks to increase disbursement of agricultural credit and non-farm rural credit to boost the private sector credit growth. Of the Tk.4,235.74 crore disbursed, eight state-owned commercial banks (SCBs) disbursed Tk.1,475 crore while the remaining Tk.2,760.74 crore was given by the private commercial banks (PCBs) and foreign commercial banks (FCBs). The recovery also increased by 28.83 per cent or Tk.1,021.42 crore to Tk.4,563.81 crore in Q1 of FY18 from Tk.3,542.39 crore in the corresponding period of the previous fiscal year.

July-September 2017 (Q1 of FY18)
Quarterly Review | 14
6.0 PUBLIC FINANCE
The National Board of Revenue’s revenue collection target for the current fiscal year (FY18) is Tk.248,190 crore, which is about 22.17 per cent higher than that of the previous fiscal year’s original target (Tk.203,152 crore), about 34.16 per cent higher than the revised target of Tk.185,000 crore and also about 34.15 per cent higher than the collected amount of Tk.185,004 crore in FY17. Of the total FY18 target of Tk.248,190 crore, the NBR will have to collect the highest amount of Tk.91,000 crore in VAT, followed by Tk.87,190 crore in income tax and Tk.70,000 crore in customs duty.
In the first two months (July-August) of FY18 for which data on revenue collection is available, the NBR collected Tk.27,161 crore, which was 23.4 per cent higher than the collection in the corresponding period of FY17 (Tk.22,015 crore) (Table 7).
Table 7: Government Tax Revenue Collection
Notes: P=Provisional; R=Revised; NA=Not Available; *=include supplementary duties and travel tax;
Figures in brackets indicate percentage changes over the corresponding period of the preceding year.
Sources: Bangladesh Bank, NBR and Office of the Controller General of Accounts
Month
Tax Revenue Collections ( in crore Taka)NBR
Non-NBR GrandTotal Customs
Duties VAT IncomeTax Others* Total
FY18P
July 1909 5120 2975 2185 12189 NA NA
August 2071 5975 3839 3087 14972 NA NA
Total of July-August
3980(+33.6)
11095(+24.2)
6814(+22.9)
5272(+15.6)
27161(+23.4) NA NA
FY17R
July 1242 3862 2683 1807 9594 417 10011
August 1737 5068 2861 2755 12421 523 12944
Total of July-August
2979(+25.0)
8930(+22.2)
5544(+8.8)
4562(+27.8)
22015(+19.9)
940(-4.7)
22955(+18.7)
Net foreign investment in the DSE marked an increase, encouraged by positive macroeconomic indicators coupled with declining interest rate, stable exchange rate and a peaceful political situation. Banks are the foreign investors’ preferred sector, but non-bank financial institutions, power and energy, pharmaceuticals, multinationals, telecoms and IT also drew their attention. Investors include Morgan Stanley, JPMorgan, Goldman Sachs and BlackRock, among others. Known as portfolio investment, total foreign investment accounted for nearly 1.0 per cent of DSE’s total market capitalization that stood at Tk.4,083 billion at the close of trade on 03 October 2017.
Quarterly Review | 15
July-September 2017 (Q1 of FY18)
Notes: P=Provisional; R=Revised Sources: EPB and BB
7.0 EXPORTS 6.1 Public Expenditure
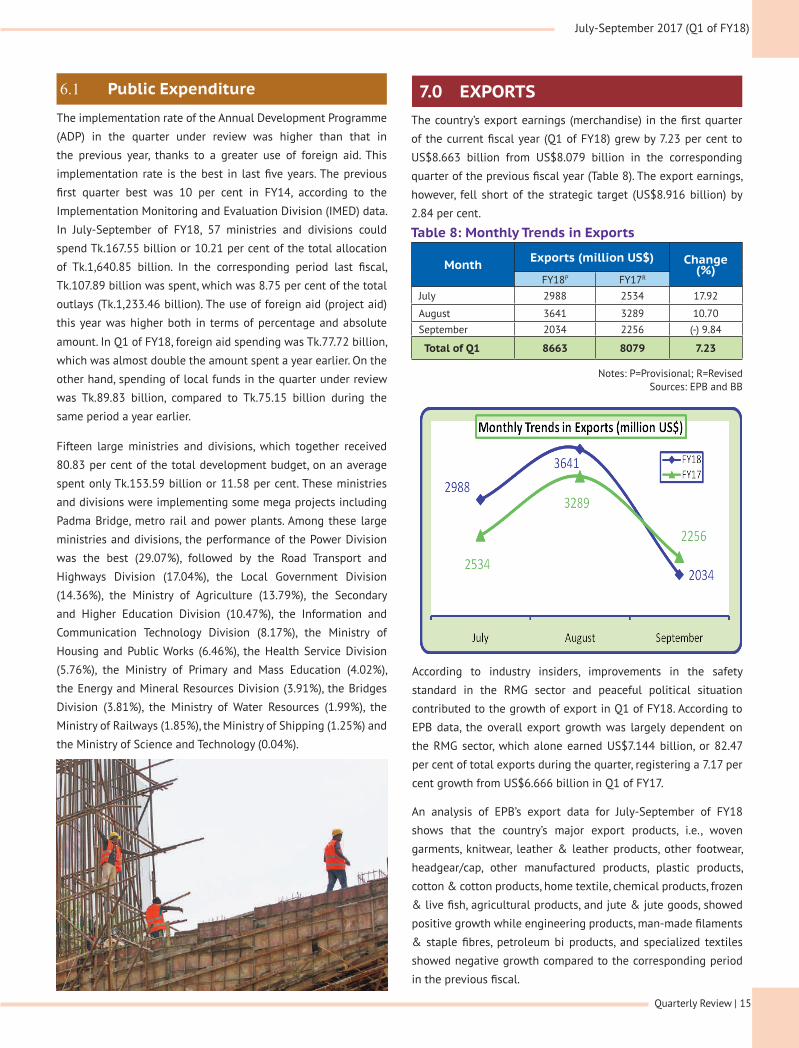
Table 8: Monthly Trends in Exports
Month Exports (million US$) Change(%)
FY18P FY17R
July 2988 2534 17.92
August 3641 3289 10.70September 2034 2256 (-) 9.84
Total of Q1 8663 8079 7.23
The implementation rate of the Annual Development Programme
(ADP) in the quarter under review was higher than that in
the previous year, thanks to a greater use of foreign aid. This
implementation rate is the best in last five years. The previous
first quarter best was 10 per cent in FY14, according to the
Implementation Monitoring and Evaluation Division (IMED) data.
In July-September of FY18, 57 ministries and divisions could
spend Tk.167.55 billion or 10.21 per cent of the total allocation
of Tk.1,640.85 billion. In the corresponding period last fiscal,
Tk.107.89 billion was spent, which was 8.75 per cent of the total
outlays (Tk.1,233.46 billion). The use of foreign aid (project aid)
this year was higher both in terms of percentage and absolute
amount. In Q1 of FY18, foreign aid spending was Tk.77.72 billion,
which was almost double the amount spent a year earlier. On the
other hand, spending of local funds in the quarter under review
was Tk.89.83 billion, compared to Tk.75.15 billion during the
same period a year earlier.
Fifteen large ministries and divisions, which together received
80.83 per cent of the total development budget, on an average
spent only Tk.153.59 billion or 11.58 per cent. These ministries
and divisions were implementing some mega projects including
Padma Bridge, metro rail and power plants. Among these large
ministries and divisions, the performance of the Power Division
was the best (29.07%), followed by the Road Transport and
Highways Division (17.04%), the Local Government Division
(14.36%), the Ministry of Agriculture (13.79%), the Secondary
and Higher Education Division (10.47%), the Information and
Communication Technology Division (8.17%), the Ministry of
Housing and Public Works (6.46%), the Health Service Division
(5.76%), the Ministry of Primary and Mass Education (4.02%),
the Energy and Mineral Resources Division (3.91%), the Bridges
Division (3.81%), the Ministry of Water Resources (1.99%), the
Ministry of Railways (1.85%), the Ministry of Shipping (1.25%) and
the Ministry of Science and Technology (0.04%).
The country’s export earnings (merchandise) in the first quarter
of the current fiscal year (Q1 of FY18) grew by 7.23 per cent to
US$8.663 billion from US$8.079 billion in the corresponding
quarter of the previous fiscal year (Table 8). The export earnings,
however, fell short of the strategic target (US$8.916 billion) by
2.84 per cent.
An analysis of EPB’s export data for July-September of FY18
shows that the country’s major export products, i.e., woven
garments, knitwear, leather & leather products, other footwear,
headgear/cap, other manufactured products, plastic products,
cotton & cotton products, home textile, chemical products, frozen
& live fish, agricultural products, and jute & jute goods, showed
positive growth while engineering products, man-made filaments
& staple fibres, petroleum bi products, and specialized textiles
showed negative growth compared to the corresponding period
in the previous fiscal.
According to industry insiders, improvements in the safety
standard in the RMG sector and peaceful political situation
contributed to the growth of export in Q1 of FY18. According to
EPB data, the overall export growth was largely dependent on
the RMG sector, which alone earned US$7.144 billion, or 82.47
per cent of total exports during the quarter, registering a 7.17 per
cent growth from US$6.666 billion in Q1 of FY17.
July-September 2017 (Q1 of FY18)
Quarterly Review | 16
8.0 IMPORTS
Table 9 : Monthly Trends in Imports
Notes: P=Provisional; R=Revised Source: Bangladesh Bank
Month
Imports (million US$)
Change(%)
FY18P FY17R
July 4326 2942 47.04
August 4701 3797 23.81
Total of July-August 9027 6739 33.95
Exports to Germany, the second largest export destination,
however, registered a minimal 0.73 per cent growth to US$1.38
billion in Q1 of FY18 from US$1.37 billion in the same period of
FY17, and export earnings from RMG stood US$1.29 billion in the
market with 0.85 per cent growth over the corresponding period
of FY17.
Exports to the UK, the third largest destination, grew by 22.07
per cent to US$1.03 billion in the first quarter of FY18 from
US$843.78 million in the same period of FY17, while earnings
from apparel products fetched US$962.27 million with 23.28 per
cent growth.
Bangladesh’s export earnings from Spain was US$611.03 million,
depicting 24.24 per cent growth, US$408.13 million from France
showing 6.19 per cent growth, US$344.59 million from Italy
with 12.24 per cent growth, and US$283.33 million from Canada
showing 13.33 per cent growth. On the other hand, export
earnings from two promising markets –Japan and China– dropped
in the first quarter of the current financial year compared with the
same period of the last fiscal. Export earnings from Japan fell by
8.68 per cent to US$245.27 million from US$268.57 million, while
earnings from China fell by 16.95 per cent to US$162.72 million
from US$195.93 million.
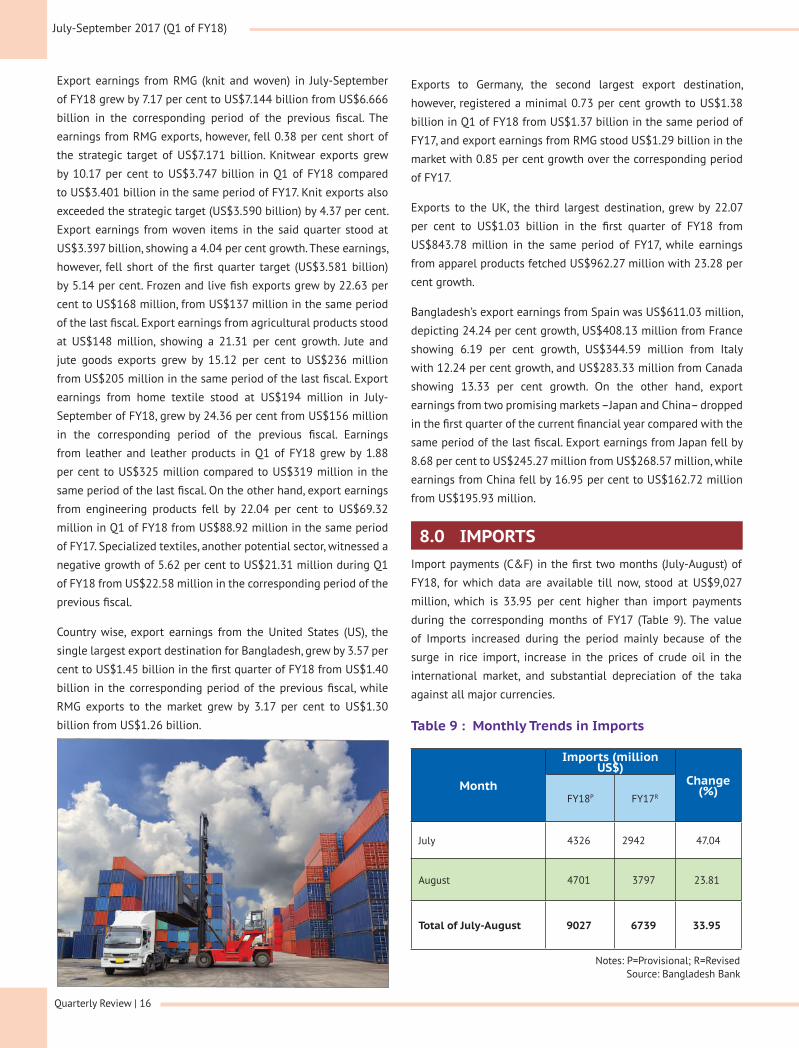
Import payments (C&F) in the first two months (July-August) of
FY18, for which data are available till now, stood at US$9,027
million, which is 33.95 per cent higher than import payments
during the corresponding months of FY17 (Table 9). The value
of Imports increased during the period mainly because of the
surge in rice import, increase in the prices of crude oil in the
international market, and substantial depreciation of the taka
against all major currencies.
Export earnings from RMG (knit and woven) in July-September
of FY18 grew by 7.17 per cent to US$7.144 billion from US$6.666
billion in the corresponding period of the previous fiscal. The
earnings from RMG exports, however, fell 0.38 per cent short of
the strategic target of US$7.171 billion. Knitwear exports grew
by 10.17 per cent to US$3.747 billion in Q1 of FY18 compared
to US$3.401 billion in the same period of FY17. Knit exports also
exceeded the strategic target (US$3.590 billion) by 4.37 per cent.
Export earnings from woven items in the said quarter stood at
US$3.397 billion, showing a 4.04 per cent growth. These earnings,
however, fell short of the first quarter target (US$3.581 billion)
by 5.14 per cent. Frozen and live fish exports grew by 22.63 per
cent to US$168 million, from US$137 million in the same period
of the last fiscal. Export earnings from agricultural products stood
at US$148 million, showing a 21.31 per cent growth. Jute and
jute goods exports grew by 15.12 per cent to US$236 million
from US$205 million in the same period of the last fiscal. Export
earnings from home textile stood at US$194 million in July-
September of FY18, grew by 24.36 per cent from US$156 million
in the corresponding period of the previous fiscal. Earnings
from leather and leather products in Q1 of FY18 grew by 1.88
per cent to US$325 million compared to US$319 million in the
same period of the last fiscal. On the other hand, export earnings
from engineering products fell by 22.04 per cent to US$69.32
million in Q1 of FY18 from US$88.92 million in the same period
of FY17. Specialized textiles, another potential sector, witnessed a
negative growth of 5.62 per cent to US$21.31 million during Q1
of FY18 from US$22.58 million in the corresponding period of the
previous fiscal.
Country wise, export earnings from the United States (US), the
single largest export destination for Bangladesh, grew by 3.57 per
cent to US$1.45 billion in the first quarter of FY18 from US$1.40
billion in the corresponding period of the previous fiscal, while
RMG exports to the market grew by 3.17 per cent to US$1.30
billion from US$1.26 billion.
Quarterly Review | 17
July-September 2017 (Q1 of FY18)
9.0 REMITTANCES
Notes: P=Provisional; R=Revised
Source: Bangladesh Bank
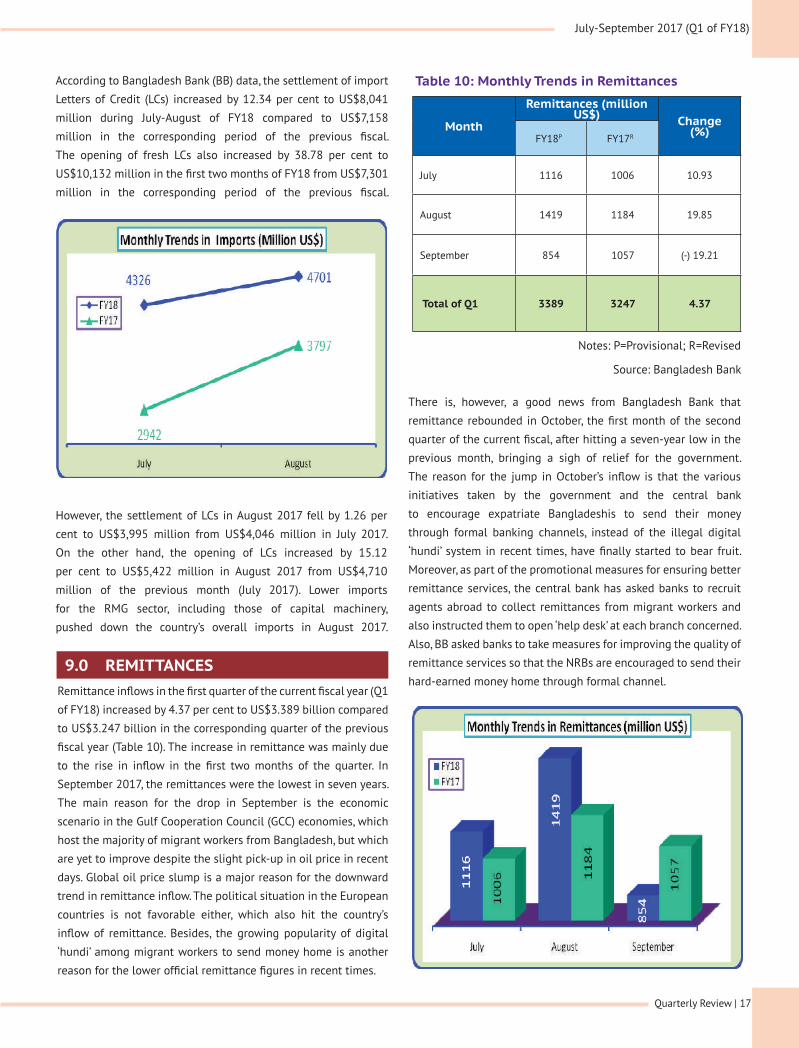
Month
Remittances (million US$) Change
(%)FY18P FY17R
July 1116 1006 10.93
August 1419 1184 19.85
September 854 1057 (-) 19.21
Total of Q1 3389 3247 4.37
Table 10: Monthly Trends in RemittancesAccording to Bangladesh Bank (BB) data, the settlement of import
Letters of Credit (LCs) increased by 12.34 per cent to US$8,041
million during July-August of FY18 compared to US$7,158
million in the corresponding period of the previous fiscal.
The opening of fresh LCs also increased by 38.78 per cent to
US$10,132 million in the first two months of FY18 from US$7,301
million in the corresponding period of the previous fiscal.
Remittance inflows in the first quarter of the current fiscal year (Q1
of FY18) increased by 4.37 per cent to US$3.389 billion compared
to US$3.247 billion in the corresponding quarter of the previous
fiscal year (Table 10). The increase in remittance was mainly due
to the rise in inflow in the first two months of the quarter. In
September 2017, the remittances were the lowest in seven years.
The main reason for the drop in September is the economic
scenario in the Gulf Cooperation Council (GCC) economies, which
host the majority of migrant workers from Bangladesh, but which
are yet to improve despite the slight pick-up in oil price in recent
days. Global oil price slump is a major reason for the downward
trend in remittance inflow. The political situation in the European
countries is not favorable either, which also hit the country’s
inflow of remittance. Besides, the growing popularity of digital
‘hundi’ among migrant workers to send money home is another
reason for the lower official remittance figures in recent times.
There is, however, a good news from Bangladesh Bank that
remittance rebounded in October, the first month of the second
quarter of the current fiscal, after hitting a seven-year low in the
previous month, bringing a sigh of relief for the government.
The reason for the jump in October’s inflow is that the various
initiatives taken by the government and the central bank
to encourage expatriate Bangladeshis to send their money
through formal banking channels, instead of the illegal digital
‘hundi’ system in recent times, have finally started to bear fruit.
Moreover, as part of the promotional measures for ensuring better
remittance services, the central bank has asked banks to recruit
agents abroad to collect remittances from migrant workers and
also instructed them to open ‘help desk’ at each branch concerned.
Also, BB asked banks to take measures for improving the quality of
remittance services so that the NRBs are encouraged to send their
hard-earned money home through formal channel.
However, the settlement of LCs in August 2017 fell by 1.26 per
cent to US$3,995 million from US$4,046 million in July 2017.
On the other hand, the opening of LCs increased by 15.12
per cent to US$5,422 million in August 2017 from US$4,710
million of the previous month (July 2017). Lower imports
for the RMG sector, including those of capital machinery,
pushed down the country’s overall imports in August 2017.
July-September 2017 (Q1 of FY18)
Quarterly Review | 18
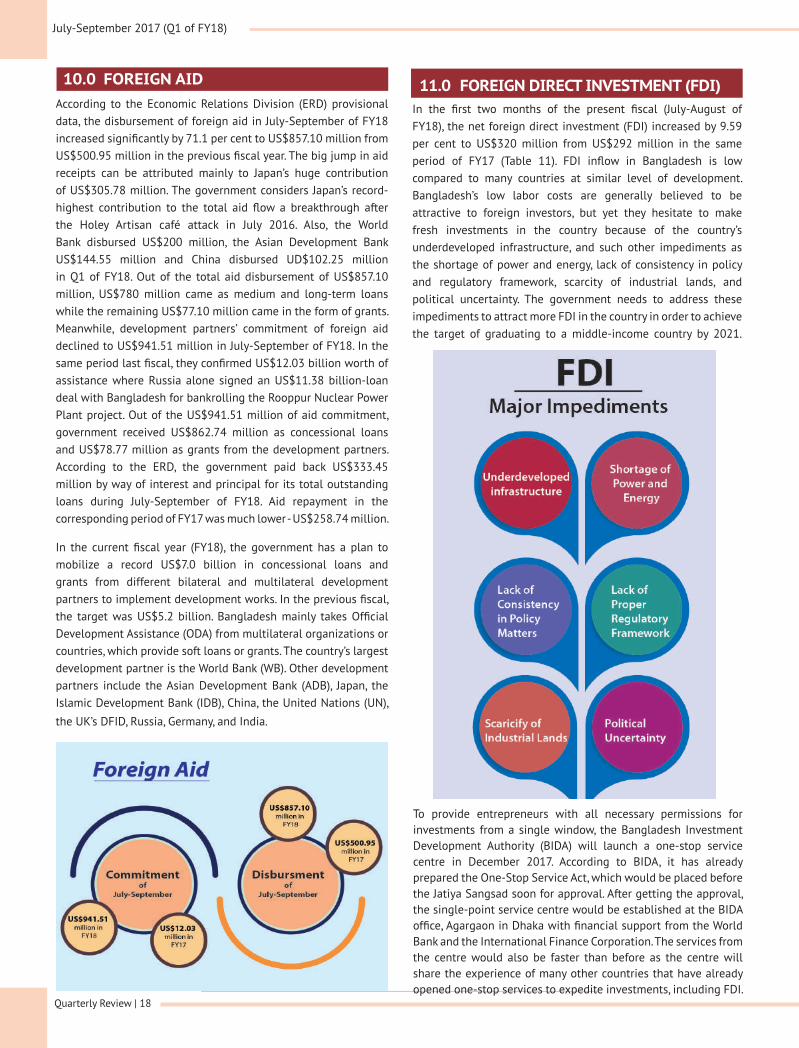
11.0 FOREIGN DIRECT INVESTMENT (FDI) In the first two months of the present fiscal (July-August of FY18), the net foreign direct investment (FDI) increased by 9.59 per cent to US$320 million from US$292 million in the same period of FY17 (Table 11). FDI inflow in Bangladesh is low compared to many countries at similar level of development. Bangladesh’s low labor costs are generally believed to be attractive to foreign investors, but yet they hesitate to make fresh investments in the country because of the country’s underdeveloped infrastructure, and such other impediments as the shortage of power and energy, lack of consistency in policy and regulatory framework, scarcity of industrial lands, and political uncertainty. The government needs to address these impediments to attract more FDI in the country in order to achieve the target of graduating to a middle-income country by 2021.
10.0 FOREIGN AID According to the Economic Relations Division (ERD) provisional data, the disbursement of foreign aid in July-September of FY18 increased significantly by 71.1 per cent to US$857.10 million from US$500.95 million in the previous fiscal year. The big jump in aid receipts can be attributed mainly to Japan’s huge contribution of US$305.78 million. The government considers Japan’s record-highest contribution to the total aid flow a breakthrough after the Holey Artisan café attack in July 2016. Also, the World Bank disbursed US$200 million, the Asian Development Bank US$144.55 million and China disbursed UD$102.25 million in Q1 of FY18. Out of the total aid disbursement of US$857.10 million, US$780 million came as medium and long-term loans while the remaining US$77.10 million came in the form of grants. Meanwhile, development partners’ commitment of foreign aid declined to US$941.51 million in July-September of FY18. In the same period last fiscal, they confirmed US$12.03 billion worth of assistance where Russia alone signed an US$11.38 billion-loan deal with Bangladesh for bankrolling the Rooppur Nuclear Power Plant project. Out of the US$941.51 million of aid commitment, government received US$862.74 million as concessional loans and US$78.77 million as grants from the development partners. According to the ERD, the government paid back US$333.45 million by way of interest and principal for its total outstanding loans during July-September of FY18. Aid repayment in the corresponding period of FY17 was much lower - US$258.74 million.
In the current fiscal year (FY18), the government has a plan to mobilize a record US$7.0 billion in concessional loans and grants from different bilateral and multilateral development partners to implement development works. In the previous fiscal, the target was US$5.2 billion. Bangladesh mainly takes Official Development Assistance (ODA) from multilateral organizations or countries, which provide soft loans or grants. The country’s largest development partner is the World Bank (WB). Other development partners include the Asian Development Bank (ADB), Japan, the Islamic Development Bank (IDB), China, the United Nations (UN),
the UK’s DFID, Russia, Germany, and India.
To provide entrepreneurs with all necessary permissions for investments from a single window, the Bangladesh Investment Development Authority (BIDA) will launch a one-stop service centre in December 2017. According to BIDA, it has already prepared the One-Stop Service Act, which would be placed before the Jatiya Sangsad soon for approval. After getting the approval, the single-point service centre would be established at the BIDA office, Agargaon in Dhaka with financial support from the World Bank and the International Finance Corporation. The services from the centre would also be faster than before as the centre will share the experience of many other countries that have already opened one-stop services to expedite investments, including FDI.
Quarterly Review | 19
July-September 2017 (Q1 of FY18)
12.0 BALANCE OF PAYMENTS
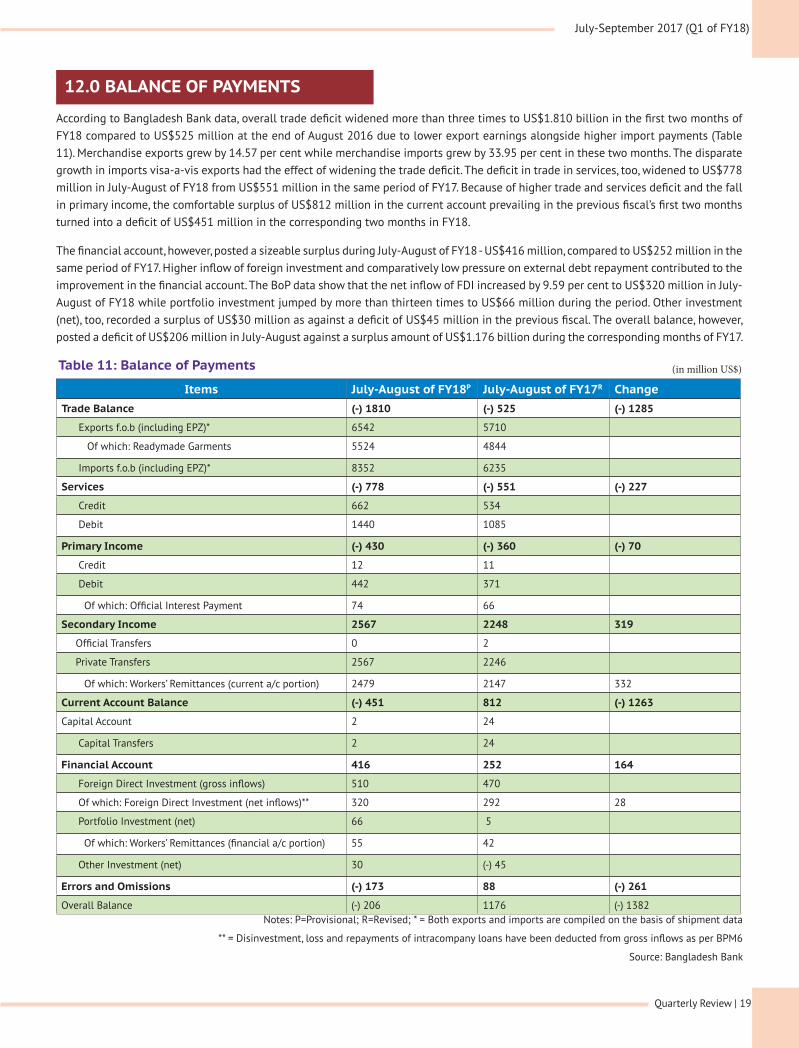
According to Bangladesh Bank data, overall trade deficit widened more than three times to US$1.810 billion in the first two months of FY18 compared to US$525 million at the end of August 2016 due to lower export earnings alongside higher import payments (Table 11). Merchandise exports grew by 14.57 per cent while merchandise imports grew by 33.95 per cent in these two months. The disparate growth in imports visa-a-vis exports had the effect of widening the trade deficit. The deficit in trade in services, too, widened to US$778 million in July-August of FY18 from US$551 million in the same period of FY17. Because of higher trade and services deficit and the fall in primary income, the comfortable surplus of US$812 million in the current account prevailing in the previous fiscal’s first two months turned into a deficit of US$451 million in the corresponding two months in FY18.
The financial account, however, posted a sizeable surplus during July-August of FY18 - US$416 million, compared to US$252 million in the same period of FY17. Higher inflow of foreign investment and comparatively low pressure on external debt repayment contributed to the improvement in the financial account. The BoP data show that the net inflow of FDI increased by 9.59 per cent to US$320 million in July-August of FY18 while portfolio investment jumped by more than thirteen times to US$66 million during the period. Other investment (net), too, recorded a surplus of US$30 million as against a deficit of US$45 million in the previous fiscal. The overall balance, however, posted a deficit of US$206 million in July-August against a surplus amount of US$1.176 billion during the corresponding months of FY17.
Table 11: Balance of Payments
Notes: P=Provisional; R=Revised; * = Both exports and imports are compiled on the basis of shipment data
** = Disinvestment, loss and repayments of intracompany loans have been deducted from gross inflows as per BPM6
Source: Bangladesh Bank
(in million US$)
Items July-August of FY18P July-August of FY17R ChangeTrade Balance (-) 1810 (-) 525 (-) 1285
Exports f.o.b (including EPZ)* 6542 5710
Of which: Readymade Garments 5524 4844
Imports f.o.b (including EPZ)* 8352 6235
Services (-) 778 (-) 551 (-) 227
Credit 662 534
Debit 1440 1085
Primary Income (-) 430 (-) 360 (-) 70
Credit 12 11
Debit 442 371
Of which: Official Interest Payment 74 66
Secondary Income 2567 2248 319
Official Transfers 0 2
Private Transfers 2567 2246
Of which: Workers’ Remittances (current a/c portion) 2479 2147 332
Current Account Balance (-) 451 812 (-) 1263
Capital Account 2 24
Capital Transfers 2 24
Financial Account 416 252 164
Foreign Direct Investment (gross inflows) 510 470
Of which: Foreign Direct Investment (net inflows)** 320 292 28
Portfolio Investment (net) 66 5
Of which: Workers’ Remittances (financial a/c portion) 55 42
Other Investment (net) 30 (-) 45
Errors and Omissions (-) 173 88 (-) 261
Overall Balance (-) 206 1176 (-) 1382
July-September 2017 (Q1 of FY18)
Quarterly Review | 20
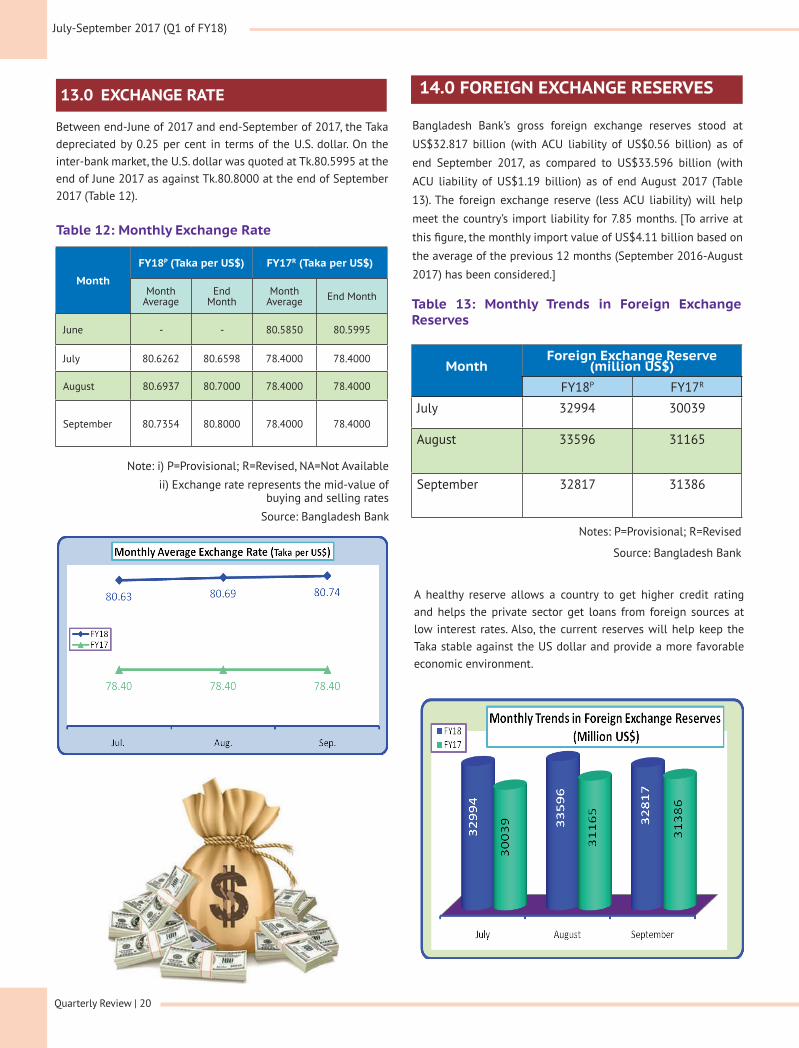
14.0 FOREIGN EXCHANGE RESERVES
Bangladesh Bank’s gross foreign exchange reserves stood at
US$32.817 billion (with ACU liability of US$0.56 billion) as of
end September 2017, as compared to US$33.596 billion (with
ACU liability of US$1.19 billion) as of end August 2017 (Table
13). The foreign exchange reserve (less ACU liability) will help
meet the country’s import liability for 7.85 months. [To arrive at
this figure, the monthly import value of US$4.11 billion based on
the average of the previous 12 months (September 2016-August
2017) has been considered.]
Table 12: Monthly Exchange Rate
Table 13: Monthly Trends in Foreign Exchange Reserves
13.0 EXCHANGE RATE
Between end-June of 2017 and end-September of 2017, the Taka depreciated by 0.25 per cent in terms of the U.S. dollar. On the inter-bank market, the U.S. dollar was quoted at Tk.80.5995 at the end of June 2017 as against Tk.80.8000 at the end of September 2017 (Table 12).
Month
FY18P (Taka per US$) FY17R (Taka per US$)
Month Average
End Month
Month Average End Month
June - - 80.5850 80.5995
July 80.6262 80.6598 78.4000 78.4000
August 80.6937 80.7000 78.4000 78.4000
September 80.7354 80.8000 78.4000 78.4000
MonthForeign Exchange Reserve
(million US$)FY18P FY17R
July 32994 30039
August 33596 31165
September 32817 31386Note: i) P=Provisional; R=Revised, NA=Not Available
ii) Exchange rate represents the mid-value of buying and selling rates
Source: Bangladesh Bank Notes: P=Provisional; R=Revised
Source: Bangladesh Bank
A healthy reserve allows a country to get higher credit rating and helps the private sector get loans from foreign sources at low interest rates. Also, the current reserves will help keep the Taka stable against the US dollar and provide a more favorable economic environment.

Quarterly Review | 21
July-September 2017 (Q1 of FY18)
Manpower export from Bangladesh remained subdued in the last
few years as the country faced difficulties following the suspension
of labor import by various Middle-Eastern countries. Both public
and private sectors are now trying to expand manpower export to
certain other countries, including Thailand and Japan. Manpower
demand from the Kingdom of Saudi Arabia (KSA), Kuwait, Qatar,
Oman, Jordan and Bahrain has shrunk. As the key destinations
like United Arab Emirates (UAE) and Malaysia are not increasing
their manpower import, the scope of overseas employment has
become limited. Only 215,971 workers from Bangladesh entered
the international markets with jobs during the quarter under
review (July-September of FY18). The number of emigrants was
247,517 during the previous quarter. At present, there are more
than 11 million Bangladeshis working in 162 countries, mostly in
the Middle East. Their contribution accounts for about 60 per cent
of the country’s foreign currency reserves.
15.0 OVERSEAS EMPLOYMENT SITUATION Since 1991 when Bangladeshi female workers started going
abroad for jobs, the number of oversees jobs for female workers
has gradually decreased. Some 23,596 female workers entered
the international markets with jobs during the quarter under
review, a 31.34 per cent decrease from 34,364 in the previous
quarter (April-June of FY17). Female workers, mostly housemaids
and garment workers, are employed mainly in KSA, Jordan, UAE,
Oman, Lebanon and Qatar.
16.0 PRICE SITUATION
In September 2017, the general point to point inflation in the
country rose by 0.23 percentage point to 6.12 per cent from 5.89
per cent in August 2017 (Table 14). The inflation in September hit
the two-year-high mainly due to an increase in the prices of some
food and essential items. According to BBS, the highest inflation
rate was recorded at 6.19 per cent two years ago in October 2015.
The rate of inflation started to pick up in July 2017, when it was
5.57 per cent. A year ago, in September 2016, the inflation rate
was 5.53 per cent.
The food inflation increased by 0.55 percentage point to 7.87
per cent in September 2017 from 7.32 per cent in August 2017.
This was the highest in 38 months on the back of the massive
production loss of the staple rice. On the other hand, the non-
food inflation fell by 0.31 percentage point to 3.44 per cent in
September 2017 from 3.75 per cent in August 2017.

July-September 2017 (Q1 of FY18)
Quarterly Review | 22
Table 14: Monthly Trends in Inflation (Base: 2005-06=100)
Notes: i) P=Provisional, R=Revised; ii) Food includes food, beverages and tobacco
Source: Bangladesh Bureau of Statistics
(Percent)
Period
Point to Point-All Point to Point-Rural Point to Point-Urban
General Food Non-food General Food Non-food General Food Non-food
FY18P
July 5.57 6.95 3.53 5.41 6.86 2.84 5.86 7.15 4.48
August 5.89 7.32 3.75 5.88 7.39 3.19 5.91 7.18 4.51
September 6.12 7.87 3.44 6.21 7.97 2.98 5.95 7.63 4.08
FY17R
July 5.40 4.35 6.98 4.54 3.59 6.26 7.00 6.11 7.98
August 5.37 4.30 7.00 4.41 3.40 6.28 7.15 6.39 7.99
September 5.53 5.10 6.19 4.63 4.27 5.31 7.21 7.03 7.42
A comparison of point to point
inflation data for rural and urban
areas in September of FY18 shows
that the general inflation rate
was higher in rural areas (6.21%)
than in urban areas (5.95%).
Food inflation in September
was also higher in rural areas
(7.97%) than in urban areas
(7.63%), while, non-food inflation
was lower in rural areas (2.98%)
than in urban areas (4.08%).

Quarterly Review | 23
July-September 2017 (Q1 of FY18)
17.0 CHAMBER’S PROJECTION ON SOME SELECTED ECONOMIC INDICATORS
Table 15: Projection on Some Selected Indicators in Q2 of FY18
Notes: January – September 2017: actual figures except September value of Import; October – December of FY18: projections (figures in bold)
Sources: BB, BBS and the Chamber’s own calculation
Indicators
FY17
FY18
Jan. Feb. Mar. April May June July August Sept. Oct. Nov. Dec.
Export
(million US$)
3312 2726 3110 2776 3069 3044 2988 3641 2034 2780 2990 3110
Import
(million US$)
4302 3761 4311 4171 4352 3499 4326 4701 4840 4980 5060 5150
Remittance
(million US$)
1009 941 1078 1093 1268 1212 1116 1419 854 1150 1220 1330
Forex Reserve
(million US$)
31724 32557 32215 32519 32246 33407 32994 33596 32817 33650 33110 33850
I n f l a t i o n , Point to Point (per cent)
5.15 5.31 5.39 5.47 5.76 5.94 5.57 5.89 6.12 6.18 5.80 5.70
On the basis of observations in the preceding nine months, this Chamber has made its own projections on some selected
economic indicators for the second quarter of the present fiscal year (Q2 of FY18). These projections are presented in Table 15.
It is assumed that the peaceful political situation that currently prevails will continue in the coming days. Therefore,
export, import, and remittances can be expected to increase. The foreign exchange reserve will fall somewhat
in November due to the payment to the Asian Clearing Union (ACU) against imports. The rate of inflation is
likely to go up in October because of the probable rise in some essential commodities, and then it may go down.

Quarterly Review | 24
July-September 2017 (Q1 of FY18)
18.0 CONCLUDING OBSERVATIONS
In the quarter under review (Q1 of FY18), the overall economic situation was positive as indicated by steady improvements in the major economic indicators. The economy is progressing well, despite the presence of some risk factors viz., marginal growth in remittances, slower growth in the export receipts, and a higher rate of inflation. The country, however, experienced stable growth. Inflation, though a bit higher, was under control; the exchange rate remained stable; and foreign exchange reserves rose to a comfortable level.
During July-September of FY18, agriculture, manufacturing and services sectors - all performed well, but continuous government support of various types will be needed to sustain their growth. Infrastructure deficits and gas and power supply problems are now undermining the performance of all productive sectors of the economy. Government should adopt adequate steps to overcome these problems, and achieve and maintain political stability, which are essential for creating an investment-friendly climate, so crucial to achieve higher economic growth.