challenges faced by small and medium enterprises in
TRANSCRIPT

0
CHALLENGES FACED BY SMALL AND MEDIUM ENTERPRISES IN
ACCESSING PUBLIC CONTRACTS IN BONDO, KENYA
BY
ABUYA JOSHUA OLANG’O
D61/61936/2010
SUPERVISOR: ONDIEK GERALD
A MANAGEMENT RESEARCH PROJECT REPORT SUBMITTED IN
PARTIAL FULFILMENT OF THE REQUIREMENTS FOR THE AWARD OF
MASTER OF BUSINESS ADMINISTRATION DEGREE OF THE SCHOOL OF
BUSINESS, UNIVERSITY OF NAIROBI

i
DECLARATION
This research report is my original work and has never been presented for examination in any
university. Neither the report or any part of it may be reproduced without prior permission of the
author and/or the University of Nairobi.
Siged.................................. Date................................
Abuya Joshua Olang‟o
D61/61936/2010
This management research project report has been submitted for examination with my approval as the
University Supervisor.
Signed............................................. Date....................................
Ondiek Gerald
Lecturer, School of Business
University of Nairobi.

ii
DEDICATION
To my wife Milllicent Auma her whole-hearted support as I undertook the MBA degree program.
Many thanks to our children David Abuya, Mitchelle Catherine Abuya and Toney Biden Abuya who
collectively endured my extremely busy schedule for the entire MBA period denying them my close-
touch attention.

iii
ACKNOWLEDGEMENT
First and foremost, I would like thank all my coursework lecturers for beautifully building my
intellectual capacity with the fundamental principles and theories in the various business disciplines.
Special gratitude goes to my supervisors Mr. Ondiek Gerald and Dr. Okwiri both of whom spent
sleepness nights guiding me through my MBA Research Project continuosly adding value to the
product to this end. It is indeed my supervisors invaluable advice , patience and encouragement that
brought me this far.
Special appreciation also goes to all the respondents for their valuable time and contribution, without
which this research project would not have been possible.
To my late mum Mrs. Alice Nyamilla Abuya thank you for your prayers, patience and encouragement
even though you never lived to enjoy the fruits of this MBA program. May God rest her soul in eternal
peace. To my dad it‟s been along sacrifice, thanks for your continued prayers and moral support.
Last but not least, to my wife Millicent Auma Abuya and my brother Eng. Eric Otieno Abuya for the
financial and moral support throughout my MBA program besides all my colleagues

iv
ABSTRACT
This study focused on establishing the challenges SMEs faced in accessing public sector contracts in
Bondo District. The study was anchored on the EU Directives on public contracting from which
PPDA (2005) and PPR (2006) were drawn to regulate public procurement. Compliance to EU
Directives has been seen to disadvantage SMEs in accessing public sector contracts in favor of large
enterprises. The Kenya Government has been in the forefront in advocating for the youth access to
Government Contracts. This has been evidenced by the Presidential Directive on Youth Access to
Govermnent contracts by allocating 10% of all public contracts to SMEs. Despite this preferential
treatment of SMEs, comparative tallies of public contracts secured by SMEs in Bondo against those
secured by large enterprises are still very small. The study had twin-objectives, one being to determine
the main challenges faced by SMEs in accessing public sector contracts in Bondo District besides
determining the types of public contracts often secured by SMEs in Bondo District.
The research design adopted was stratified random sampling of SMEs in which self-administered
questionnaires were used to collect data. A sample size of 136 SMEs out of a population of 210 SMEs
were selected. The collected data was analysed using descriptive statistics.
From the study perceived corruption, large documentation level, inavailability of public contracts,
lack of information access, lack of feedback, large lot sizes, existing framework arrangements, lack of
capital, long procurement time-scales, bureaucratic procurement procedures, stringent selection
criteria, inaccurate contract information, cost of tendering, poor business infrastructure unfavorable
taxation regime and pre-qualification were the major challenges SMEs face in accessing public sector
contracts in Bondo. Again the study found that SMEs in Bondo which to some extent secured public
sector contracts were found to have mostly drawn their public contracts from the Office of the
President, Local Authority, Roads & Public Works and Agriculture & Regional Development.

v
In conclusion, there are still a number of challenges that SMEs in Bondo are facing in accessing public
sector contracts. These challenges need to be addressed by both the government and SMEs
management. To accomplish this, the study recommends that further research be carried on how these
challenges could be reduced both by government contracting authorities and/or SMEs themselves.
Further research could also be carried on the initiatives the government has put to facilitate SMEs
access to public contracts. Research could also be done on contribution of the level of education of
procurement officers in achieving value for money during public procurement.
vi
TABLE OF CONTENTS
DECLARATION ............................................................................................................. i
DEDICATION ................................................................................................................ ii
ACKNOWLEDGEMENT ............................................................................................. iii
ABSTRACT ................................................................................................................... iv
TABLE OF CONTENTS ............................................................................................... vi
LIST OF TABLES .......................................................................................................... x
LIST OF ABBREVIATIONS AND ACRONYMS ..................................................... xii
CHAPTER ONE ............................................................................................................. 1
1.0. INTRODUCTION ................................................................................................... 1
1.1.1. Background of the Study .................................................................................................................... 1
1.1.2. Small & Medium Enterprises (SME‟s) ............................................................................................... 2
1.1.3. Public Contracting and SME‟s ........................................................................................................... 4
1.1.4. SMEs in Bondo District ...................................................................................................................... 5
1.2.0. Research Problem ............................................................................................................................... 6
1.3.0. Research Objectives ........................................................................................................................... 8
1.4.0. Value of the Study .............................................................................................................................. 8
CHAPTER TWO ............................................................................................................ 9
2.0. LITERATURE REVIEW ........................................................................................ 9
2.1. The Role of SMEs in Economic Development ....................................................................................... 9
2.2. The EU Directives & Public Sector Contracting .................................................................................. 10
2.3. The Impact of EU Directives on SME‟s Access to Public Contracts . ................................................. 12

vii
2.4. SME Challenges in Accessing Public Sector Contracts ....................................................................... 13
CHAPTER THREE ....................................................................................................... 16
3.0: RESEARCH METHODOLOGY ...................................................................... 16
3.1. Introduction .......................................................................................................................................... 16
3.2. Research Design ................................................................................................................................... 16
3.3. Population ............................................................................................................................................. 16
3.4. Sample Size .......................................................................................................................................... 17
3.5. Data Collection ..................................................................................................................................... 17
3.6. Data Analysis ........................................................................................................................................ 18
CHAPTER FOUR ......................................................................................................... 19
4.0: DATA ANALYSIS, RESULTS AND DISCUSSIONS ........................................ 19
4.1.0. Introduction ..................................................................................................................................... 19
4.2.0. Background of SMEs in Bondo District .......................................................................................... 20
4.2.1. Size of SMEs in Bondo District. .................................................................................................. 20
4.2.2. Area of Business .......................................................................................................................... 21
4.2.3. Number of Years in Operation .................................................................................................... 23
4.2.4. Major Sources of Funding ........................................................................................................... 24
4.2.5. Approximate Annual Turnover for SMEs. .................................................................................. 25
4.2.6. SMEs Dealing in Public Contracts in Bondo .............................................................................. 27
4.2.7. Percentage of Annual Turnover Contributed by Public Contracts .............................................. 28
4.2.8. Public Sectors often Giving Contracts to SMEs in Bondo .......................................................... 29
4.2.9: Mode of Communicating Public Contracts to SMEs in Bondo ................................................... 37
4.2.10: Average Rate SMEs Receive Public Contracts in Bondo ............................................................ 38
4.2.11: SMEs Dealing in Public Contracts in Bondo .............................................................................. 39
4.2.12: SMEs Farmiliarity with Public Procurement Rules in Bondo ..................................................... 40
4.2.13: SMEs and their Perception of Public Procurement Rules in Bondo ............................................ 41

viii
4.3.0. Major Challenges of SMEs in Accessing Public Contracts in Bondo ............................................. 43
4.3.1. VAT Registration of SMEs in Bondo .......................................................................................... 43
4.3.2. Perceived Corruption in Bondo ................................................................................................... 44
4.3.3. SMEs Business Licensing in Bondo ............................................................................................ 45
4.3.4. Tender Documentation ................................................................................................................ 47
4.3.5. Available Public Contracts in Bondo .......................................................................................... 48
4.3.6. Feedback from Contracting Authorities in Bondo after Award................................................... 50
4.3.7. Lot Sizes in Bondo ...................................................................................................................... 51
4.3.8. Existing Framework Arrangements in Bondo ............................................................................. 52
4.3.9. Availability of Finance to SMEs in Bondo .................................................................................. 53
4.3.10. SMEs Skilled Human Resource Base in Bondo ........................................................................... 55
4.3.11. Level of Technology Adoption by SMEs in Bondo ..................................................................... 56
4.3.12. Procurement Time-Scales ............................................................................................................. 57
4.3.13. Procurement Procedures ............................................................................................................... 59
4.3.14. Selection Criteria .......................................................................................................................... 60
4.3.15. Contract/Tender Information ........................................................................................................ 61
4.3.16. Cost of Tendering ......................................................................................................................... 62
4.3.17. Pre-qualification of Suppliers ....................................................................................................... 64
4.3.18. Cash Flow Position ....................................................................................................................... 65
CHAPTER FIVE ........................................................................................................... 67
5.0: SUMMARY, CONCLUSIONS AND RECOMMENDATIONS ......................... 67
5.1: Introduction ............................................................................................................................................... 67
5.2: Summary of Results .................................................................................................................................. 67
5.3: Conclusion ................................................................................................................................................. 69
5.4: Recommendations ..................................................................................................................................... 69
REFERENCES .............................................................................................................. 71
APPENDIX 1: QUESTIONNAIRE ............................................................................. 77

ix
APPENDIX 2: SAMPLE SIZE FOR A GIVEN POPULATION SIZE ...................... 84
APPENDIX 3: DESCRIPTIVE STATISTICS OF RESEARCH VARIABLES ......... 86
APPENDIX 4: LIST OF SMEs IN BONDO DISTRICT ............................................. 88

x
LIST OF TABLES
Table.1a & 1b: Number of Employees
Table 2a & 2b: Area of Business
Table 3a & 3b: No. of Years in Operation
Table 4a & 4b: Source of Funding
Table 5a & 5b: Annual Turnover
Table 6a & 6b: SME Dealing in Public Contracts
Table 7a & 7b: Volume of SME Public Contracts
Table 8a & 8b: Roads & Public Works Contracts
Table 9a & 9b: Office of the President
Table 10a & 10b: Agriculture & Regional Development
Table 11a & 11b: Health
Table 12a & 12b: Education
Table 13a & 13b: Local Authority
Table 14a & 14b: Mode of Communicating Public Contracts
Table 15a & 15b: SME Public Contracting Frequencies
Table 16a & 16b: SMEs Dealing in Public Contracts
Table 17a & 17b: Knowledge of PPDA
Table 18a & 18b: PPDA & SME Contracting
Table 19a & 19b: VAT Registration
Table 20a & 20b: Perceived Corruption
Table 21a & 21b: SME Licensing
Table 22a & 22b: Tender Documentation Level
Table 23a & 23b: Available Public Contracts

xi
Table 24a & 24b: Feedback from Contracting Authority
Table 25a & 25b: Lot Sizes
Table 26a & 26b: Framework Arrangements
Table 27a & 27b: Capital / Finance Availability
Table 28a & 28b: Skilled HR Base
Table 29a & 29b: Technology Adoption
Table 30a & 30b: Procurement Time-Scales
Table 31a & 31b: Procurement Procedures
Table 32a & 32b: Selection Criteria
Table 33a & 33b: Contract Information
Table 34a & 34b: Cost of Tendering
Table 35a & 35b: Pre-Qualification of Suppliers
Table 36a & 36b: Cash Flow Information
xii
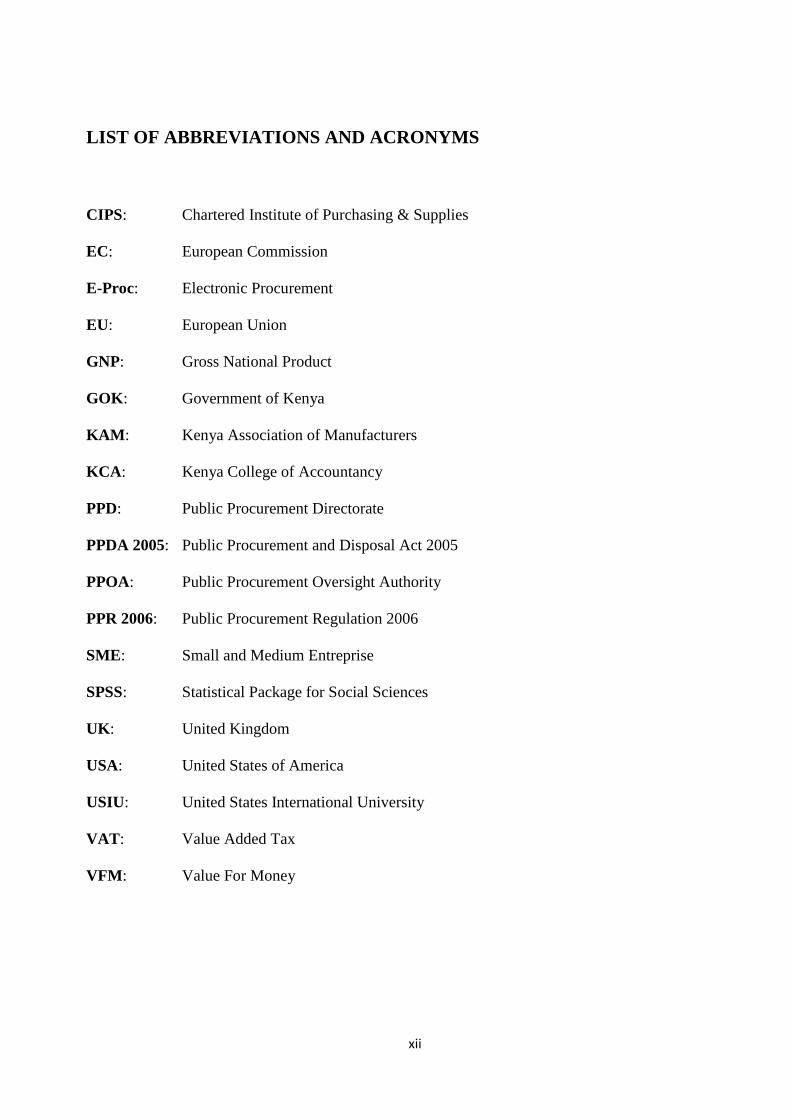
LIST OF ABBREVIATIONS AND ACRONYMS
CIPS: Chartered Institute of Purchasing & Supplies
EC: European Commission
E-Proc: Electronic Procurement
EU: European Union
GNP: Gross National Product
GOK: Government of Kenya
KAM: Kenya Association of Manufacturers
KCA: Kenya College of Accountancy
PPD: Public Procurement Directorate
PPDA 2005: Public Procurement and Disposal Act 2005
PPOA: Public Procurement Oversight Authority
PPR 2006: Public Procurement Regulation 2006
SME: Small and Medium Entreprise
SPSS: Statistical Package for Social Sciences
UK: United Kingdom
USA: United States of America
USIU: United States International University
VAT: Value Added Tax
VFM: Value For Money

1
CHAPTER ONE
1.0. INTRODUCTION
1.1.1. Background of the Study
Small and medium-sized firms are the drivers of the Kenyan economy. They employ about 7.5 million
Kenyans outside the small-scale agriculture. Therefore SMEs are recognized as contributing to the
distribution of wealth, as they allow the middle class to emerge and contribute to the solution of
regional economic imbalances given their greater flexibility in terms of location. This promotes
economic development and improves people‟s lives (Chen, 2006). Despite this important economic
role SMEs play in Kenya, SME‟s continue to face many challenges as they try to propel economic
growth of an economy (Wanjohi, 2009).
Public procurement is the acquisition, whether under formal contract or not, of works, supplies and
services by public bodies. It ranges from the purchase of routine supplies/services to formal tendering
and placing contracts for large infrastructural projects by a wide and diverse range of contracting
authorities (Lysons & Farrington, 2006). The legal framework upon which public procurement is done
is the EU Directives/2004/18/EC (KAM, 2008). EU Directives 2004/18/EC cover the procurement
procedures of all public sector bodies. Kenyan Public Procurement & Disposal Act 2005 (PPDA 2005)
and the Public Procurement & Regulation 2006 were both drafted based on the EU Directives (KAM,
2009).
Accordingly, many SME‟s have had challenges in compliance with the EU Directives/PPDA 2005
putting many of the SME‟s off public contracts (KAM, 2009). Currently Kenya Government is
developing policies that are geared toward supporting SME sector growth through a variety of

2
programs such as the GOK 2010/11 budget which contained effective policies for helping Small and
Medium Enterprises (SME) to boost participation in public contracts and hence the overall national
economic development. Despite this preferential treatment of SMEs by government through allocation
of 10% of all public contracts to SMEs, a comparative tally of public contracts secured by SMEs in
Bondo against those secured by large enterprises are still very small (PPOA, 2011). The choice of
Bondo District to be covered by the study was thus based on the fact that generally many SMEs are
still not securing Public Contracts, (PPOA, 2011).
1.1.2. Small & Medium Enterprises (SME’s)
The term SME covers a wide range of definitions and measures, varying from country to country and
between the sources reporting SME statistics (Kenya Association of Manufactures, 2008). Although
there is no universally agreed definition of SME, some of the commonly used criteria are the number
of employees, value of assets, value of sales and size of capital as well as turnover. Among them the
most common definitional basis used is employees because of the comparative ease of collecting
information and here again there is variation in defining the upper and lower size limit of an SME,
(KAM, 2008).
In developing countries the number of employees and size of assets or turnover for SMEs tend to be
much smaller compared to their counterparts in developed countries due to their relative size of
business entities and economies (World Bank, 2007). Types and features of Small Scale Business in
Kenya survivalist enterprises are activities by people unable to find a paid job or get into an economic
sector of their choice. Common features include low income standard, with little capital invested,
virtually no skills training in the particular field and only limited opportunities for growth into a viable
business besides poverty and the attempt to survive being the main characteristics of this category of
enterprises. The European Union (EU) categorizes companies with fewer than 50 employees as small

3
and those with fewer than 250 employees as medium (Kibas, 2004: EU Commission, 2006). This is
the definition of SMEs adopted in this study.
Small enterprises constitute the bulk of the established businesses. The enterprises would usually be
owner-managed or directly controlled by the owner-community and are mostly family owned. They
are likely to operate from businesses/industries in various business sectors like retailing,
manufacturing, professional services and construction-like formalities. Medium Enterprises constitute
a category which is difficult to demarcate vis-à-vis the “small” and “large” business categories. SME‟s
are still viewed as basically owner/manager-controlled, though the shareholding or community control
base could be more complex. SMEs in Kenya are generally distinguished by the nature of their
production and management arrangements, trading relations, financial practices, internal competence
etc. (KAM, 2008).
According to KAM (2008) SMEs in Kenya typically have the following features in varying degrees;
they are small units, often rural-based and family owned, most of them are small independent
enterprises, standing alone and producing for a well-defined market, some are specialized firms,
producing specialized products, selling to the international and /or local markets, they rely on low cost
raw materials, low energy costs, low labor costs, and are characterized by low division of labor,
flexible and often small production runs, they have low capital formations and finally, they are largely
labor intensive units with low–level technologies; but one needs to note the emergence of high skill
and technology-intensive SMEs.
A large part of the economic system in many countries, whether developed or developing, is formed
by small and medium sized enterprises (SMEs). These enterprises are considered by various
researchers, to be essential for the economic development of those countries (Praag and Versloot,
2007). As an example, in the European Union (EU), Small and Medium Enterprises represent more

4
than 98 percent of the firms and serve as a crucial foundation for the labor market in the member
countries (Smallbone and Rogut, 2005). Apart from the crucial role that these SMEs play in the
economies of these countries, these organizations generally encounter various weaknesses and
challenges (Smallbone and Rogut, 2005: Smith and Smith, 2007: Joubert, 2004).
1.1.3. Public Contracting and SME’s
The contribution of the Small and Medium Enterprises (SME‟s) to the economy of a nation is well
recognized. In developing countries, it is believed, the contribution of SME‟s towards employment
generation is significant. The EU Code of Best Practices for SME access to procurement introduced in
2008 stated that increased involvement of SMEs in public procurement would result in higher
competition for public contracts, leading to better value for money (VFM) for contracting authorities.
Public procurement is the process by which government departments or agencies purchase goods and
services from the private sector (Lysons & Farrington, 2006). It takes place at both a national and
regional level. The procurement process would usually be subject to specific rules and policies
covering how the relevant decisions are made.
In order to achieve value for money in the public sector, the status of the procurement department
needs to be advanced by appointing a senior management representative and by either developing
internal capabilities or recruiting externally (Lysons and Farrington, 2006). Common purchases should
be centralized, and policies and procedures established to regulate the buying activities of internal
clients. Supply and demand needs to be aligned through vertically integrated information flows and
robust operational systems. Strategic source planning should be carried out, a category management
system adopted, relevant suppliers appraised and selected, and appropriate relationships adopted.
Supply performance monitoring, and relationship management are key on-going activities to
streamline public contracting and achieve value for money (Lysons and Farrington, 2006).

5
There are a number of barriers to achieving value for money in the public sector that may include:
Procurement objectives in the public sector have always been unclear. A diverse range of stakeholders
in public contracting situations do exist and it is not always obvious which group takes precedence.
Procurement strategies have been driven by EU directives and require prescriptive and formulated
sourcing approaches. Collaborative relationships with suppliers are difficult to justify. There is also
considerable political intervention, an emphasis on budgetary control, and a risk-averse culture in
public contracting. Supply chain strategies must thus be designed to achieve value for money, but it is
not always clear what this entails. Procurement competences have not been well developed to
operationalize designed strategies. Decision-making is often slow and bureaucratic, and public sector
organizations often have a remit to pursue environmental and social objectives which may contradict
commercial imperatives (CIPS, 2012)
1.1.4. SMEs in Bondo District
Bondo District is geographically located to the western region of Kenya just along the Equator. Bondo
is bounded by Rarieda, Siaya, and Gem Districts. Bondo District covers 1328 square kilometers (km2);
out of which 715 km2 is covered by water while 593 km
2 islands. Bondo had a population of 157,522
(GOK, 2009). Bondo District had three administrative divisions namely Maranda Division, Usigu
Division and Nyangoma Division. There are 210 SME‟s in Bondo District registered with the Town
Council of Bondo. The SME‟s operate in various sectors from building and construction,
transportation, food and beverage, fishing, textiles, automotive repairs and general supplies. Public
contracting rules applicable in Bondo District are virtually guided by the Public Procurement and
Disposal Act (PPDA) of 2005 and the Public Procurement Regulations of 2006.

6
1.2.0. Research Problem
Many studies show that SMEs are the driving engine of growth, job creation and competitiveness in
domestic and global markets. They also play a pivotal role in innovation and productivity growth
(Blackburn and Athayde, 2000). Some of the SME surveys that have been done, the most conclusive
one have focused on issues such as access to capital and financial intermediation assuming that a key
concern for any business is how to find additional capital to expand (Esselaar et al, 2007). The
experience of Fina Bank in lending to SME‟s found that the major challenges faced by SME‟s is poor
credit history and lack of collateral for funding towards bid bonds and projects (Wasonga, 2008).
There is a wide range of general and specific information that SMEs need in the course of their
operation that is suitable for their sustainability.
Wanjohi (2009) and the Kenya Association of Manufacturers (KAM) (2009) note that one of the
major challenges that SMEs face in the course of doing business in Kenya is inadequate business
information. Others include: lack of and/or inadequate managerial training and education and skills,
lack of access to credit both for start up and expansion of the business, unfavourable national policy
and regulatory environment.
Similarly, Economic Survey Document of World Bank (2004) notes that limited access to information
is one of the major problems that SMEs encounter. Others are; unfavourable business policy
environment and unfavourable taxation regime, inhibitive legal and regulatory environments, limited
access to markets and limited access to financial services, inadequate access to skills and technology,
inadequate business skills, limited access to infrastructure, limited linkages with large enterprises,
gender inequality and entry barriers (whether formal and/or informal) and health and safety in
workplaces and HIV/AIDS. All of these studies have been based on SME‟s in Nairobi and its environs
but with little attention to the challenges facing SMEs in accessing public sector contracts in other

7
counties. There are no doubt the challenges that the SMEs contend with in accessing public sector
contracts are enormous but some SMEs and governments are striving to overcome them. Today, the
Kenya Government has been in the forefront in advocating for the youth access to Government
Contracts. This has been evidenced by the Presidential Directive on Youth Access to Govermnent
Procurement (PPOA, 2011). Presently, persuant to the Regulation 6 of the Public Procurement and
Disposal ( Preference and Reservations) Regulation, 2011, there is the National Sensitisation and
Recruitment Drive on Youth Access to 10% of all Government Procurements (PPOA, 2011).
This preferencial treatment for SMEs by Government is meant to develop the SME sector and hence
the general economy of the country. Despite this preferential treatment of SMEs by government
through allocation of 10% of all public contracts to SMEs, a comparative tally of public contracts
secured by SMEs in Bondo against those secured by large enterprises are still very small (PPOA,
2011). The choice of Bondo District to be covered by the study was thus based on the fact that
generally many SMEs are still not securing Public Contracts, (PPOA, 2011). It is believed that there
are other challenges that SME‟s face in accessing public contracts which may have included lack of
information, large contract sizes besides financial challenges (Wanjohi, 2009). The youth, who own
most SMEs, still have problems with meeting the goverment requirements for public contracting
among other things, business registration/incorporation certificate, PIN certificate as well as VAT
compliance certificate. The SMEs in Bondo District are, by no exception, equally challenged but
probably uniquely. This study therefore focused on surveying the various challenges SMEs are facing
in accessing public sector contracts, a survey of Bondo District, Kenya. As a consequence, the
motivation for this study was to find reponses to the following issues:
1. What are the main challenges faced by SMEs in accessing public contracts in Bondo?
2. What types of public contracts are often secured by SMEs in Bondo?

8
1.3.0. Research Objectives
The main objectives of this survey was as follows:
1. To determine the main challenges faced by SMEs in accessing public contracts in Bondo District.
2. To determine the types of public contracts often secured by SMEs in Bondo District.
1.4.0. Value of the Study
Academic institutions in any country are bestowed with the duty of creating and disseminating
knowledge. Findings of this research as regards the challenges in accessing public sector contracts by
SMEs in Kenya and the steps these SMEs can undertake to counter the challenges form a basis from
which the teaching fraternity can refer during their day to day activities while at the same time as a
reference for further research for those who would want to pursue the subject further. The results of
this study would also find practical application in SME organizations whose managers are faced with
the question of what to do to remain afloat in the face of the challenges. The research results would
also give the banking sector a glimpse into the effects that the financial crisis has had on SMEs. This
probably would inform their decisions as far as provision of services like credit to SMEs would be
concerned. Policy makers and especially the government would stand to benefit from the study‟s
recommendation regarding public sector procurement policy measures that would alleviate the
challenges and ensure that SMEs do not go under but continue to flourish and thus improve the
standard of living of Kenyans by giving them a source of earning through employment. The research
also would benefit shareholders of SMEs in respect to possible areas of investment. Credit and risk
department in financial institutions stand to understand the expected business cycle in SMEs and
determine lending methodologies that would accommodate such SMEs. Investors in SME businesses
and specially the equity investors would also benefit from the understanding of how SME businesses
are affected by challenges and how to cushion themselves from the turmoil while generating
maximum returns.

9
CHAPTER TWO
2.0. LITERATURE REVIEW
The literature review briefly covers the role of SME‟s in economic development, the framework of
public contracting, the impact of public procurement framework on SME‟s in accessing public
contracts and would exhaustively review the literature on the challenges facing SME‟s in accessing
public contracts as well as the government initiatives facilitating SME‟s acccess to public contracts.
2.1. The Role of SMEs in Economic Development
Many researchers and scholars have hailed the importance of SMEs and this cannot be over
emphasized. For example, Arianoff (2010) notes that in Belgium, SMEs account for well over 70
percent of the GDP and that the profitability of SMEs is much higher than that of the large companies.
Kenyan Economic Report (2009) reveals that in Kenya, SMEs produce 77 percent of the total jobs
while Kenya Association of Manufacturers (KAM) (2009) observes that in Kenya the SMEs
contribute about 85 percent level of employment. Presenting the case of Europe, Ashby (2007)
observes that SMEs are essential since they have the capability to provide what large companies or
large business ventures are unable to offer.
Small and medium-sized firms are the drivers of the Kenyan economy. They employ about 7.5 million
Kenyans outside the small-scale agriculture. Therefore SMEs are recognized as contributing to the
distribution of wealth, as they allow the middle class to emerge and contribute to the solution of
regional economic imbalances given their greater flexibility in terms of location. This promotes
economic development and improves people‟s lives (Chen, 2006). The SME sector is the sector in
which most of the world‟s poor people are working (Wasonga, 2008). The sector therefore contributes

10
significantly to employment creation. The contribution of the SMEs to the economy of a nation is thus
well recognized. While individually an SME may not have a significant impact on the economy like
the large corporations do, their cumulative social and environmental impact is significant. Therefore,
SMEs are recognized as contributing to the distribution of wealth, thus promoting economic
development and improving people‟s lives (Chen, 2006). SMEs complement the work of larger
enterprises, serving as suppliers of materials, and operating in areas incompatible with these larger
enterprises, as well as stimulating economic growth.
2.2. The EU Directives & Public Sector Contracting
The legal framework upon which public contracting is done is the EU Directives/2004/18/EC (KAM,
2008). EU Directives 2004/18/EC cover the procurement procedures of all public sector bodies.
Kenyan Public Procurement & Disposal Act 2005 (PPDA 2005) and the Public Procurement &
Regulation 2006 were both drafted based on the EU Directives (KAM, 2009).
Accordingly, many SME‟s have had challenges in compliance with the EU Directives/PPDA 2005
putting many of the SME‟s off public contracts (KAM 2009). Currently Kenya Government is
developing policies that are geared toward supporting SME sector growth through a variety of
programs such as the GOK 2010/11 budget which contained effective policies for helping small and
medium enterprises (SME) to boost participation in public contracts and hence the overall national
economic development.
EU Public Procurement Directives and in effect the PPDA 2005 give a prominent guide to
transparency, considering it is fundamental to the elimination of distortions and discrimination in these
markets. They require that invitations to tender with an expected contract value above established
thresholds are published in the Official Journal of the European Union (OJEU).

11
Another important element of transparency is the publication of the final outcome of public
procurement procedures. In a competitive environment, free of collusive practices, competitors can
monitor the results of tendering processes and improve their future bids. This too puts downward
pressure on prices over time. The number of contract award notices published in the Official Journal
of the European Union has been growing steadily in recent years in compliance with the EU Directives
(CIPS, 2012).
Public sector contracts should be awarded in line with the Government‟s value for money policy.
There is cosiderable scope for encouraging improved competition and performance in public sector
contracts outside an individual procurement cycle, where policy and legal obligations are not as
prevalent as inside the cycle. Many of these areas can be considered outside an individual
procurement cycle e.g. encouraging open, fair and transparent sub-contracting, developing structured
relationship management approaches or developing policies on the use of SMEs or Minority Owned
Businsses and Social Enterprises.
According to EU Directives, it is very important that the public procurement function is discharged
honestly, fairly, and in a manner that secures best value for public money. Contracting authorities must
be cost effective and efficient in the use of resources while upholding the highest standards of probity
and integrity. Procurement practices are subject to audit and scrutiny under the Comptroller and
Auditor General (Amendment) Act 1993 and Accounting Officers are publicly accountable for
expenditures incurred. Management in Government Departments and Offices should ensure that there
is an appropriate focus on good practice in purchasing and where there is a significant procurement
function that procedures are in place to ensure compliance with all relevant guidelines.
In general, a competitive process carried out in an open, objective and transparent manner can achieve
best VFM in public procurement. This is in line with Kenyan PPDA 2005 and the EU Directives on

12
Public Procurement. Essential principles to be observed in conducting the public procurement function
includes non-discrimination, equal treatment, transparency, mutual recognition, proportionality,
freedom to provide service and freedom of establishment. The Directives impose legal obligations on
public bodies in regard to advertising and the use of objective tendering procedures for contracts
above certain value thresholds.
2.3. The Impact of EU Directives on SME’s Access to Public Contracts .
In the past decades, the public procurement system in Kenya has undergone significant developments.
From being a system with no regulations in the 1960s, and a system regulated by Treasury Circulars in
the 1970s, 1980s and 1990s. The introduction of the Public Procurement and Disposal Act (PPDA) of
2005 and the Public Procurement Regulations of 2006 has introduced new standards for public
procurement in Kenya.
In many countries, intensive purchasing makes the government a dominant buyer of a wide range of
goods and services. But in the interests of administrative efficiency and in the search for economies in
purchasing, government purchasing agencies tend to place their orders in relatively large amounts at a
time, and often by selective tender. Hence, the government‟s purchasing activities inevitably
discriminate, albeit unwittingly, against SMEs. Procurement concerns have given rise to a fruitful area
of research. It is often argued that governments should promote SMEs because of their greater
economic benefits compared to large firms in terms of job creation, efficiency, and growth (Vala,
2009).
In most countries, microenterprises and small-scale enterprises account for the majority of firms and a
large share of employment. Therefore, it may be the policy of the Government to provide maximum
practicable opportunities and initiatives for SME participation in public contracts. SMEs can

13
participate in public-sector procurement in one of two ways. They can either directly contract with a
public body, or participate as a sub-contractor to a prime contractor. This paper thus focused only on
direct SME participation. It tries to identify different levels of government generation of procurement
policies that may help achieve SME-related policy goals.
2.4. SME Challenges in Accessing Public Sector Contracts
Even though there is great growth potential for the country‟s economy attributed to SMEs, the owners
have to put up with numerous challenges for the opening up, maintenance and expansion of their
ventures. Such challenges could be of human resources, awareness, management, finanancing,
institutional and infrastractural issues. The management challenges refer to the ability of owner-
managers to administer their own business with a vision of the effect this would have on their
businesses. The human resource challenge is viewed as the personnel who are contracted by the SMEs
and the quality of the same (Smith and Smith, 2007), as well as in the role of the owner-managers in
contracting personnel and the inherent challenges to this process (Bartlett and Bukvic, 2001).
Awareness is defined by Baron and Shane (2007) as the competitive force, the most important force
that an enterprise can have. Most SME managers and employess can not afford to buy newspapers on
a daily basis nor do they have access to internet where most public contracts are advertised. Some
public tenders are placed on notices of various public offices thus quite inaccessible to most SMEs.
This shows that information on public tenders are majorly inaccessible to most SMEs especially those
that are placed far away from the District Headquarters. The acquisition, promulgation and
transference within SMEs are themselves challenges (Olwale and Garwe, 2010).
Inadequate education and skills is another key concern where the majority of those who run SMEs are
staff whose educational background are insufficient to carry out managerial routines for their

14
enterprises (King and McGrath, 2002). Typically SME owners develop and use their own approach to
management, through, a process of trial and error instead of using formal business management
methods (Hill, 2007). As a result, their management style is likely to be more intuitive than analytical,
more concerned with day-to-day operations than long–term issues, and more opportunistic than
strategic in its concept (Hill, 2007). Since Public Contracts are characterized by orderly documentation
virtually attainable with the experienced and well trained managers quite lacking in most SMEs, SMEs
end up not succeeding in getting public contracts.
In order to bid for public contracts, SMEs have got to have enough capital that can be used to acquire
the tendered items. Public contracts are characterized by big lot sizes which require huge capital to
service. The challenges of funding is defined as one of the perennial problems for small-sized
enterprises in accessing public contracts and it is related to the difficulty of access to credit and credit
guarantees (Krasniqi, 2010). Even upon some SMEs getting the public contracts, SMEs often don‟t
have access to credit hence always operating on a tight budget where focus is on short-term returns
and so would not be able to fulfill the public contract requirements (Kasekende and Opondo, 2003). A
key concern for the SME business thus becomes how to find additional capital to expand (Kasekende
and Opondo, 2003). This would give the SMEs the financial capacity to bid for public contracts and
service them on access.
As a developing country, Kenya still lags behind with respect to key infrastructure commitments such
as roads, electricity, water, communication etc. Good infrastructure is a pillar of sound business and
without it the business is weakened in its operations. This condition gives rise to a new challenge
which is the uptake of new information technology in SME. Infrastructure is viewed as a challenge for
SMEs, as the quality of this can affect the prospects of SME cost competitiveness, especially in
developing countries, because many of these countries suffer from a deplorable lack of basic
infrastructure, such as transport, telecommunications and electricity (Olawale andGarwe, 2010). Poor

15
infrastructure means SMEs don‟t have exposure to the new technologies which if implemented may
offer a substantial cost reduction to the business and offers a competitive advantage for the SMEs.
Since most public contracts have clearly set specifications the most common competitive dimension is
left for VFM. With cost advantage pocketed by SMEs attributed to good infrastructure as seen in large
companies enjoying economies of scale, SMEs can comfortably compete for public contracts on the
same footage with large firms. The prevalence of poor infrastructure thus becomes a major challenge
to SMEs in accessing public contracts.
The institutional challenge is defined as the policies and regulations that can affect the activities of a
small enterprise (Shi and Li, 2006; Baron and Shane, 2007). Public contracts driven by EU Directives
and PPDA 2005 usually require SME suppliers which are legally registered and value added tax-
compliant. Most SMEs usually lack „formality‟ in terms of business licenses, value-added tax (VAT)
registration, formal business premises, operating permits and accounting procedures required by the
Public Procurement and Disposal Act (2005) as well as the Public Procurement Regulations (2006).
Tax avoidance and non-compliance with various business registration formalities could be attributed
to their limited capital base and only rudimentary technical or business skills among their operators
(Wasonga, 2008). Since most of them lack these important documents, they are often eliminated in the
very first stages of public contracting. Additionally, a clear government policy to guide SME
development is not in operation thus SME‟s fail to grow beyond the traditional “family business” into
either regional and/or global reach.
The EU Directives insistence on quality and VFM makes various public contracting authorities to
insist on past works, supplies or service experience of similar nature. This is usually lacking with most
SMEs. Most SMEs thus fail to secure public contracts due to lack of past experience leaving large
enterprises at the helm of enjoying most public contracts, (EC, 2003).

16
CHAPTER THREE
3.0: RESEARCH METHODOLOGY
3.1. Introduction
This chapter explains the ways data was gathered, analysis, interpretation and presentation was carried
with the goal of transforming the primary data into information that could add value to this study. It
consists of the following areas:
3.2. Research Design
The research employed a sample survey, of descriptive methodology where data collection about the
sample was collected through self administered questionnaires. Survey studies are normally intended
to describe and report the way things happen. The sample survey was chosen since it would allow for
the collection of a large amount of data in a relatively short period of time hence cost effective. The
survey sought to get information from the employees of the SMEs regarding their perception on
challenges SME are facing in accessing public sector contracts since they have front-line experience.
An analysis of the patterns and themes that generated from this survey was then used to formulate
generalizations. Essentially, from certain generalizations (in terms of theories, general laws or
observations) by examining a set of particular observations led to some conclusion (Muganda, 2010).
3.3. Population
The study population was made up of all the 210 SMEs registered in Bondo District. (Town Council
of Bondo, 2012). The choice of Bondo District to be covered by the study was based on the fact that
many SMEs are generally not securing Public Contracts, (PPOA, 2011), besides the convenience
attributed to the ease of accessibility, time schedule and financial resources available to the researcher.

17
3.4. Sample Size
A sample was selected using a stratified random sampling method. The SMEs were stratified into
various types of businesses, including, Building & Construction, Hotels & Restaurants, Office
Equipment & Stationers etc. With this sampling method, respondents within each stratum had an equal
chance of being selected to participate in the study randomly. This method ensured that all the
business types in the target SME population were represented. On the basis of Sekaran, (2006) sample
size framework for a given population, a sample size of 136 SMEs (Appendix 3) was used in this
study out of a possible population size of 210 SMEs.
3.5. Data Collection
Primary data was collected through structured questionnaires. The structured questionnaire by
definitions is a group of structured questions with each item in the questionnaire developed to address
a specific objective or research question of the study (Mugenda and Mugenda, 2003). This tool of data
collection was chosen due to the ease with which it could be administered. It had been widely asserted
that a self-administered questionnaire was the most efficient and cost effective method to collect data
pertaining to the various aspects of public behaviors (Yoo et al, 2005: (Washban and Plank, 2006).
With the help of research assistants, the questionnaires were dropped to the SME premises for owner-
managers and employee-managers as targeted respondents since they were best placed to have the
required information by virtue of their position. In this study the questionnaires had two distinct parts.
The first part collected background information of the SMEs from respondents. The second part was
the main questionnaire intended to determine challenges to accessing public sector contracts by SMEs
in Kenya.
The first survey step was concerned with the collection of data from the owner-managers of the SMEs
from Bondo District. In this step, the objective was to identify the main challenges encountered by

18
SMEs in accessing public sector contracts. Following this, the search for entrepreneurs for
participating in the survey was started. A list of around 210 SMEs was obtained from the Town
Council of Bondo from which 136 SMEs were chosen as a representative sample. The data and
observations were then collated in the questionnaires.
3.6. Data Analysis
The collected data was then edited centrally to detect errors and omissions, ensure data was accurate,
uniformly entered, complete and consistent with intent of the questions and other information in the
survey and arranged to simplify coding and tabulation. Alphanumeric data coding was carried out to
assign numbers and other symbols to the questions which were done in order to group the respondents
to a limited number of categories that facilitated efficient analysis.
Data collected was analyzed using descriptive statistics. This involved use of various tables
summarizing frequencies and percentages. A list of tables showing frequency distribution and
percentage occurrence of the variables under study was then generated. Further analysis was done to
establish the mean responses, standard deviation as well as the coefficient of variations for each
variable to determine the consistency of the findings.
The analysis was tied to each objective so as to reach reliable conclusions. The statistical package for
Social Sciences (SPSS) software was employed to help analyze the responses.

19
CHAPTER FOUR
4.0: DATA ANALYSIS, RESULTS AND DISCUSSIONS
4.1.0. Introduction
This study had twin objectives of determining the challenges facing SMEs in accessing public sector
contracts in Bondo district and also to determine the type of contracts often given to SMEs in Bondo.
In seeking to achieve these objectives, a total of 136 questionnaires were administered to the owner
managers and employee managers of each SME in the sample. Of these, 122 questionnaires were
successfully filled. The response rate was thus 89.71%, which compares favourably with Punch‟s
(2003) stipulation of an acceptable response rate. Punch(2003) indicated that high response rates help
to ensure that survey results are representative of the target population. Punch(2003) indicated that
acceptable response rates vary by how the survey is administered. For e-mail and face-to-face
administered questionnares, a response rate of above 60% is considered adequate (Punch 2003).

20
4.2.0. Background of SMEs in Bondo District
4.2.1. Size of SMEs in Bondo District.
Table.1a: Number of Employees
Variable Frequency Percent Valid Percent
Cumulative
Percent
Valid 1-50 Employees 116 95.1 100.0 100.0
Missing System 6 4.9
Total 122 100.0
Source: Research Data (2012)
Table.1b: Number of Employees
Variable N Minimum Maximum Mean Std.
Deviation
Coefficient
of
Variation
No of
Employees
116 1 1 1 0 0
Source: Research Data (2012)
The factors here were categorised into five SME sizes. These included SMEs with 1-50 employees,
51-100 employees, 101-150 employees, 151-200 employees and 201-250 employees. According to
Table 1a, 100% of the respondents indicated that the size of their SMEs had between 1-50 employees.
The other categories of SME size of employees constituted 0%. This implied that in Bondo District the
employee base of SMEs ranges between 1- 50 employees.

21
According to Table 1b, the mean response was one(1) with zero standard deviation from the mean
indicating zero variability thus very high level of consistency. Since the research objective was to
determine the challanges faced by SMEs in accessing public contracts in Bondo, the size of SMEs
here was of great importance and was found to be between 1-50 employees. The employee base of
SMEs in Bondo thus is still low indicating little growth. Accessing public contracts would probably let
them grow and employ more people.
4.2.2. Area of Business
Table 2a: Area of Business
Variable Frequency Percent Valid Percent
Cumulative
Percent
Valid Building & Construction 22 18.0 19.0 19.0
Stationary & Office
Equipment
20 16.4 17.2 36.2
Carpentry & Steel
Fabrication
32 26.2 27.6 63.8
Oil & Petroleum Sector 10 8.2 8.6 72.4
Automotive Supplies &
Garage
22 18.0 19.0 91.4
General Hardware 10 8.2 8.6 100.0
Total 116 95.1 100.0
Missing System 6 4.9
Total 122 100.0
Source: Research Data (2012)

22
Table 2b: Area of Business
Variable N Minimum Maximum Mean Std.
Deviation
Coefficient
of
Variation
Area of Business 116 1 8 3.34 0.37 0.110778443
Source: Research Data (2012)
The following areas of business were considered: building & construction, stationary & office
eqipment, restaurants, food & beverage, carpentry/steel fabrications workshops, oil & petroleum,
automotive supplies & garage, general retail stores, general hardwares and transport.
According to Table 2a, 27.6% of the respondents had their business in Carpentry/Steel Fabrication,
19% were in Building & Construction as well as in Automotive Supplies & Garages, 17.2% were in
Stationery & Office Equipment and 8.6% had their SMEs dealing in General Hardwares as well as Oil
& Petroleum products.
According to Table 2b, the mean response was 3.34 with a 0.37 standard deviation from the mean and
11.08% coefficient of variation, indicating low variability thus very high level of consistency. Since
the research objective was to determine the challenges faced by SMEs in accessing public contracts in
Bondo, the area of business here was of great importance to establish the SMEs business areas that
may be facing the challenges. Most SMEs were found to be dealing in the carpentry & steel
fabrication industry besides the automotive supplies & garages as well as building & construction.

23
4.2.3. Number of Years in Operation
Source: Research Data (2012)
According to Table 3b, of all the respondents, 39.7% had their SMEs having operated business in Bondo
District for over 10 years. 22.4% had operated for between 6-10 years, 20.7% had operated for 1-5
years while 17.2% had only operated business for less than 1 year and thus still new in the district.
Table 3a: No. of Years in Operation
Variable N Minimum Maximum Mean Std.
Deviation
Coefficient of
Variation
No. of Years in
Operation
116 1 4 3.84 0.456 0.11875
Source: Research Data (2012)
Table 3b: No. of Years in Operation
Variable Frequency Percent Valid Percent
Cumulative
Percent
Valid Less than 1 Year 20 16.4 17.2 17.2
1-5 Years 24 19.7 20.7 37.9
6-10 Years 26 21.3 22.4 60.3
Over 10 Years 46 37.7 39.7 100.0
Total 116 95.1 100.0
Missing System 6 4.9
Total 122 100.0

24
According to Table 3a, the mean response was 3.84 with a 0.456 standard deviation from the mean
and 11.88% coefficient of variation, indicating very low variability thus higher level of consistency.
Since the research objective was to determine the challenges faced by SMEs in accessing public
contracts in Bondo, the number of years in operation would add value the reliability of the challenges
SMEs face in Bondo. The most frequent response being that SMEs in Bondo have operataed for over
10 years was highly consistent and thus reflective of the situation on the ground. A 10 years
experience gives the respondent enough backround information regarding public contracting thus
would be in a position to maintain precision in response.
4.2.4. Major Sources of Funding
Major sources of funding that were considered included bank loans, friends & family, personal savings
as well as donor funnding.
Table 4a: Source of Funding
Variable Frequency Percent Valid Percent
Cumulative
Percent
Valid Bank Loans 66 54.1 56.9 56.9
Personal Savings 50 41.0 43.1 100.0
Total 116 95.1 100.0
Missing System 6 4.9
Total 61 100.0
Source: Research Data (2012)

25
Table 4b: Source of Funding
Variable N Minimum Maximum Mean Std.
Deviation
Coefficient
of
Variation
Source of Funding 116 1 3 1.86 0.299 0.160752688
Source: Research Data (2012)
According to Table 4a, 56.9% of the respondents indicated that they had financed their SMEs through
bank loans while 43.1% had financed their SMEs through personal savings. None of the respondents
had financed their SMEs through either friends & family donations nor donors funding.
According to Table 4b, the mean response was 1.86 with a 0.229 standard deviation from the mean
and 16.08% coefficient of variation, indicating low variability thus higher level of consistency. Since
the research objective was to determine the challenges faced by SMEs in accessing public contracts in
Bondo, SMEs major source of funding would be integral to their public contract access. The most
consistent response was on personal savings thus SMEs in Bondo mainly get funding from personal
savings.
4.2.5. Approximate Annual Turnover for SMEs.
Table 5a: Annual Turnover
Variable N Minimum Maximum Mean Std.
Deviation
Coefficient
of
Variation
Annual Turnover 116 1 4 1.42 0.2413 0.169108911
Source: Research Data (2012)

26
Table 5b: Annual Turnover
Variable Frequency Percent Valid Percent
Cumulative
Percent
Valid Below 1 Million 62 50.8 53.4 53.4
1-2 Million 22 18.0 19.0 72.4
2-5 Million 30 23.2 24.6 97.0
Over 5 million
Total
2
116
1.6
95.1
3
100.0
100.0
Missing System 6 4.9
Total 122 100.0
Source: Research Data (2012)
According to Table 5b, turnover was categorised into below 1 million, 1-2 million, 2-5 million and over
5 million. 53.4% of the respondents had their SMEs approximate annual turnover at below 1 million,
19% had between 1-2 million, 24.6% between 2-5 million while 3% of the respondents were at over 5
million annual turnover.
According to Table 5a, the mean response was 1.42 with a 0.2413 standard deviation from the mean
and 16.91% coefficient of variation, indicating very low variability thus higher level of consistency.
Since the research objective was to determine the challenges faced by SMEs in accessing public
contracts in Bondo, the position of SMEs annual turnover would be integral to their public contract
access. With this high level of consistent response centred on between below 1 million then it
confirms the most frequent response being that most SMEs in Bondo have an approximate annual
turnover of below 1 milion. This implies that if payment for public public contracts completed are

27
delayed then most SMEs here would not fulfill the next public contracts offered thus hampering their
future access to public contracts based on poor performance.
4.2.6. SMEs Dealing in Public Contracts in Bondo
Table 6a: SME Dealing in Public Contracts
Variable Frequency Percent Valid Percent
Cumulative
Percent
Valid Yes 74 60.7 63.8 63.8
No 42 34.4 36.2 100.0
Total 116 95.1 100.0
Missing System 6 4.9
Total 122 100.0
Source: Research Data (2012)
Table 6b: SME Dealing in Public Contracts
Variable N Minimum Maximum Mean Std.
Deviation
Coefficient
of
Variation
SME Dealing in
Public Contracting
116 1 2 1.36 0.285 0.209558824
Source: Research Data (2012)
According to Table 6a, 63.8% of the respondents confirmed having been doing business with public contracting
authorities. 36.2% have not been doing business with public contacting authorities. According to Table 6b,
the mean response was 1.36 with a 0.285 standard deviation from the mean and 20.95% coefficient of
variation, indicating low variability thus higher level of consistency. Since the research objective was

28
to determine the challenges faced by SMEs in accessing public contracts in Bondo, SMEs tendering
for public contracts would be having chances of accessing public contracts. 63.8% SMEs in Bondo
were consistently found to have been tendering for public contracts thus in a position to access public
sector contracts.
4.2.7. Percentage of Annual Turnover Contributed by Public Contracts
Table 7a: Volume of SME Public Contracts
Variable Frequency Percent Valid Percent
Cumulative
Percent
Valid Less than 20% 28 23.0 24.1 24.1
20%-49% 5 8.2 8.6 32.7
50%-74% 11 18.0 19.0 51.7
75%-100% 14 45.9 48.4 100.0
Total 58 95.1 100.0
Missing System 3 4.9
Total 61 100.0
Source: Research Data (2012)
Table 7b: Volume of SME Public Contracts
Variable N Minimum Maximum Mean Std.
Deviation
Coefficient
of
Variation
Volume of SME
Public Contracts
116 1 4 2.19 1.277 0.583105023
Source: Research Data (2012)
According to Table 7, 48.3% of the respondents had their SMEs approximate annual turnover
contributed by public contracts being less than 20%. 8.6% of respondents had their SMEs annual

29
turnover contributed by public contracts being 20%-49%. 19% of respondents had their SMEs annual
turnover contributed by public contracts being 50%-74%. 24.1% of respondents had their SMEs
annual turnover contributed by public contracts being 75%-100%. According to Table 4b, the mean
response was 2.19 with a 1.277 standard deviation from the mean and 58.31% coefficient of variation,
indicating higher variability thus higher level of inconsistency. This could not be relied upon thus the
item (annual turnover contributed by public contracts to SMEs) was discarded.
4.2.8. Public Sectors often Giving Contracts to SMEs in Bondo
Table 8a: Roads & Public Works Contracts
Variable Frequency Percent Valid Percent Cumulative
Percent
Valid Below 5% 72 59.0 62.1 62.1
5%-20% 22 18 19.1 81.2
21%-49% 10 8.2 8.6 89.9
50%-100% 12 9.8 10.1 100.0
Total 116 95.1 100.0
Missing System 6 4.9
Total 122 100.0
Source: Research Data (2012)
Table 8b: Roads & Public Works Contracts
Variable N Minimum Maximum Mean Std.
Deviation
Coefficient
of
Variation
Roads & Public
Works Contracts
116 1 4 1.37 0.296 0.216243655
Source: Research Data (2012)

30
According to Table 8a, 62.1% of the respondents had their public contracts given by Roads & Public
Works department being below 5%. 19.1% of the respondents had their public contracts given by
Roads & Public Works department being between 5%-20%. 8.6% of the respondents had their public
contracts given by Roads & Public Works department being 21%-49%. 10.1% of the respondents had
their public contracts given by Roads & Public Works department being between 50%-100%.
However, according to Table 8b, the mean response was 1.37 with a 0.296 standard deviation from the
mean and 21.62% coefficient of variation, indicating higher level of consistency. Since the research
objective was to determine the challenges faced by SMEs in accessing public contracts in Bondo,
knowledge of public sectors often giving contracts to SMEs would be integral to their public contract
access. The most frequent response was that SMEs in Bondo receive below 5% of public contracts
from roads and public works. Mean response analysis established that the most consistent response
was also on below 5% public contracts being given by roads & public works. This position is
confirmatory thus led to this item being relied upon to make implications regarding the the research
objectives.
Table 9a: Office of the President
Variable Frequency Percent Valid Percent Cumulative
Percent
Valid Below 5% 52 42.6 44.8 44.8
5%-20% 40 32.8 34.5 79.3
21%-49% 10 8.2 8.6 87.9
50%-100% 14 11.5 12.1 100.0
Total 116 95.1 100.0
Missing System 6 4.9
Total 122 100.0
Source: Research Data (2012)

31
Table 9b: Office of the President
Variable N Minimum Maximum Mean Std.
Deviation
Coefficient
of
Variation
Office of the
President
116 1 4 1.09 0.198 0.181818182
Source: Research Data (2012)
According to Table 9a, 44.8% of the respondents had their public contracts given by office of the
president department being below 5%. 34.5% of the respondents had their public contracts given by
office of the president department being between 5%-20%. 8.6% of the respondents had their public
contracts given by office of the president department being 21%-49%. 12.1% of the respondents had
their public contracts given by office of the president department being between 50%-100%. The most
frequent response was that below 5% of public contracts in SMEs came from Office of the President.
According to Table 9b, further analysis indicated that the mean response was 1.09 with a 0.198
standard deviation from the mean and 18.18% coefficient of variation, indicating lower variability thus
higher level of consistency. Since the research objective was to determine the challenges faced by
SMEs in accessing public contracts in Bondo, knowledge of public sectors often giving contracts to
SMEs would be integral to their future public contract access. The most consistent response was on
being below 5% of public contracts to SMEs being given by Office of the President.

32
Table 10a: Agriculture & Regional Development
Variable Frequency Percent Valid Percent Cumulative
Percent
Valid Below 5% 42 68.9 72.4 72.4
5%-20% 5 8.2 8.6 81.0
21%-49% 5 8.2 8.6 89.7
50%-100% 6 9.8 10.3 100.0
Total 58 95.1 100.0
Missing System 3 4.9
Total 61 100.0
Source: Research Data (2012)
Table 10b: Agriculture & Regional Development
Variable N Minimum Maximum Mean Std.
Deviation
Coefficient of
Variation
Agriculture &
Regional
Development
116 1 4 1.46 0.263 0.1798863636
Source: Research Data (2012)
According to Table 10a, 72.4% of the respondents had their public contracts given by Agriculture &
Regional Development department being below 5%. 8.6% of the respondents had their public
contracts given by Agriculture & Regional Development department being between 5%-20%. Another
8.6% of the respondents had their public contracts given by Agriculture & Regional Development
department being 21%-49%. 10.3% of the respondents had their public contracts given by Agriculture
& Regional Development department being between 50%-100%.

33
According to Table 10b, the mean response was 1.46 with a 0.263 standard deviation from the mean
and 17.99% coefficient of variation, indicating lower variability thus higher level of consistency. The
response on Agriculture & Reginal Development being highly consistent confirms position of the most
frequent response that below 5% of public contracts accessed by SMEs in Bondo come from
Agriculture & Regional Development sector.
Table 11a: Health
Variable Frequency Percent Valid Percent
Cumulative
Percent
Valid Below 5% 66 54.1 56.9 56.9
5%-20% 30 24.6 25.9 82.8
21%-49% 10 8.2 8.6 91.4
50%-100% 10 8.2 8.6 100.0
Total 116 95.1 100.0
Missing System 6 4.9
Total 122 100.0
Source: Research Data (2012)
Table 11b: Health
Variable N Minimum Maximum Mean Std.
Deviation
Coefficient
of
Variation
Health 116 1 4 1.28 1.304 0.191075269
Source: Research Data (2012)

34
According to Table 11a, 56.9% of the respondents had their public contracts given by Health department
being below 5%. 25.9% of the respondents had their public contracts given by Health department
being between 5%-20%. 8.6% of the respondents had their public contracts given by Health
department being 21%-49%. Another 8.6% of the respondents had their public contracts given by
Health department being between 50%-100%. According to Table 11b, the mean response was 1.28
with a 0.245 standard deviation from the mean and 19.11% coefficient of variation, indicating higher
level of consistency. The response on Health sector being highly consistent confirms position of the
most frequent response that below 5% of public contracts accessed by SMEs in Bondo come from the
Health sector.
Table 12a: Education
Variable Frequency Percent Valid Percent
Cumulative
Percent
Valid Below 5% 43 70.5 74.1 74.1
5%-10% 9 14.8 15.5 89.7
11%-20% 1 1.6 1.7 91.4
50%-100% 5 8.2 8.6 100.0
Total 58 95.1 100.0
Missing System 3 4.9
Total 61 100.0
Source: Research Data (2012)
35
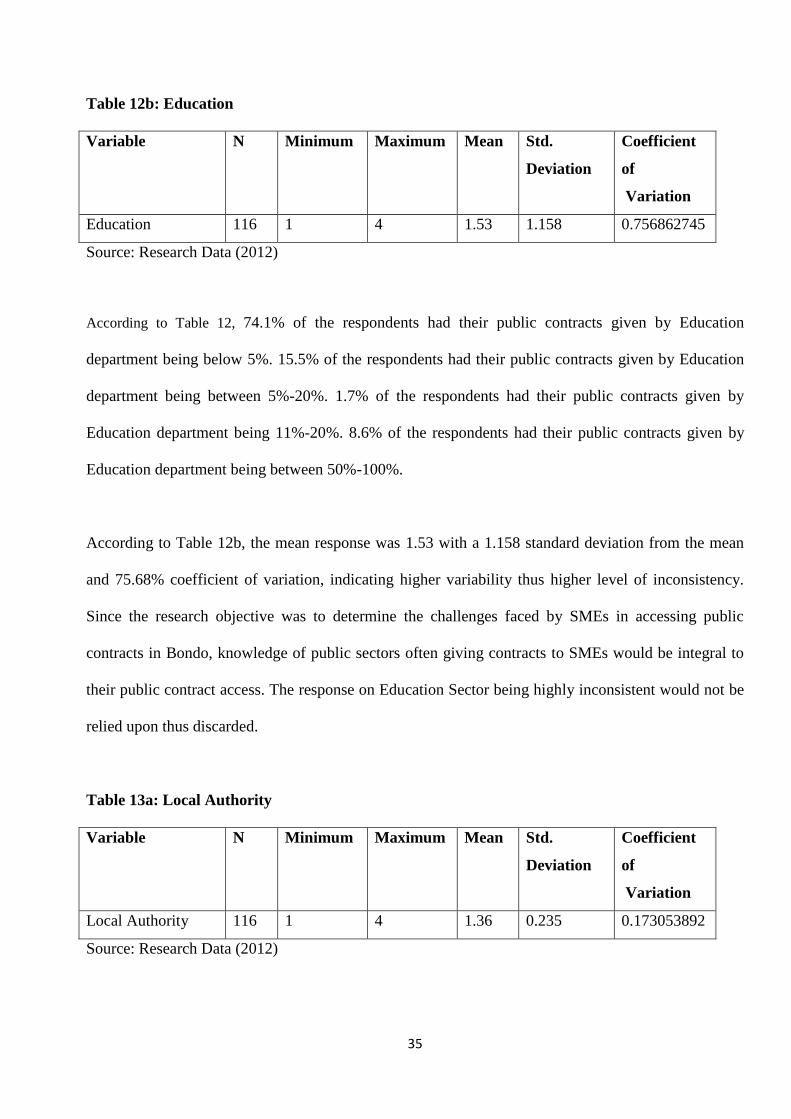
Table 12b: Education
Variable N Minimum Maximum Mean Std.
Deviation
Coefficient
of
Variation
Education 116 1 4 1.53 1.158 0.756862745
Source: Research Data (2012)
According to Table 12, 74.1% of the respondents had their public contracts given by Education
department being below 5%. 15.5% of the respondents had their public contracts given by Education
department being between 5%-20%. 1.7% of the respondents had their public contracts given by
Education department being 11%-20%. 8.6% of the respondents had their public contracts given by
Education department being between 50%-100%.
According to Table 12b, the mean response was 1.53 with a 1.158 standard deviation from the mean
and 75.68% coefficient of variation, indicating higher variability thus higher level of inconsistency.
Since the research objective was to determine the challenges faced by SMEs in accessing public
contracts in Bondo, knowledge of public sectors often giving contracts to SMEs would be integral to
their public contract access. The response on Education Sector being highly inconsistent would not be
relied upon thus discarded.
Table 13a: Local Authority
Variable N Minimum Maximum Mean Std.
Deviation
Coefficient
of
Variation
Local Authority 116 1 4 1.36 0.235 0.173053892
Source: Research Data (2012)

36
Table 13b: Local Authority
Variable Frequency Percent Valid Percent
Cumulative
Percent
Valid Below 5% 84 68.9 72.4 72.4
5%-10% 10 8.2 8.6 81.0
11%-20% 10 8.2 8.6 89.7
50%-100% 12 9.8 10.3 100.0
Total 116 95.1 100.0
Missing System 6 4.9
Total 122 100.0
Source: Research Data (2012)
According to Table 13b, 72.4% of the respondents had their public contracts given by Local Authority
department being below 5%. 8.6% of the respondents had their public contracts given by Local
Authority department being between 5%-10%. Another 8.6% of the respondents had their public
contracts given by Local Authority department being 11%-20%. 10.3% of the respondents had their
public contracts given by Local Authority department being between 50%-100%.
According to Table 13a, the mean response was 1.36 with a 0.235 standard deviation from the mean
and 17.31% coefficient of variation, indicating higher level of consistency. Since the research
objective was to determine the challenges faced by SMEs in accessing public contracts in Bondo,
knowledge of public sectors often giving contracts to SMEs would be integral to their public contract
access. The response on Education Sector being highly consistent and within the expected

37
range/outliers about the mean then 72.4% of SMEs in Bondo do access just below 5% of public
contracts from the Local Authority.
4.2.9: Mode of Communicating Public Contracts to SMEs in Bondo
Table 14a: Mode of Communicating Public Contracts
Variable Frequency Percent Valid Percent
Cumulative
Percent
Valid Newspaper Adverts 24 19.7 20.7 20.7
E-mail/Internet 2 1.6 1.7 22.4
Office Notice boards 32 26.2 27.6 50.0
Friends & Networks 58 47.5 50.0 100.0
Total 116 95.1 100.0
Missing System 6 4.9
Total 122 100.0
Source: Research Data (2012)
Table 14b: Mode of Communicating Public Contracts
Variable N Minimum Maximum Mean Std.
Deviation
Coefficient
of
Variation
Mode of
Communicating
Public Contracts
116 1 4 4.07 0.857 0.210456026
Source: Research Data (2012)
According to Table 14a, 20.7% of the respondents often receive communications and tender notices of
public contracts by newspapers. 1.7% of the respondents often receive communications and tender

38
notices of public contracts by E-mail/Internet. 27.6% of the respondents often receive communications
and tender notices of public contracts through office notice boards. 50% of the respondents often
receive communications and tender notices of public contracts through friends and networks.
According to Table 14b, the mean response was 4.07 with a 0.857 standard deviation from the mean
and 21.05% coefficient of variation, indicating high level of consistency. Considering this analysis, the
most frequent response on receiving public contract information was through friends & networks thus
confirmatory.
4.2.10: Average Rate SMEs Receive Public Contracts in Bondo
Table 15a: SME Public Contracting Frequencies
Variable Frequency Percent Valid Percent
Cumulative
Percent
Valid Hardly Any 22 18.0 19.0 19.0
Less Often 52 42.6 44.8 63.8
Often 42 34.4 36.2 100.0
Total 116 95.1 100.0
Missing System 6 4.9
Total 122 100.0
Source: Research Data (2012)

39
Table 15b: SME Public Contracting Frequencies
Variable N Minimum Maximum Mean Std.
Deviation
Coefficient
of
Variation
SME Public
Contracting
116 1 3 2.06 0.362 0.175728155
Source: Research Data (2012)
According to Table 15a, 19.0% of the respondents felt that their SMEs hardly receive public contracts.
36.2% of the respondents felt that their SMEs less often receive public contracts while 44.8% of the
respondents felt that their SMEs often receive public contracts. According to Table 15b, the mean
response was 2.06 with a 0.362 standard deviation from the mean and 17.57% coefficient of variation,
indicating high level of consistency. Considering the deviation about the mean, the most frequent
response on the frequency of accessing public contracts being less often falls within acceptable range
thus can be relied upon.
4.2.11: SMEs Dealing in Public Contracts in Bondo
Table 16a: SMEs Dealing in Public Contracts
Variable Frequency Percent Valid Percent
Cumulative
Percent
Valid Yes 54 44.3 46.6 46.6
No 62 50.8 53.44 100.0
Total 116 95.1 100.0
Missing System 6 4.9
Total 122 100.0
Source: Research Data (2012)

40
Table 16a: SMEs Dealing in Public Contracts
Variable N Minimum Maximum Mean Std.
Deviation
Coefficient
of
Variation
SME Public
Contracting
116 1 3 2.26 0.362 0.160176991
Source: Research Data (2012)
According to Table 16a, 46.6% of the respondents had their SMEs dealing with public contacts.
However 53.46% of the respondents had their SMEs not dealing with public contacts. According to
Table 16b, the mean response was 2.26 with a 0.362 standard deviation from the mean and 16.02%
coefficient of variation, indicating high level of consistency. Most SMEs in Bondo thus do not engage
in public contracting.
4.2.12: SMEs Farmiliarity with Public Procurement Rules in Bondo
Table 17a: Knowledge of PPDA
Variable Frequency Percent Valid Percent
Cumulative
Percent
Valid Yes 62 59.0 62.1 62.1
No 54 36.1 37.9 100.0
Total 116 95.1 100.0
Missing System 6 4.9
Total 122 100.0
Source: Research Data (2012)

41
Table 17b: Knowledge of PPDA
Variable N Minimum Maximum Mean Std.
Deviation
Coefficient
of
Variation
Knowledge of
PPDA
116 1 2 1.38 0.289 0.20942029
Source: Research Data (2012)
According to Table 17b, 62.1% of the respondents had knowledge of PPDA (2005) applicable in
accessing public contracts. However 46.6% of the respondents had no knowledge of PPDA (2005)
applicable in accessing public contracts. According to Table 17b, the mean response was 1.38 with a
0.289 standard deviation from the mean and 20.94% coefficient of variation, indicating high level of
consistency. Most SMEs in Bondo thus have knowledge of PPDA (2005) applicable in accessing
public contracts.
4.2.13: SMEs and their Perception of Public Procurement Rules in Bondo
Table 18a: PPDA & SME Contracting
Variable Frequency Percent Valid Percent
Cumulative
Percent
Valid Yes 62 50.8 53.4 53.4
No 54 44.3 46.6 100.0
Total 116 95.1 100.0
Missing System 6 4.9
Total 122 100.0
Source: Research Data (2012)

42
Table 18b: PPDA & SME Contracting
Variable N Minimum Maximum Mean Std.
Deviation
Coefficient
of
Variation
PPDA & SME
Contracting
116 1 2 1.47 0.356 0.242176871
Source: Research Data (2012)
According to Table 18a, 50.4% of the respondents felt that PPDA which guide public contacting in
Kenya were equally applicable in Bondo and facilitated their attempts to access public contracts.
However 46.6% of the respondents felt that PPDA were not favouring the attempts in accessing public
contacts. According to Table 17b, the mean response was 1.47 with a 0.356 standard deviation from
the mean and 24.22% coefficient of variation, indicating high level of consistency. The management
of most SMEs in Bondo felt that PPDA (2005) which guide public contracting have been favouring
their access to public contracts.

43
4.3.0. Major Challenges of SMEs in Accessing Public Contracts in Bondo
4.3.1. VAT Registration of SMEs in Bondo
Table 19a: VAT Registration
Variable Frequency Percent Valid Percent
Cumulative
Percent
Valid V. Small Extent 74 60.7 63.8 63.8
Small Extent 2 1.6 1.7 65.5
Large Extent 10 8.2 8.6 74.1
V. Large Extent 30 24.6 25.9 100.0
Total 116 95.1 100.0
Missing System 6 4.9
Total 122 100.0
Source: Research Data (2012)
Table 19b: VAT Registration
Variable N Minimum Maximum Mean Std.
Deviation
Coefficient
of
Variation
VAT Registration 116 1 5 1.31 0.196 0.14978355
Source: Research Data (2012)
According to Table 19a, 63.8% of the respondents felt that their chances of accessing public contracts
were to a very small extent challenged by VAT registration as a requirement for public contracting.
1.7% of the respondents felt that their chances of accessing public contracts were to a small extent

44
challenged by VAT registration as a requirement for public contracting. 8.6% of the respondents
instead felt that VAT registration, to a large extent, challenges their SMEs access to public contracts
while 25.9% of the respondents felt that VAT registration, to a very large extent, challenges their
SMEs access to public contracts.
According to Table 19b, the mean response was 1.31 with a 0.196 standard deviation from the mean
and 14.97% coefficient of variation, indicating some level of consistency. Most SMEs in Bondo thus
had their chances of accessing public contracts to a very small extent being challenged by VAT
registration as a requirement for public contracting.
4.3.2. Perceived Corruption in Bondo
Table 20a: Perceived Corruption
Variable Frequency Percent Valid Percent
Cumulative
Percent
Valid V. Small Extent 18 14.8 15.5 15.5
Large Extent 2 1.6 1.7 17.2
V. Large Extent 96 78.7 82.8 100.0
Total 122 95.1 100.0
Missing System 6 4.9
Total 122 100.0
Source: Research Data (2012)

45
Table 20a: Perceived Corruption
Variable N Minimum Maximum Mean Std.
Deviation
Coefficient
of
Variation
Perceived
Corruption
116 1 5 4.36 0.459 0.105275229
Source: Research Data (2012)
According to Table 20a, 15.5% of the respondents felt that their chances of accessing public contracts
were to a very small extent challenged by perceived corruption in public contracting. 1.7% of the
respondents felt that their chances of accessing public contracts were to a large extent challenged by
perceived corruption in public contracting. 82.8% of the respondents instead felt that perceived
corruption, to a very large extent, challenges their SMEs access to public contracts.
According to Table 20b, the mean response was 4.36 with a 0.459 standard deviation from the mean
and 10.53% coefficient of variation, indicating very high level of consistency. Most SMEs in Bondo
thus had their chances of accessing public contracts to a very large extent being challenged by
perceived corruption in the public sector.
4.3.3. SMEs Business Licensing in Bondo
Table 21a: SME Licensing
Variable N Minimum Maximum Mean Std.
Deviation
Coefficient
of
Variation
SME Licensing 116 1 5 1.52 0.217 0.142763158
Source: Research Data (2012)

46
Table 21b: SME Licensing
Variable Frequency Percent Valid Percent
Cumulative
Percent
Valid V. Small Extent 96 78.7 82.8 82.8
Neutral 10 8.2 8.6 91.4
V. Large Extent 10 8.2 8.6 100.0
Total 116 95.1 100.0
Missing System 6 4.9
Total 122 100.0
Source: Research Data (2012)
According to Table 21b, 82.8% of the respondents felt that their chances of accessing public contracts
were to a very small extent challenged by SME business licensing requirement in public contracting.
18.6% of the respondents were neutral on their chances of accessing public contracts being challenged
by SME business licensing requirement in public contracting. Another 8.6% of the respondents felt
that SME business licensuing requirement, to a very large extent, challenges their SMEs access to
public contracts.
According to Table 20a, the mean response was 1.52 with a 0.217 standard deviation from the mean
and 14.28% coefficient of variation, indicating very high level of consistency. Most SMEs in Bondo
thus had their chances of accessing public contracts to a very small extent being challenged by
perceived corruption in the public sector.

47
4.3.4. Tender Documentation
Table 22a: Tender Documentation Level
Variable Frequency Percent Valid Percent
Cumulative
Percent
Valid V. Small Extent 20 16.4 17.2 17.2
Small Extent 22 18.0 19.0 36.2
V. Large Extent 74 60.7 63.8 100.0
Total 116 95.1 100.0
Missing System 6 4.9
Total 122 100.0
Source: Research Data (2012)
Table 22b: Tender Documentation Level
Variable N Minimum Maximum Mean Std.
Deviation
Coefficient
of
Variation
Tender
Documentation
Level
116 1 5 3.74 1.002 0.267914439
Source: Research Data (2012)
According to Table 22a, 17.2% of the respondents felt that their chances of accessing public contracts
were to a very small extent challenged by heavy tender documentation levels in public contracting.
19.0% of the respondents were to a small extent challenged by heavy tender documentation levels on
their chances of accessing public contracts. Another 63.8% of the respondents felt that heavy tender
documentation levels, to a very large extent, challenge their SMEs access to public contracts.

48
According to Table 22b, the mean response was 3.74 with a 1.002 standard deviation from the mean
and 26.79% coefficient of variation, indicating high level of consistency. Most SMEs in Bondo thus
had their chances of accessing public contracts to a very large extent being challenged by heavy
documentation in the public sector contracting.
4.3.5. Available Public Contracts in Bondo
Table 23a: Available Public Contracts
Variable Frequency Percent Valid Percent
Cumulative
Percent
Valid V. Small Extent 36 29.5 31.0 31.0
Small Extent 4 3.3 3.4 34.5
Neutral 10 8.2 8.6 43.1
V. Large Extent 66 54.1 56.9 100.0
Total 116 95.1 100.0
Missing System 6 4.9
Total 122 100.0
Source: Research Data (2012)

49
Table 23b: Available Public Contracts
Variable N Minimum Maximum Mean Std.
Deviation
Coefficient
of
Variation
Available Public
Contracts
116 1 5 3.48 0.838 0.240804598
Source: Research Data (2012)
According to Table 24, 31.0% of the respondents felt that their chances of accessing public contracts
were to a very small extent challenged by availability of public contracts. 3.4% of the respondents felt
that their chances of accessing public contracts were to a small extent challenged by availability of
public contracts. 8.6% of the respondents were neutral on their chances of accessing public contracts
being challenged by availability of public contracts. However 56.9% of the respondents felt that their
chances of accessing public contracts were to a very large extent challenged by availability of public
contracts.
According to Table 22b, the mean response was 3.48 with a 0.838 standard deviation from the mean
and 24.08% coefficient of variation, indicating high level of consistency. Most SMEs in Bondo thus
had their chances of accessing public contracts to a very large extent being challenged by availability
of public contracts.

50
4.3.6. Feedback from Contracting Authorities in Bondo after Award
Table 24a: Feedback from Contracting Authority
Variable Frequency Percent Valid Percent
Cumulative
Percent
Valid V. Small Extent 20 16.4 17.2 17.2
Large Extent 2 1.6 1.7 19.0
V. Large Extent 94 77.0 81.0 100.0
Total 116 95.1 100.0
Missing System 6 4.9
Total 122 100.0
Source: Research Data (2012)
Table 24b: Feedback from Contracting Authority
Variable N Minimum Maximum Mean Std.
Deviation
Coefficient
of
Variation
Feedback from
Contracting
Authority
116 1 5 4.29 1.022 0.238228438
Source: Research Data (2012)
According to Table 25, 17.2% of the respondents felt that their chances of accessing public contracts
were to a very small extent challenged by availability of feedback from public contracting authorities.
1.7% of the respondents felt that their chances of accessing public contracts were to a large extent
challenged by availability of feedback from public contracting authorities. 81.0% of the respondents

51
felt that their chances of accessing public contracts were to a very large extent challenged by
availability of feedback from public contracting authorities.
According to Table 22b, the mean response was 4.29 with a 1.022 standard deviation from the mean
and 23.82% coefficient of variation, indicating high level of consistency. Most SMEs in Bondo thus
had their chances of accessing public contracts to a very large extent being challenged by availability
of feedback from public contracting authorities.
4.3.7. Lot Sizes in Bondo
Table 25a: Lot Sizes
Variable Frequency Percent Valid Percent
Cumulative
Percent
Valid V. Small Extent 20 16.4 17.2 17.2
Large Extent 14 11.5 12.1 29.3
V. Large Extent 82 67.2 70.7 100.0
Total 116 95.1 100.0
Missing System 6 4.9
Total 122 100.0
Source: Research Data (2012)
Table 25b: Lot Sizes
Variable N Minimum Maximum Mean Std.
Deviation
Coefficient
of
Variation
Lot Sizes 116 1 5 4.19 1.104 0.263484487
Source: Research Data (2012)

52
According to Table 25a, 17.2% of the respondents felt that their chances of accessing public contracts
were to a very small extent challenged by lot sizes. 12.1% of the respondents felt that their chances of
accessing public contracts were to a large extent challenged by large lot sizes while 70.7% of the
respondents felt that their chances of accessing public contracts were to a very large extent challenged
by large lot sizes in public contracts.
According to Table 25b, the mean response was 4.19 with a 1.104 standard deviation from the mean
and 26.35% coefficient of variation, indicating high level of consistency. Most SMEs in Bondo thus
had their chances of accessing public contracts to a very large extent being challenged by large lot
sizes in public contracts.
4.3.8. Existing Framework Arrangements in Bondo
Table 26a: Framework Arrangements
Variable Frequency Percent Valid Percent
Cumulative
Percent
Valid V. Small Extent 16 13.1 13.8 13.8
Small Extent 10 8.2 8.6 22.4
Large Extent 12 9.8 10.3 32.8
V. Large Extent 78 63.9 67.2 100.0
Total 116 95.1 100.0
Missing System 6 4.9
Total 122 100.0
Source: Research Data (2012)

53
Table 26b: Framework Arrangements
Variable N Minimum Maximum Mean Std.
Deviation
Coefficient
of
Variation
Framework
Arrangements
116 1 5 4.09 0.696 0.170171149
Source: Research Data (2012)
According to Table 26a, 13.8% of the respondents felt that their chances of accessing public contracts
were to a very small extent challenged by existing framework arrangements. 8.6% of the respondents
felt that their chances of accessing public contracts were to a small extent challenged by existing
framework arrangements. 10.3% of the respondents felt that their chances of accessing public
contracts were to a large extent challenged by existing framework arrangements while 67.2% were in
agreement that existing framework arrangements is a challenge to them in accessing public contracts.
According to Table 26b, the mean response was 4.09 with a 0.696 standard deviation from the mean
and 17.02% coefficient of variation, indicating very little variability thus very high level of
consistency. Most SMEs in Bondo thus had their chances of accessing public contracts to a very large
extent being challenged by availability of existing framework arrangements.
4.3.9. Availability of Finance to SMEs in Bondo
Table 27a: Capital / Finance Availability
Variable N Minimum Maximum Mean Std.
Deviation
Coefficient
of
Variation
Capital / Finance 116 1 5 2.98 1.906 0.639597315
Source: Research Data (2012)
Table 27b: Capital / Finance Availability

54
Variable Frequency Percent Valid Percent
Cumulative
Percent
Valid V. Small Extent 48 39.3 41.4 41.4
Small Extent 12 9.8 10.3 51.7
Neutral 2 1.6 1.7 53.4
Large Extent 2 1.6 1.7 55.2
V. Large Extent 52 42.6 44.8 100.0
Total 116 95.1 100.0
Missing System 6 4.9
Total 122 100.0
Source: Research Data (2012)
According to Table 28, 41.4% of the respondents felt that their chances of accessing public contracts
were to a very small extent challenged by availability of capital/finance. 10.3% of the respondents felt
that their chances of accessing public contracts were to a small extent challenged by availability of
capital/finance. 1.7% of the respondents felt that their chances of accessing public contracts were to a
large extent challenged by availability of capital/finance while another 1.7% were in neutral that
availability of capital/finance is a challenge to them in accessing public contracts. However, 44.8%
felt to a very large extent that availability of capital/finance was a big challenge for SMEs accessing
public contracts.
According to Table 26b, the mean response was 2.98 with a 1.906 standard deviation from the mean
and 63.96% coefficient of variation, indicating very high variability thus high level of inconsistency
and could not be relied upon.

55
4.3.10. SMEs Skilled Human Resource Base in Bondo
Table 28a: Skilled HR Base
Variable Frequency Percent Valid Percent
Cumulative
Percent
Valid V. Small Extent 102 83.6 87.9 87.9
Large Extent 2 1.6 1.7 89.7
V. Large Extent 12 9.8 10.3 100.0
Total 116 95.1 100.0
Missing System 6 4.9
Total 122 100.0
Source: Research Data (2012)
Table 28b: Skilled HR Base
Variable N Minimum Maximum Mean Std.
Deviation
Coefficient
of
Variation
Skilled HR Base 116 1 5 1.47 1.273 0.865986395
Source: Research Data (2012)
According to Table 28a, 87.9% of the respondents felt that their chances of accessing public contracts
were to a very small extent challenged by presence of skilled human resource base within the SME.
10.3% of the respondents felt that their chances of accessing public contracts were to a large extent
challenged by presence of skilled human resource base within the SME. 1.7% of the respondents felt
that their chances of accessing public contracts were to a very large extent challenged by presence of
skilled human resource base within the SME.

56
According to Table 28b, the mean response was 1.47 with a 1.273 standard deviation from the mean
and 86.6% coefficient of variation, indicating very high variability thus high level of inconsistency and
could not be relied upon.
4.3.11. Level of Technology Adoption by SMEs in Bondo
Table 29a: Technology Adoption
Variable Frequency Percent Valid Percent
Cumulative
Percent
Valid V. Small Extent 68 55.7 58.6 58.6
Small Extent 32 26.2 27.6 86.2
Large Extent 2 1.6 1.7 87.9
V. Large Extent 14 11.5 12.1 100.0
Total 116 95.1 100.0
Missing System 6 4.9
Total 122 100.0
Source: Research Data (2012)
Table 29b: Technology Adoption
Variable N Minimum Maximum Mean Std.
Deviation
Coefficient
of
Variation
Technology
Adoption
116 1 5 1.81 1.317 0.727624309
Source: Research Data (2012)

57
According to Table 29a, 58.6% of the respondents felt that their chances of accessing public contracts
were to a very small extent challenged by use of technology on public tendering processes. 27.6% of
the respondents felt that their chances of accessing public contracts were to a small extent challenged
by use of technology on public tendering processes. 1.7% of the respondents felt that their chances of
accessing public contracts were to a large extent challenged by use of technology on public tendering
processes while 12.1% of the respondents felt that their chances of accessing public contracts were to
a very large extent challenged by use of technology on public tendering processes.
According to Table 29b, the mean response was 1.81 with a 1.317 standard deviation from the mean
and 72.76% coefficient of variation, indicating very high variability thus high level of inconsistency
and could not be relied upon.
4.3.12. Procurement Time-Scales
Table 30a: Procurement Time-Scales
Variable Frequency Percent Valid Percent
Cumulative
Percent
Valid V. Small Extent 28 23.0 24.1 24.1
Small Extent 2 1.6 1.7 25.9
Neutral 12 9.8 10.3 36.2
V. Large extent 74 60.7 63.8 100.0
Total 116 95.1 100.0
Missing System 6 4.9
Total 61 100.0
Source: Research Data (2012)

58
Table 30b: Procurement Time-Scales
Variable N Minimum Maximum Mean Std.
Deviation
Coefficient
of
Variation
Procurement
Procedures
116 1 5 3.5 0.94 0.268571429
Source: Research Data (2012)
According to Table 30a, 24.1% of the respondents felt that their chances of accessing public contracts
were to a very small extent challenged by long procurement time-scales. 1.7% of the respondents felt
that their chances of accessing public contracts were to a small extent challenged by long procurement
time-scales. 10.3% of the respondents were neutral on the fact that their chances of accessing public
contracts were challenged by long procurement time-scales while 63.8% of the respondents felt that
their chances of accessing public contracts were to a very large extent challenged by long procurement
time-scales.
According to Table 30b, the mean response was 3.5 with a 0.94 standard deviation from the mean and
26.86% coefficient of variation, indicating low variability thus high level of consistency. This
confirms the position of most respondents that their chances of accessing public contracts were to a
very large extent challenged by long procurement time-scales.

59
4.3.13. Procurement Procedures
Table 31a: Procurement Procedures
Variable Frequency Percent Valid Percent
Cumulative
Percent
Valid V. Small Extent 42 34.4 36.2 36.2
Small Extent 2 1.6 1.7 37.9
V. Large Extent 72 59.0 62.1 100.0
Total 116 95.1 100.0
Missing System 6 4.9
Total 122 100.0
Source: Research Data (2012)
Table 31b: Procurement Procedures
Variable N Minimum Maximum Mean Std.
Deviation
Coefficient
of
Variation
Procurement
Procedures
116 1 5 3.5 0.94 0.268571429
Source: Research Data (2012)
According to Table 31a, 36.2% of the respondents felt that their chances of accessing public contracts
were to a very small extent challenged by long and bureaucratic procurement procedures. 1.7% of the
respondents felt that their chances of accessing public contracts were to a small extent challenged by
long and bureaucratic procurement procedures. 62.1% of the respondents felt that their chances of

60
accessing public contracts were to a very large extent challenged by long and bureaucratic
procurement procedures.
According to Table 31b, the mean response was 3.5 with a 0.94 standard deviation from the mean and
26.86% coefficient of variation, indicating low variability thus high level of consistency. This
confirms the position of most respondents that their chances of accessing public contracts were to a
very large extent challenged by bureaucratic procurement procedures.
4.3.14. Selection Criteria
Table 32a: Selection Criteria
Variable Frequency Percent Valid Percent
Cumulative
Percent
Valid V. Small Extent 10 8.2 8.6 8.6
Large Extent 12 9.8 10.3 19.0
V. Large 94 77.0 81.0 100.0
Total 116 95.1 100.0
Missing System 6 4.9
Total 122 100.0
Source: Research Data (2012)
Table 32b: Selection Criteria
Variable N Minimum Maximum Mean Std.
Deviation
Coefficient
of
Variation
Selection Criteria 116 1 5 4.55 0.742 0.163076923
Source: Research Data (2012)

61
According to Table 33, 8.6% of the respondents felt that their chances of accessing public contracts
were to a very small extent challenged by selection criteria. 10.3% of the respondents felt that their
chances of accessing public contracts were to a large extent challenged by selection criteria. 81.3% of
the respondents felt that their chances of accessing public contracts were to a very large extent
challenged by selection criteria.
According to Table 31b, the mean response was 4.55 with a 0.742 standard deviation from the mean
and 16.31% coefficient of variation, indicating low variability thus high level of consistency. This
confirms the position of most respondents that their chances of accessing public contracts were to a
very large extent challenged by selection criteria.
4.3.15. Contract/Tender Information
Table 33a: Contract Information
Variable Frequency Percent Valid Percent
Cumulative
Percent
Valid V. Small Extent 10 8.2 8.6 8.6
Large Extent 12 9.8 10.3 19.0
V. Large 94 77.0 81.0 100.0
Total 116 95.1 100.0
Missing System 6 4.9
Total 122 100.0
Source: Research Data (2012)

62
Table 33b: Contract Information
Variable N Minimum Maximum Mean Std.
Deviation
Coefficient
of
Variation
Contract
Information
116 1 5 4.05 0.927 0.229010989
Source: Research Data (2012)
According to Table 33a, 8.6% of the respondents felt that their chances of accessing public contracts
were to a very small extent challenged by litle tender information always given by public sector.
10.3% of the respondents felt that their chances of accessing public contracts were to a large extent
challenged by litle tender information always given by public sector. 81.0% of the respondents felt
that their chances of accessing public contracts were to a very large extent challenged by litle tender
information always given by public sector.
According to Table 33b, the mean response was 4.55 with a 0.92749 standard deviation from the mean
and 22.90% coefficient of variation, indicating low variability thus high level of consistency. This
confirms the position of most respondents that their chances of accessing public contracts were to a
very large extent challenged by litle tender information always given by public sector.
4.3.16. Cost of Tendering
Table 34a: Cost of Tendering
Variable N Minimum Maximum Mean Std.
Deviation
Coefficient
of
Variation
Cost of Tendering 116 1 5 4.43 1.058 0.238826185
Source: Research Data (2012)

63
Table 34b: Cost of Tendering
Variable Frequency Percent Valid Percent
Cumulative
Percent
Valid V. Small Extent 10 8.2 8.6 8.6
Small Extent 2 1.6 1.7 10.3
Neutral 10 8.2 8.6 19.0
V. Large Extent 94 77.0 81.0 100.0
Total 116 95.1 100.0
Missing System 6 4.9
Total 122 100.0
Source: Research Data (2012)
According to Table 34a, 8.6% of the respondents felt that their chances of accessing public contracts
were to a very small extent challenged by high cost of tendering. 1.7% of the respondents felt that their
chances of accessing public contracts were to a small extent challenged by high cost of tendering.
8.6% of the respondents were neutral on the fact that their chances of accessing public contracts were
challenged by high cost of tendering . 81.3% of the respondents felt that their chances of accessing
public contracts were to a very large extent challenged by high cost of tendering.
According to Table 34b, the mean response was 4.43 with a 1.058 standard deviation from the mean
and 23.88% coefficient of variation, indicating low variability thus high level of consistency. This
confirms the position of most respondents that their chances of accessing public contracts were to a
very large extent challenged by high cost of tendering.

64
4.3.17. Pre-qualification of Suppliers
Table 35a: Pre-Qualification of Suppliers
Variable Frequency Percent Valid Percent
Cumulative
Percent
Valid V. Small Extent 40 32.8 35.1 35.1
Small Extent 2 1.6 1.8 36.8
Large 24 19.7 21.1 57.9
V. Large Extent 48 39.3 42.1 100.0
Total 114 93.4 100.0
Missing System 8 6.6
Total 122 100.0
Source: Research Data (2012)
Table 35b: Pre-Qualification of Suppliers
Variable N Minimum Maximum Mean Std.
Deviation
Coefficient
of
Variation
Pre-Qualification 114 1 5 3.73 0.792 0.21232
Source: Research Data (2012)
According to Table 35a, 35.1% of the respondents felt that their chances of accessing public contracts
were to a very small extent challenged by the pre-qualification requirement. 1.8% of the respondents
felt that their chances of accessing public contracts were to a small extent challenged by the pre-
qualification requirement. 21.1% of the respondents felt that their chances of accessing public
contracts were to a large extent challenged by the pre-qualification requirement . 42.1% of the

65
respondents felt that their chances of accessing public contracts were to a very large extent challenged
by the pre-qualification requirement.
According to Table 35b, the mean response was 3.73 with a 0.792 standard deviation from the mean
and 21.23% coefficient of variation, indicating low variability thus high level of consistency. This
confirms the position of most respondents that their chances of accessing public contracts were to a
very large extent challenged by the fact that a vendor has to be pre-qualified in order to tender for
public contracts.
4.3.18. Cash Flow Position
Table 36a: Cash Flow Position
Variable Frequency Percent Valid Percent
Cumulative
Percent
Valid V. Small Extent 20 16.4 17.2 17.2
Small Extent 24 19.7 20.7 37.9
Neutral Extent 10 8.2 8.6 46.6
Large Extent 40 32.8 34.5 81.0
V. Large Extent 22 18.0 19.0 100.0
Total 116 95.1 100.0
Missing System 6 4.9
Total 122 100.0
Source: Research Data (2012)

66
Table 36b: Cash Flow Position
Variable N Minimum Maximum Mean Std.
Deviation
Coefficient
of
Variation
Cash Flow
Information
116 1 5 3.71 0.487 0.131230284
Source: Research Data (2012)
According to Table 36a, 17.2% of the respondents felt that their chances of accessing public contracts
were to a very small extent challenged by cash flow position. 20.7% of the respondents felt that their
chances of accessing public contracts were to a small extent challenged by cash flow position. 8.6%
of the respondents however were neutral on the fact that their chances of accessing public contracts
were to a large extent challenged by cash flow position . 34.5% of the respondents felt that their
chances of accessing public contracts were to a large extent challenged by the pre-qualification
requirement. 19.0% of the respondents felt that their chances of accessing public contracts were to a
very large extent challenged by cash flow position.
According to Table 36b, the mean response was 3.71 with a 0.487 standard deviation from the mean
and 13.12% coefficient of variation, indicating low variability thus high level of consistency. This
confirms the position of most respondents that their chances of accessing public contracts were to a
very large extent challenged by the cash flow position. Public sector have been known to pay after a
long credit period which often leaves SME vendors with no cash to pursue other contracts before
being paid.

67
CHAPTER FIVE
5.0: SUMMARY, CONCLUSIONS AND RECOMMENDATIONS
5.1: Introduction
This chapter provides a summary, conclusions and recommendations that were deduced from the
findings of the study. The overall response rate was very good since a representative portion of the
respondent‟s population was achieved. This was adequate for a normal distribution assumption. Below
were the summary of results and recommendations on the study.
5.2: Summary of Results
From the analyzed research data (Table 1-18/Appendix 3 item 1-18), it was found that all SMEs in
Bondo District had their employees ranging between 1-50 employees. Major areas of SME business
with public contractor were in Steel & Carpentry fabrications, Building & Construction, Automotive
Supplies & Garages while some small percentage being in the General Hardwares and Oil &
Petroleum sectors. SMEs in General Retail and Transport sectors had no indication of contracting with
the public sector.
Majority of the SMEs in Bondo had existed for over 6 years since inception and therefore had enough
practical experience as far as the objectives of this study was concerned. The major sources of funding
for SMEs in Bondo were found to be bank loans in addition to personal savings. The average annual
turnover of SMEs in Bondo was below 1 million though one-quarter of SMEs had their annual
turnover being 2-5 million.

68
Most SMEs in Bondo depend on public contracts for their survival with just one-third of SMEs not
dealing with public contracts completely. Of those dealing with public contracts over 75% of their
average annual turnover come from public contracts. SMEs in Bondo mostly draw their public
contracts from the Office of the President, Local Authority, Roads & Public Works and Agriculture &
Regional Development. These SMEs often received public contracts information through friends &
networks but some small percentage through office notice boards as well as newspaper advertisement.
Less than half of SMEs in Bondo often received public contracts. Most SMEs in Bondo were found to
be knowledgeable in PPDA (2005) with over half considering PPDA (2005) as favoring them in
public contracting. The study also found that SMEs in Bondo which secured public sector contracts
mostly drew their public sector contracts from the Office of the President, Local Authority, Roads &
Public Works and Agriculture & Regional Development.
Analysis from Table 19-36 (also shown in Appendix 3 item 19-36) established that the following were
the major challenges SMEs face in accessing public sector contracts: perceived corruption, high
documentation level, few available public contracts, lack of access to public contract information, lack
of feedback from government, large lot sizes, existing framework arrangements with large enterprises,
long procurement time-scales, bureaucratic procurement procedures, stringent selection criteria,
inavailability of accurate contract information, large cost of tendering and the pre-qualification
requirement based on financial and human resource capacity to do the work, commitment and
experience of past works/service to be pre-qualified thus putting high entry barriers. Poor business
infrastructure besides delays in invoice payments and highly unfavorable taxation regime were also
mentioned as challenges SMEs face in accessing public sector contracts.

69
5.3: Conclusion
In conclusion, this study focused on establishing the challenges SMEs face in accessing public sector
contracts in Bondo District. The study was anchored on the EU Directives on public contracting from
which PPDA (2005) and PPR (2006) were drawn to regulate public procurement.
The first objective of the study was to determine the main challenges faced by SMEs in accessing
public sector contracts in Bondo District. From the study perceived corruption, large documentation
level, inavailability of public contracts, lack of information access, lack of feedback, large lot sizes,
existing framework arrangements, lack of capital, long procurement time-scales, bureaucratic
procurement procedures, stringent selection criteria, inaccurate contract information, cost of tendering,
poor business infrastructure unfavorable taxation regime and pre-qualification were the major
challenges SMEs face in accessing public sector contracts in Bondo.
The second objective of the study was to determine the types of public contracts often secured by
SMEs in Bondo District. From the study SMEs in Bondo which to some extent secured public sector
contracts were found to have mostly drawn their public contracts from the Office of the President,
Local Authority, Roads & Public Works and Agriculture & Regional Development.
5.4: Recommendations
This study focused on establishing the challenges SMEs face in accessing public sector contracts in
Bondo District. With the challenges in place, it is the responsibility of contracting authorities and
SMEs management to ensure these challenges are reduced. It‟s thus suggested that further research
could be done on how these challenges could be reduced both by government contracting authorities
and/or SMEs themselves. Further research could also be carried on the initiatives the government has
put to facilitate SMEs access to public contracts. Research could also be done on contribution of the
level of education of procurement officers in achieving value for money during public procurement.

70
The study recommends that the government should reduce the level of bureaucracy seen in long
procurement procedures. The government should also reduce the heavy taxations charged on business
enterprises to easen the business infrastructure for SMEs probably through tax cut incentives.
The study further recommends that contracting authorities should be trained on good contracting
practices, ethics & integrity so as to eliminate perceived corruption as a challenge. Documentation
level during tendering should be reduced to manageable levels and possibly allow use of e-tendering
for this purpose. Public contracting authorities should thoroughly de-brief all bidders upon awarding
tenders. The study also recommends reduction of lot sizes so as to be accessible to SMEs interested in
public contracts. The various public sector contracting authorities should also try to facilitate faster
payments for invoices to avoid holding SME cash for too long so as to be able to facilitate tendering
for other jobs.

71
REFERENCES
Arianoff, A., (2010). Role of SMMEs in the Development of a Region. International Information
Centre. Retrieved from http://www.ruseu.com/events-forum-reg/details-111.html on 20th
March 2012.
Awuor, E.O. (2009). A survey of manufacturing based strategies for small and medium scale
entreprises in the food processing industry in Nairobi. Unpublished MBA project, University
of Nairobi.
Bartlett, W. and Bukvic, V. (2001), “Barriers to SME growth in Slovenia”, MOCT-MOST:
Economic Policy in Transitional Economies, Vol. 11, pp. 177-95.
Brown, P., McNaughton, R. and Bell, J. (2010), “Marketing externalities in industrial clusters:
a literature review and evidence from the Christchurch, New Zealand electronics cluster”,
Journal of International Entrepreneurship, Vol. 8 No. 2, pp. 168-81
Boter, H. and Lundstrom, A. (2005), “SME perspectives on business support services: the role of
company size, industry and location”, Journal of Small Business and Enterprise
Development, Vol. 12 No. 2, pp. 244-58.
Bruwer, J. (2010). Sustainability of South African FMCG SMME Retail Businesses in the Cape of
Peninsula. Unpublished Thesis, retrieved from http://dk.cput.ac.za/td-cput/126 on 18 March
20th 2012

72
Central Bank of Kenya, (2011). Annual Supervision Report. Central Bank of Kenya.
Chen, J. (2006), “Development of Chinese Small and Medium-sized enterprises”, Journal of Small
Business and Enterprise Development, Vol. 13 No. 2, pp. 140-7.
Esselaar, C. Stork, A. Ndiwalana, and M. Deen-Swarra, 2007, „ICT usage and its impact on
profitability of SMEs in .13 African Countries‟. The MIT Press, 4(1), pp87-100.
European Commission, (2003). "SMEs access to public procurement", Brussels 2003, published on
the website http://europa.eu.int/comm/enterprise/entrepreneurship/craft/index.htm
EU Commission Recommendation,(2003). Definition of micro, small and medium –
sized enterprises, the official journal of the European Union, L124/36.
Gatimu, W.W. (2008). The strategic challenges faced by firms in the adoption of ISO 9000 Quality.
Unpublished MBA project. University of Nairobi.
Gelman, A., and Hill, J. (2007). Data Analysis Using Regression and Multilevel/Hierarchical
Models. Cambridge University Press.
Government of Kenya (2004). Economic Survey, (2004-2005). Government Printers, Nairobi.
Government of Kenya (2009). Cencus Report. Ministry of Planning and National Development.
Hussain, J., Millman, C. and Matlay, H. (2006), “SME financing in the UK and in China:
a comparative perspective”, Journal of Small Business and Enterprise Development, Vol. 13
No. 4, pp. 584-99.

73
Joubert, P. (2004), “Constraints and challenges of small and medium enterprises (SME‟s)
in Swaziland”: A case analysis, available at: http://sbaer.uca.edu/research/icsb/2004/
paper 91.pdf (accessed May 2012).
Kasekende, L., & Opondo, H. (2003). Financing small and medium entreprises: Uganda‟s
experience. Kampala: Bank of Uganda.
Kenya Association of Manufacturers, (2008). “Market Access for SMEs through Private and Public
Procurement in Kenya.
Kenya Association of Manufacturers, (2009). Market Access for SMEs through Private and Public
Procurement in Kenya.
Kenya Economic Report, (2009). Building a Globally Competitive Economy. Kenya Institute for
Public Policy Research and Analysis (KIPPRA).
Kibas, P. (2004). Who were Enterpreneurs?. Journal of Management (October, 2004), Nairobi:
Kenya Institute of Management (PP. 18-25).
Krasniqi, B.A. (2010), “Were small firms really credit constrained? Empirical evidence from
Kosova”, International Entrepreneurship and Management Journal, Vol. 6 No. 4, pp. 459-79.
King, K. & McGrawth, S. (2002). Globalisation, Enterprise and Knowledge: Educational Training
and Development. International Review of Education, Vol. 50(1).

74
Lewis, K., Massey, C., Ashby, M., Coetzer, A. and Harris, C. (2007), “Business assistance for
SMEs: New Zealand owner-managers make their assessment”, Journal of Small Business
and Enterprise Development, Vol. 14 No. 4, pp. 551-66.
Longenecker, J.G., Petty, C.W., Moore, J.W., and Palich, L.E. (2006). Small Business
Management. An enterpreneurial emphasis. London: Thompson South Western.
Lysons, K. & Farrington, B. (2006). Purchasing and Supply Chain Management (7th ed). Edinburg
gate, Harlow: Pearson Education Limited.
Muganda, N., & Fadhili, A. (2010). An evaluation of national culture and organizational capabilities
in information management offshoring. Unpublished paper presented at AIBUMA conference,
2010, Istanbul.
Olawale, F. and Garwe, D. (2010). Obstacles to the Growth of New SMEs in South Africa: A
Principal Component Analysis Approach. African Journal of Business Management, Vol4(5),
pp 729-738.
PPOA (2011). An Annual Summary of Public Tenders in Kenya.
Ronge, E., et al. (2002). Review of Government Policies for the promotion of Micro and Small
Scale Entreprises in Kenya: KIPPRA Discussion Paper No. 20.
Sofouli, E. and Vonortas, N. (2006), “S & T parks and business incubators in middle-sized
countries: the case of Greece”, Journal of Technology Transfer, Vol. 32 No. 5, pp. 525-44.

75
Schwartz, M. and Hornych, C. (2010), “Cooperation patterns of incubator firms and the impact of
incubator specialization: empirical evidence from Germany”, Technovation, Vol. 30
Nos 9/10, pp. 485-95.
Sekaran, U. (2006). Research methods for business: A skill building approach. 4th edition. New
Jersey: John Wiley and Sons, Inc.
Shi, J. and Li, P. (2006), “An initial review of policies for SMEs in the US, Japan and China”,
paper presented at Management of Innovation and Technology IEEE International
Conference, June 21-23, Singapore.
Smallbone, D. and Rogut, A. (2005), “The challenge facing SMEs in the EU‟s new member states”,
International Entrepreneurship and Management Journal, Vol. 1 No. 2, pp. 219-40.
Smith, M.H. and Smith, D. (2007), “Implementing strategically aligned performance
measurement in small firms”, International Journal of Production Economics, Vol. 106
No. 2, pp. 393-408.
Stel, A.V., Carree, M. and Thurik, R. (2005), “The effect of entrepreneurial activity on national
economic growth”, Small Business Economics, Vol. 24, pp. 311-21.
Town Council of Bondo (2012). Register For Business Enterprises.
Van Praag, M. and Versloot, P. (2007), “What is the value of entrepreneurship? A review of recent
research”, Small Business Economics, Vol. 29, pp. 351-82.

76
Wanjohi, A.M. (2009). Challenges facing SMEs in Kenya. Retrieved May 20, 2012 from
http://www.buzzle.com/articles/challenges-facing-smes-in-kenya.html.
Wasonga, J.K. (2008). Challenges in Financing SMEs in Kenya. The Experience of Fina Bank of
Kenya Limited. Unpublished MBA project, University of Nairobi.

77
APPENDIX 1: QUESTIONNAIRE
SECTION A: ORGANIZATIONAL BACKGROUND)
1. Name of your organization (Optional).............................................................................
2. Position of respondent in the firm.................................................................................
3. Approximate number of employees (Tick as appropriate)
i. ( ) 1-50 employees
ii. ( ) 51-100 employees
iii. ( ) 101-150 employees
iv. ( ) 151-200 employees
v. ( ) 201-250 employees
4. Area of Business (Tick appropriately)
i. Building & Construction ( )
ii. Stationary & Office Equipment ( )
iii. Furniture/Carpentry Workshop ( )
iv. Oil & Petroleum ( )
v. General Hardwares ( )
vi. Restaurants, Food & Beverage Supplies ( )
vii. Automotive Supplies & Garage ( )
viii. General Retail Stores ( )
5. Number of years in operataion ( Tick appropriately)
i. ( ) New & Less than one year
ii. ( ) 1- 5 years
iii. ( ) 6-10 years
iv. ( ) Over 10 years

78
6. Major source of funding (Tick appropriately )
i. ( ) Bank Loans
ii. ( ) Friends & Family
iii. ( ) Personal Savings
iv. ( ) Donor Funding
7. What is your organizations approximate annual turnover in Kenya shillings? (Tick
appropriately)
i. Below 1 million ( )
ii. 1-2 million ( )
iii. 2-5 million ( )
iv. Over 5 million ( )
SECTION B
Please Tick appropriately
8. Has your firm done contracts with local and or central government in the last 5 years.
i. Yes ( )
ii. No ( )
9. If item no. 8 above is “Yes”, what is the average percentage of your annual turnover that is
contributed by public contracts?
i. Less than 20 % ( )
ii. 20%-49% ( )
iii. 50%-74% ( )
iv. 75%-100% ( )

79
10. If no. 8 above is “yes” what is the average volume of public contracts that you have received
from the following public sectors over the last five years compared to your average annual
turnover?
Sector (1)
Below 5%
(2)
5-20%
(3)
21-49%
(4)
50-100%
Roads &
Public Works
Office of the
President
Agriculture &
Regional
Development
Health
Education
Local
Authority
11. If item no. 8 above is “No” give your reasons of not doing contracts with local and or central
government.
........................................................................................................................................................
........................................................................................................................................................
........................................................................................................................................................
........................................................................................................................................................
..............................................................................................................................................

80
12. Through what mode do you often receive public contracts information?
i. Newspaper advertisement ( )
ii. E-mail/Internet ( )
iii. Office Noticeboards ( )
iv. Friends & Networks ( )
13. How often have you been getting government contracts in the last 5 years?
i. Hardly any ( )
ii. Less often ( )
iii. Often ( )
iv. Very often ( )
14. Does your organization know public procurement rules and regulations applicable in Kenya?
( ) Yes ( ) No
15. Were public procurement rules favourable to your doing business with local or central
government?
( ) Yes ( ) No
16. Briefly explain your answer in item no.14 above
........................................................................................................................................................
....................................................................................................................................................

81
17. To what extent have the following factors affected your organizations access to public sector
contracts?
Factor V. Small
Extent
(1)
Small Extent
(2)
Neutral
(3)
Large Extent
(4)
V. Large
Extent
(5)
VAT
Registration
Requirement
Perceived
Corruption
SME Business
Licencing
Documentation
Level
Available Public
Contracts
Feedback from
Government
Size of contract
Existing
Framework
Arrangements
Finanacial Base
Skilled Human
Resources

82
Factor V. Small
Extent
(1)
Small Extent
(2)
Neutral
(3)
Large Extent
(4)
V. Large
Extent
(5)
Level of
Adoption of
Technology
Procurement
Time-scales
Procurement
Procedures
Selection
criteria
Contract
information
Volume
information
Cost of
Tendering
Cash Flow
position of your
firm
Pre-qualification
Requirement

83
18. State any other challenge(s) that your firm faces in accessing public contract:
........................................................................................................................................................
........................................................................................................................................................
........................................................................................................................................................
........................................................................................................................................................
........................................................................................................................................................
........................................................................................................................................................
..........................................................................................................................................

84
APPENDIX 2: SAMPLE SIZE FOR A GIVEN POPULATION SIZE
N S N S N S
10 10 220 140 1200 291
15 14 230 144 1300 297
20 19 240 148 1400 302
25 24 250 152 1500 306
30 28 260 155 1600 310
35 32 270 159 1700 313
40 36 280 162 1800 317
45 40 290 165 1900 320
50 44 300 169 2000 322
55 48 320 175 2200 327
60 52 340 181 2400 331
65 56 360 186 2600 335
70 59 380 191 2800 338
75 63 400 196 3000 341
80 66 420 201 3500 346
85 70 440 205 4000 351
90 73 460 210 4500 354
95 76 480 214 5000 357
100 80 500 217 6000 361
110 86 550 226 7000 364
120 92 600 234 8000 367
130 97 650 242 9000 368

85
N S N S N S
140 103 700 248 10000 370
150 108 750 254 15000 375
160 113 800 260 20000 377
170 118 850 265 30000 379
180 123 900 269 40000 380
190 127 950 274 50000 381
200 132 1000 278 75000 382
210 136 1100 285 100000 384
Source: Sekaran, (2006).

86
APPENDIX 3: DESCRIPTIVE STATISTICS OF RESEARCH VARIABLES
Variable N Minimum Maximum Mean Std.
Deviation
Coefficient
of
Variation
No of
Employees
116 1 1 1 0 0
Area of Business 116 1 8 3.34 0.37 0.110778443
No. of Years in
Operation
116 1 4 3.84 0.456 0.11875
Source of Funding 116 1 3 1.86 0.299 0.160752688
Annual Turnover 116 1 4 1.42 0.241 0.169108911
SME Public
Contracting
116 1 2 1.36 0.285 0.209558824
Volume of SME
Public Contracts
116 1 4 2.19 1.277 0.583105023
Roads & Public
Works Contracts
116 1 5 1.37 0.296 0.216243655
Office of the
President
116 1 5 1.09 0.198 0.181818182
Agriculture & Reg
Development
116 1 5 1.46 0.263 0.179886364
Health 116 1 5 1.28 0.245 0.191075269
Education 116 1 5 1.53 1.158 0.756862745
Local Authority 116 1 5 1.36 0.235 0.173053892
Mode of
Communicating
Public Contracts
116 1 4 4.07 0.857 0.210456024
SME Public
Contracting Freq.
116 1 3 2.06 0.362 0.160176991
SMEs in Public
Contracting
116 1 3 2.06 0.362 0.175728155

87
Knowledge of
PPDA
116 1 2 1.38 0.289 0.20942029
PPDA & SME
Contracting
116 1 2 1.47 0.356 0.242176871
VAT Registration 116 1 5 1.31 0.196 0.14978355
Perceived
Corruption
116 1 5 4.36 0.459 0.105275229
SME Licensing 116 1 5 1.52 0.217 0.142763158
Tender
Documentation
Level
116 1 5 3.74 1.002 0.267914439
Available Public
Contracts
116 1 5 3.48 0.838 0.240804598
Feedback 116 1 5 4.29 1.022 0.238228438
Lot Sizes 116 1 5 4.19 1.104 0.263484487
Framework
Arrangements
116 1 5 4.09 0.696 0.370171149
Capital / Finance 116 1 5 2.98 1.906 0.639597315
Skilled HR Base 116 1 5 1.47 1.273 0.865986395
Technology
Adoption
116 1 5 1.81 1.317 0.727624309
Procurement Time-
Scales
116 1 5 3.5 0.94 0.268571429
Procurement
Procedures
116 1 5 3.5 0.94 0.268571429
Selection Criteria 116 1 5 4.55 0.742 0.163076923
Bid Information 116 1 5 4.55 0.927 0.229010989
Volume of
Information
116 1 5 4.64 1.135 0.244612069
Cost of Tendering 116 1 5 4.43 1.058 0.238826185
Cash Flow Position 116 1 5 3.71 0.487 0.131230284
Pre-Qualification 114 1 5 3.73 0.792 0.212332439
Source: Research Data (2012)

88
APPENDIX 4: LIST OF SMEs IN BONDO DISTRICT
A. General Retail Stores
1. Bondo Discount Traders
2. Cajo Mwalimu Stores
3. Cajo Supermarkets
4. D & G Shop
5. Emmanuel Stores
6. Gejomiks Enterprises
7. Imani General Stores
8. Kanyaseme Enterprises
9. New Jabondo Stores
10. New Jaribu Stores
11. Omsai Supermarkets
12. Oseki Stores
13. Raoja Agencies
14. Saroko Shop
15. Taratibu Traders
16. Uptown General Stores
B. Restaurant, Food & Beverage
1. Agwambo Butcheries
1. Apiyo Gardens
2. Augustino Hotel Services
3. Bondo Hotel

89
4. Care For The Earth Entreprises
5. Casanoda Hotel
2. Christian Centre 84 Hotel
3. Goodluck Hotel
6. Green Court Hotel
7. Hotel View Point
8. Kings Club
9. Lake Breze Hotel
4. Lara Cafe
10. Lizer Conference Centre
11. Lwak Family Life Training Centre
5. Mbeya Hotel
12. Migosi Vegetables Entreprises
13. Modern Farmers Entreprises
14. Mwalimu Hotel
15. Ndolo Soft Drink Suppliers
6. New Choma Hotel
7. Nyaukwala Hotel
16. Oki Grand Hotel
17. Ombe Butcheries
8. Osiendega Cafe
9. Panama Hotel
18. Passover Hotel
10. Ranalo Cafe
19. Rozala Motel
11. Sarafina Cafe

90
12. Savana Hotel
20. Sembo Food Parlour
21. Siaya Hotel Entreprises
13. Summer World Hotel
22. Switel Entreprises
14. Times Cafe
15. Victoria Cafe
23. Walkers Hotel
16. Wimpy Hotel
24. Yimbo Farm Supplies Entreprises
C. General Hardwweres
1. Adunga Hardware
2. Agot Mini Hardware
3. Bei Rahisi Hardware
4. Bondo Hardware
5. Bondo Rafiki Hardware
6. Giri Giri Hardware
7. Kadongo Hardware
8. Kokinda General Hardware
9. Nema Hardware
10. Ngero General Hardware
11. Nyagobei Hardware
12. Nyobinda Hardware
13. Olumbe Hardware

91
14. Ramogi Hardware
15. Uyawi General Hardware
16. Victoria Plumbing Hardware
D. Building & Construction
1. Bachu Construction Works
2. Bondo Highway Workshop
3. Caukoms Digitech
4. Eagle Fly Company Limited
5. Geel Construction Company
6. Glory Electronics
7. Gogo Builders
8. Golden Construction Company
9. Gope Builders and Contractors
10. Industrial Electrical & Electronics
11. Jakito Contractors
12. Joko Contractors
13. Kadongo Contractors
14. Kajakotieno Engineering Works
15. Mahewa Engineering Works
16. Mikato Building Suppliers
17. Milongo Construction Limited
18. Nyambeka Contractors
19. Nyamseria Entreprises Limited
20. Nyongesa Metal Works
21. Owuor Agot Construction Company

92
22. Ramoko Contractors
23. Rhok Construction & Allied Services Company
24. Sigma Stone Construction Company
25. Steel Fabricators-Bondo
26. Supplies Extra Company & Construction Limited
27. Wang‟ Neno Engineering Works
E. Automotive Supplies & Garages
1. Armstone Cycle Spares
2. Asembo Auto Spares
3. Bajaj Automotive
4. Bajaj Enterprises
5. Bondo Auto-Tech Limited
6. Forever Cycle Mart
7. Friends Auto Garage
8. Guba Motor Cycle Garage
9. Kalulu Motor Works
10. Oriko Motor Cycle Spares
11. Raggy Motor Bike Spares
12. Rambo Motor Cycle Garage
13. Simwata Cycle Mart
14. Ten by Ten Auto Spares
15. Ugambe Enterprises
16. Auto-Part Suppliers
17. Bondo Juakali Fabricators

93
18. Kobong Automotive Garage
19. Kester Auto-Shop
20. Kolili Autogarage Limited
21. Meemu Auto Repairs
F. Oil & Petroleum Supplies
1. Bondo Filling Station
2. Bondo Total Petrol Station
3. Dalpon Petrol Station
4. Elshadai Filling Station
5. Grace Filling Station
6. Mamba Filling Station
G. Furniture/Carpentry Workshop
1. Anyuola General Furniture
2. Asembo Furniture
3. Ayunzu‟s Furniture
4. Kakuma Fabricators
5. Mos Mos Furniture
6. Osiepe Carpentry & Joinery
7. Pimp Fabricators
8. Ricone Fabricators
9. Sawa Woodwork
H. Transporters
1. Amalo Transporters

94
2. Kibora Transporters Sacco
3. Kolaka Tours & Travel
4. Kopar Transporters Limited
5. Nyayueni Transporters
6. Ratego Transporters
7. Sonko Transporters
I. Bookshop, Stationery & Office Equipment
1. Akuku Stationers
2. Bako Colour Printers & General Suppliers
3. Bondo Stationers
4. Compuera Machine Suppliers
5. Cosmos General Suppliers
6. Direland Stationers
7. Equator General Suppliers
8. Judo Printers
9. Keya Suppliers
10. Korex Entreprises
11. Lotex Computers
12. Madibu Stationers
13. Mariwa Bookshop
14. Medin General Suppliers
15. Miduri Stationers
16. Milobo Office Equipment Suppliers
17. Odek General Suppliers
18. Otocom Computers & Networking Limited

95
19. Paradise Select Enterprises
20. Pimp Stationers
21. Ricone General suppliers
22. Ricone Stationers
23. Sihay Stationers
24. Teko Computers Limited
Source: Town Council of Bondo (2012). Register For Business Enterprises.