ch4: 4.3the normal distribution 4.4the exponential distribution
TRANSCRIPT

Ch4:
4.3 The Normal distribution
4.4 The Exponential Distribution

The Normal Distribution Section 4.3
1) Experiments of interest
2) Sample space
3) Random variable
Many!! As long as the shape of the distribution is symmetrical and bell-shaped.
Or assumed to be with the chance of observing the too large and too small values being very small
The Normal Distribution Section 4.3
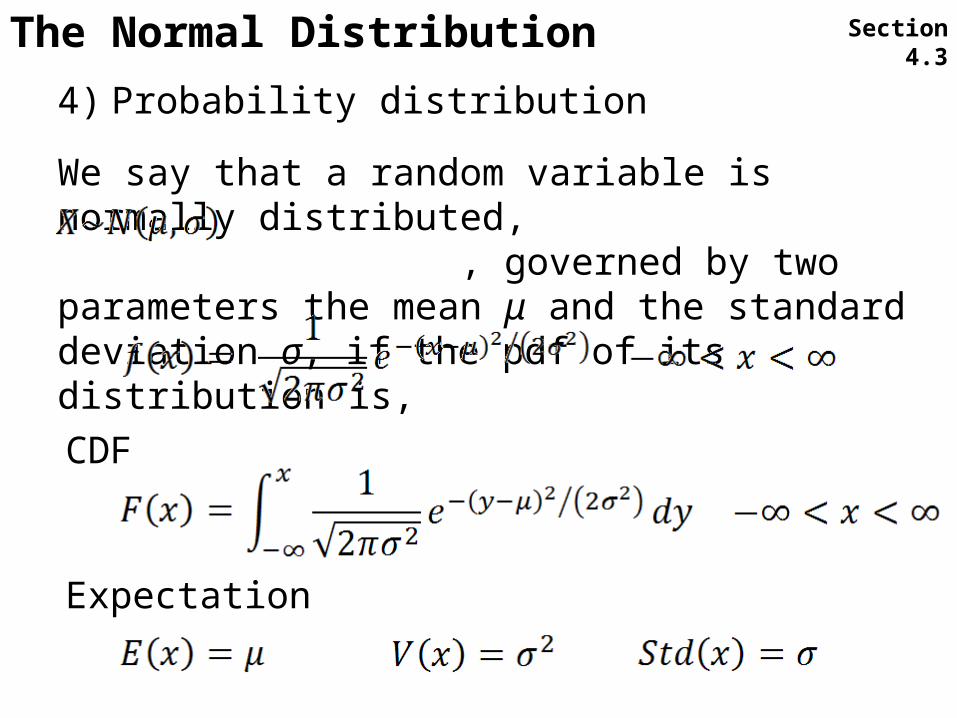
4) Probability distribution
We say that a random variable is normally distributed, , governed by two parameters the mean μ and the standard deviation σ, if the pdf of its distribution is,
CDF
Expectation

The Normal Distribution Section 4.3
The standard NormalDefine a new random variable Z that is a function of X,
Z is said to have a standard normal distribution with mean = μ = 0 and standard deviation = σ = 1,
pdf,
A CDF, , as provided by Table A.3 pages 668-669
The Normal Distribution Section 4.3
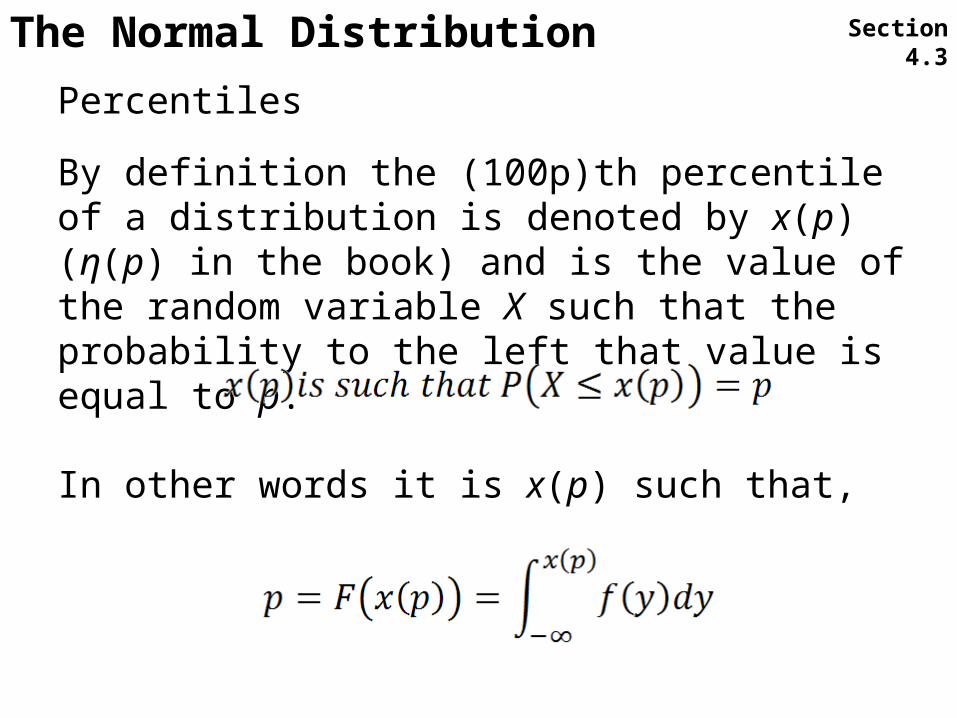
Percentiles
By definition the (100p)th percentile of a distribution is denoted by x(p) (η(p) in the book) and is the value of the random variable X such that the probability to the left that value is equal to p.
In other words it is x(p) such that,
The Normal Distribution Section 4.3
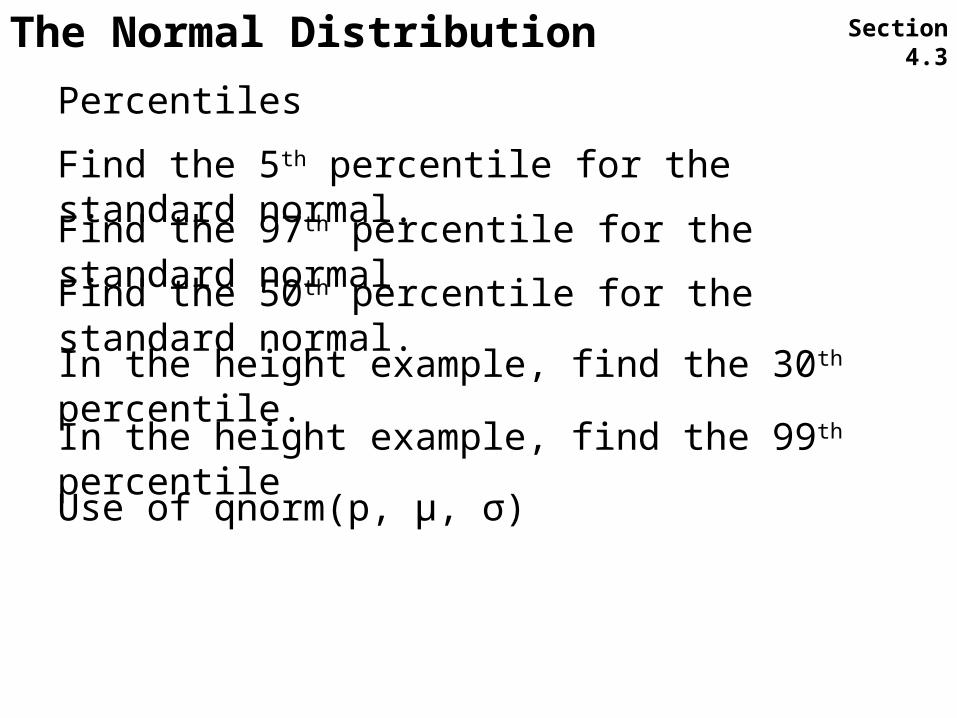
Percentiles
Find the 5th percentile for the standard normal.
Find the 97th percentile for the standard normal
Find the 50th percentile for the standard normal.
In the height example, find the 30th percentile.
In the height example, find the 99th percentile
Use of qnorm(p, μ, σ)

The Normal Distribution Section 4.3
zα = x(1-α) = equal to the (1-α)th percentile; we will get back to this when we start constructing confidence intervals and testing hypotheses. At that point I will emphasize the percentiles a bit more.
Find the z0.05

The Normal Distribution Section 4.3
Approximating the Binomial
If , with , then we can use the normal distribution to approximate this distribution as follows,
That is X is approximately normal with
The Normal Distribution Section 4.3
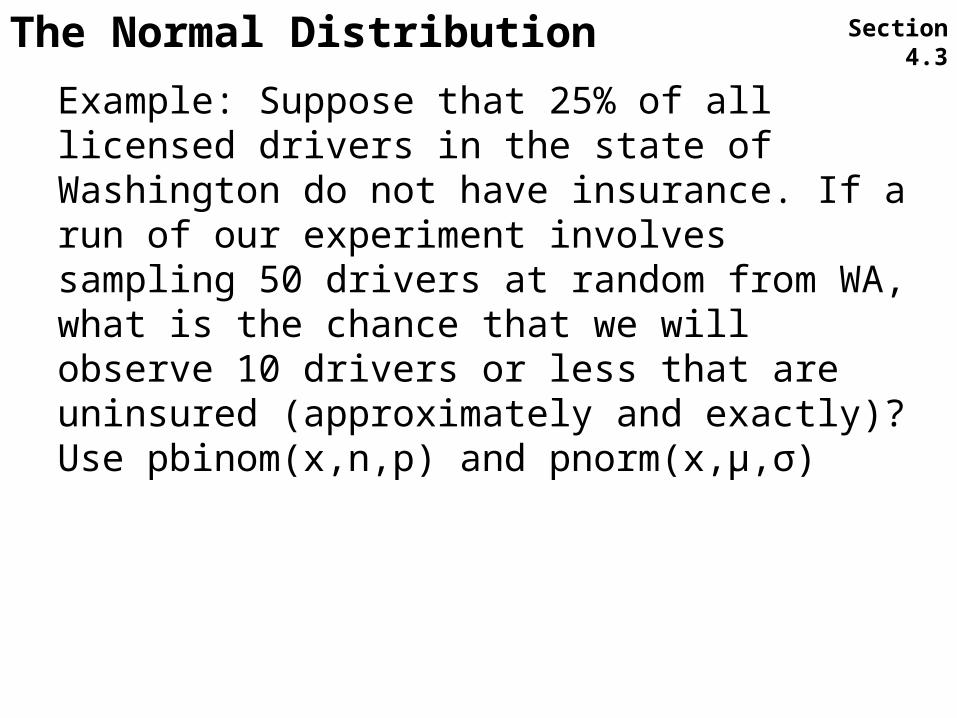
Example: Suppose that 25% of all licensed drivers in the state of Washington do not have insurance. If a run of our experiment involves sampling 50 drivers at random from WA, what is the chance that we will observe 10 drivers or less that are uninsured (approximately and exactly)? Use pbinom(x,n,p) and pnorm(x,μ,σ)

1) Experiments of interest
Many!! Mostly in association with time; specifically: component life time (if that component can be assumed not to change over time) and times between occurrence of multiple events in a Poisson process.
The Exponential Distribution Section 4.4

The Exponential Distribution Section 4.4
2) Sample space
3) Random variable

The Exponential Distribution Section 4.4
4) Probability distribution
We say that a random variable is exponentially distributed, , governed by parameter λ if the pdf of its distribution is,
CDF,
Expectation,

pdf based on λ = 5 is
The Exponential Distribution Section 4.4
0.0 0.5 1.0 1.5 2.0 2.5 3.0
01
23
45
x
f(x)

The Exponential Distribution Section 4.4
Example (time between events in a Poisson process)The mean number of cars passing the sixth and Mountain view intersection, close to the edge of Moscow, is 5 per hour. If we have just seen a car pass through, what is the chance that the next car is going to go by in 10 minutes?

1) Experiments of interest?
The Exponential Distribution Section 4.4
2) Sample space
3) Random variable
4) Probability distribution
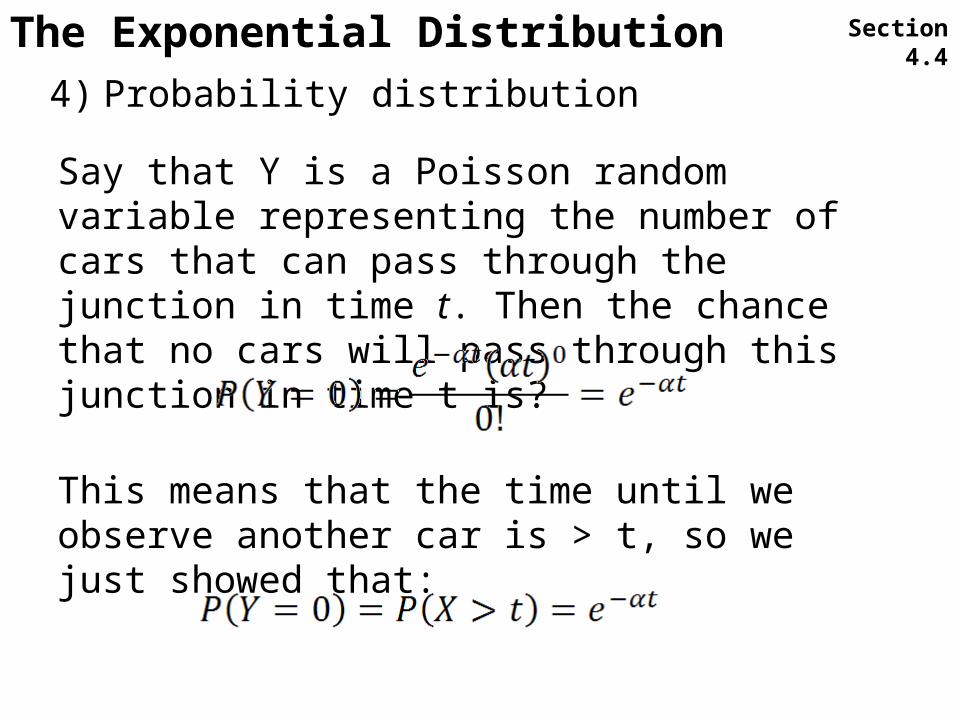
Say that Y is a Poisson random variable representing the number of cars that can pass through the junction in time t. Then the chance that no cars will pass through this junction in time t is?
This means that the time until we observe another car is > t, so we just showed that:
The Exponential Distribution Section 4.4

4) Probability distribution
If we change t to x, and replace α with λ we can find the chance that the time for the next car to show up to be less than or equal to x from the following:
The Exponential Distribution Section 4.4
That is the time between any two successive events is exponentially distributed with parameter λ.
Mean time between any two successive cars is expected to be 1/5 = 0.2hr and variance is 0.04.
So,

The Exponential Distribution Section 4.4
Example (component life time and the memory less property) In quality control of electronic components circuits are exposed to stress, usually high temperature, while operating and the time until they stop is observed. Suppose that the wear on these components prior to break down is negligible, then the time until break down can be modeled using an exponential distribution. Say that the mean time until a break down under a stress of 200oF is 30 days, what is the chance that a component will break within two weeks under these conditions.

The Exponential Distribution Section 4.4
Example (component life time and the memory less property) Given that the component didn’t break after it was subjected to high temperature for 5 days what is the chance that it will break in the next two weeks?

Other distribution Section 4.4
There are many other continuous distributions that we can use in modeling. For example,
GammaWeibullDirechleBetaLognormalAmong others
These differ in the types of experiments they model and their sample space and resulting random variables. They all depend on the pattern that we think the data might have.

Ch5:
5.1-3 Jointly distributed random variables, Expectation, and Statistics and their distributions (JES)

JES Section 5.1-3