ch. 10 detection and attribution of climate change: from global to regional 3 november 2014 brian...
TRANSCRIPT

Ch. 10Detection and Attribution of
Climate Change:From Global to Regional
3 November 2014Brian Crow
Sam Atwood

Ch. 10Detection and Attribution of Climate
Change
Question:What are the causes of changes in climate reported in Ch 2-5?
Anthropogenic Forcing Natural Forcing Internal Climate Variability
Addresses data and observations from past to the present Last Century Last Millennium Future only addressed in terms of Equilibrium Climate Sensitivity
Uncertainties from AR4 addressed, e.g. Ocean temperature Observations inconsistent with Climate Models Detection and Attribution studies on Precipitation had not been done
Notes: Focus on explaining concepts to a wide audience
“To show how this fit is obtained in non-technical terms…” Lots of justification for all of the choices made

Detection and Attribution StudiesMethodology
What are D & A studies: Quantify causal links between external CC drivers and
observed changes in climate variables Central (though not only) line of evidence for statements:
“Most of the observed increase in global average temperatures since the mid-20th century is very likely due to the observed increase in anthropogenic greenhouse gas concentrations”
Detection: Statistical change in a climate variable“The process of demonstrating that climate or a system affected by climate has changed in some defined statistical sense without providing a reason for that change.”
Attribution: The cause of the change“The process of evaluating the relative contributions of multiple causal factor to a change or event with an assignment of statistical confidence.”
Detection and Attribution StudiesMethodology
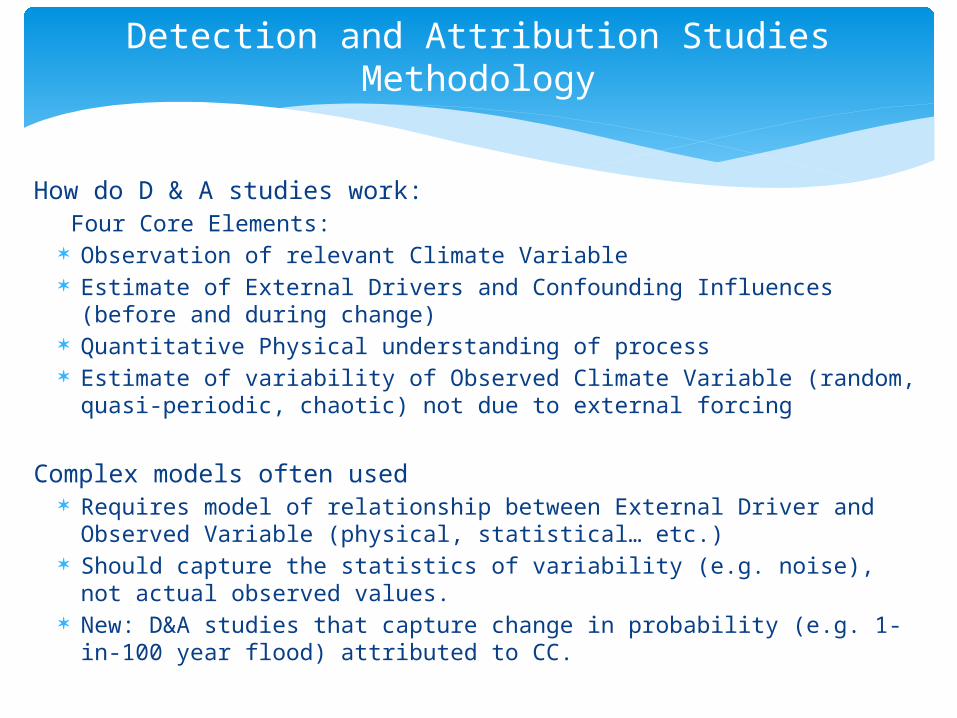
How do D & A studies work:Four Core Elements:
Observation of relevant Climate Variable Estimate of External Drivers and Confounding Influences (before
and during change) Quantitative Physical understanding of process Estimate of variability of Observed Climate Variable (random,
quasi-periodic, chaotic) not due to external forcing
Complex models often used Requires model of relationship between External Driver and
Observed Variable (physical, statistical… etc.) Should capture the statistics of variability (e.g. noise), not actual
observed values. New: D&A studies that capture change in probability (e.g. 1-in-100
year flood) attributed to CC.

Detection and Attribution StudiesFingerprint Studies
Simple Example Method:Compare model of (Natural + Anthropogenic) Forcings to Natural Forcings only.
Look for consistency with one and inconsistency with the other Attribution is warranted if this condition holds, provided that the model
correctly simulates all important processes and external drivers Big Assumption:
Most D&A studies instead assume the “shape” of their model response to external forcing is correct, rather than its magnitude.
Fingerprint D&A study Scaling Factors: Shape of model response (large-scale pattern in space
and/or time); can be scaled while remaining consistent with observations Model: Scaling Factor best estimate and uncertainty (e.g. mean and std
dev) Scaling Factor > 0: Response to a forcing is detectible in Obs. Scaling Factor = 1: Model response in consistent with Observations Scaling Factor > 0; 1: Unknown or unrepresented forcing; Or,
confounding factor

Detection and Attribution StudiesFingerprint Studies
Estimating Response to External Forcing Estimate separately – Errors may incorrectly affect response Estimate combined forcing response – Smaller uncertainty, but less
knowledge of response to each forcing Most studies estimate separately – Justify by use of spatial
information
Fit Model simulated response to observations Linear addition of forcing response by Scaling Factor
Good for: Large-scale temperature changes Not so good for: Precipitation, regional temperature changes
No non-additive (non-linear) approaches used to date
Internal Climate Variability (ICV) Primary estimate from Models Check these estimates against direct observations, paleoclimate
proxies and reconstructions

Detection and Attribution StudiesFingerprint Studies
Observations (dots) indicate observed warming
GMST response in CMIP3 & CMIP5 Orange: Anthropogenic GHG & aerosol forcing Blue: Natural solar and volcanic forcing Black: Best-fit linear fingerprint combination Residuals: Internal Climate Variability
Attribution of Observations to both fingerprints via the linear best-fit plane The scaling factors for each fingerprint are the
slope of the plane
Grey diamonds: Modulate Observations by ICV This uncertainty is mapped onto scaling factors
to include uncertainty
Separation of red cross and ellipse indicate ICV does not account for warming External influence on warming is indicated
Scaling Factors 1 Models underestimating the response to both
Forcings Anthropogenic within Confidence Interval Natural is not with Confidence Interval


Detection and Attribution StudiesFingerprinting GCMs
Real Observations are limited in time, space, and frequency Model runs “observe” at these data points for comparison
GCM Fingerprints improve understanding of Forcing and Response relationship
Result depends on accuracy of GCM response “Shape” Scaling of multiple factors may allow for contamination of
response by ICV
Optimal Fingerprinting Model simulated response and “Observations” are
generated Normalized by ICV to improve Signal/Noise ratio

Detection and Attribution StudiesAdditional Methods
Other methods generally agree with Fingerprint studies
Separation of Signal and Noise By spatial pattern and/or time scale
Econometric methods Estimate of Internal Climate Variability based on statistics of observations Still require a model, though don’t depend on errors in Climate Models
Time Series Methods e.g. Assume a single exponential decay time for a response to both External
Forcing, and Stochastic Fluctuations
Multi-Step Attribution For variables without a long and consistent set of observations or explicit model
relationship to External Forcing First-Step: Attribute a change in and variable to a Forcing (with uncertainty)
e.g. Large-Scale surface temperature change due to GHG increase Next-Steps: Add Physical or Statistical relationship to another variable
e.g. Regional surface temperature change associated with large-scale change Overall conclusion is as robust as the least certain link

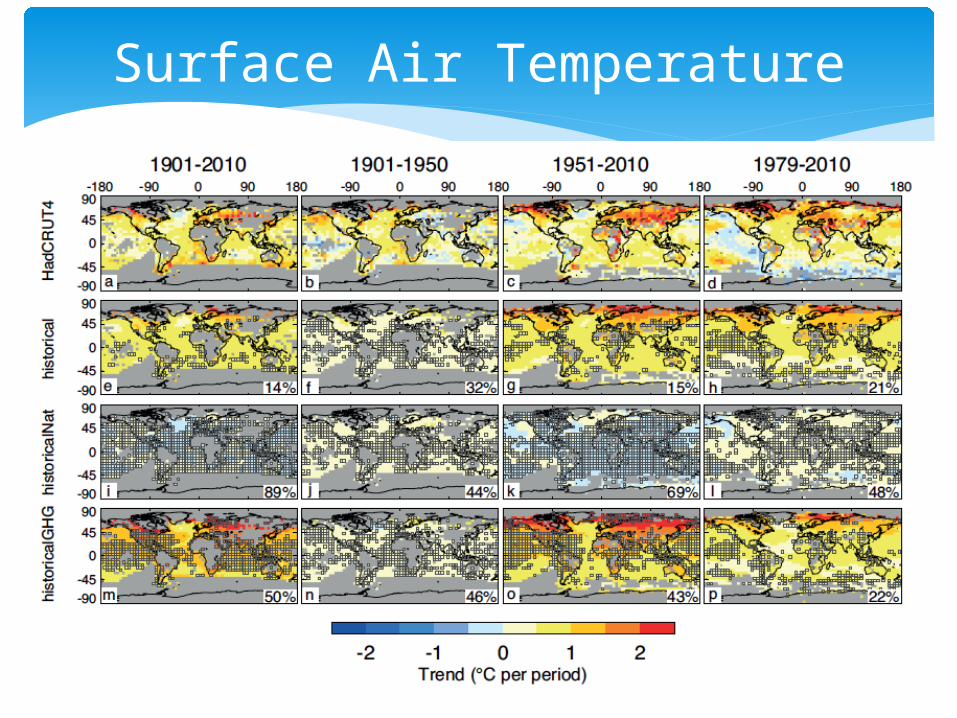
Surface Air Temperature
All forcings
Natural forcing only
GHG forcing only
Surface Air Temperature

Attribution of Warming

Urbanization is unlikely to be responsible for more than ~10% of observed trend
Solar forcing contributed AT MOST 10% of warming since 1900
Observed warming trend still detectable even if magnitude of natural variability tripled
Anthropogenic GHGs very likely responsible for > 50% of observed warming
Global-Scale Temperature Trends

Regional Temperature Trends

ALLNaturalGHGHadley CentreRAOBCORERICH
Atmospheric Temperatures
1961-2010Lott et al. 2013

Regional changes far harder to attribute to human activity Higher variability, circulation changes, etc.
Each climate forcing produces different vertical and zonal warming patterns
Very likely that anthropogenic forcing has created observed warming troposphere/cooling stratosphere pattern since 1961
Regional Trends and Atmospheric Temperature Profile Trends

Medium confidence in anthropogenic contributions to observed water vapor increase
Detection & attribution of hydrologic variables is very difficult
Anthropogenic fingerprint has been detected in observed annual zonal-mean precip Increases at high latitudes, decreases in subtropics
Medium confidence in anthropogenic influences on streamflow and precipitation over land
Water Cycle

Hadley Cell Expansion
Latitude
DJF change in southern border of Hadley Cell, 1979-2005

Low confidence in any changes to ENSO, the Indian Ocean Dipole (IOD), PDO, or AMO
NAO had exhibited significant positive trend 1960s-1990s, but has since reversed
Southern Annular Mode (SAM) has significant positive trend over 1951-2011 Driven by GHGs, ODSs
Likely that humans have altered SLP patterns since 1951
Circulation Changes

Ocean Heat Content

Very likely that ocean heat content increases since 1970s have a significant anthropogenic contribution
High confidence that thermal expansion and non-Antarctic glacial melt explain 75% of SL rise since 1971 Large anthropogenic contributions to both factors
Very high confidence that anthropogenic CO2 has acidified ocean surface by -0.0015 to -0.0024 pH/year
Influence on Ocean Properties

Human influence on sea ice robustly detectable since 1990s
¾ of Arctic summer sea ice volume has been lost since 1980s
Low confidence in explaining Antarctic sea ice trends
High confidence that significant portion of glacier mass loss is likely anthropogenic
Cryosphere
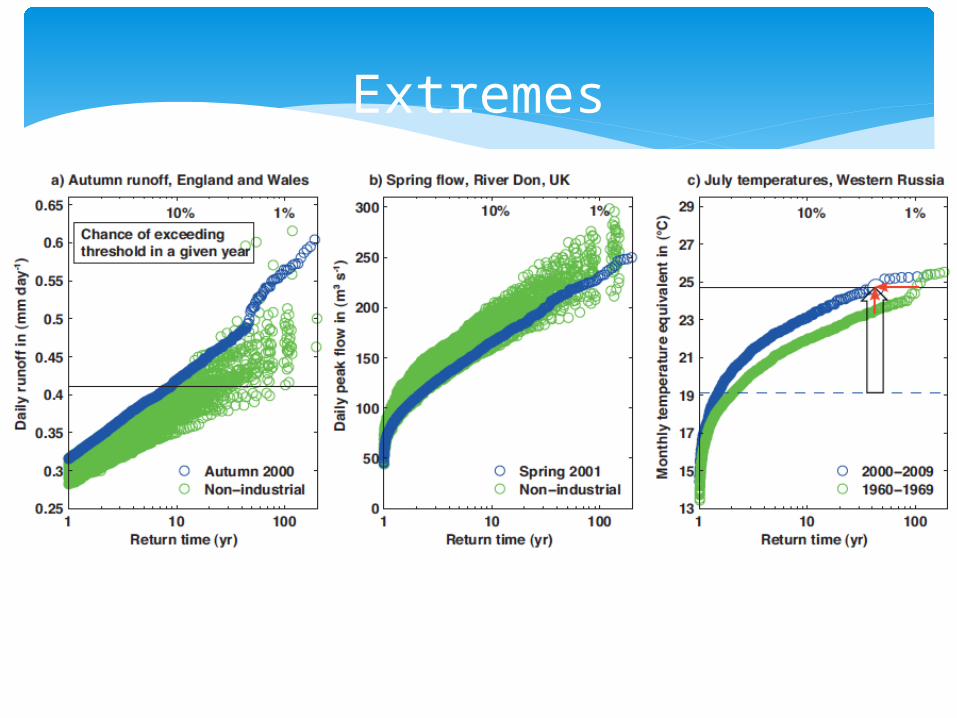
Extremes

Very likely humans have contributed to observed changes in frequency & intensity of daily temperature extremes since 1950
Medium confidence anthropogenic forcing has contributed to intensification of heavy precipitation since 1950
Recent long-term droughts can’t yet be shown to be outside natural variability
Low confidence in attributing changes in drought
Low confidence in any long-term trends in tropical cyclone frequency
Extremes

Multi-Century to Millennia Pre 20th-Century Changes
Validate understanding of climate system Greater uncertainties in indirect or proxy datasets Periods of past NH mean temperature changes can be robustly identified
Natural Forcings seen in Seven centuries prior to 1950 10th Century: Can’t explain in some models Little Ice Age: External Forcing in cooling of NH temperatures 16th & 17th Centuries: Small drop in GHG contributed to cool conditions Solar Forcing: Not clear – But lower agreement for large solar forcing runs Volcanic Forcing: Evident
Internal Climate Variability – inter-decadal and longer scales Different for simulations with
vs without past External Forcings
Validates finding that “a large fraction of temperature variance in the last millennium has been externally driven.”
However, the past 50-60 year trend in Observations is far outside the range of past reconstructions of NH mean temperature in the last millennium

Multi-Century to Millennia Regional Temperature in
Europe Detectable fingerprint
response in temperature record
Forced Response + ICV reproduces MCA better than Force Only simulations
Volcanic fingerprint detectable in European summer temperatures
Similar fingerprint responses in other regions Volcanism in North America Decrease in SST following Volcanic Forcing Solar Influences on Regional Climate Reconstructions (possibly due to circulation changes)
Results Volcanic and GHG Forcings are most important for explaining past changes in NH temperature ICV + External Forcings provide consistent explanation of last millennium Very Unlikely that NH Temp from 1400 to 1850 can be explained by ICV alone Medium Confidence that external forcing contributed to NH Temp variability between 850 and
1400 Medium Confidence external forcing (Anthropogenic + Natural) contributed to European
Temperatures over last five centuries

Transient Climate Response
Magnitude of transient warming while climate system is equilibrating Short to Medium time scale response Better constrained by observations
than ECS TCR Definition:
Warming that has occurred at the time of CO2 doubling
~70 years for 1% yr-1 increasing CO2
TCR is a generic property that can be scaled against this number
Scaling Factors from D&A studies used to scale GHG and aerosol response against historical observations
Bounds on TCR: Likely within 1°C to 2.5°C Extremely Unlikely to be > 3°C Range is smaller than AR4 due to stronger observational constraints

Equilibrium Climate Sensitivity Long-term equilibrium warming response
Stable Atmospheric Conditions Doesn’t account for vegetation or ice sheet
changes Less constrained by Observations than TCR
ECS definition: Warming in response to sustained doubling
of CO2 Equilibrium for ocean-atmosphere system
ECS bounds based on: Recent Temperature Change TOA Radiative Balance Volcanic Forcing and ICV Paleoclimate
Low ECS estimates “problematic”
Overall Bounds on ECS: High Confidence that ECS is Extremely Unlikely < 1°C Medium Confidence that ECS is Likely between 1.5°C and 4.5°C Medium Confidence that ECS is Very Unlikely > 6°C Supports overall assessment in Ch 12

Synthesis – Global Climate Signals
Treatment of full Earth-System, rather than individual aspects Looking for consistent picture across sub-systems and climate
variables Multi-Variable Approach

Synthesis – Regional Climate Signals

FAQ: When will Human Influences on Climate Become Obvious on Local Scales?Surface Temperature Anomalies
CMIP5 forced by RCP8.5 emissions scenario First signs in Tropical Summer locations
Temperature increase needed for “Emergence from the envelope of early 20th century variability”

Conclusions
D&A studies focus on quantitative identification of the causes of observed change
Adds on to findings of AR4 – Focus on wide audience
Not Natural Forcing
Change in a number of climate variables is detectable and attributable to Human activity