ch 09 theories of oligopoly
TRANSCRIPT

제 9 장과점이론의기초
Basic Theories of Oligopoly

과점시장Oligopoly Environment
• Relatively few firms, usually less than 10.• “Oligospolein” (few to sell)
� Duopoly - two firms� Triopoly - three firms
• The products firms offer can be either differentiated or homogeneous.
• 상품차별화가능성
전략적상호작용Role of Strategic Interaction
• Your actions affect the profits of your rivals.
• Your rivals’ actions affect your profits.
• Interdependence(상호의존성, “서로눈치보기”)
An Example
• You and another firm sell differentiated products.• How does the quantity demanded for your product
change when you change your price?
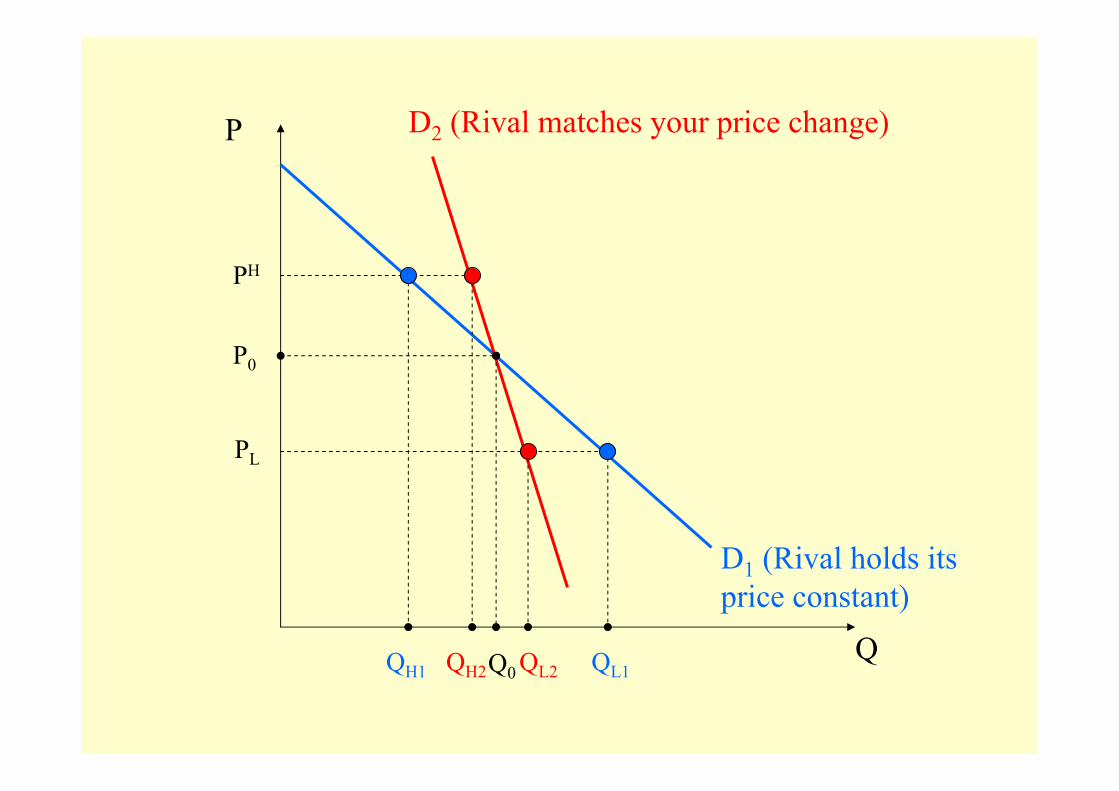
P
Q
D1 (Rival holds itsprice constant)
P0
PL
D2 (Rival matches your price change)
PH
Q0 QL2 QL1QH1 QH2
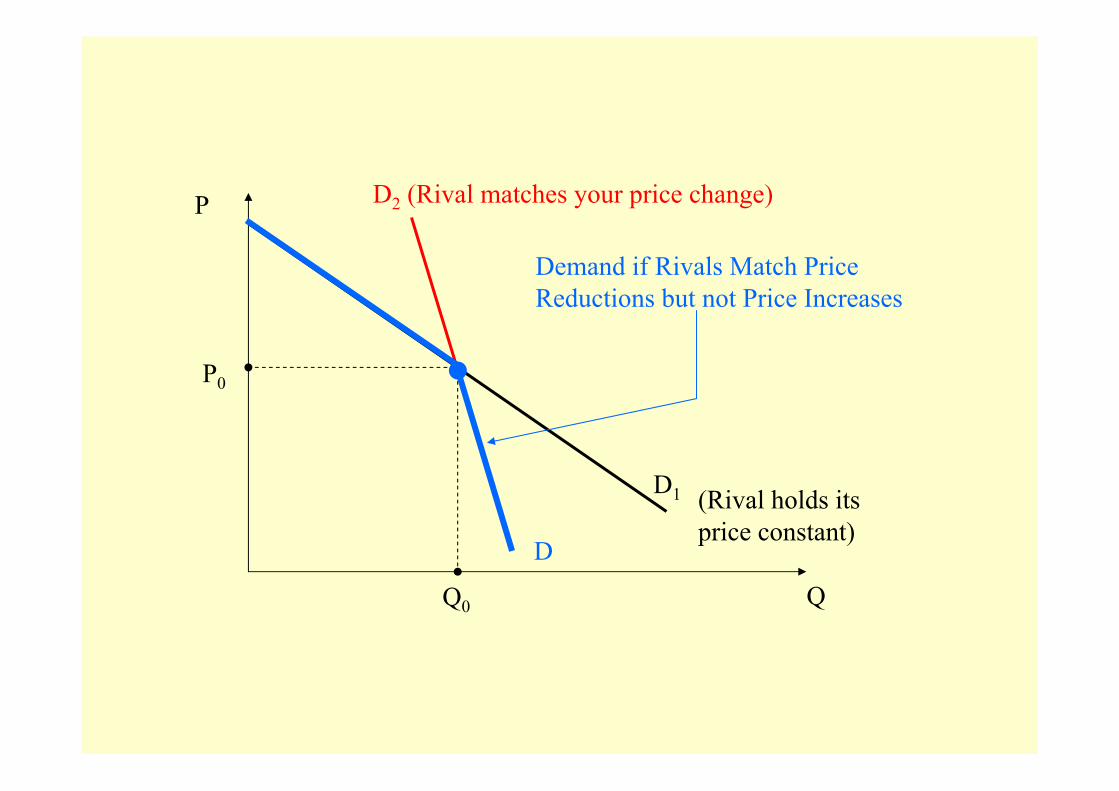
P
Q
D1
P0
Q0
D2 (Rival matches your price change)
(Rival holds itsprice constant)
D
Demand if Rivals Match Price Reductions but not Price Increases
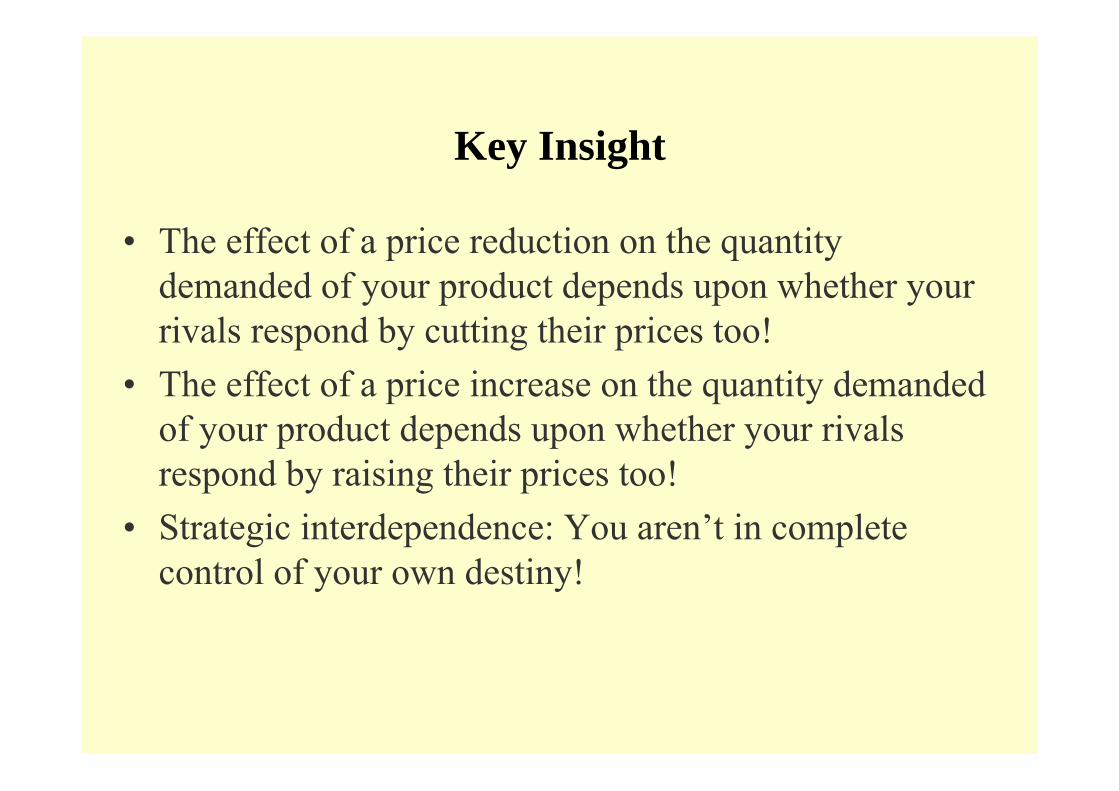
Key Insight
• The effect of a price reduction on the quantity demanded of your product depends upon whether your rivals respond by cutting their prices too!
• The effect of a price increase on the quantity demanded of your product depends upon whether your rivals respond by raising their prices too!
• Strategic interdependence: You aren’t in complete control of your own destiny!
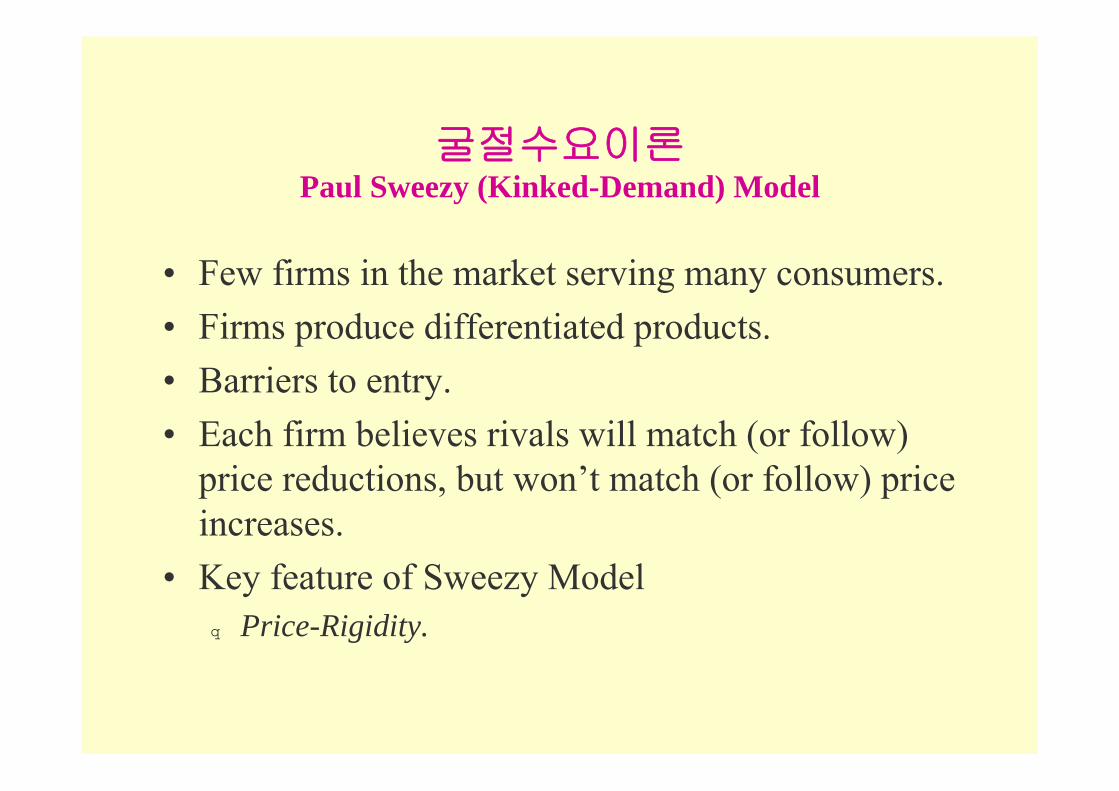
굴절수요이론Paul Sweezy (Kinked-Demand) Model
• Few firms in the market serving many consumers.• Firms produce differentiated products.• Barriers to entry.• Each firm believes rivals will match (or follow)
price reductions, but won’t match (or follow) price increases.
• Key feature of Sweezy Model� Price-Rigidity.
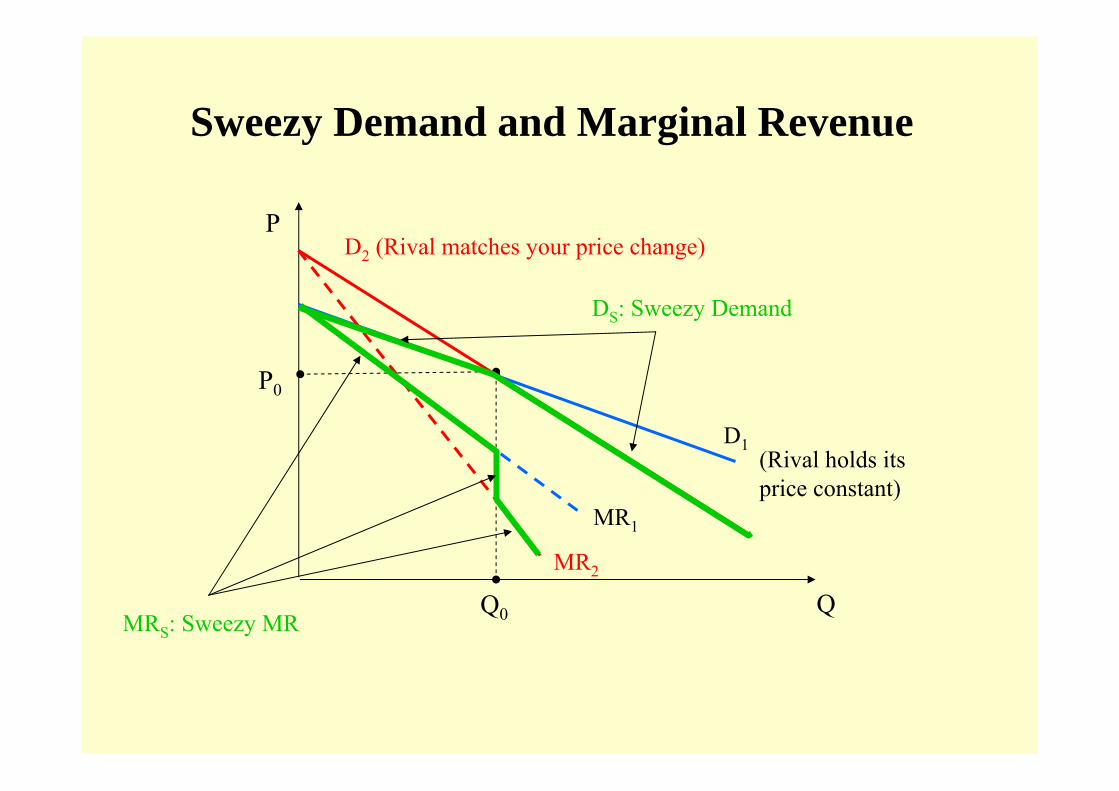
Sweezy Demand and Marginal Revenue
P
Q
P0
Q0
D1(Rival holds itsprice constant)
MR1
D2 (Rival matches your price change)
MR2
DS: Sweezy Demand
MRS: Sweezy MR
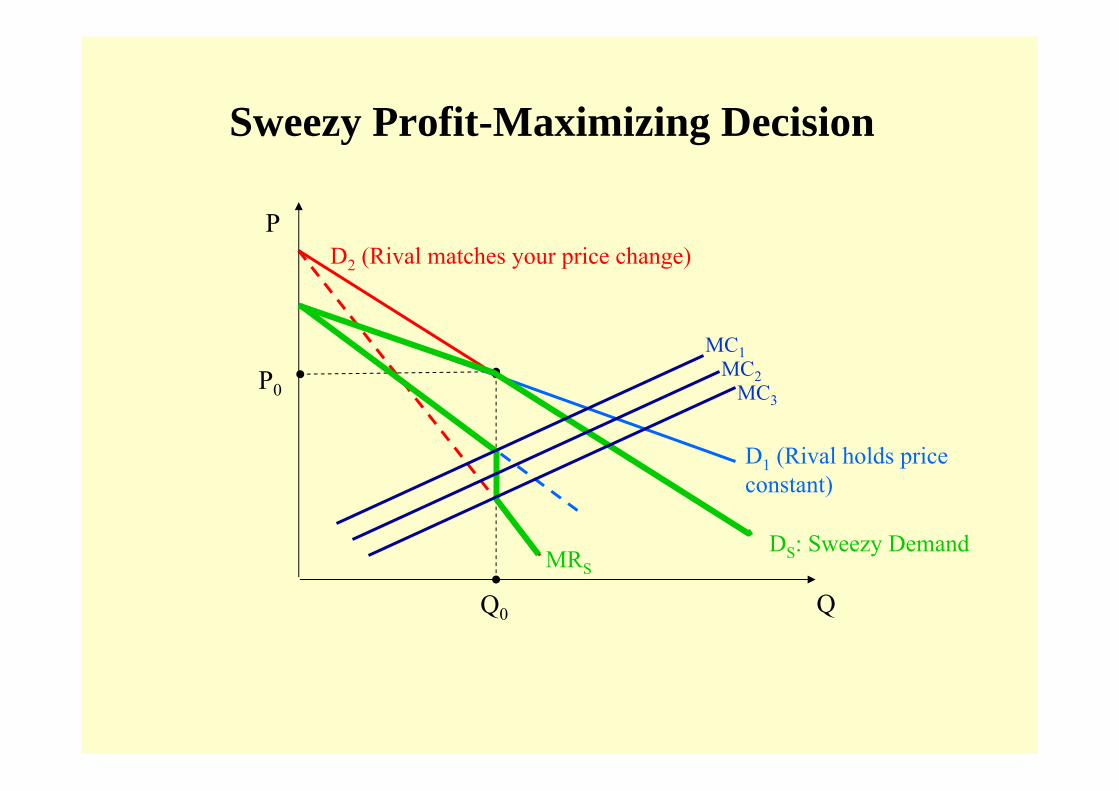
Sweezy Profit-Maximizing Decision
P
Q
P0
Q0
DS: Sweezy DemandMRS
MC1MC2
MC3
D2 (Rival matches your price change)
D1 (Rival holds price constant)
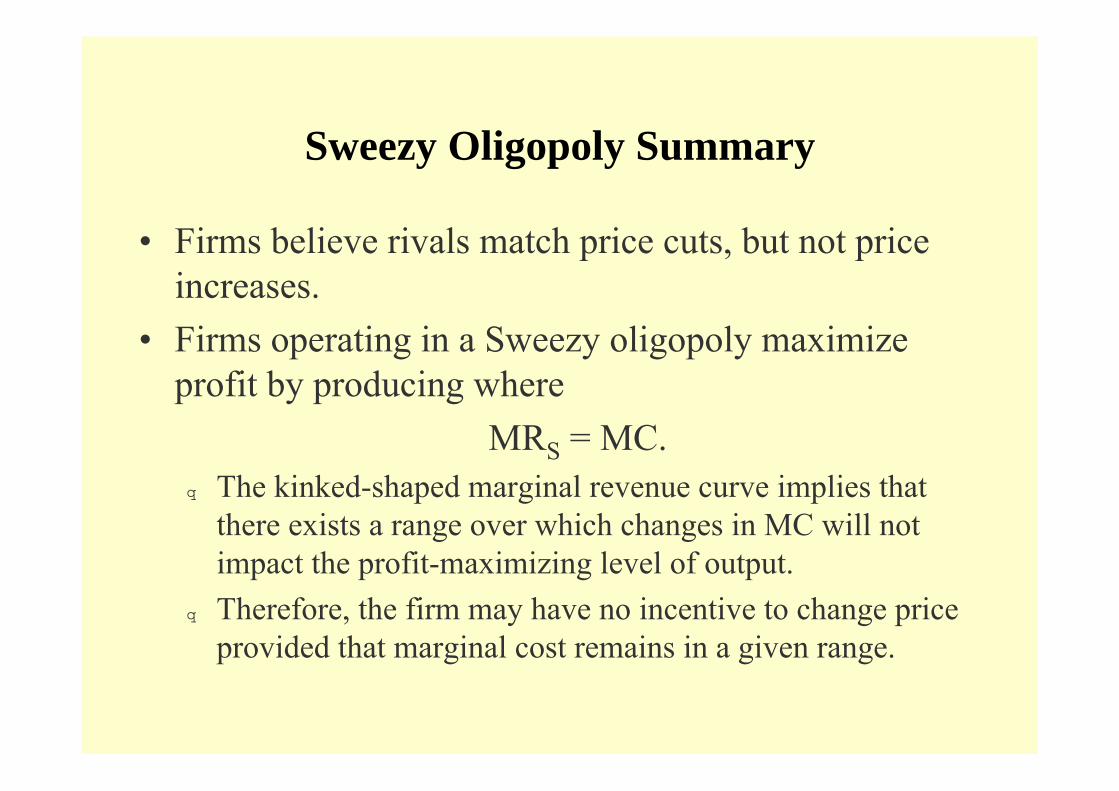
Sweezy Oligopoly Summary
• Firms believe rivals match price cuts, but not price increases.
• Firms operating in a Sweezy oligopoly maximize profit by producing where
MRS = MC.� The kinked-shaped marginal revenue curve implies that
there exists a range over which changes in MC will not impact the profit-maximizing level of output.
� Therefore, the firm may have no incentive to change price provided that marginal cost remains in a given range.
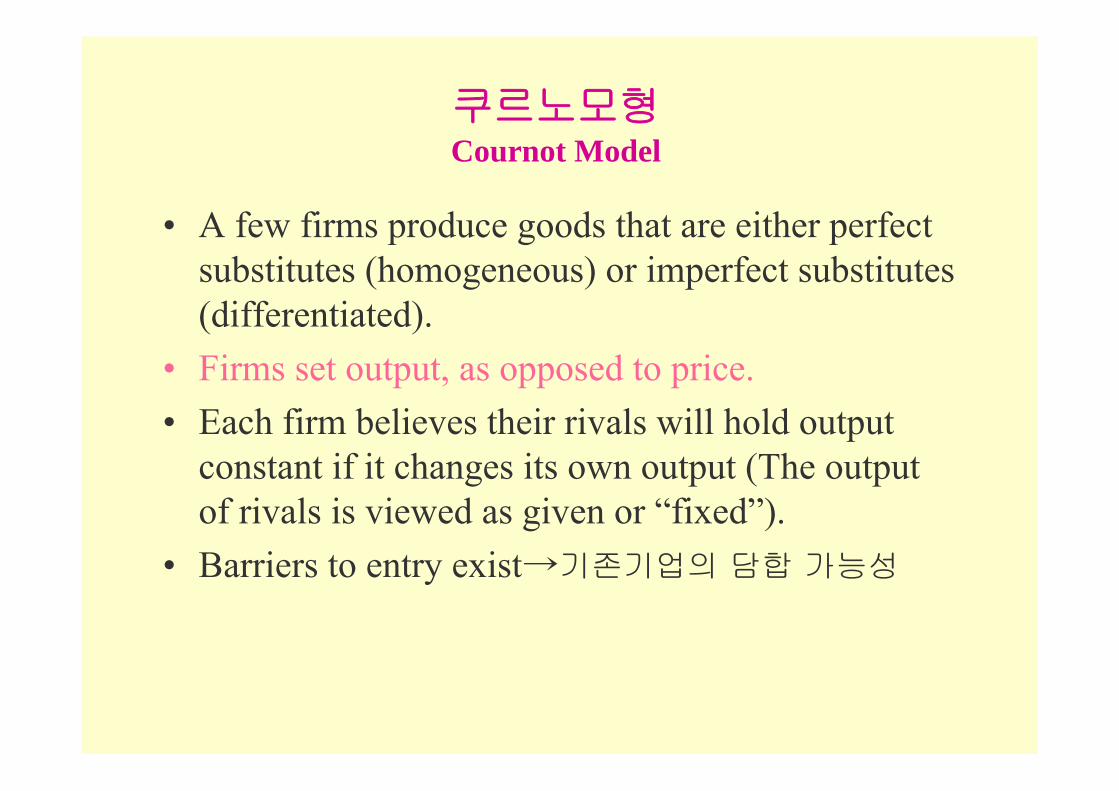
쿠르노모형Cournot Model
• A few firms produce goods that are either perfect substitutes (homogeneous) or imperfect substitutes (differentiated).
• Firms set output, as opposed to price.• Each firm believes their rivals will hold output
constant if it changes its own output (The output of rivals is viewed as given or “fixed”).
• Barriers to entry exist→기존기업의 담합 가능성
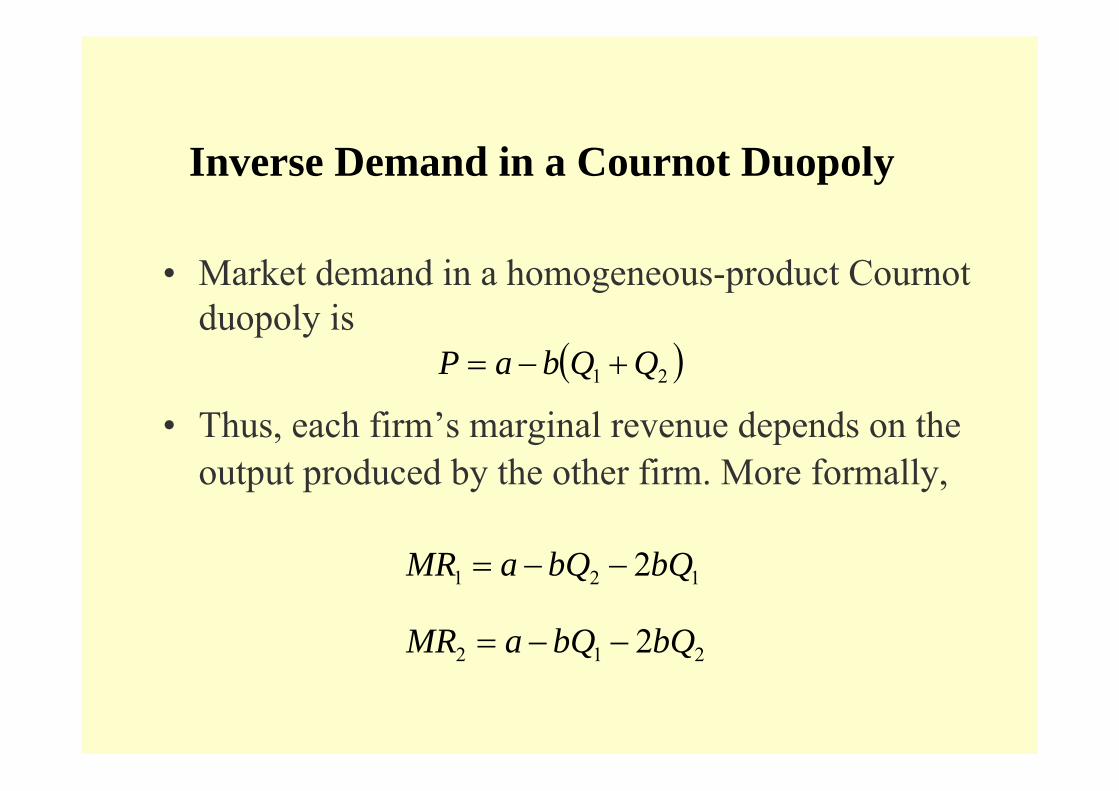
Inverse Demand in a Cournot Duopoly
• Market demand in a homogeneous-product Cournot duopoly is
• Thus, each firm’s marginal revenue depends on the output produced by the other firm. More formally,
212 2bQbQaMR −−=
121 2bQbQaMR −−=
( )21 QQbaP +−=
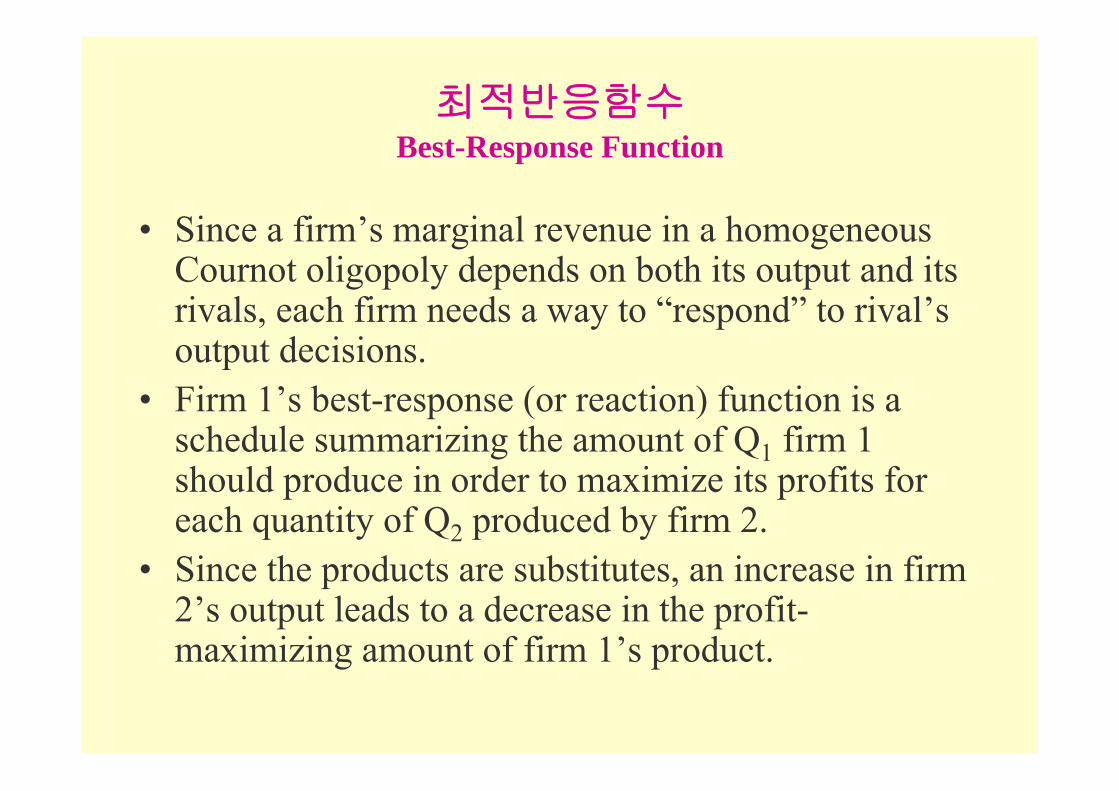
최적반응함수Best-Response Function
• Since a firm’s marginal revenue in a homogeneous Cournot oligopoly depends on both its output and its rivals, each firm needs a way to “respond” to rival’s output decisions.
• Firm 1’s best-response (or reaction) function is a schedule summarizing the amount of Q1 firm 1 should produce in order to maximize its profits for each quantity of Q2 produced by firm 2.
• Since the products are substitutes, an increase in firm 2’s output leads to a decrease in the profit-maximizing amount of firm 1’s product.
Best-Response Function for a Cournot Duopoly
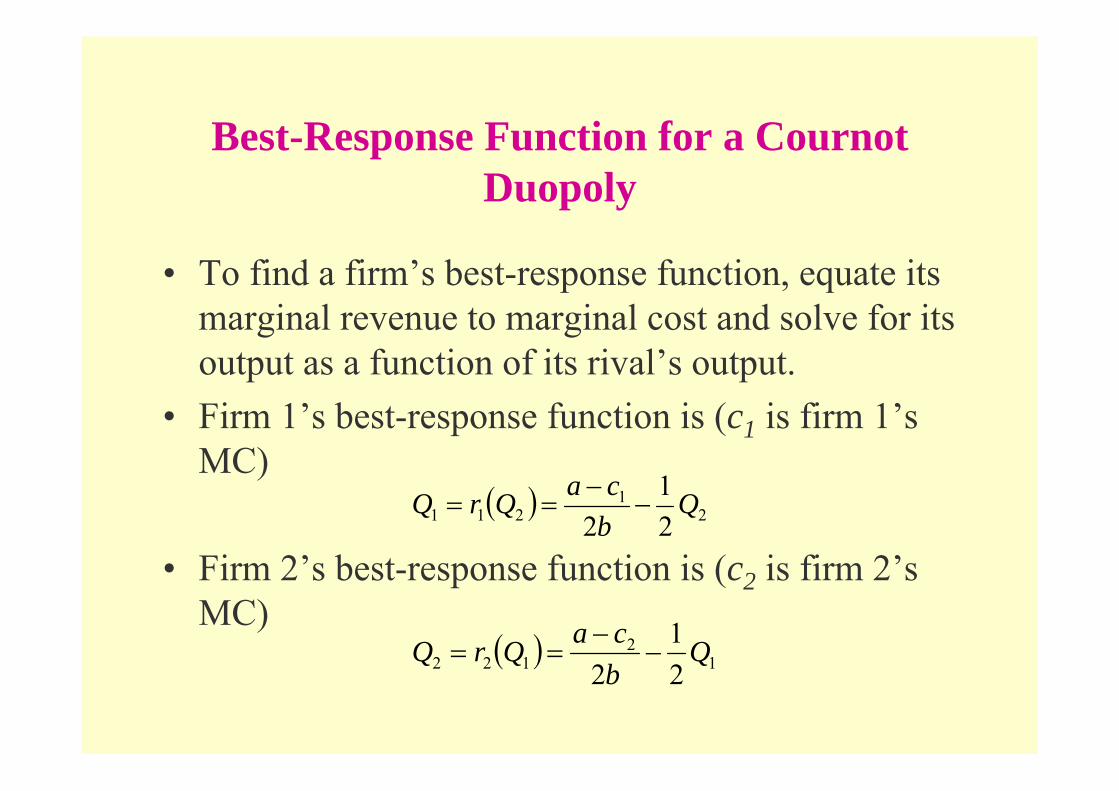
• To find a firm’s best-response function, equate its marginal revenue to marginal cost and solve for its output as a function of its rival’s output.
• Firm 1’s best-response function is (c1 is firm 1’s MC)
• Firm 2’s best-response function is (c2 is firm 2’s MC)
( ) 21
211 21
2Q
bcaQrQ −
−==
( ) 12
122 21
2Q
bcaQrQ −
−==
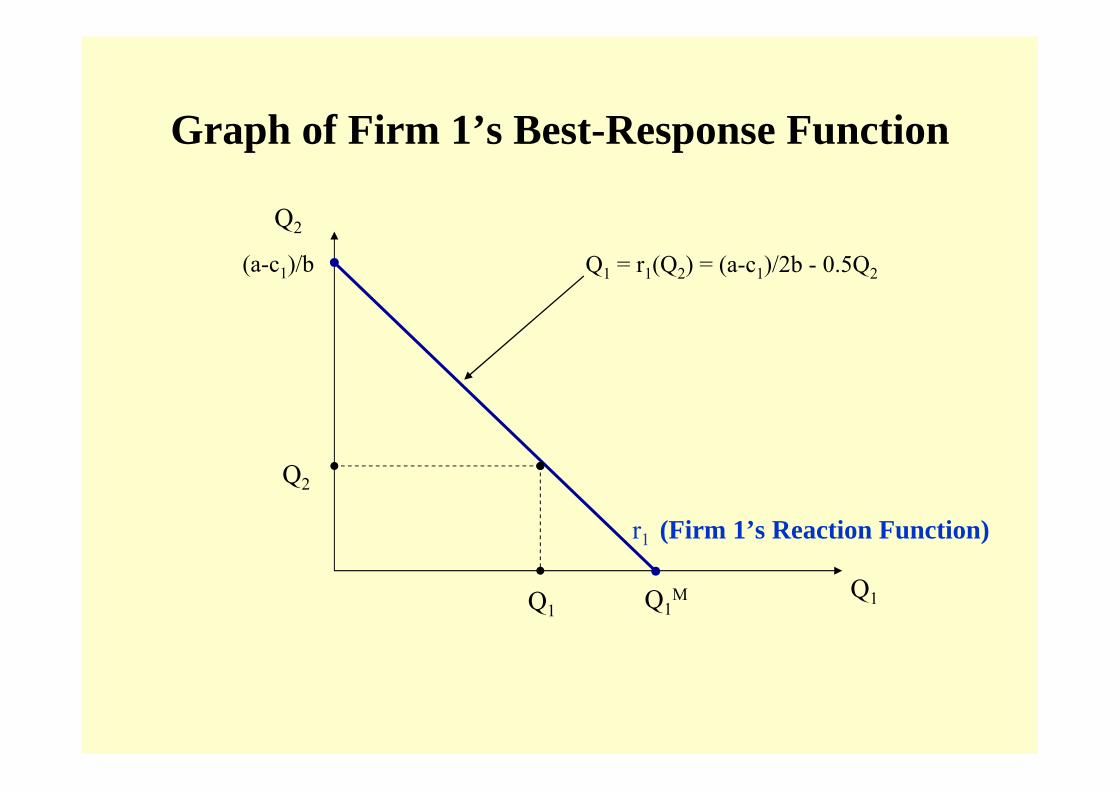
Graph of Firm 1’s Best-Response Function
Q2
Q1
(Firm 1’s Reaction Function)
Q1M
Q2
Q1
r1
(a-c1)/b Q1 = r1(Q2) = (a-c1)/2b - 0.5Q2
Cournot Equilibrium
• Situation where each firm produces the output that maximizes its profits, given the the output of rival firms.
• No firm can gain by unilaterally changing its own output to improve its profit.� A point where the two firm’s best-response functions
intersect.
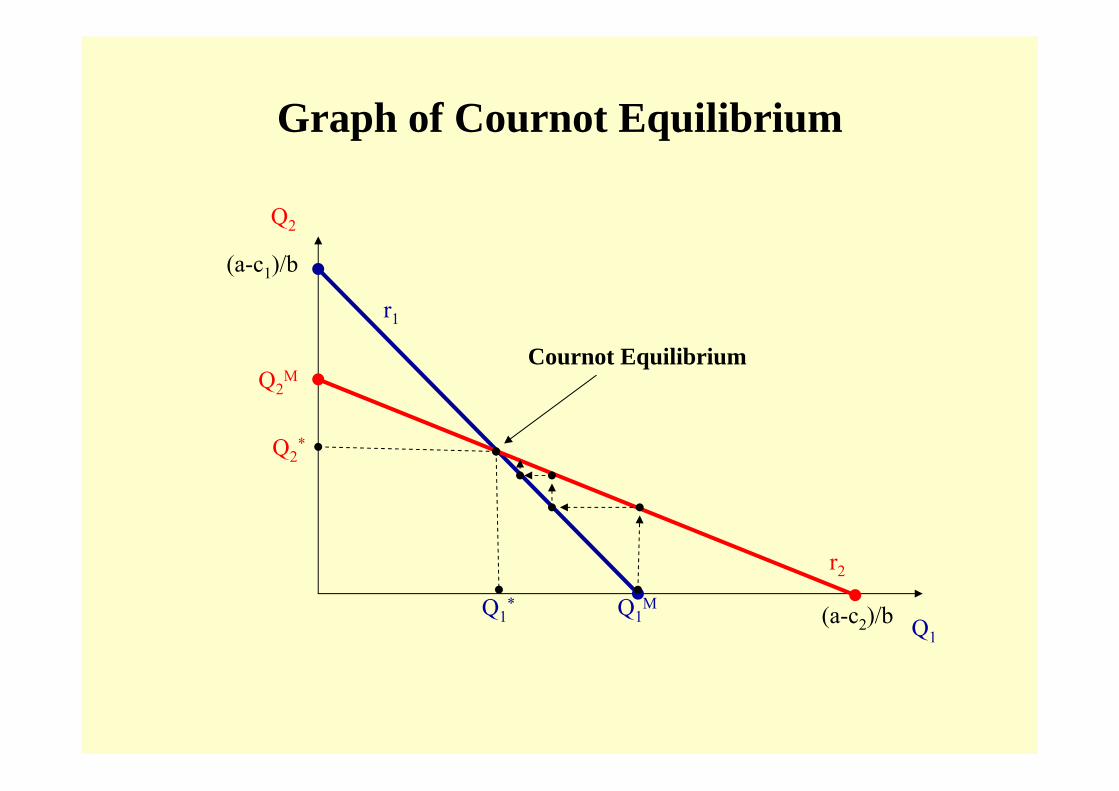
Graph of Cournot Equilibrium
Q2*
Q1*
Q2
Q1
Q1M
r1
r2
Q2M
Cournot Equilibrium
(a-c1)/b
(a-c2)/b
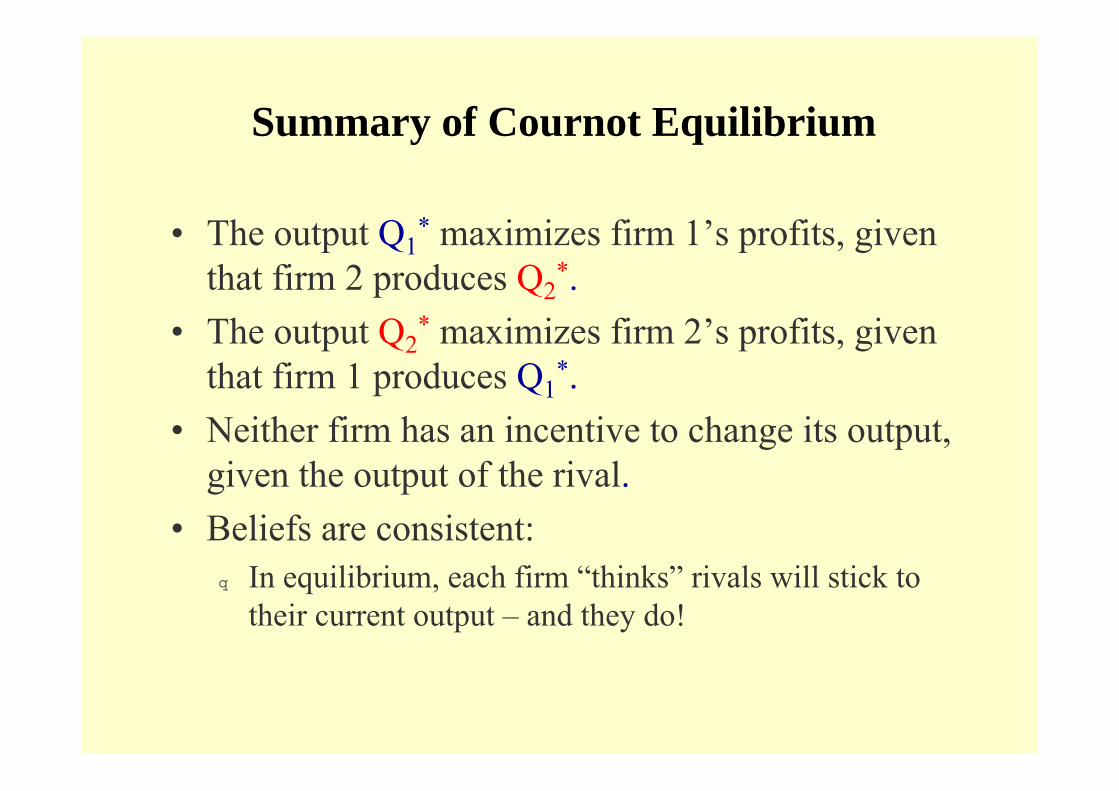
Summary of Cournot Equilibrium
• The output Q1* maximizes firm 1’s profits, given
that firm 2 produces Q2*.
• The output Q2* maximizes firm 2’s profits, given
that firm 1 produces Q1*.
• Neither firm has an incentive to change its output, given the output of the rival.
• Beliefs are consistent: � In equilibrium, each firm “thinks” rivals will stick to
their current output – and they do!
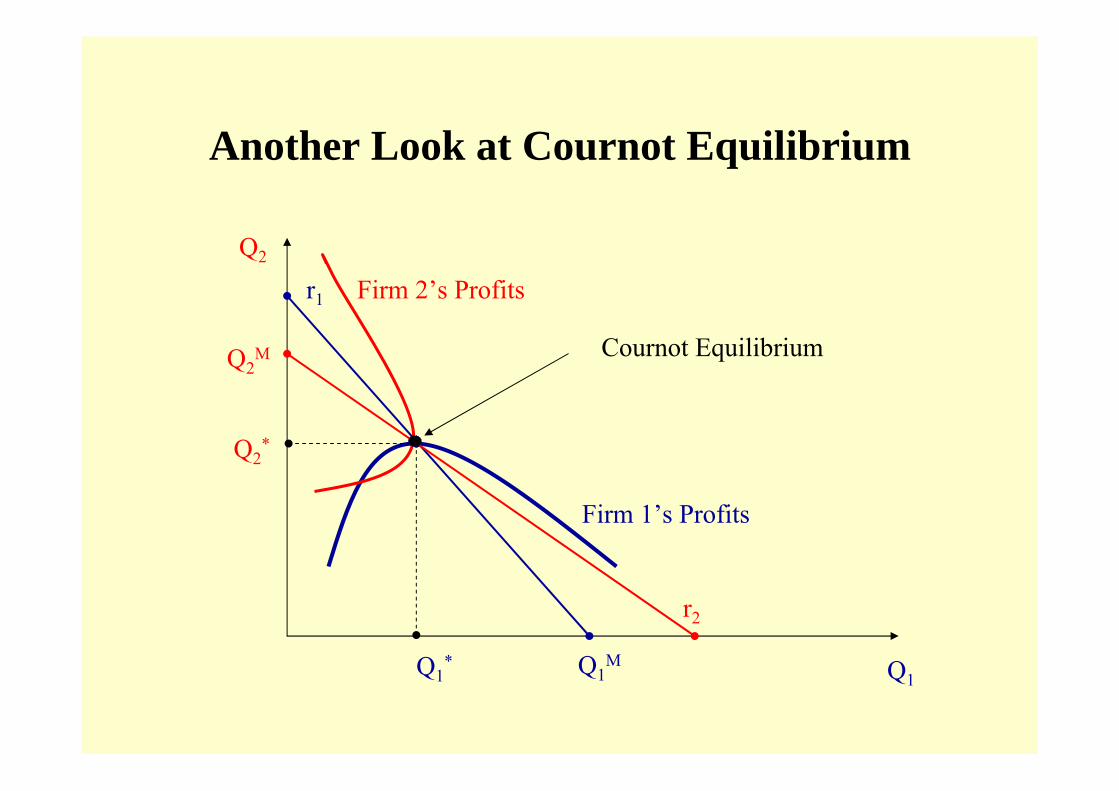
Another Look at Cournot Equilibrium
Q2
Q1Q1
M
r1
Q2*
Q1*
Firm 1’s Profits
Firm 2’s Profits
r2
Q2M Cournot Equilibrium
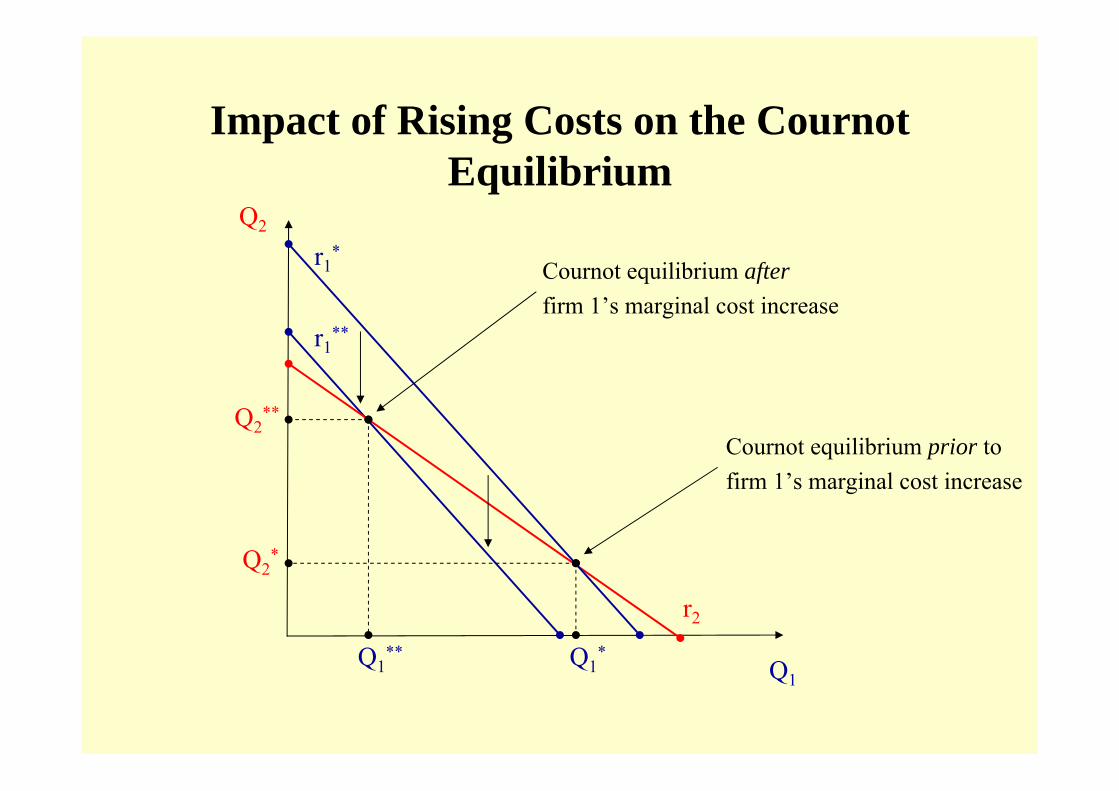
Impact of Rising Costs on the Cournot Equilibrium
Q2
Q1
r1**
r2
r1*
Q1*
Q2*
Q2**
Q1**
Cournot equilibrium prior to firm 1’s marginal cost increase
Cournot equilibrium afterfirm 1’s marginal cost increase
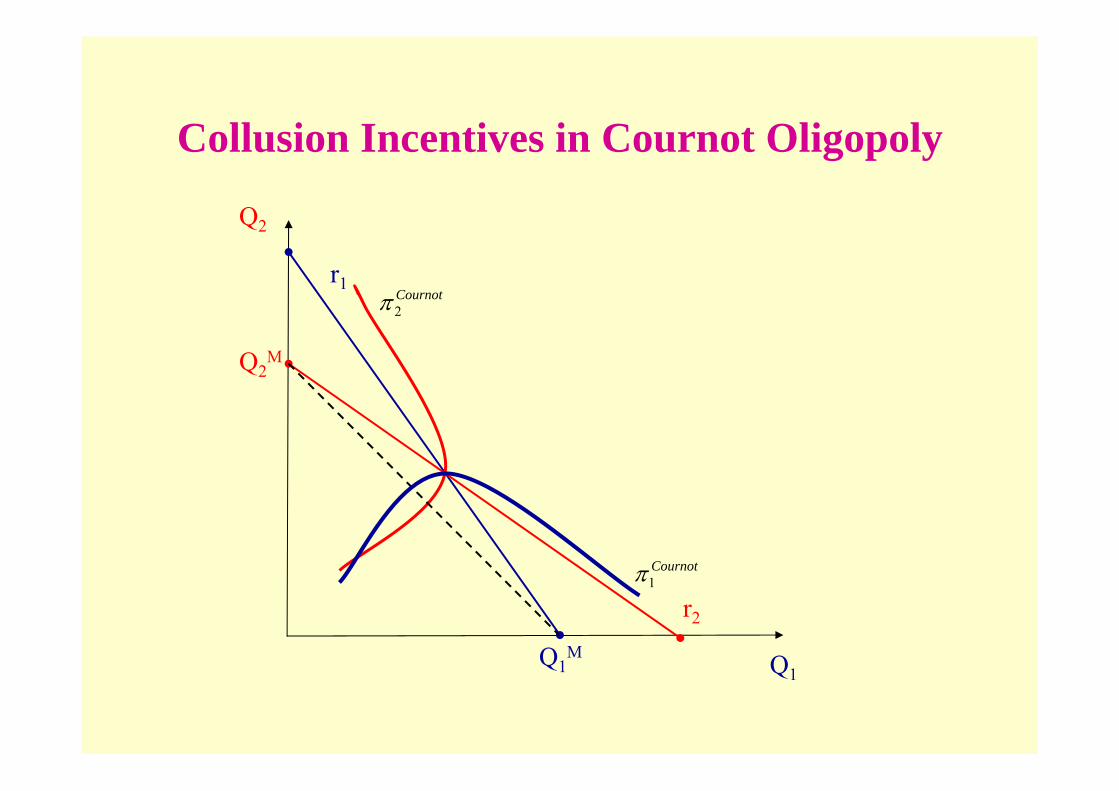
Collusion Incentives in Cournot Oligopoly
Q2
Q1
r1
Q2M
Q1M
r2
Cournot2π
Cournot1π
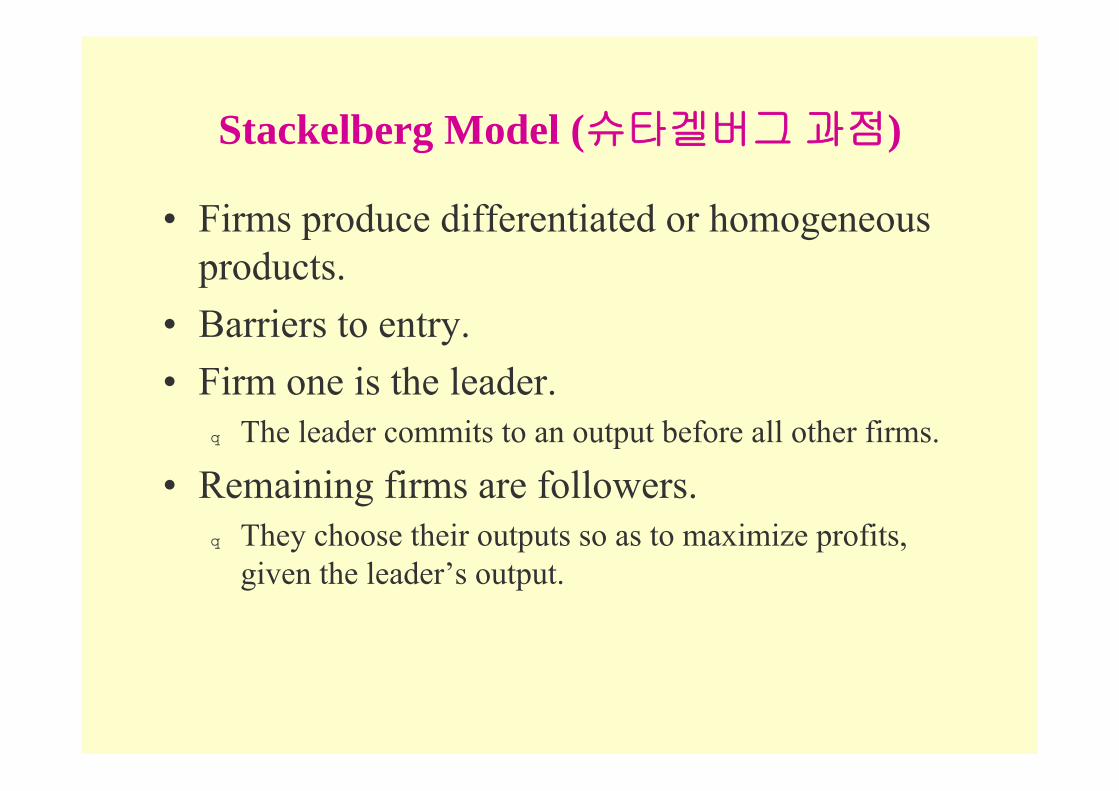
Stackelberg Model (슈타겔버그과점)
• Firms produce differentiated or homogeneous products.
• Barriers to entry.• Firm one is the leader.
� The leader commits to an output before all other firms.
• Remaining firms are followers.� They choose their outputs so as to maximize profits,
given the leader’s output.
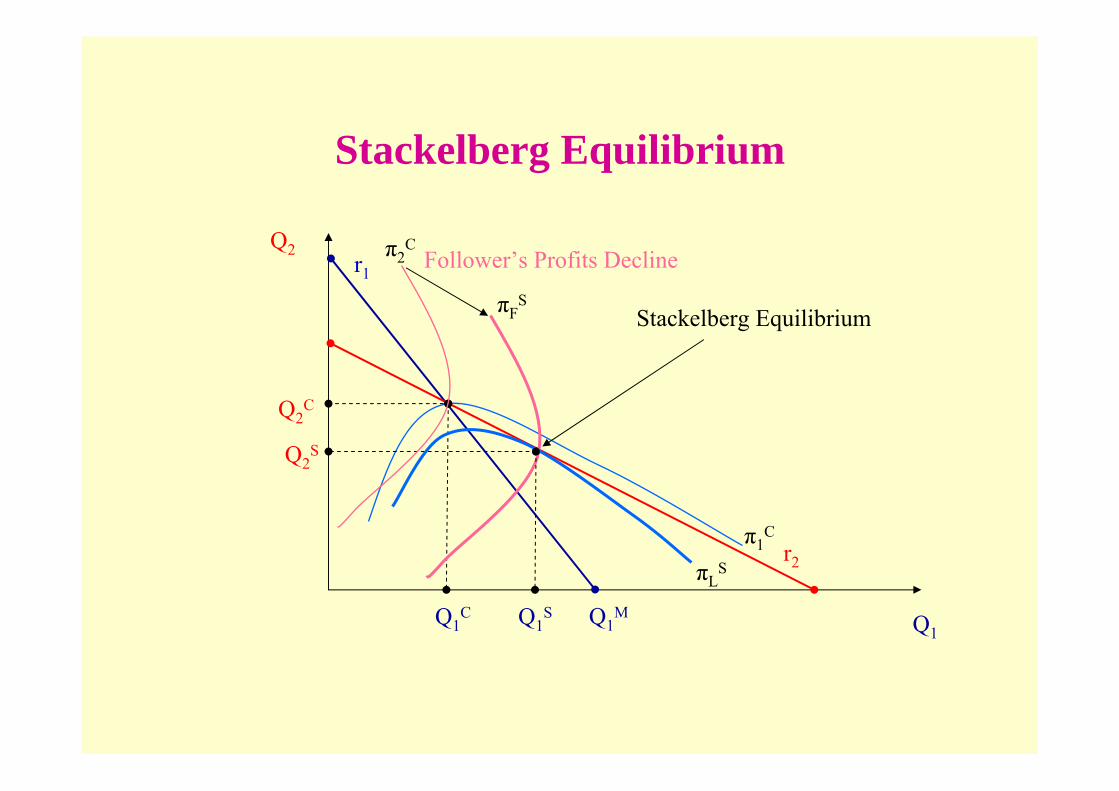
Stackelberg Equilibrium
Q1Q1
M
r1
Q2C
Q1C
r2
Q2
Q1S
Q2S
Follower’s Profits Decline
Stackelberg Equilibrium
πLS
π1C
πFS
π2C
Stackelberg Summary
• Stackelberg model illustrates how commitment can enhance profits in strategic environments.
• Leader produces more than the Cournot equilibrium output.� Larger market share, higher profits.� First-mover advantage.
• Follower produces less than the Cournot equilibrium output.� Smaller market share, lower profits.
Bertrand Model (베르트랑모형)
• Few firms that sell to many consumers.• Firms produce identical products at constant marginal
cost.• Each firm independently sets its price in order to
maximize profits.• Barriers to entry.• Consumers enjoy
� Perfect information. � Zero transaction costs.
Bertrand Equilibrium
• Firms set P1 = P2 = MC! Why?• Suppose MC < P1 < P2.• Firm 1 earns (P1 - MC) on each unit sold, while
firm 2 earns nothing.• Firm 2 has an incentive to slightly undercut firm
1’s price to capture the entire market.• Firm 1 then has an incentive to undercut firm 2’s
price. This undercutting continues...• Equilibrium: Each firm charges P1 = P2 = MC.