cgi 2008 conference proceedings manuscript no. …oliveira/pubs_files/slomp_oliveira...e-mail:...
TRANSCRIPT
CGI 2008 Conference Proceedings manuscript No.(will be inserted by the editor)
Marcos Slomp · Manuel M. Oliveira
Real-Time Photographic Local Tone Reproduction UsingSummed-Area Tables
Abstract High dynamic range (HDR) rendering is becom-ing an increasingly popular technique in computer graphics.Its challenge consists in mapping the resulting images’ largerange of intensities to the much narrower ones of the dis-play devices in a way that preserves contrastive details. Lo-cal tone mapping operators effectively perform the requiredcompression by adapting the luminance level of each pixelwith respect to its local neighborhood. While they gener-ate significantly better results when compared to global op-erators, their computational costs are considerably higher,which has prevented their use in real-time applications. Thispaper presents a real-time technique for photographic lo-cal tone reproduction that runs entirely on the GPU and issignificantly faster than existing implementations that pro-duce similar results. Our approach is based on the use ofsummed-area tables for accelerating the convolution of thelocal neighborhoods with a box filter and provides an at-tractive solution for HDR rendering applications that requirehigh performance without compromising image quality.
Keywords local tone-mapping operator · HDR images ·GPU technique · real-time rendering · summed-area tables
1 Introduction
High dynamic range (HDR) rendering is becoming an in-creasingly popular technique in computer graphics [3]. How-ever, proper presentation of HDR content requires that thedisplay devices support the dynamic range of the images.Otherwise, the resulting pictures will look either underex-posed or overexposed. Currently, HDR displays [22, 24, 25]are still very expensive and have limited dynamic range.Compressing such large luminance ranges so that they fit themuch narrower ones supported by low dynamic range (LDR)
Marcos SlompInstituto de Informatica - UFRGSE-mail: [email protected]
Manuel M. OliveiraInstituto de Informatica - UFRGSE-mail: [email protected]
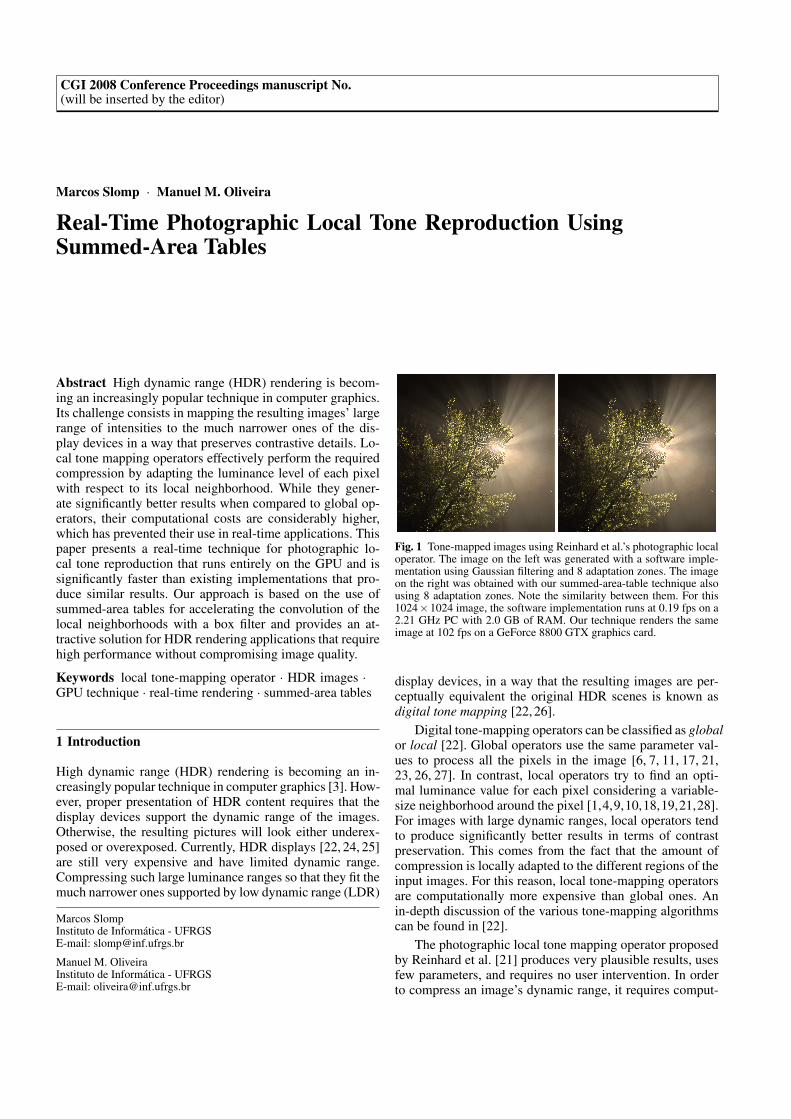
Fig. 1 Tone-mapped images using Reinhard et al.’s photographic localoperator. The image on the left was generated with a software imple-mentation using Gaussian filtering and 8 adaptation zones. The imageon the right was obtained with our summed-area-table technique alsousing 8 adaptation zones. Note the similarity between them. For this1024×1024 image, the software implementation runs at 0.19 fps on a2.21 GHz PC with 2.0 GB of RAM. Our technique renders the sameimage at 102 fps on a GeForce 8800 GTX graphics card.
display devices, in a way that the resulting images are per-ceptually equivalent the original HDR scenes is known asdigital tone mapping [22, 26].
Digital tone-mapping operators can be classified as globalor local [22]. Global operators use the same parameter val-ues to process all the pixels in the image [6, 7, 11, 17, 21,23, 26, 27]. In contrast, local operators try to find an opti-mal luminance value for each pixel considering a variable-size neighborhood around the pixel [1,4,9,10,18,19,21,28].For images with large dynamic ranges, local operators tendto produce significantly better results in terms of contrastpreservation. This comes from the fact that the amount ofcompression is locally adapted to the different regions of theinput images. For this reason, local tone-mapping operatorsare computationally more expensive than global ones. Anin-depth discussion of the various tone-mapping algorithmscan be found in [22].
The photographic local tone mapping operator proposedby Reinhard et al. [21] produces very plausible results, usesfew parameters, and requires no user intervention. In orderto compress an image’s dynamic range, it requires comput-
2 Marcos Slomp, Manuel M. Oliveira
ing the average luminance around each pixel at differentscales. Reinhard et. al used a luminance-perception modelpresented by Blommaert and Martens [2], which is essen-tially a set of differences of Gaussian-filtered luminance im-ages. Unfortunately, convolving an image with Gaussian ker-nels of various scales is a computationally expensive op-eration. Thus, in practice, interactive applications currentlylimit themselves to global operators. The exception is thework of Goodnight et al. [12], which efficiently implementedthe 2D Gaussian convolution using separable 1D kernels onthe GPU. However, despite all their optimization efforts, theirtechnique could handle only a few adaptation zones whilestill running at interactive rates.
This paper presents a new GPU-based technique for per-forming Reinhard et al.’s photographic local tone reproduc-tion in real time. Our approach uses a summed-area table [5]to efficiently evaluate an approximation of Blommaert andMartens’s luminance-perception model [2], which is the mostexpensive part of the operator. Our technique produces re-sults that are comparable to a software-based implementa-tion of the local operator (Figure 1), but is significantly fasterthan previous GPU implementations of the algorithm. Ourapproach is based on the following key observations:– Reinhard et al. [21] used normalized differences of Gauss-
ian-filtered luminance images to identify the largest ap-proximately isoluminant region around each pixel. Thisis performed by checking whether these normalized dif-ferences are smaller than a specified threshold. Note thatthe actual (approximately) isoluminant region around apixel can have arbitrary shapes, whereas the used Gauss-ian kernels are rotationally symmetric and do not per-fectly fit these regions. Thus, the algorithm computes anapproximate scale for each region. Similar results can beobtained using normalized differences of box-filtered lu-minance images.
– Since a convolution with a box filter is just an averageover a rectangular region, it can be efficiently imple-mented using a summed-area table [5], for a fraction ofthe cost of a Gaussian convolution. Compared to the ap-proach described by Goodnight et al. [12], we achievean average speedup of about eight times, while produc-ing very similar results. Compared to Krawczyk et al.’sapproach [16], our technique is about twice as fast andreduces the occurrence of halo artifacts.The remaining of this paper is organized as follows: Sec-
tion 2 discusses some related work and reviews the conceptof summed-area tables [5]. Section 3 reviews Reihard et al.’sphotographic local tone-mapping operator, which is the ba-sis of our implementation. Section 4 presents the details ofour technique. Section 5 discusses some of our results, andSection 6 summarizes the paper.
2 Related Work
Goodnight et al. [12, 13] investigated the implementationof some local tone-mapping algorithms in programmable
graphics hardware. They observed that Fattal et al.’s oper-ator is difficult to implement in order to achieve interactiverates, even on modern GPUs [13]. They also described im-plementations for both the global and the local photographicoperators of Reinhard et al. [12, 21], and showed how thetechnique could be modified to support time-dependent lu-minance adaptation. For the local operator, Goodnight et al.efficiently implemented the 2D Gaussian convolution usinga two-pass 1D approach. Their GPU implementation waswritten using the ATI 9800 Pro assembler [12]. Accordingto their reported results, for images with 512x512 pixels ormore, their technique only runs at interactive rates when us-ing two adaptation zones (i.e., two levels of the Gaussian-filtered luminance images). The use of only two adaptationzones tends to cause the loss of some important details in theresulting images.
In order to reduce the cost of the convolution in Good-night et al.’s approach, Krawczyk et al. [16] implemented asimplified version of Goodnight et al.’s technique that con-sisted of downsampling the luminance images to 1/4, 1/16,and 1/64 of their original dimensions and performing theconvolution using smaller approximate Gaussian kernels. Theblurred images were then upsampled and used to computethe normalized differences of Gaussian-filtered images. Al-though this strategy can significantly speedup the algorithm,it has some inherent limitations: the downsampling blurrshigh-contrast edges and the upsampling that follows the con-volution adds some extra blurring. The occurrence of ex-cessive blurring across the high contrast edges tends to in-troduce clearly noticeable halo artifacts. Although all lo-cal tone-mapping operators are prone to this kind of arti-facts, good operators try to minimize their occurrence. Dueto current GPU restrictions, Krawczyk et al. perform boththe downsampling and the upsampling using shaders. Theneed to store a downsampled texture together with two up-sampled and a temporary result texture leads to some largememory requirements, which is about 2× bigger than thememory consumption of our technique.
Regarding previous uses of box filters with tone-mappingoperators, Pattanaik and Yee [18] used a circular approxi-mately box-shaped kernel with fixed radius (7 pixels) in theirbilateral-filtering algorithm.
2.1 Summed-Area Tables
A summed-area table (SAT) [5] is a cumulative tabular datastructure S that stores a 2D prefix sum of another table T .More formally, each cell Si j of S stores the sum of all ele-ments Tpq from T such that p ≤ i and q ≤ j (Equation 1).
Si j =m
∑i=1
n
∑j=1
Ti j (1)
Figure 2 (right) shows a SAT computed for the table shownto its left. SATs provide an efficient way to apply a spatialaveraging filter (box filter) to any rectangular area of an im-age in constant time, requiring only four fetches (Figure 3).

Real-Time Photographic Local Tone Reproduction Using Summed-Area Tables 3
Fig. 2 Each element Si j of a summed-area table (right) is is obtainedby summing the elements of the original table T (left) according toEquation 1.
Fig. 3 Computing the average of an arbitrry rectangular area (high-lighted) in the original table. First, fetch the four cells (A, B, C, D)delimiting the desired area (right). The average is then obtained by ap-plying Equations 2 and 3 to the retrieved values.
According to Equations 2 and 3, for the example shown inFigure 3, one has Sum = 16− 4− 5 + 1 = 8 and Average =8/(2∗2) = 2.
Sum = A−B−C +D (2)
Average =Sum
width∗height(3)
Summed-area tables can be efficiently generated in par-allel using graphics hardware [14] by recursive doubling [8].The tables are stored into textures and the algorithm consistsof two stages: one for horizontal and another for verticalaccumulation. The technique is based on ping-pong render-ing and the process is illustrated in Figure 4. At each stage,logk(w)+ logk(h) steps are required, where w and h are theimage width and height, respectively, and k is the numberof cells that are accumulated at each step. Any cell outsidethe limits of the table is interpreted as a zero value cell. Thiscan be implemented by rendering a black edge in the tex-ture (clamp to edge) or by setting a black border color to it(clamp to border). Hensley et al. [14] pointed out that theoptimal number of accumulations per step (k) depends ona balance between the number of rendering passes and thecomputational cost at each pass. Such a balance is closelyrelated to the render-target switch overhead of the intendedhardware platform, and to the texture cache accuracy.
In a subsequent work, Hensley et al. [15] used first, sec-ond and third order summed-area tables to filter HDR envi-ronment maps with box, Bartlett, and cubic filters, respec-tively. The filtered images were used to compute approxi-mations for diffuse and Phong BRDFs in interactive render-ing applications. An n-th order summed-area table (SATn) isobtained by recursively applying Equation 1 to its own out-put (n− 1) times. Note that the values stored in high-orderSATs tend to grow very quickly, especially if the content ofthe original table T is HDR. This imposes some limitationson the size and dynamic range of the input images. In order
to mitigate this and other loss of precision issues, Hensleyet al. used an offset technique introduced by them in [14],which essentially consists in subtracting the mean value ofthe SAT from all its elements. In our approach, we computea first-order SAT for HDR content on the fly. In our case,however, each cell of the original table T stores a scaled lu-minance value (Equation 5), which is essentially the ratiobetween the original pixel’s luminance and the scene’s av-erage luminance. As a result, the values accumulated by ourSATs tend to be a few orders of magnitude smaller than theones stored by Hensley et al.’s technique [15] in a first-orderSAT.
(a) (b)
(c) (d)
Fig. 4 SAT generation on the GPU. The tables are stored into texturesand the SAT is generated using ping-pong rendering. (a) Horizontal ac-cumulation steps applied to the first row of the table shown in Figure 2(left). Applying this process to all rows will result in the intermediatetable shown in (b), which will be used as input to the vertical stage.Similarly, (c) illustrates the vertical accumulation steps applied to thefirst column of the intermediate table. (d) The result of the verticalpass applied to all columns of the intermediate table is the SAT shownin Figure 2 (right).
3 The Photographic Local Operator
This section briefly reviews Reinhard et al.’s photographiclocal tone reproduction operator [21], which consists of thefollowing steps: first, it computes the average log luminanceof the input HDR image as
L = exp
(1N ∑
x,ylog(L(x,y)+δ ))
)(4)
where N is the number of pixels in the image, δ is a smallvalue to avoid log(0), and L(x,y) is the HDR luminance ofthe pixel with coordinates (x,y), computed from its RGBvalues:
L(x,y) = 0.30∗R(x,y)+0.59∗G(x,y)+0.11∗B(x,y)
It then computes a scaled luminance Ls(x,y) for each pixelas
Ls(x,y) =α
LL(x,y) (5)
4 Marcos Slomp, Manuel M. Oliveira
where α is the key-value, a parameter that determines ifthe image will favor dark or bright areas. Typically, a valueof α = 0.18 is used in automatic exposure control in cam-eras [12]. Reinhard [20] describes a procedure for estimatingthe value of the parameter α automatically.
Reinhard et al.’s global operator is defined by Equation 6,where the final luminance LDG(x,y) of each pixel p(x,y) isobtained by dividing its scaled luminance Ls(x,y) by 1 +Ls(x,y).
LDG(x,y) =Ls(x,y)
1+Ls(x,y)(6)
The local operator is obtained directly from Equation 6 byreplacing Ls(x,y) in the denominator with the weighted av-erage V (x,y,s) of the approximately isoluminant neighbor-hood of pixel p(x,y). From the scaled luminance image Ls,a set of Gaussian-filtered images is generated, each at a dif-ferent scale s:
V (x,y,s) = Ls(x,y)⊗Gauss(x,y,s) (7)
where Gauss(x,y,s) is a rotationally-symmetric Gaussian ker-nel and ⊗ is the convolution operator. The hierarchy of fil-tered images defined by Equation 7 is used to compute nor-malized differences, according to the luminance-perceptionmodel proposed by Blommaert and Martens [2]:
W (x,y,si) =V (x,y,si)−V (x,y,si+1)
2φ α/s2 +V (x,y,si)(8)
Given some threshold ε , the technique looks for the largestscale smax for which
|W (x,y,smax)|< ε (9)
Such a scale represents the largest Gaussian-modulated neigh-borhood around pixel p(x,y) for which no substantial lumi-nance variation occurs. The parameter φ represents a sharp-ening factor. Default values used for parameters ε and φ are0.05 and 8, respectively [21].
The display luminance LDL(x,y) of pixel p(x,y) obtainedwith the local operator is then defined as
LDL(x,y) =Ls(x,y)
1+V (x,y,smax)(10)
The final RGBDL(x,y) color channels for pixel p(x,y) arecomputed from its corresponding display luminance LDL(x,y)using Equation 11. The pixel coordinates are omitted here tosimplify the expression:
RGBDL =((
RL
)γ
LDL,
(GL
)γ
LDL,
(BL
)γ
LDL
)(11)
where γ performs gamma correction and typically rangesfrom 0.4 to 0.8 [12]. R, G, B, and L are respectively the red,green, blue, and luminance channels of pixel p(x,y) in theinput HDR image.
4 The Local Photographic Operator Using SAT
Following the observations described at the end of Section 1,we use normalized differences of box-filtered luminance im-ages to estimate the scale of the approximate isoluminantneighborhood of each pixel. Thus, our GPU implementationof Reinhard et al.’s local tone-mapping operator follows thesame steps presented in Section 3, with two minor modifica-tions: (i) it evaluates Equation 7 using box filters instead ofGaussian ones, and (ii) it uses a different threshold value εBinstead of ε in Equation 9.
We use a summed-area table to compute the convolu-tions at all scales in constant time and rewrite Equation 7as
V (x,y,s) = Ls(x,y)⊗Box(x,y,s) (12)
The need for a different threshold value εB follows from thedifferent shapes of the two kernels. The weights associatedwith a Gaussian kernel get smaller as a function of the dis-tance to the kernel’s center, thus reducing the severity of haloartifacts across high-contrast edges. A box filter, on the otherhand, weights the contributions of all pixels in the neighbor-hood equally. Thus, the tone-mapped images produced withthe use of box filters are more prone to noticeable halos thanthe ones produced with Gaussian filters of the same scale.We reduce the occurrence of halos in the resulting imagesby reducing the threshold used to compare against the nor-malized luminance differences (Equation 9). According toour experience, a threshold value of εB = 0.025 reduces thenoticeable halos to the same level as the one perceived withthe threshold ε = 0.05 for the Gaussian case.
4.1 Implementation Details
The pipeline of our technique starts by rendering an HDRscene into a floating-point texture I (either RGB or RGBA).It then proceeds with the following steps:
1. For each pixel p(x,y) in I, compute log(L(x,y)) and storeit in a new rectangular floating-point texture IlogL at (x,y);
2. Compute the average log luminance (Equation 4) of IlogL.This is performed by generating a mip-map pyramid forIlogL, retrieving the value stored at the 1× 1 level, andusing it to evaluate the exp function. Since the input tex-tures are often not powers of two, the mip-map pyramidis built inside a shader using log2(max(width,height))passes;
3. Generate the scaled luminance map according to Equa-tion 5. This map will be used as input to compute theSAT;
4. Generate the SAT using the algorithm described in [14];5. Finally, we use the resulting SAT to evaluate Equations 12,
8, and 9 at various scales, until the proper smax scale isfound. The luminance of the individual pixels are thencompressed using Equation 10, and their correspondingdisplay RGB values are obtained using Equation 11.
Real-Time Photographic Local Tone Reproduction Using Summed-Area Tables 5
In all examples shown in this paper, we used a 16-bitper-channel representation. According to our experience, theperformance penalty when using full-precision (32-bit) lu-minance textures is minimal (about 2 fps on a GeForce 6800).Figure 5 shows a side-by-side comparison of pairs of filteredluminance images at the eight scales used by the algorithm.In order to make the comparison more challenging, we havechosen an image with lots of small high-frequency details.For each pair, the image on the left was obtained using aGaussian filter, while the one on the right was produced witha box filter using a SAT. Since such images are exact repre-sentations of the results produced by Equations 7 and 12,respectively, they provide a good indication of how similarour results will be compared to the ones produced by Rein-hard et al.’s Gaussian local operator.
Figure 6 shows a visualization of the maximum scalesmax computed for each pixel of the image, based on thenormalized differences (Equations 8 and 9) of the filteredimages shown in Figure 5. Brighter pixels indicate biggerscales. The image on the left corresponds to the Gaussianfilter, while the one on the right corresponds to the box filter.For this example, the same threshold ε = 0.05 was used forboth cases. A visual inspection of these two images revealsthat the one corresponding to the box filter is slightly darker,indicating the use of smaller neighborhoods. The resultingtone-mapped images obtained with the use of the two tech-niques are shown in Figure 7.
If the box kernel is only partially inside the SAT (a com-mon situation when applying the convolution to pixels in theborder of the scaled luminance image), we compute the av-erage of the valid pixels only.
5 Results
We have implemented our SAT-based approach using Cgand C++ and used it to tone map a large number of HDR im-ages. We have compared our results with the ones producedby a CPU implementation of Reinhard et al.’s local operator,as well as with our GPU implementation of the techniquedescribed in [16]. All performance measurements presentedin the paper were obtained on a 2.21 GHz PC with 2 GB ofmemory and a GeForce 8800 GTX with 768 MB of memoryand PCI-Express.
Table 1 compares the performance of our technique ontwo different GPUs (GeForce 6800 and GeForce 8800 GTX)for images with different dimensions and for different val-ues of the parameter k, which defines the number of cellsaccumulated at each step of the SAT generation process (seeSection 2.1). For the GeForce 8800 GTX, we provide thetimes (in seconds) for the SAT generation (SAT - step 4 ofthe algorithmic description presented in Section 4.1) and forperforming the actual tone mapping (TM - step 5). FromTable 1, one observes that best performance is achieved byusing 4 accumulations per step (k = 4). Higher values of kreduce the number of shader passes, but increase the numberof texture fetches at each step.
(a) (b)
(c) (d)
(e) (f)
(g) (h)
Fig. 5 Side-by-side comparison of pairs of filtered luminance imagesat several different scales. The images of the left of each pair wereobtained using Gaussian filters (Equation 7), whereas the images onthe right of each pair were produced with box filters (Equation 12).The sizes of the filter kernels (in pixels) used for the 8 adaptation zonesare: (a) 1×1, (b) 3×3, (c) 5×5, (d) 7×7, (e) 11×11, (f) 17×17, (g)25×25, and (h) 39×39.
Fig. 6 Maximum scale smax values computed for each pixel accord-ing to the filtered images shown in Figure 5. Brighter values indicatelarger scales. Results obtained with: Gaussian filter (left) and box filter(right). The same threshold ε = 0.05 was used for both filters.
Krawczyk et al.’s technique [16] is much faster than Good-night et al.’s approach [12]. Table 2 compares its perfor-mance with ours for images of different dimensions on aGeForce 8800 GTX, and shows that our technique is signif-icantly faster than Krawczyk et al.’s [16].
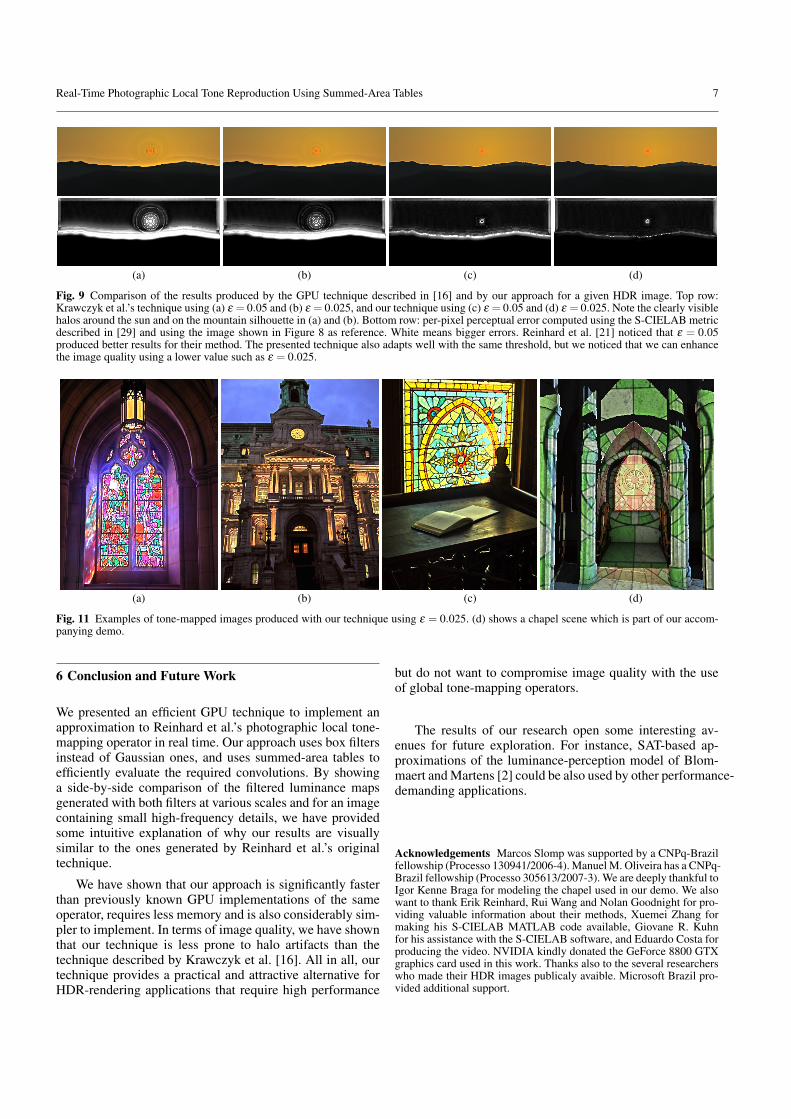
We have also compared the quality of the results pro-duced by both approaches against the ones obtained witha software implementation of Reinhard et al.’s local oper-ator [21]. Figure 8 shows a tone-mapped image producedusing this software implementation. The top row of Figure 9shows the results produced by Krawczyk et al.’s (a and b)and by our approach (c and d) applied to the same input
6 Marcos Slomp, Manuel M. Oliveira
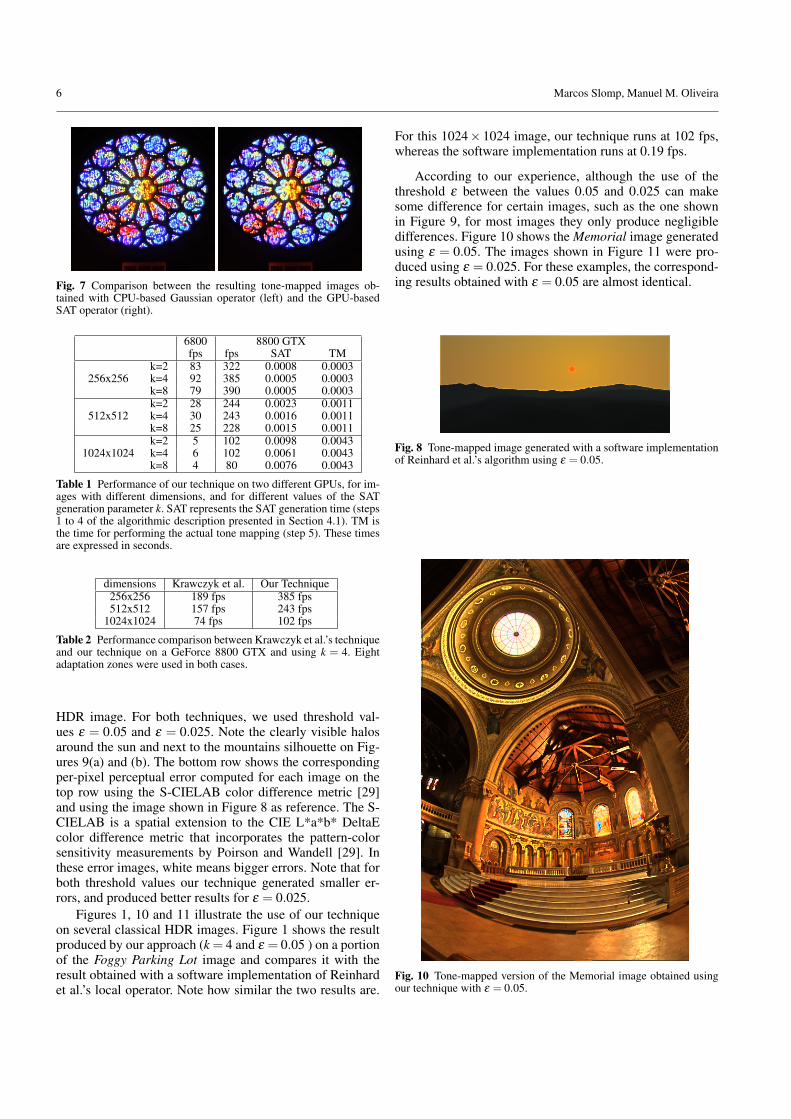
Fig. 7 Comparison between the resulting tone-mapped images ob-tained with CPU-based Gaussian operator (left) and the GPU-basedSAT operator (right).
6800 8800 GTXfps fps SAT TM
k=2 83 322 0.0008 0.0003256x256 k=4 92 385 0.0005 0.0003
k=8 79 390 0.0005 0.0003k=2 28 244 0.0023 0.0011
512x512 k=4 30 243 0.0016 0.0011k=8 25 228 0.0015 0.0011k=2 5 102 0.0098 0.0043
1024x1024 k=4 6 102 0.0061 0.0043k=8 4 80 0.0076 0.0043
Table 1 Performance of our technique on two different GPUs, for im-ages with different dimensions, and for different values of the SATgeneration parameter k. SAT represents the SAT generation time (steps1 to 4 of the algorithmic description presented in Section 4.1). TM isthe time for performing the actual tone mapping (step 5). These timesare expressed in seconds.
dimensions Krawczyk et al. Our Technique256x256 189 fps 385 fps512x512 157 fps 243 fps
1024x1024 74 fps 102 fps
Table 2 Performance comparison between Krawczyk et al.’s techniqueand our technique on a GeForce 8800 GTX and using k = 4. Eightadaptation zones were used in both cases.
HDR image. For both techniques, we used threshold val-ues ε = 0.05 and ε = 0.025. Note the clearly visible halosaround the sun and next to the mountains silhouette on Fig-ures 9(a) and (b). The bottom row shows the correspondingper-pixel perceptual error computed for each image on thetop row using the S-CIELAB color difference metric [29]and using the image shown in Figure 8 as reference. The S-CIELAB is a spatial extension to the CIE L*a*b* DeltaEcolor difference metric that incorporates the pattern-colorsensitivity measurements by Poirson and Wandell [29]. Inthese error images, white means bigger errors. Note that forboth threshold values our technique generated smaller er-rors, and produced better results for ε = 0.025.
Figures 1, 10 and 11 illustrate the use of our techniqueon several classical HDR images. Figure 1 shows the resultproduced by our approach (k = 4 and ε = 0.05 ) on a portionof the Foggy Parking Lot image and compares it with theresult obtained with a software implementation of Reinhardet al.’s local operator. Note how similar the two results are.
For this 1024× 1024 image, our technique runs at 102 fps,whereas the software implementation runs at 0.19 fps.
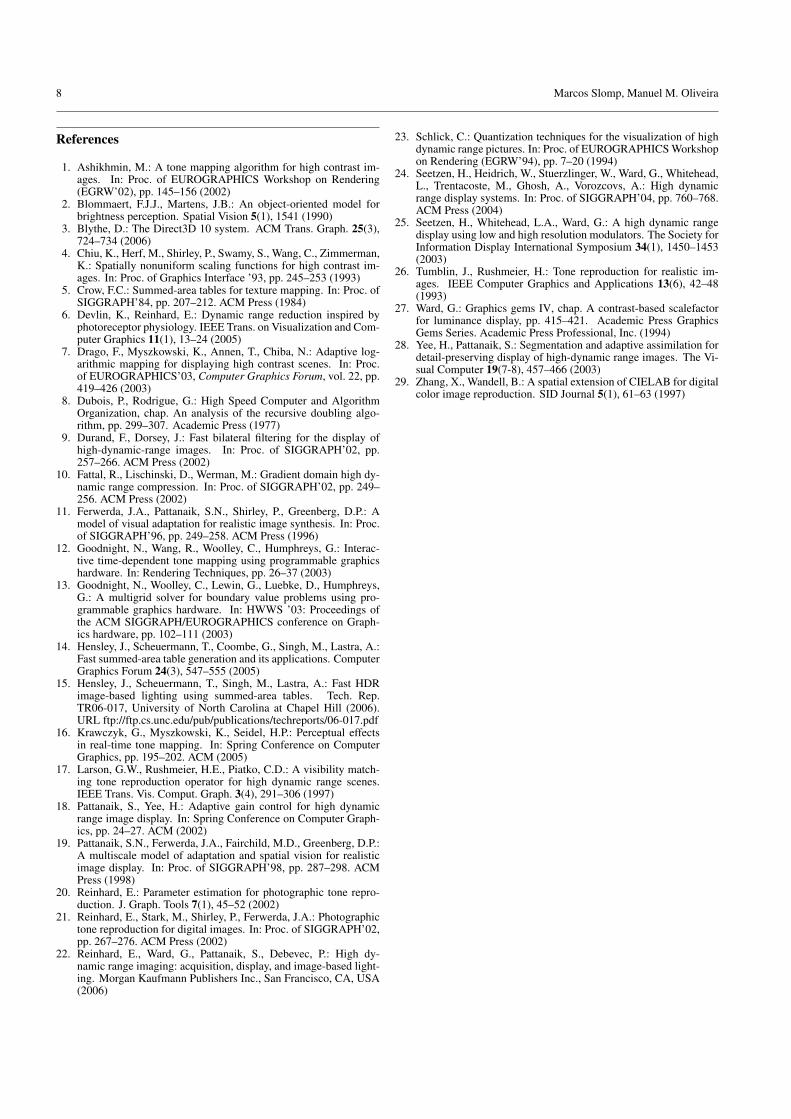
According to our experience, although the use of thethreshold ε between the values 0.05 and 0.025 can makesome difference for certain images, such as the one shownin Figure 9, for most images they only produce negligibledifferences. Figure 10 shows the Memorial image generatedusing ε = 0.05. The images shown in Figure 11 were pro-duced using ε = 0.025. For these examples, the correspond-ing results obtained with ε = 0.05 are almost identical.
Fig. 8 Tone-mapped image generated with a software implementationof Reinhard et al.’s algorithm using ε = 0.05.
Fig. 10 Tone-mapped version of the Memorial image obtained usingour technique with ε = 0.05.
Real-Time Photographic Local Tone Reproduction Using Summed-Area Tables 7
(a) (b) (c) (d)
Fig. 9 Comparison of the results produced by the GPU technique described in [16] and by our approach for a given HDR image. Top row:Krawczyk et al.’s technique using (a) ε = 0.05 and (b) ε = 0.025, and our technique using (c) ε = 0.05 and (d) ε = 0.025. Note the clearly visiblehalos around the sun and on the mountain silhouette in (a) and (b). Bottom row: per-pixel perceptual error computed using the S-CIELAB metricdescribed in [29] and using the image shown in Figure 8 as reference. White means bigger errors. Reinhard et al. [21] noticed that ε = 0.05produced better results for their method. The presented technique also adapts well with the same threshold, but we noticed that we can enhancethe image quality using a lower value such as ε = 0.025.
(a) (b) (c) (d)
Fig. 11 Examples of tone-mapped images produced with our technique using ε = 0.025. (d) shows a chapel scene which is part of our accom-panying demo.
6 Conclusion and Future Work
We presented an efficient GPU technique to implement anapproximation to Reinhard et al.’s photographic local tone-mapping operator in real time. Our approach uses box filtersinstead of Gaussian ones, and uses summed-area tables toefficiently evaluate the required convolutions. By showinga side-by-side comparison of the filtered luminance mapsgenerated with both filters at various scales and for an imagecontaining small high-frequency details, we have providedsome intuitive explanation of why our results are visuallysimilar to the ones generated by Reinhard et al.’s originaltechnique.
We have shown that our approach is significantly fasterthan previously known GPU implementations of the sameoperator, requires less memory and is also considerably sim-pler to implement. In terms of image quality, we have shownthat our technique is less prone to halo artifacts than thetechnique described by Krawczyk et al. [16]. All in all, ourtechnique provides a practical and attractive alternative forHDR-rendering applications that require high performance
but do not want to compromise image quality with the useof global tone-mapping operators.
The results of our research open some interesting av-enues for future exploration. For instance, SAT-based ap-proximations of the luminance-perception model of Blom-maert and Martens [2] could be also used by other performance-demanding applications.
Acknowledgements Marcos Slomp was supported by a CNPq-Brazilfellowship (Processo 130941/2006-4). Manuel M. Oliveira has a CNPq-Brazil fellowship (Processo 305613/2007-3). We are deeply thankful toIgor Kenne Braga for modeling the chapel used in our demo. We alsowant to thank Erik Reinhard, Rui Wang and Nolan Goodnight for pro-viding valuable information about their methods, Xuemei Zhang formaking his S-CIELAB MATLAB code available, Giovane R. Kuhnfor his assistance with the S-CIELAB software, and Eduardo Costa forproducing the video. NVIDIA kindly donated the GeForce 8800 GTXgraphics card used in this work. Thanks also to the several researcherswho made their HDR images publicaly avaible. Microsoft Brazil pro-vided additional support.
8 Marcos Slomp, Manuel M. Oliveira
References
1. Ashikhmin, M.: A tone mapping algorithm for high contrast im-ages. In: Proc. of EUROGRAPHICS Workshop on Rendering(EGRW’02), pp. 145–156 (2002)
2. Blommaert, F.J.J., Martens, J.B.: An object-oriented model forbrightness perception. Spatial Vision 5(1), 1541 (1990)
3. Blythe, D.: The Direct3D 10 system. ACM Trans. Graph. 25(3),724–734 (2006)
4. Chiu, K., Herf, M., Shirley, P., Swamy, S., Wang, C., Zimmerman,K.: Spatially nonuniform scaling functions for high contrast im-ages. In: Proc. of Graphics Interface ’93, pp. 245–253 (1993)
5. Crow, F.C.: Summed-area tables for texture mapping. In: Proc. ofSIGGRAPH’84, pp. 207–212. ACM Press (1984)
6. Devlin, K., Reinhard, E.: Dynamic range reduction inspired byphotoreceptor physiology. IEEE Trans. on Visualization and Com-puter Graphics 11(1), 13–24 (2005)
7. Drago, F., Myszkowski, K., Annen, T., Chiba, N.: Adaptive log-arithmic mapping for displaying high contrast scenes. In: Proc.of EUROGRAPHICS’03, Computer Graphics Forum, vol. 22, pp.419–426 (2003)
8. Dubois, P., Rodrigue, G.: High Speed Computer and AlgorithmOrganization, chap. An analysis of the recursive doubling algo-rithm, pp. 299–307. Academic Press (1977)
9. Durand, F., Dorsey, J.: Fast bilateral filtering for the display ofhigh-dynamic-range images. In: Proc. of SIGGRAPH’02, pp.257–266. ACM Press (2002)
10. Fattal, R., Lischinski, D., Werman, M.: Gradient domain high dy-namic range compression. In: Proc. of SIGGRAPH’02, pp. 249–256. ACM Press (2002)
11. Ferwerda, J.A., Pattanaik, S.N., Shirley, P., Greenberg, D.P.: Amodel of visual adaptation for realistic image synthesis. In: Proc.of SIGGRAPH’96, pp. 249–258. ACM Press (1996)
12. Goodnight, N., Wang, R., Woolley, C., Humphreys, G.: Interac-tive time-dependent tone mapping using programmable graphicshardware. In: Rendering Techniques, pp. 26–37 (2003)
13. Goodnight, N., Woolley, C., Lewin, G., Luebke, D., Humphreys,G.: A multigrid solver for boundary value problems using pro-grammable graphics hardware. In: HWWS ’03: Proceedings ofthe ACM SIGGRAPH/EUROGRAPHICS conference on Graph-ics hardware, pp. 102–111 (2003)
14. Hensley, J., Scheuermann, T., Coombe, G., Singh, M., Lastra, A.:Fast summed-area table generation and its applications. ComputerGraphics Forum 24(3), 547–555 (2005)
15. Hensley, J., Scheuermann, T., Singh, M., Lastra, A.: Fast HDRimage-based lighting using summed-area tables. Tech. Rep.TR06-017, University of North Carolina at Chapel Hill (2006).URL ftp://ftp.cs.unc.edu/pub/publications/techreports/06-017.pdf
16. Krawczyk, G., Myszkowski, K., Seidel, H.P.: Perceptual effectsin real-time tone mapping. In: Spring Conference on ComputerGraphics, pp. 195–202. ACM (2005)
17. Larson, G.W., Rushmeier, H.E., Piatko, C.D.: A visibility match-ing tone reproduction operator for high dynamic range scenes.IEEE Trans. Vis. Comput. Graph. 3(4), 291–306 (1997)
18. Pattanaik, S., Yee, H.: Adaptive gain control for high dynamicrange image display. In: Spring Conference on Computer Graph-ics, pp. 24–27. ACM (2002)
19. Pattanaik, S.N., Ferwerda, J.A., Fairchild, M.D., Greenberg, D.P.:A multiscale model of adaptation and spatial vision for realisticimage display. In: Proc. of SIGGRAPH’98, pp. 287–298. ACMPress (1998)
20. Reinhard, E.: Parameter estimation for photographic tone repro-duction. J. Graph. Tools 7(1), 45–52 (2002)
21. Reinhard, E., Stark, M., Shirley, P., Ferwerda, J.A.: Photographictone reproduction for digital images. In: Proc. of SIGGRAPH’02,pp. 267–276. ACM Press (2002)
22. Reinhard, E., Ward, G., Pattanaik, S., Debevec, P.: High dy-namic range imaging: acquisition, display, and image-based light-ing. Morgan Kaufmann Publishers Inc., San Francisco, CA, USA(2006)
23. Schlick, C.: Quantization techniques for the visualization of highdynamic range pictures. In: Proc. of EUROGRAPHICS Workshopon Rendering (EGRW’94), pp. 7–20 (1994)
24. Seetzen, H., Heidrich, W., Stuerzlinger, W., Ward, G., Whitehead,L., Trentacoste, M., Ghosh, A., Vorozcovs, A.: High dynamicrange display systems. In: Proc. of SIGGRAPH’04, pp. 760–768.ACM Press (2004)
25. Seetzen, H., Whitehead, L.A., Ward, G.: A high dynamic rangedisplay using low and high resolution modulators. The Society forInformation Display International Symposium 34(1), 1450–1453(2003)
26. Tumblin, J., Rushmeier, H.: Tone reproduction for realistic im-ages. IEEE Computer Graphics and Applications 13(6), 42–48(1993)
27. Ward, G.: Graphics gems IV, chap. A contrast-based scalefactorfor luminance display, pp. 415–421. Academic Press GraphicsGems Series. Academic Press Professional, Inc. (1994)
28. Yee, H., Pattanaik, S.: Segmentation and adaptive assimilation fordetail-preserving display of high-dynamic range images. The Vi-sual Computer 19(7-8), 457–466 (2003)
29. Zhang, X., Wandell, B.: A spatial extension of CIELAB for digitalcolor image reproduction. SID Journal 5(1), 61–63 (1997)