certain activated carbon from china - usitc · certain activated carbon from china ... production,...
TRANSCRIPT

Certain Activated Carbon From China
Investigation No. 731-TA-1103 (Final)
Publication 3913 April 2007
Washington, DC 20436

U.S. International Trade Commission
COMMISSIONERS
Daniel R. Pearson, ChairmanShara L. Aranoff, Vice Chairman
Deanna Tanner OkunCharlotte R. Lane
Irving A. WilliamsonDean A. Pinkert
Robert A. RogowskyDirector of Operations
Staff assigned
Jim McClure, InvestigatorPhilip Stone, Industry Analyst
Steve Trost, EconomistCharles Yost, AccountantDavid Fishberg, Attorney
Steve Hudgens, Senior Statistician
George Deyman, Supervisor Investigator
Address all communications toSecretary to the Commission
United States International Trade CommissionWashington, DC 20436
U.S. International Trade CommissionWashington, DC 20436
www.usitc.gov
Certain Activated Carbon From China
Investigation No. 731-TA-1103 (Final)
Publication 3913 April 2007


Contains Business Proprietary Information
i
CONTENTS
Page
Determination . . . . . . . . . . . . . . . . . . . . . . . . . . . . . . . . . . . . . . . . . . . . . . . . . . . . . . . . . . . . . . . . . . . 1Views of the Commission . . . . . . . . . . . . . . . . . . . . . . . . . . . . . . . . . . . . . . . . . . . . . . . . . . . . . . . . . 3Part I: Introduction . . . . . . . . . . . . . . . . . . . . . . . . . . . . . . . . . . . . . . . . . . . . . . . . . . . . . . . . . . . . . . I-1
Background . . . . . . . . . . . . . . . . . . . . . . . . . . . . . . . . . . . . . . . . . . . . . . . . . . . . . . . . . . . . . . . . . . I-1Previous investigation . . . . . . . . . . . . . . . . . . . . . . . . . . . . . . . . . . . . . . . . . . . . . . . . . . . . . . . . . . I-2Summary data . . . . . . . . . . . . . . . . . . . . . . . . . . . . . . . . . . . . . . . . . . . . . . . . . . . . . . . . . . . . . . . . I-2Nature and extent of sales at LTFV . . . . . . . . . . . . . . . . . . . . . . . . . . . . . . . . . . . . . . . . . . . . . . . I-3The subject product . . . . . . . . . . . . . . . . . . . . . . . . . . . . . . . . . . . . . . . . . . . . . . . . . . . . . . . . . . . . I-5
Physical characteristics and uses . . . . . . . . . . . . . . . . . . . . . . . . . . . . . . . . . . . . . . . . . . . . . . . I-5Manufacturing facilities . . . . . . . . . . . . . . . . . . . . . . . . . . . . . . . . . . . . . . . . . . . . . . . . . . . . . . I-8Interchangeability and customer and producer perceptions . . . . . . . . . . . . . . . . . . . . . . . . . . I-9Channels of distribution . . . . . . . . . . . . . . . . . . . . . . . . . . . . . . . . . . . . . . . . . . . . . . . . . . . . . . I-10Price . . . . . . . . . . . . . . . . . . . . . . . . . . . . . . . . . . . . . . . . . . . . . . . . . . . . . . . . . . . . . . . . . . . . I-10
Domestic like product issues . . . . . . . . . . . . . . . . . . . . . . . . . . . . . . . . . . . . . . . . . . . . . . . . . . . . I-10Part II: Conditions of competition in the U.S. market . . . . . . . . . . . . . . . . . . . . . . . . . . . . . . . . . . . II-1
U.S. market segments . . . . . . . . . . . . . . . . . . . . . . . . . . . . . . . . . . . . . . . . . . . . . . . . . . . . . . . . . . II-1Channels of distribution . . . . . . . . . . . . . . . . . . . . . . . . . . . . . . . . . . . . . . . . . . . . . . . . . . . . . . . . II-1Supply and demand considerations . . . . . . . . . . . . . . . . . . . . . . . . . . . . . . . . . . . . . . . . . . . . . . . . II-2
U.S. supply . . . . . . . . . . . . . . . . . . . . . . . . . . . . . . . . . . . . . . . . . . . . . . . . . . . . . . . . . . . . . . . II-2U.S. demand . . . . . . . . . . . . . . . . . . . . . . . . . . . . . . . . . . . . . . . . . . . . . . . . . . . . . . . . . . . . . . II-4
Substitutability issues . . . . . . . . . . . . . . . . . . . . . . . . . . . . . . . . . . . . . . . . . . . . . . . . . . . . . . . . . . II-6Factors affecting purchasing decisions . . . . . . . . . . . . . . . . . . . . . . . . . . . . . . . . . . . . . . . . . . II-6Comparisons of domestic products, subject imports, and nonsubject imports . . . . . . . . . . . . II-12
Elasticity estimates . . . . . . . . . . . . . . . . . . . . . . . . . . . . . . . . . . . . . . . . . . . . . . . . . . . . . . . . . . . . II-14U.S. supply elasticity . . . . . . . . . . . . . . . . . . . . . . . . . . . . . . . . . . . . . . . . . . . . . . . . . . . . . . . . II-14U.S. demand elasticity . . . . . . . . . . . . . . . . . . . . . . . . . . . . . . . . . . . . . . . . . . . . . . . . . . . . . . . II-14Substitution elasticity . . . . . . . . . . . . . . . . . . . . . . . . . . . . . . . . . . . . . . . . . . . . . . . . . . . . . . . II-14
Part III: U.S. producers’ production, shipments, and employment . . . . . . . . . . . . . . . . . . . . . . . . . . III-1U.S. producers . . . . . . . . . . . . . . . . . . . . . . . . . . . . . . . . . . . . . . . . . . . . . . . . . . . . . . . . . . . . . . . III-1U.S. producers’ capacity, production, capacity utilization, shipment, inventory,
and employment data . . . . . . . . . . . . . . . . . . . . . . . . . . . . . . . . . . . . . . . . . . . . . . . . . . . . . . . . III-4Part IV: U.S. imports, apparent consumption, and market shares . . . . . . . . . . . . . . . . . . . . . . . . . . . IV-1
U.S. importers . . . . . . . . . . . . . . . . . . . . . . . . . . . . . . . . . . . . . . . . . . . . . . . . . . . . . . . . . . . . . . . . IV-1U.S. imports . . . . . . . . . . . . . . . . . . . . . . . . . . . . . . . . . . . . . . . . . . . . . . . . . . . . . . . . . . . . . . . . . IV-2Negligibility . . . . . . . . . . . . . . . . . . . . . . . . . . . . . . . . . . . . . . . . . . . . . . . . . . . . . . . . . . . . . . . . . IV-2Apparent U.S. consumption . . . . . . . . . . . . . . . . . . . . . . . . . . . . . . . . . . . . . . . . . . . . . . . . . . . . . IV-3U.S. market shares . . . . . . . . . . . . . . . . . . . . . . . . . . . . . . . . . . . . . . . . . . . . . . . . . . . . . . . . . . . . IV-3Ratio of imports to U.S. production . . . . . . . . . . . . . . . . . . . . . . . . . . . . . . . . . . . . . . . . . . . . . . . IV-3

Contains Business Proprietary Information
ii
CONTENTS–Continued
Page
Part V: Pricing and related information . . . . . . . . . . . . . . . . . . . . . . . . . . . . . . . . . . . . . . . . . . . . . . V-1Factors affecting prices . . . . . . . . . . . . . . . . . . . . . . . . . . . . . . . . . . . . . . . . . . . . . . . . . . . . . . . . . V-1
Raw materials . . . . . . . . . . . . . . . . . . . . . . . . . . . . . . . . . . . . . . . . . . . . . . . . . . . . . . . . . . . . . V-1Transportation costs to the U.S. market . . . . . . . . . . . . . . . . . . . . . . . . . . . . . . . . . . . . . . . . . . V-1U.S. inland transportation costs . . . . . . . . . . . . . . . . . . . . . . . . . . . . . . . . . . . . . . . . . . . . . . . . V-1Exchange rates . . . . . . . . . . . . . . . . . . . . . . . . . . . . . . . . . . . . . . . . . . . . . . . . . . . . . . . . . . . . . V-2
Pricing practices . . . . . . . . . . . . . . . . . . . . . . . . . . . . . . . . . . . . . . . . . . . . . . . . . . . . . . . . . . . . . . V-3Pricing methods . . . . . . . . . . . . . . . . . . . . . . . . . . . . . . . . . . . . . . . . . . . . . . . . . . . . . . . . . . . . V-3
Price data . . . . . . . . . . . . . . . . . . . . . . . . . . . . . . . . . . . . . . . . . . . . . . . . . . . . . . . . . . . . . . . . . . . V-3Price trends . . . . . . . . . . . . . . . . . . . . . . . . . . . . . . . . . . . . . . . . . . . . . . . . . . . . . . . . . . . . . . . V-4Price comparisons . . . . . . . . . . . . . . . . . . . . . . . . . . . . . . . . . . . . . . . . . . . . . . . . . . . . . . . . . . V-8
Lost sales and lost revenues . . . . . . . . . . . . . . . . . . . . . . . . . . . . . . . . . . . . . . . . . . . . . . . . . . . . . V-9Part VI: Financial experience of U.S. firms . . . . . . . . . . . . . . . . . . . . . . . . . . . . . . . . . . . . . . . . . . . VI-1
Background . . . . . . . . . . . . . . . . . . . . . . . . . . . . . . . . . . . . . . . . . . . . . . . . . . . . . . . . . . . . . . . . . . VI-1Operations on CAC . . . . . . . . . . . . . . . . . . . . . . . . . . . . . . . . . . . . . . . . . . . . . . . . . . . . . . . . . . . . VI-1Capital expenditures and research and development expenses . . . . . . . . . . . . . . . . . . . . . . . . . . . VI-3Assets and return on investment . . . . . . . . . . . . . . . . . . . . . . . . . . . . . . . . . . . . . . . . . . . . . . . . . . VI-3Capital and investment . . . . . . . . . . . . . . . . . . . . . . . . . . . . . . . . . . . . . . . . . . . . . . . . . . . . . . . . . VI-3
Actual negative effects . . . . . . . . . . . . . . . . . . . . . . . . . . . . . . . . . . . . . . . . . . . . . . . . . . . . . . VI-3Anticipated negative effects . . . . . . . . . . . . . . . . . . . . . . . . . . . . . . . . . . . . . . . . . . . . . . . . . . VI-3
Part VII: Threat considerations . . . . . . . . . . . . . . . . . . . . . . . . . . . . . . . . . . . . . . . . . . . . . . . . . . . . . VII-1The industry in China . . . . . . . . . . . . . . . . . . . . . . . . . . . . . . . . . . . . . . . . . . . . . . . . . . . . . . . . . . VII-1Nonsubject producers/exporters . . . . . . . . . . . . . . . . . . . . . . . . . . . . . . . . . . . . . . . . . . . . . . . . . . VII-3U.S. importers’ inventories . . . . . . . . . . . . . . . . . . . . . . . . . . . . . . . . . . . . . . . . . . . . . . . . . . . . . . VII-4Imports subsequent to December 31, 2006 . . . . . . . . . . . . . . . . . . . . . . . . . . . . . . . . . . . . . . . . . . VII-4Antidumping duty orders in third-country markets . . . . . . . . . . . . . . . . . . . . . . . . . . . . . . . . . . . VII-5
Appendixes
A. Federal Register notices . . . . . . . . . . . . . . . . . . . . . . . . . . . . . . . . . . . . . . . . . . . . . . . . . . . . . . . A-1B. Calendar of the public hearing . . . . . . . . . . . . . . . . . . . . . . . . . . . . . . . . . . . . . . . . . . . . . . . . . . B-1C. Summary data . . . . . . . . . . . . . . . . . . . . . . . . . . . . . . . . . . . . . . . . . . . . . . . . . . . . . . . . . . . . . . . C-1D. Producer, importer, and purchaser comments regarding differences and similarities
between reactivated carbon and certain activated carbon. . . . . . . . . . . . . . . . . . . . . . . . . . . D-1E. Trade and financial information on reactivated carbon . . . . . . . . . . . . . . . . . . . . . . . . . . . . . . . E-1
Note. – Information that would reveal confidential information of individual concerns may not bepublished and, therefore, has been identified by the use of asterisks.

1 The record is defined in sec. 207.2(f) of the Commission’s Rules of Practice and Procedure (19 CFR § 207.2(f)). 2 For purposes of this investigation, the product covered is certain activated carbon defined as a powdered,granular, or pelletized carbon product obtained by “activating” with heat and steam various materials containingcarbon, including but not limited to coal (including bituminous, lignite, and anthracite), wood, coconut shells, olivestones, and peat. The thermal and steam treatments remove organic materials and create an internal pore structure inthe carbon material. The producer can also use carbon dioxide gas (CO2) in place of steam in this process. The vastmajority of the internal porosity developed during the high temperature steam (or CO2 gas) activated process is adirect result of oxidation of a portion of the solid carbon atoms in the raw material, converting them into a gaseousform of carbon.
This definition covers all forms of activated carbon that are activated by steam or CO2, regardless of the rawmaterial, grade, mixture, additives, further washing or post-activation chemical treatment (chemical or waterwashing, chemical impregnation or other treatment), or product form. Unless specifically excluded, this definitioncovers all physical forms of certain activated carbon, including powdered activated carbon (“PAC”), granularactivated carbon (“GAC”), and pelletized activated carbon.
Excluded from this definition are chemically-activated carbons. The carbon-based raw material used in thechemical activation process is treated with a strong chemical agent, including but not limited to phosphoric acid, zincchloride sulfuric acid or potassium hydroxide, that dehydrates molecules in the raw material, and results in theformation of water that is removed from the raw material by moderate heat treatment. The activated carbon createdby chemical activation has internal porosity developed primarily due to the action of the chemical dehydration agent. Chemically activated carbons are typically used to activate raw materials with a lignocellulosic component such ascellulose, including wood, sawdust, paper mill waste and peat.
To the extent that an imported activated carbon product is a blend of steam and chemically activatedcarbons, products containing 50 percent or more steam (or CO2 gas) activated carbons are within this definition, andthose containing more than 50 percent chemically activated carbons are outside this definition. This exclusionlanguage regarding blended material applies only to mixtures of steam and chemically activated carbons.
Also excluded from this definition are reactivated carbons. Reactivated carbons are previously usedactivated carbons that have had adsorbed materials removed from their pore structure after use through theapplication of heat, steam and/or chemicals.
Also excluded from this definition is activated carbon cloth. Activated carbon cloth is a woven textilefabric made of or containing activated carbon fibers. It is used in masks and filters and clothing of various typeswhere a woven format is required.
Any activated carbon meeting the physical description of subject merchandise provided above that is notexpressly excluded from this definition is included within the definition.
UNITED STATES INTERNATIONAL TRADE COMMISSION
Investigation No. 731-TA-1103 (Final)
CERTAIN ACTIVATED CARBON FROM CHINA
DETERMINATION
On the basis of the record1 developed in the subject investigation, the United States InternationalTrade Commission (Commission) determines, pursuant to section 735(b) of the Tariff Act of 1930 (19U.S.C. § 1673d(b)) (the Act), that an industry in the United States is materially injured by reason ofimports from China of certain activated carbon,2 provided for in subheading 3802.10.00 of theHarmonized Tariff Schedule of the United States, that have been found by the Department of Commerce(Commerce) to be sold in the United States at less than fair value (LTFV).

2
BACKGROUND
The Commission instituted this investigation effective March 8, 2006, following receipt of apetition filed with the Commission and Commerce by Calgon Carbon Corporation, Pittsburgh, PA, andNorit Americas, Inc., Marshall, TX. The final phase of the investigation was scheduled by theCommission following notification of a preliminary determination by Commerce that imports of certainactivated carbon from China were being sold at LTFV within the meaning of section 733(b) of the Act(19 U.S.C. § 1673b(b)). Notice of the scheduling of the final phase of the Commission’s investigationand of a public hearing to be held in connection therewith was given by posting copies of the notice in theOffice of the Secretary, U.S. International Trade Commission, Washington, DC, and by publishing thenotice in the Federal Register of November 16, 2006 (71 FR 66793). The hearing was held inWashington, DC, on February 27, 2007, and all persons who requested the opportunity were permitted toappear in person or by counsel.

1 Confidential Report (“CR”) at I-6 and I-11-I-12, Public Report (“PR”) at I-5 and I-8-I-9. Activated carbon alsomay be produced via chemical activation; such activated carbon is excluded from the scope of this investigation. Chemical activation generally is used to produce a high pore volume in cellulose-based raw material such as wood orpeat. Chemically activated carbon primarily is used in vapor phase applications such as automobile emissionscanisters, and in certain solvent recovery applications. CR at I-8-I-9, PR at I-6-I-7. 2 CR at I-8, PR at I-6. 3 CR at I-8, PR at I-6. 4 CR at I-8-I-10, PR at I-6-I-8. Coconut-based certain activated carbon is used primarily in the gold mining andcigarette filter industries, as well as being a price premium product for home water filters. Petitioners’ PosthearingBrief at Exh. 1, p. 32 and Exh. 10. 5 CR at I-10, PR at I-7. 6 CR at I-6, PR at I-5. 7 On January 26, 2006, Petitioners in the instant investigation filed a petition alleging that an industry in theUnited States was materially injured and threatened with material injury by reason of LTFV imports of “activatedcarbon” from China, which included both steam activated and chemically activated carbon in the proposed scope ofinvestigation. As a result of that filing, the Commission instituted investigation No. 731-TA-1102 (Preliminary):Activated Carbon from China. See Notice of Initiation, Activated Carbon from China, 71 Fed. Reg. 5688 (Feb. 2,2006). Subsequently, on February 15, 2006, Petitioners withdrew their petition at Commerce. Commerce had notinitiated an investigation by that date, and the Commission discontinued its investigation effective that date. SeeNotice of Withdrawal of Petition, Activated Carbon from China, 71 Fed. Reg. 9155 (Feb. 22, 2006). 8 Only Cherishmet Inc., a U.S. importer of subject merchandise from China, filed a brief in the final phase of thisinvestigation. In that brief, Cherishmet discussed only domestic like product issues.
3
VIEWS OF THE COMMISSION
Based on the record in this investigation, we determine that an industry in the United States ismaterially injured by reason of imports of certain activated carbon imported from China that have beenfound by the Department of Commerce to be sold in the United States at less than fair value (“LTFV”).
I. BACKGROUND
Certain activated carbon is black carbon material obtained by “activating” various materialscontaining high levels of carbon, including coal, wood, and coconut shells, by heating in the presence ofsteam or carbon dioxide.1 The thermal treatments remove organic materials and create an internal porestructure in the carbon material. The pores adsorb (trap) contaminants in liquids or gasses. Adsorption ofcontaminants removes organic compounds from the surrounding air, gas, or liquid streams, thus helpingto purify the stream.2 Coal-based certain activated carbon is used widely by municipal water treatmentauthorities to remove undesirable tastes and odors from drinking water and to eliminate contaminantsfrom industrial waste water.3 Other uses of coal-based certain activated carbon include removing colorand impurities from food and chemicals, as well as removing mercury and dioxins from flue gasemissions.4 Certain activated carbon is non-toxic and has no adverse environmental effects, althoughonce activated carbon has been used, it may take on the toxicity of adsorbed materials.5 Certain activatedcarbon is sold in three basic forms: powdered, granular, and pelletized.6
The antidumping duty petition in this investigation was filed on March 8, 2006.7 Petitioners areCalgon Carbon Corporation (“Calgon”) and Norit Americas Inc. (“Norit”). No respondents appeared atthe hearing in the final phase of this investigation.8

9 19 U.S.C. § 1677(4)(A) (2000). 10 19 U.S.C. § 1677(4)(A). 11 19 U.S.C. § 1677(10). 12 See, e.g., NEC Corp. v. Department of Commerce, 36 F. Supp. 2d 380, 383 (Ct. Int’l Trade 1998); NipponSteel Corp. v. United States, 19 CIT 450, 455 (1995); Torrington Co. v. United States, 747 F. Supp. 744, 749 n.3(Ct. Int’l Trade 1990), aff’d, 938 F.2d 1278 (Fed. Cir. 1991) (“every like product determination ‘must be made onthe particular record at issue’ and the ‘unique facts of each case’”). The Commission generally considers a numberof factors including: (1) physical characteristics and uses; (2) interchangeability; (3) channels of distribution; (4)customer and producer perceptions of the products; (5) common manufacturing facilities, production processes andproduction employees; and, where appropriate, (6) price. See Nippon, 19 CIT at 455 n.4; Timken Co. v. UnitedStates, 913 F. Supp. 580, 584 (Ct. Int’l Trade 1996). No single factor is dispositive, and the Commission mayconsider other factors relevant to a particular investigation. The Commission looks for clear dividing lines amongpossible like products, and disregards minor variations. See, e.g., S. Rep. No. 249, 96th Cong., 1st Sess. 90-91(1979); Torrington Co., 747 F. Supp. at 748-49. 13 See, e.g., S. Rep. No. 96-249 at 90-91 (1979). 14 Nippon Steel, 19 CIT at 455; Torrington, 747 F. Supp. at 748-49. See also S. Rep. No. 96-249 at 90-91 (1979)(Congress has indicated that the like product standard should not be interpreted in “such a narrow fashion as topermit minor differences in physical characteristics or uses to lead to the conclusion that the product and article arenot ‘like’ each other, nor should the definition of ‘like product’ be interpreted in such a fashion as to preventconsideration of an industry adversely affected by the imports under consideration.”). 15 Hosiden Corp. v. Advanced Display Mfrs., 85 F.3d 1561, 1568 (Fed. Cir. 1996) (Commission may find singlelike product corresponding to several different classes or kinds defined by Commerce); Torrington, 747 F. Supp. at748-752 (affirming Commission determination of six like products in investigations where Commerce found fiveclasses or kinds).
4
II. DOMESTIC LIKE PRODUCT
A. In General
In determining whether an industry in the United States is materially injured or threatened withmaterial injury by reason of imports of the subject merchandise, the Commission first defines the“domestic like product” and the “industry.”9 Section 771(4)(A) of the Tariff Act of 1930, as amended(“the Act”), defines the relevant domestic industry as the “producers as a [w]hole of a domestic likeproduct, or those producers whose collective output of a domestic like product constitutes a majorproportion of the total domestic production of the product.”10 In turn, the Act defines “domestic likeproduct” as “a product which is like, or in the absence of like, most similar in characteristics and useswith, the article subject to an investigation . . . .”11
The decision regarding the appropriate domestic like product(s) in an investigation is a factualdetermination, and the Commission has applied the statutory standard of “like” or “most similar incharacteristics and uses” on a case-by-case basis.12 No single factor is dispositive, and the Commissionmay consider other factors it deems relevant based on the facts of a particular investigation.13 TheCommission looks for clear dividing lines among possible like products and disregards minor variations.14 Although the Commission must accept the determination of Commerce as to the scope of the importedmerchandise allegedly sold at LTFV, the Commission determines what domestic product is like theimported articles Commerce has identified.15

5
B. Product Description
Commerce’s final determinations define the imported merchandise within the scope of thisinvestigation as:
The merchandise subject to this investigation is certain activatedcarbon. Certain activated carbon is a powdered, granular or pelletized carbonproduct obtained by “activating” with heat and steam various materialscontaining carbon, including but not limited to coal (including bituminous,lignite and anthracite), wood, coconut shells, olive stones, and peat. Thethermal and steam treatments remove organic materials and create an internalpore structure in the carbon material. The producer can also use carbon dioxidegas (CO2) in place of steam in this process. The vast majority of the internalporosity developed during the high temperature steam (or CO2 gas) activationprocess is a direct result of oxidation of a portion of the solid carbon atoms inthe raw material, converting them into a gaseous form of carbon.
The scope of this investigation covers all forms of activated carbon thatare activated by steam or CO2, regardless of raw material, grade, mixture,additives, further washing or post-activation chemical treatment (chemical orwater washing, chemical impregnation or other treatment), or product form. Unless specifically excluded, the scope of this investigation covers all physicalforms of certain activated carbon, including powdered activated carbon(“PAC”), granular activated carbon (“GAC”), and pelletized activated carbon.
Excluded from the scope of the investigation are chemically-activatedcarbons. The carbon based raw material used in the chemical activation processis treated with a strong chemical agent, including but not limited to phosphoricacid, zinc chloride sulfuric acid or potassium hydroxide, that dehydratesmolecules in the raw material by moderate heat treatment. The activatedcarbon created by chemical activation has internal porosity developed primarilydue to the action of the chemical dehydration agent. Chemically activatedcarbons are typically used to activate raw materials with a lignocellulosiccomponent such as cellulose, including wood, sawdust, paper mill waste andpeat.
To the extent that an imported activated carbon product is a blend ofsteam and chemically activated carbons, products containing 50 percent ormore steam (or CO2) gas activated carbons are within this scope, and thosecontaining more than 50 percent chemically activated carbons are outside thescope. This exclusion language regarding blended material applies only tomixtures of steam and chemically activated carbons.
Also excluded from this scope are reactivated carbons. Reactivatedcarbons are previously used activated carbons that have had adsorbed materialsremoved from their pore structure after use through the application of heat,steam and/or chemicals.

16 72 Fed. Reg. 9508, 9509 (Mar. 2, 2007) (emphasis in original). 17 Petitioners’ Posthearing Brief at 4. 18 ***, an importer of subject merchandise from China, did not enter an appearance in this case ***. ***. ***. Id. The Commission is unable ***. The Commission has repeatedly stated that when an item is within Commerce’sscope, the domestic like product must include the domestically produced counterpart, or the most similar counterpartto that imported item. See Artists’ Canvas from China, Inv. No. 731-TA-1091 (Preliminary), USITC Pub. 3777(May 2005) at 5-6 (“Because kits are included within the scope, even if there were no domestic production theCommission would still have to find the next ‘most similar’ article to such kits that is domestically produced . . . .”);Certain Lined Paper School Supplies , Inv. Nos. 701-TA-442-443 (Preliminary) and 731-TA-1095-1097(Preliminary), USITC Pub. 3811 (October 2005) at 15 n.50; Certain Cold-Rolled Steel Products from Australia,India, Japan, Sweden, and Thailand, Inv. Nos. 731-TA-965, -971-72, -979, and -981 (Final), USITC Pub. 3536(September 2002) at 10, n.31 and USITC Pub. 3437 (November 2001) (Preliminary) at 5 & n.20 (“...it is the role ofCommerce, not the Commission, to determine the scope of the subject merchandise.”) and
The Commission has consistently stated that it does not have the authority to“exclude” from its determination products that are included within the scope. See, e.g., Individually Quick Frozen Red Raspberries from Chile, Inv. Nos. 701-TA-416 and 731-TA-948 (Preliminary), USITC Pub. 3441 at n.14 (July 2001),citing Sony Corp. of America v. United States, 712 F. Supp. 978, 983-84 (Ct.Int’l Trade 1989); Fresh Garlic from the People’s Republic of China, Inv. No.731-TA-683 (Final), USITC Pub. 2825, at I-7 n.17 (Nov. 1994), citing SandvikAB v. United States, 721 F. Supp. 1322, 1333 (Ct. Int’l Trade 1989), aff’d, 904F.2d 46 (Fed. Cir. 1990).
See also, e.g., Carbon and Certain Alloy Steel Wire Rod from China, Germany, and Turkey, Inv. Nos. 731-TA-(continued...)
6
Also excluded from the scope is activated carbon cloth. Activatedcarbon cloth is a woven textile fabric made of or containing activated carbonfibers. It is used in masks and filters and clothing of various types where awoven format is required.
Any activated carbon meeting the physical description of subjectmerchandise provided above that is not expressly excluded from the scope isincluded within this scope. The products under investigation are currentlyclassifiable under Harmonized Tariff System of the United States (“HTSUS”)subheading 3802.10.00. Although HTSUS subheadings are provided forconvenience and customs purposes, the written description of the scope of thisproceeding is dispositive.16
C. Domestic Like Product
In general there are three types of activated carbon: (1) carbon that has been activated usingthermal processing (“certain activated carbon”); (2) carbon that has been reactivated (“reactivatedcarbon”), typically using thermal processing; and (3) carbon that has been activated chemically. Only thefirst of these, certain activated carbon, is covered by the scope of this investigation. In the preliminary phase of this investigation, the Commission found one domestic like productconsisting of certain activated carbon, coextensive with Commerce’s scope of investigation. Petitionersargue that the Commission should once again find one domestic like product consisting of certainactivated carbon.17 Cherishmet argues that the Commission should define the domestic like product toinclude certain activated carbon, reactivated carbon, and chemically activated carbon.18

18 (...continued)1099-1101 (Preliminary), USITC Pub. 3832 (January 2006) at 10-11; Certain Lined Paper School Supplies , Inv.Nos. 701-TA-442-443 (Preliminary) and 731-TA-1095-1097 (Preliminary), USITC Pub. 3811 (October 2005) at 8,n.23. 19 See, e.g., CIAC’s Postconference Brief at 9. 20 CR at I-15, PR at I-12. 21 CR at II-8, PR at II-5. 22 CR at II-9, PR at II-5. Third-party reactivated carbon is never used in drinking water applications.
7
1. Whether the Domestic Like Product Should Be Defined More Broadly Thanthe Scope to Include Reactivated Carbon
For purposes of the preliminary determination, no party argued that the domestic like productshould be defined more broadly than the scope to include reactivated carbon.19 Nevertheless, becauseboth Petitioners and Respondents presented arguments during the preliminary phase of this investigationregarding whether reactivated carbon is within the domestic like product, the Commission applied itstraditional six factor domestic like product analysis and found a clear dividing line between certainactivated carbon and reactivated carbon. The Commission collected additional data on reactivated carbonfor the final phase of this investigation. No new information has emerged in the final phase of thisinvestigation that calls into question our earlier decision not to broaden the like product to includereactivated carbon. Based on our traditional six factor like product analysis, we define the domestic likeproduct to be certain activated carbon, coextensive with Commerce’s scope of investigation.
Physical Characteristics and Uses
Reactivated carbon is made by thermally or chemically removing chemical species adsorbed ontoused activated carbon.20 It appears that reactivated carbon and activated carbon cannot be physicallydistinguished within the same type or form of carbon (i.e., pelletized, powdered, granulated, etc.), and thatboth have the same general end use: to trap contaminants in liquids or gases through adsorption.
Interchangeability
Interchangeability between certain activated carbon and reactivated carbon is limited. Due tocontamination and liability concerns, most reactivated carbon can be used only in its original application.Moreover, while some reactivated carbon is pooled for use in the same types of applications to which virgin product is directed, most purchasers are unwilling to buy reactivated carbon made from activatedcarbon that had been previously used by another end user. When asked to compare CAC and reactivatedcarbons, a majority of responding purchasers confirmed that either they were not interchangeable at all, orwere not interchangeable for that purchaser’s desired end uses.21 Additionally, third-party reactivatedcarbons can never be used in certain beverage applications and food grade applications.22 Althoughactivated carbons can be used in any applications that use reactivated carbons, reactivated carbons arefrequently limited to their original application, and are used only as a cost-saving measure.

23 CR at I-14, PR at I-10. 24 CR at I-14-15, PR at I-10-I-11. 25 CR at D-17-D-20, PR at D-3 (summarizing questionnaire response data). 26 CR at II-5, PR at II-3. 27 Transcript of the Commission’s February 27, 2007 hearing (“Hearing Tr.”) at 43 (Luberda). 28 CR at I-15-16, PR at I-11-I-12. 29 CR at II-5, PR at II-3. *** reported that reactivated carbon accounts for *** percent of production by thepersonnel that produces certain activated carbon.
8
Channels of Distribution
Even though almost all domestic producers of certain activated carbon market and sell reactivatedcarbon, the channels of distribution for the two products differ. Over *** percent of domesticallyproduced certain activated carbon and reactivated carbon is sold to end users.23 However, certainactivated carbon is sold on the commercial market to a variety of end users; in contrast, a significantamount of reactivation is performed for, and the end product returned to, the original user of the product,or produced (reactivated) and consumed internally by end users who have their own on-site reactivationfacilities.24
Customer and Producer Perceptions
While some customers perceive reactivated carbon to be identical to low-grade virgin activatedcarbons, as previously discussed, some end users accept only virgin activated carbon, and numerous otherend users use only their own reactivated carbons due to contamination concerns. Many customers do notperceive reactivated carbons to be the equivalent of virgin activated carbons, hence their reluctance orinability to accept reactivated carbons.25 Moreover, although both Petitioners activate and reactivatecarbons, they produce the two in separate facilities and market activated and reactivated carbons asdistinct products.26 In practice, customers specify whether they want activated carbon or reactivatedcarbon, and no producer would provide reactivated carbon as a substitute for virgin activated carbonwithout the permission of the customer.27
Common Manufacturing Facilities, Production Processes and Production Employees
No significant producer of activated carbon reactivates in the same facility or on the sameequipment due to concerns that spent carbon could contaminate the virgin activated carbon.28 Generally,CAC and reactivated carbon do not use the same employees, although *** reported that some of itsproduction personnel will occasionally work on reactivating carbon.29
The evidence is mixed with regard to differences in the production processes. Petitioners statethat reactivated carbon does not require the production of char from the raw materials, and that theorganic compounds removed during activation are different than the adsorbed compounds removedduring reactivation. Cherishmet argues that the processes are almost identical, although it acknowledgesminor differences between the two processes regarding what is being carbonized, and that reactivatedcarbon needs to be blended with virgin activated carbon to make up for carbon lost in the reactivatedcarbon production process.

30 CR at II-9, PR at II-6. 31 CR at II-9, PR at II-6. 32 Petitioners state that the Commission has never included refurbished or used products within the same likeproduct as new products. Petitioners’ Posthearing Brief at Exh. 1 p. 25 (response to Commissioner Williamson’squestion) citing Certain Telephone Systems and Subassemblies Thereof from Japan and Taiwan, Inv. Nos 731-TA-426 and 428 (Final), USITC Pub. 2237 (Nov. 1989) (finding that refurbished telephone equipment was not a part ofthe like product encompassing telephone systems and subassemblies based primarily on the lack of productionrelated activity by the refurbishers. Additionally, Petitioners cite Polyethylene Terephthalate (PET) Resin fromIndia, Indonesia, and Thailand, Inv. Nos. 701-TA-439 and 731-TA-1077, 1078, 1080 (Final), USITC Pub. 3769 at 6-7 (May 2005), in which the Commission determined that the domestic like product for bottle-grade PET resin did notinclude post-consumer recycled or post-industrial recycled bottle-grade PET resin, both of which were not includedin the scope. Petitioners acknowledge Certain Polyester Staple Fiber from Korea and Taiwan, Inv. Nos. 731-TA-825-826 (Final), USITC Pub. 3300 at 4-5 (May 2000) in which the Commission included both virgin andregenerated material within the same domestic like product without opposition, but distinguish the case based on thefact that both virgin and regenerated polyester staple fiber were included in the scope of the investigation, and therewere no significant concerns of contamination with this material. We note that the Commission has not adopted aseparate approach to recycled or refurbished products, and we therefore analyze these products on a case-by-casebasis. 33 The new information on the record, primarily purchaser responses, generally supports our determination not toinclude reactivated carbons within the domestic like product definition. While a number of purchasers indicated thatvirgin certain activated carbon and reactivated carbon are interchangeable, these responses were in part related to there-use of the activated carbon by the same entity. CR/PR at App. D. As noted, most purchasers are unwilling topurchase reactivated carbon that was first used by a different entity.
9
Price
There are also significant differences in price between the two products.30 Reactivated carbonsells at much lower prices than does certain activated carbon, approximately 10 to 20 percent cheaperthan virgin CAC, according to several purchasers.31
Conclusion Despite similarities in physical characteristics and uses, we continue to find, on balance, a cleardividing line between certain activated carbon and reactivated carbon based on limited interchangeability,and differences in channels of distribution, manufacturing facilities and equipment, customer andproducer perceptions, and price.32 The record in the final phase of this investigation has not changed soas to warrant a departure from the definition we adopted in the preliminary phase, that is, a singledomestic like product corresponding to Commerce’s scope of investigation. 33
2. Whether the Domestic Like Product Should Be Defined More Broadly Than the Scope to Include Chemically Activated Carbon
In the preliminary phase of this investigation, the Commission declined to define the domesticlike product more broadly than the scope to include chemically activated carbon. In its preliminarydetermination, the Commission applied its traditional six-factor like product analysis and determined thatcertain activated carbon and chemically activated carbon, within the same type or form, possess similarphysical characteristics and share the same basic end use: to trap contaminants in liquids or gases throughadsorption. However, differences in chemical and steam activation, and the raw material activated, create
34 19 U.S.C. § 1677(4)(A). 35 United States Steel Group v. United States, 873 F. Supp. 673, 681-84 (Ct. Int’l Trade 1994), aff’d, 96 F.3d1352 (Fed. Cir. 1996). 36 As discussed infra, Acticarb ceased production in 2005, while Cal Pacific Carbon ***. 37 19 U.S.C. § 1677(4)(B).
10
differences in pore structure and pore size. Chemically activated carbon is more effective in vapor phaseapplications in the automobile industry, its primary market.
Interchangeability is limited. Certain activated carbon does not currently compete withchemically activated carbons in the domestic automobile market, despite the much higher prices paid forchemically activated carbon in that market. Although chemically activated carbon is theoreticallyinterchangeable with certain activated carbon for certain applications, as a practical matter, the higherprice of chemically activated carbon severely limits competition. While both types of carbon are soldprimarily to end users, certain activated and chemically activated carbon cannot be said to share the samechannels of distribution because the products are generally sold to different end users in differentindustries. Although the record was mixed with respect to customer and producer perceptions, itindicated that the products do not share the same manufacturing facilities, equipment, employees, andproduction processes. Prices for certain activated carbon and chemically activated carbon differsubstantially. On these bases, in our preliminary determination, we defined the domestic like product ascertain activated carbon, coextensive with the scope of the investigation.
There is no new information on the record in the final phase of this investigation to warrant adeparture from the definition we adopted in the preliminary phase of this investigation. Accordingly, forthe reasons stated in our preliminary determination, we continue to find in the final phase of thisinvestigation a single like product corresponding to Commerce’s scope of investigation.
III. DOMESTIC INDUSTRY
The domestic industry is defined as the “producers as a [w]hole of a domestic like product, orthose producers whose collective output of a domestic like product constitutes a major proportion of thetotal domestic production of the product.”34 In defining the domestic industry, the Commission’s generalpractice has been to include in the industry all domestic production of the domestic like product, whethertoll-produced, captively consumed, or sold in the domestic merchant market.35 Based on our finding thatthe domestic like product is certain activated carbon, we find that the domestic industry consists of allknown domestic producers of certain activated carbon. The five firms that comprise the domesticindustry are Calgon; Norit; California Carbon; Acticarb Tailored Products, LLC; and Cal PacificCarbon.36 Calgon and Norit reportedly account for *** domestic production of certain activated carbon.
A. Related Parties
We must determine whether any producer of the domestic like product should be excluded fromthe domestic industry pursuant to 19 U.S.C. § 1677(4)(B). Subsection 1677(4)(B) allows theCommission, if appropriate circumstances exist, to exclude from the domestic industry producers that arerelated to an exporter or importer of subject merchandise or which are themselves importers.37 Exclusionof such a producer is within the Commission’s discretion based upon the facts presented in eachinvestigation.

38 CR/PR at Table IV-1. ***. CR/PR at Table IV-1. 39 CR/PR at Table III-I. 40 CR/PR at III-2. 41 CR/PR at Table IV-I. 42 Hearing Tr. at 22 (O’Brien). 43 CR at III-3, PR at III-2. 44 CR/PR at Table VI-2. 45 Consistent with her practice in past investigations and reviews, Vice Chairman Aranoff does not rely onindividual-company income margins in assessing whether a related party has benefitted from importation of subjectmerchandise. Rather, she determines whether to exclude a related party based principally on its ratio of subjectimports to domestic shipments and whether its primary interests lie in domestic production or importation. 46 CR/PR at III-3.
11
In the preliminary phase of this investigation, the Commission addressed whether appropriatecircumstances existed to exclude domestic producers Calgon, Norit, and California Carbon. Although theCommission found that the three were related parties ***, the Commission determined not to exclude anydomestic producer from the domestic industry.
In the final phase of this investigation, Petitioners continue to argue that appropriatecircumstances do not exist to exclude any domestic producer from the domestic industry. Petitioners,which in the aggregate, account for over *** percent of domestic production of activated carbon, maintainthat their primary interests lie in domestic production rather than importation of subject merchandise, andthat their imports are insubstantial in comparison to their U.S. production. Respondents presented noarguments regarding related parties in the final phase of this investigation.
Calgon, Norit, *** reported that they imported certain activated carbon over the period ofinvestigation.38 Moreover, Calgon *** affiliated with Chinese producers of certain activated carbon. These *** domestic producers accounted for 100 percent of the reported domestic production of certainactivated carbon in 2006.39
Calgon is a related party due to its imported subject merchandise. Calgon accounted for ***percent of reported domestic production of certain activated carbon in 2006.40 It is a Petitioner and the*** domestic producer of certain activated carbon. Calgon is also affiliated with ***.41 Calgon statedthat it began importing subject merchandise from China after customers urged it to do so in the face oflow prices from China.42 Its ratio of subject imports to domestic production was *** percent in 2006.43 Calgon’s operating *** as a ratio of net sales ***.44
Based on the data, Calgon’s interests appear to lie more in domestic production than inimportation. Calgon’s financial performance was *** during most of the POI; however, it had a morepronounced *** in its financial performance during the period of investigation. Therefore, we do not findthat Calgon’s domestic production operations derived such significant financial benefit from subjectimports as to warrant excluding it from the domestic industry.45 Moreover, no party has argued thatCalgon should be excluded from the domestic industry. On these grounds, we do not find thatappropriate circumstances exist to exclude Calgon from the domestic industry.
Norit is a related party due to its imported subject merchandise. Norit accounted for *** percentof reported domestic production of certain activated carbon in 2006.46 It is a Petitioner and the ***domestic producer of certain activated carbon. The ratio of its subject imports to its production never

47 CR at III-4, PR at III-3. 48 CR/PR at Table VI-2. 49 Norit states that it did not benefit from its imports of subject merchandise, which were ***; rather, Noritclaims to have benefitted from the filing of the antidumping case in 2006. Petitioners’ Prehearing Brief at 21-22. 50 CR at III-4, PR at III-3. California Carbon produced *** pounds of CAC in 2006. 51 CR at III-4 n. 22, PR at III-3, n. 22. *** percent of California Carbon’s operations were used for ***. CR atIII-4, PR at III-3. 52 We note that no party has argued that California Carbon should be excluded from the domestic industry. 53 Negligibility, pursuant to 19 U.S.C. § 1677(24), is not an issue in this investigation. The petition was filed onMarch 8, 2006. Based on official Commerce statistics, subject imports from China accounted for approximately58.7 percent of total imports of certain activated carbon between March 2005 and February 2006, the most recent 12-month period for which data were available that preceded the filing of the petition. CR/PR at Table IV-4. 54 In the final phase of this investigation, Respondents presented no arguments addressing whether the domesticindustry is being materially injured “by reason of” the imports under investigation. 55 19 U.S.C. § 1673d(b). 56 19 U.S.C. § 1677(7)(B)( i). The Commission “may consider such other economic factors as are relevant to thedetermination” but shall “identify each [such] factor . . . [a]nd explain in full its relevance to the determination.” 19 U.S.C. § 1677(7)(B). See also Angus Chemical Co. v. United States, 140 F.3d 1478 (Fed. Cir. 1998).
12
rose above *** percent during the period of investigation, and was *** percent in 2006.47 Norit’soperating ***.48
Based on the data, Norit’s interests appear to lie in domestic production. Its domestic productionoperations do not appear to have benefitted financially from the subject imports, as it imported *** whileexperiencing ***.49 Moreover, no party has argued that Norit should be excluded from the domesticindustry. We do not find that appropriate circumstances exist to exclude Norit from the domesticindustry.
California Carbon accounted for only *** percent of domestic production of certain activatedcarbon in 2006.50 California Carbon ***. Additionally, it is ***. ***.51
We determine to exclude California Carbon from the domestic industry due to its ***. Weconclude that California Carbon’s principal interest lies in ***. However, because ***, our decision toexclude California Carbon from the domestic industry does not materially affect the data set that weanalyzed in reaching our determination.52
In sum, we do not find that appropriate circumstances exist to exclude Calgon or Norit from thedomestic industry. We exclude California Carbon from the domestic industry. Accordingly, we concludethat the domestic industry consists of all known producers of certain activated carbon, except CaliforniaCarbon.53
IV. MATERIAL INJURY BY REASON OF LESS THAN FAIR VALUE IMPORTS FROMCHINA54
In the final phase of antidumping duty investigations, the Commission determines whether anindustry in the United States is materially injured by reason of the imports under investigation.55 Inmaking this determination, the Commission must consider the volume of imports, their effect on pricesfor the domestic like product, and their impact on domestic producers of the domestic like product, butonly in the context of U.S. production operations.56 The statute defines “material injury” as “harm which

57 19 U.S.C. § 1677(7)(A). 58 19 U.S.C. § 1677(7)(C)(iii). 59 Id. 60 CR/PR at Table C-1. 61 CR/PR at Table C-1. Because official Commerce import statistics include chemically activated carbon, whichis outside the scope of this investigation, staff netted out the chemically activated carbon using proportions gatheredfrom questionnaire data to derive total apparent consumption of certain activated carbon. 62 CR at II-7-II-8, PR at II-4-II-5. 63 While Commissioner Okun concurs that demand for certain activated carbon increased over the period ofinvestigation, she notes that this demand may have been driven in part by the availability of low priced virgin certainactivated carbon. This may have resulted in end users deciding to purchase increased quantities of virgin productinstead of reactivating used product. CR at E-16, PR at E-7. The price increases achieved in 2006 also may explainthe *** decline in apparent U.S. consumption for certain activated carbon as reactivation of used carbon is a viablealternative for many customers. CR at II-7, PR at II-4. See also Petitioners’ Posthearing Brief at Exh. 7 (page 1)(noting that virgin carbon price increases make reactivated carbon an economical alternative). 64 See Petitioners’ Prehearing Brief at 28. In general, Petitioners state that new mercury emissions standardscould have a significant effect on the demand for certain activated carbon, but posit that it is unlikely that this effectwill be felt in the foreseeable future as the first stage of the implementation of the new standard will not occur until2010 with the final implementation not occurring until 2018. CR at II-8, PR at II-3; Hearing Tr. at 143 (Thompson).
13
is not inconsequential, immaterial, or unimportant.”57 In assessing whether the domestic industry ismaterially injured by reason of subject imports, we consider all relevant economic factors that bear on thestate of the industry in the United States.58 No single factor is dispositive, and all relevant factors areconsidered “within the context of the business cycle and conditions of competition that are distinctive tothe affected industry.”59
A. Conditions of Competition and the Business Cycle
The following conditions of competition are pertinent to our analysis of the impact of certainactivated carbon imports from China on the domestic industry.
1. Demand Conditions
Apparent U.S. consumption of certain activated carbon increased by *** percent by quantity overthe period of investigation.60 Apparent U.S. consumption of certain activated carbon increased from ***in 2003, to *** in 2004, and to *** in 2005, before declining *** in 2006.61 Market participants thatresponded to the Commission’s questionnaires generally agreed that demand for certain activated carbonrose over the period of investigation.62 63 Petitioners state that demand for certain activated carbon isexpected to grow moderately over the next several years due to new regulations governing clean air andwater, the increased popularity of bottled waters and other beverages, and new mercury emissionsstandards for coal utilities.64
2. Supply Conditions
The Commission received questionnaire responses from three domestic producers of certainactivated carbon, two of which are Petitioners, Calgon and Norit. Petitioners account for approximately

65 CR at III-1, PR at III-1. The petition identified five firms that produced activated carbon during 2003-2006. In addition to Petitioners, California Carbon, ***, produced *** pounds of certain activated carbon in 2006,accounting for *** percent of domestic production. CR at III-4, PR at III-3. The petition also lists Acticarb TailoredProducts, LLC, which stopped producing certain activated carbon in October 2005 and is not currently in operation,and Cal Pacific Carbon, ***. 66 CR/PR at Tables III-2-III-3. 67 CR/PR at Table II-1. 68 CR/PR at Table II-1. 69 CR/PR at Table IV-6. 70 CR/PR at Table IV-6. 71 CR/PR at Table IV-6. 72 CR at IV-4, n. 6, PR at IV-2, n.6. 73 CR at I-6, IV-1, PR at I-5, IV-1. 74 CR at IV-1, n.4, PR at IV-1, n.4. *** percent of nonsubject imports were coal- and peat-based and wereproduced by domestic producer *** operations in Europe. CR/PR at Table IV-1, Hearing Tr. at 118 (Wruble). 75 Calgon’s U.S. shipments of certain activated carbon in 2006 were distributed as follows: ***. CR at III-2,n.9, PR at III-2, n.9. Norit’s U.S. shipments of certain activated carbon in 2006 were distributed as follows: ***. CR at III-3, n.18, PR at III-3, n.18. 76 Shipments of subject certain activated carbon from China in 2006 were distributed as follows: 58.6 percentgranular, 23.5 percent powdered, and 17.9 percent pelletized. CR at IV-1, PR at IV-1. Shipments of nonsubjectcertain activated carbon in 2006 were distributed as follows: 89.5 percent granular, 9.6 percent powdered, and 0.9percent pelletized. CR at IV-2, PR at IV-1.
14
*** percent of reported U.S. production of certain activated carbon.65 Calgon is the *** producer ofcertain activated carbon, and Norit is the ***, accounting for *** and *** percent of reported domesticproduction in 2006, respectively.66
Approximately *** percent of U.S. producers’ U.S. shipments of certain activated carbon went toend users in each year of the period of investigation, with the rest going to distributors.67 A higher shareof importers’ U.S. shipments of subject certain activated carbon went to distributors, with shipments toend users accounting for between 66 percent and 74 percent of U.S. imports from China during the periodof investigation.68
Throughout the period of investigation, the principal suppliers of activated carbon to the U.S.market were the domestic producers.69 The next largest suppliers were importers of subjectmerchandise.70 The remaining portion of the market was supplied by imports of certain activated carbonfrom nonsubject countries.71 Based on official Commerce data, Sri Lanka, the Philippines, Indonesia, andThailand were the largest sources for non-subject imports of activated carbon over the period examined,accounting for nearly *** percent of U.S. certain activated carbon imports in 2006.72
During the period of investigation, all of the certain activated carbon produced domestically, andvirtually all of the certain activated carbon imported from China, were coal-based.73 Almost all of thecertain activated carbon imports from nonsubject countries, *** percent in 2006, were coconut-based.74
Domestic producer *** produces mainly *** certain activated carbon, *** domestic producer ***produces mainly *** certain activated carbon.75 Shipments of subject imports and nonsubject imports aremainly *** certain activated carbon.76
As a share of total U.S. consumption, domestically produced certain activated carbon fell from*** percent in 2003, to *** percent in 2004, and to *** percent in 2005, before increasing to *** percent

77 CR/PR at Table C-1. 78 CR/PR at Table C-1. In 2006, domestic producer Calgon was *** importer of subject merchandise,accounting for *** percent of subject imports. CR/PR at Table IV-1. 79 CR/PR at Table C-1. In 2006, domestic producer Calgon was *** importer of nonsubject merchandise,accounting for *** percent of nonsubject imports. CR/PR at Table IV-1. *** of Calgon’s imports from nonsubjectsources were coconut-based. CR at IV-1, PR at IV-1. 80 CR/PR at Table C-1. 81 CR/PR at Table III-2. 82 Petitioners’ Prehearing Brief at 30; Hearing Tr. at 30 (Hudgens), 71 (Thompson), 141 and 173 (O’Brien). Calgon states that a ***. CR at II-4, PR at II-4. 83 CR at V-1, PR at V-1. 84 CR at V-1, PR at V-1. 85 CR at V-1, PR at V-1. 86 CR at II-17-18, PR at II-10. 87 CR/PR at Table II-6. Eighteen of 26 responding purchasers, and 13 of 26 responding importers reported thatthey are “always” or “frequently” interchangeable. ***. *** U.S. Importers’ Questionnaire Response at 5.
15
in 2006.77 Subject imports from China, as a share of total U.S. consumption, rose from *** percent in2003 to *** percent in 2004, before declining *** to *** percent in 2005, and falling to *** percent in2006.78 As a share of total U.S. consumption, total nonsubject imports increased from *** percent in2003, to *** percent in 2004, and to *** percent in 2005, before declining to *** percent in 2006.79
Approximately *** of domestic producers’ production capacity was dedicated to export during theperiod.80
U.S. producers’ reported capacity utilization for certain activated carbon rose from *** percent in2003 to *** percent in 2006.81 Given the capital intensive nature of certain activated carbon productionand the highly integrated nature of the production process, Petitioners assert that activated carbon plantsare designed for, and depend on, running at full capacity, 24 hours a day, seven days a week, except forscheduled maintenance shutdowns.82
Another supply condition relevant to the domestic industry is the increasing cost of raw materialsand energy. Coal is the principal input in the production of domestic producers’ certain activated carbon,accounting for *** percent of Norit’s total costs and *** percent of Calgon’s total costs.83 The price ofcoal rose significantly over the period.84 Electricity and natural gas, also used in the production processof certain activated carbon, accounted for an increasing share of total cost of goods sold because of risingenergy costs over the period.85
3. Substitutability
The majority of responding market participants reported that domestically produced certainactivated carbon and subject imports are generally interchangeable.86 *** domestic producers originallyresponded that they are “always” interchangeable, while a large majority of responding purchasers, andhalf of the responding importers reported that they are “always” or “frequently” interchangeable.87 Petitioners assert that subject imports have been able to penetrate virtually all markets for coal-based

88 Hearing Tr. at 48 (O’Brien). The only application in which subject imports do not participate is in somespecialty respirator applications for the U.S. military. Id. 89 Moreover, it does not appear that subject imports have been unable to penetrate certain markets due tomunicipalities enacting their own “Buy American” regulations for certain activated carbon. When asked about thisissue, only three of 32 purchasers stated that some of their sales (representing five percent to 20 percent of their totalpurchases) were limited to domestically produced certain activated carbon by law, while four purchasers also statedthat a certain percentage of their purchases were limited to domestically produced certain activated carbon due to therequirements of their customers. CR at II-11, PR at II-7. 90 Petitioners’ Prehearing Brief at Exh. 1, p.1. (Response to Commissioner Okun’s Question), and Exh. 6. 91 CR/PR at Table II-6. Six out of 11 responding purchasers, and nine out of 17 responding importers reportedthat they are “sometimes” or “never” interchangeable. 92 CR at II-18, PR at II-10-II-11. In 2006, coconut-based certain activated carbon accounted for *** percent ofall reported nonsubject imports. CR at IV-1, n. 4, PR at IV-1, n. 4. 93 Petitioners’ Prehearing Brief at 31-33. 94 CR at I-9, PR at I-7. 95 CR at I-9, PR at I-7, Hearing Tr. at 53 (Rester) and 54-55 (O’Brien). Petitioners testified that coal-basedcarbons are not used in the gold mining and cigarette filter markets, and there is little competition with coal-basedcarbons in the upscale home filter market due to the premium nature and price of the coconut-based product. Hearing Tr. at 54-55 (O’Brien). These three markets account for approximately *** percent of ***. Petitioners’Posthearing Brief at Exh. 10. 96 CR at IV-2, PR at IV-1. Less than *** percent of Calgon’s sales of coconut-based certain activated carbonwas sold to customers that also purchased coal-based certain activated carbon. CR at IV-2, PR at IV-1.
16
steam-activated carbon.88 89 The majority of coal-based activated carbon, either domestically produced orimported from China, is used in the United States for water treatment (drinking and waste water), whilethe remaining coal-based certain activated carbon is used in a variety of applications in food, chemical,pharmaceutical, gas/air, and other industries.90
Reports were mixed as to the extent to which domestically produced certain activated carbon andnonsubject imports are interchangeable. *** domestic producers reported that they are “always”interchangeable, while a majority of responding purchasers and importers reported that they are only“sometimes” or “never” interchangeable.91 The most commonly stated reason for this lack ofinterchangeability was the unavailability in the United States of domestically produced coconut-basedcertain activated carbon.92
Notwithstanding *** that nonsubject imports were “always” interchangeable with domesticallyproduced certain activated carbon, Petitioners subsequently argued that nonsubject coconut-based certainactivated carbon and coal-based certain activated carbon are not direct substitutes for one another, and arenot “completely” interchangeable.93 The record indicates that they have different physical structures.94 Specifically, coconut-based activated carbon usually has greater hardness and smaller pore sizes, makingcoconut-based carbons better suited than coal-based carbons for certain applications like gold mining, cigarette filters, and specialty-oriented home water filter producers that price their filters as premiumproducts.95 Additionally, ***.96
B. Volume of Subject Imports
Section 771(7)(C)(i) of the Act provides that the “Commission shall consider whether the volumeof imports of the merchandise, or any increase in that volume, either in absolute terms or relative toproduction or consumption in the United States, is significant.”

97 19 U.S.C. § 1677(7)(I); SAA at 854. 98 19 U.S.C. § 1677(7)(I). 99 Vice Chairman Aranoff has considered “whether any change in the volume, price effects, or impact of[subject] imports . . . is related to the pendency of the investigation . . . .” 19 U.S.C. § 1677(7)(I). Like hercolleagues, she observes that various indicators of the domestic industry’s trade and financial performance generallydeclined from 2003 through 2005, but improved in 2006, concurrent with the filing of the petition. See CR and PRat Table C-1 (providing data as to the quantity, value, and average unit value of U.S. producers’ U.S. shipments, aswell as the industry’s market share, COGS to net sales ratio, and operating income (or loss) to net sales ratio). TheVice Chairman concludes that the changes are related to the pendency of the investigation. Not only do the changesobserved in 2006 represent a reversal of the trends exhibited over the previous three years, but there is recordevidence that the investigation was considered an important market factor in industry circles. The petition was thesubject of various articles in the trade press, including some expressly warning that higher prices would result. Petitioners’ Posthearing Brief at Exhibit 7. The record also includes ***. Petitioners’ Posthearing Brief at Exhibit 7. Furthermore, the quantity of subject merchandise from China ***. Petitioners’ Prehearing Brief at Exhibit 1. Basedon this record evidence, the Vice Chairman joins her colleagues in determining that changes in the volume, priceeffects, and impact of subject imports in 2006 are related to the pendency of the investigation.
The Vice Chairman declines, however, to “reduce the weight accorded to [the post-petition] data,” as shemight have in her discretion under the statute. 19 U.S.C. § 1677(7)(I). In her view, the *** improvement of thedomestic industry in 2006, after declines in previous years, confirms other record evidence of the causal linkbetween the volume and price effects of subject imports and the material injury experienced by the domesticindustry. Moreover, the 2006 data are indicative of the continuing injurious effect of subject imports, even if theeffect is somewhat less than in some prior years. While various industry performance indicators improved in 2006over 2005, several critical measures remained depressed in 2006 compared to 2003, including the domesticindustry’s market share, its COGS to net sales ratio, and its operating income (or loss) to net sales ratio. CR/PR atTable C-1. Consistent with those indicators, subject import volumes declined to *** in 2006 compared to 2005 and2004, subject imports generally continued to undersell the domestic product, prices for the domestic productgenerally remained flat, and confirmed instances of lost sales due to competition from subject imports continued***. CR/PR at Tables IV-5 and V-6 and Figures V-2 to V-4.
17
We find that subject import volume was significant during the period examined both in absoluteterms and relative to consumption and production in the United States, and that the increase in volumewas also significant.97
The Commission collected annual data for the period January 2003 to December 2006. Asindicated above, the petition in this investigation was filed on March 8, 2006. The 2006 data indicate thatthe domestic industry’s condition improved *** as domestic prices increased almost immediately after thepetition was filed, while the volume of subject imports declined rapidly after preliminary duties wereannounced by Commerce in October 2006. We find that the improvements in the domestic industry in2006 were related to the pendency of this investigation. While the 2006 data are pertinent and continue toshow injury, we find that the trends from 2003 through 2005, prior to the pendency of this investigationand the imposition of preliminary duties by Commerce in 2006, more clearly reflect the impact ofunrestrained subject imports on the domestic industry. We therefore give less weight to the 2006 data forpurposes of our material injury analysis.98 99
In absolute terms, the volume of subject imports increased by *** percent from 2003 to 2005,from *** pounds in 2003 to *** pounds in both 2004 and 2005, before declining *** to *** pounds in

100 CR/PR at Table C-1. Official Commerce import statistics include chemically activated carbon, which isoutside the scope of this investigation. In order to derive imports of certain activated carbon, Commission staffrevised these figures downward using as a guide the proportions of certain activated carbon and chemically activatedcarbon reported in importer questionnaires. See, e.g., CR/PR at Table C-1. 101 CR/PR at Table IV-7. 102 CR/PR at Table IV-10. 103 CR/PR at Table IV-10. 104 CR/PR at Table C-1. 105 CR/PR at Table IV-10. 106 CR/PR at Table C-1. 107 CR/PR at Table C-1. Nonsubject imports’ share of the quantity of total apparent consumption was ***percent in 2003.
18
2006.100 As a ratio to U.S. production, subject imports increased from *** percent in 2003 to *** percentin 2005, before declining to *** percent in 2006.101
The share of the quantity of U.S. apparent consumption held by subject imports increased by ***percentage points from 2003 to 2005, rising from *** percent in 2003 to *** percent in 2004, beforedecreasing *** percent in 2005, and falling to *** percent in 2006.102 As the market share held bysubject imports rose from the start of the period of investigation, the share held by the domestic industryfell. While total apparent U.S. consumption increased by *** percent from 2003 to 2005, the share of thequantity of apparent U.S. consumption represented by U.S. producers’ U.S. shipments declined from ***percent in 2003 to *** percent in 2004, and then to *** percent in 2005, an overall decrease of ***percentage points from 2003 to 2005.103 The share of the quantity of apparent U.S. consumptionrepresented by U.S. producers’ U.S. shipments rose to *** percent in 2006.104
The volume of nonsubject imports and their U.S. market share also increased over the periodexamined.105 The volume of nonsubject imports of certain activated carbon measured by quantityincreased from *** pounds in 2003 to *** pounds in 2004 and further to *** pounds in 2005, beforefalling to *** pounds in 2006.106 Nonsubject imports’ share of total apparent consumption increased from*** percent in 2003, to *** percent in 2004, and rose to *** percent in 2005, an overall increase of ***percentage points from 2003 to 2005, before declining to *** percent in 2006.107 While nonsubject imports increased absolutely and as a share of the quantity of apparent U.S.consumption, these increases do not diminish the significance of the increase of subject imports bothabsolutely and relative to consumption. In absolute terms, the volume of subject imports was at least 150percent of the volume of nonsubject imports over the entire period. Moreover, as explained above, thereis limited substitutability of nonsubject coconut-based imports with the coal-based domestic productionand subject imports. Thus, while the increases in subject import volumes and market share cameprimarily at the expense of the domestic industry, increases in the nonsubject imports reflect increaseddemand for the coconut-based product for its specific end uses. Accordingly, we find that the volume,and the increase in volume, of subject imports are significant both in absolute terms and relative toconsumption and production in the United States.
C. Price Effects of the Subject Imports
Section 771(C)(ii) of the Act provides that, in evaluating the price effects of subject imports, the Commission shall consider whether –

108 19 U.S.C. § 1677(7)(C)(ii). 109 CR/PR at Table II-6. 110 CR at II-10, PR at II-6. Despite the importance of price, the record does indicate that non-price factors canaffect purchasing decisions. Other factors listed by the majority of purchasers as very important in their purchasingdecisions include product availability, delivery terms and times, product consistency, quality, and reliability ofsupply. CR/PR at Table II-3. 111 CR/PR at Table II-2. Eight purchasers reported that price was the third most important factor in purchasingdecisions. Twenty out of 32 purchasers reported that quality/meets specifications was the most important factor. 112 CR/PR at Table II-3. 113 CR/PR at Table II-4 (18 of 21 purchasers). 114 CR at II-15, PR at II-11. Seventeen of 30 responding purchasers reported that they “always” or “usually”purchase the lowest-priced product. 115 CR at II-15, PR at II-11. 116 CR at II-15, PR at II-11. 117 The Commission collected data on the following types of certain activated carbon: (1) Granular activatedcarbon that is steam activated from coal (bituminous or lignite), unwashed, no more than 15 percent greater than 8mesh and no more than 4 percent under 30 mesh, iodine no. 900 mg/g min, moisture 2% max; (2) Granular activatedcarbon that is steam activated from coal (bituminous or lignite), unwashed, no more than 5 percent greater than 12mesh and no more than 4 percent under 40 mesh, iodine no. 1000 mg/g min, moisture 2% max; and (3) Powderactivated carbon that is steam activated from coal (bituminous or lignite), unwashed, particle size 90% min, 325mesh, iodine no. 700 mg/g min, moisture 5% max. CR at V-5, PR at V-3.
19
(I) there has been significant price underselling by the imported merchandise ascompared with the price of domestic like products of the United States, and(II) the effect of imports of such merchandise otherwise depresses prices to asignificant degree or prevents price increases, which otherwise would haveoccurred, to a significant degree.108
The record indicates that subject imports of certain activated carbon from China were generallysubstitutable for the domestic like product.109 It is generally agreed that as long as certain activatedcarbon meets the specifications required for an end use in question, price is the largest single factoraffecting purchasing decisions.110 Price was identified by numerous purchasers as either the mostimportant or second most important factor affecting purchasing decisions.111 A large majority ofresponding purchasers also listed price as “very important” in their purchasing decisions.112 By and large,purchasers found product from China and the United States to be fairly comparable, except in price,where almost all purchasers reported that the domestic product was inferior – higher in price – to importsfrom China.113
A majority of responding purchasers reported that they “always” or “usually” purchase thelowest-priced product.114 Twelve of fourteen responding producers indicated that they had increasedshipments of certain activated carbon from China over the last four years, while six of these purchasersindicated that purchases of domestically produced certain activated carbon have decreased during thissame time period.115 Price was the most commonly given reason for these trends.116
U.S. producers and importers provided quarterly pricing data for three types of certain activatedcarbon.117 Three U.S. producers and 21 importers provided usable pricing data, although not all firms

118 CR at V-6, PR at V-4. Certain activated carbon is sold on both a spot and a contract basis. CR at V-4, PR atV-3. 119 CR at V-6, PR at V-4. 120 CR/PR at Tables V-1, V-2, V-3. 121 CR/PR at Tables V-1, V-2, V-3. 122 CR/PR at Tables V-1, V-2, V-3. 123 Commissioner Lane disagrees that there is no clear trend in price movement and finds that there is anindication of meaningful price depression particularly in the pricing data for 2003 through 2005, before the pendencyof this investigation. Although quarterly pricing data shows variability both upward and downward from quarter toquarter, prices still trended downward and weighted average annual prices displayed a reasonably steady downwardtrend. Prices of product 2 ***. Product 1 is the ***. Even though there is both upward and downward pricemovement on a quarterly basis, Commissioner Lane believes that the data show a downward trend in prices which isreflective of price depression. 124 CR/PR at Table VI-1. 125 We note that the price of subject imports rose significantly during 2006, particularly in the last two quarters. The Chinese price for Product 1 was $*** per pound in the last quarter of 2006 compared to $*** per pound in thelast quarter of 2005; the Chinese price for Product 2 was $*** per pound in the last quarter of 2006 compared to$*** per pound in the last quarter of 2005; and the Chinese price for Product 3 was $*** per pound in the lastquarter of 2006 compared to $*** per pound in the last quarter of 2005. CR/PR at Tables V-1, V-2, V-3. Asdiscussed in volume, we give less weight to the 2006 data for purposes of our material injury analysis as we find thatthe improvement evident in the pricing data for 2006 are related to the pendency of the investigation.
20
reported pricing for all three products.118 By quantity, pricing data reported by responding firmsaccounted for approximately *** percent of U.S. commercial shipments of U.S.-produced certainactivated carbon and approximately 41.8 percent of U.S. commercial shipments of certain activatedcarbon produced in China.119
The quarterly price comparison data for Products 1 through 3 showed substantial and consistentunderselling by subject imports throughout the period. From 2003-2005, subject imports undersold thedomestic like product in 34 of the 36 quarters.120 In 2006, during the pendency of this investigation,subject imports undersold the domestic like product in 11 of the 12 quarters, albeit at smaller margins inthe last two quarters after the filing of the petition. For all three products, the margins of undersellingwere almost all in double digits, and ranged as high as 58.3 percent.121 Based on the foregoing, we findthat there has been significant price underselling of the domestic like product by subject imports.
We have also considered movements in certain activated carbon domestic prices over the periodof investigation. The Commission’s pricing data for Products 1 and 3 show fluctuations within a band,while pricing data for Product 2 show a decrease in domestic prices.122 We find pricing movements havevaried with no clear trend. Therefore, we do not find evidence that subject imports are depressingdomestic prices to a significant degree.123
We do find, however, that subject imports have prevented domestic price increases that otherwisewould have occurred to a significant degree. The domestic industry’s cost of goods sold (“COGS”) as ashare of net sales increased steadily throughout the period of investigation from *** percent in 2003 to*** percent in 2005, before falling somewhat to *** percent in 2006.124 We would have expecteddomestic producers to raise prices as costs increased in a market with rising demand over the period ofinvestigation. However, these data indicate that as the domestic industry’s costs increased, andsignificant volumes of lower priced subject imports entered the U.S. market, the domestic producers wereunable to raise their prices to cover increasing costs. We therefore find evidence of price suppression inthe form of a cost-price squeeze.125

126 CR at V-12, PR at V-9. 127 CR at V-13, PR at V-9. Despite numerous confirmed lost sales in 2006, Petitioners provided information on***. Petitioners’ Posthearing Brief at Exh. 1, pp. 7-8. Petitioners note that in each case Chinese competitors did notparticipate in the bidding process, and that ***. 128 CR at V-13, PR at V-9. 129 In its final affirmative determination for subject certain activated carbon from China, Commerce calculated aweighted-average dumping margin of 62.08 percent for Jacobi Carbons AB, 73.60 percent for 20 specific exporters,78.89 percent for Calgon Carbon Tianjin Co., Ltd., and a China-wide rate of 228.11 percent applicable to all otherexporters. Notice of Final Determination of Sales at Less Than Fair Value, Certain Activated Carbon from China,72 Fed. Reg. 9508 (March 2, 2007). 130 19 U.S.C. § 1677(7)(C)(iii); see also SAA at 851 and 885 (“In material injury determinations, the Commissionconsiders, in addition to imports, other factors that may be contributing to overall injury. While these factors, insome cases, may account for the injury to the domestic industry, they also may demonstrate that an industry is facingdifficulties from a variety of sources and is vulnerable to dumped or subsidized imports.”). SAA at 885. 131 19 U.S.C. § 1677(7)(C)(iii); see also SAA at 851, 885; Live Cattle from Canada and Mexico, Inv. Nos. 701-TA-386, 731-TA-812-813 (Preliminary), USITC Pub. 3155 at 25 n.148 (Feb. 1999).
21
Confirmed lost sales and lost revenues provide additional support for our finding that subjectimports have taken sales from U.S. producers and have suppressed prices to a significant degree. Petitioners provided *** lost sales allegations and *** lost revenue allegations from 2003-2005. Commission staff confirmed $*** in total lost sales and $*** in annual lost revenue.126 Petitionersalleged an additional *** lost sales that took place during 2006. Commission staff confirmed $*** ofthose lost sales.127 By and large, price was the reason given for choosing the Chinese product. Many ofthe lost sales were to municipal water treatment facilities which, in many cases, must accept the lowest-priced product that meets its required standards.128 These confirmed lost sales and revenues support afinding that competition from subject imports prevented domestic producers from raising prices to coverincreases in costs, even as demand increased over the period of investigation.
For the foregoing reasons, we find that subject imports have had a significant adverse price effecton the U.S. industry.
D. Impact of the Subject Imports129
Section 771(7)(C)(iii) provides that the Commission, in examining the impact of the subjectimports on the domestic industry, “shall evaluate all relevant economic factors which have a bearing onthe state of the industry.”130 These factors include output, sales, inventories, capacity utilization, marketshare, employment, wages, productivity, profits, cash flow, return on investment, ability to raise capital,research and development, and factors affecting domestic prices. No single factor is dispositive and allrelevant factors are considered “within the context of the business cycle and conditions of competitionthat are distinctive to the affected industry.”131
Consistent with our findings that the volume of subject imports and the increases in that volumewere significant, and that there was significant underselling and price suppression, we find that subjectimports are having a significant adverse impact on the domestic certain activated carbon industry.

132 As discussed above, under the post-petition effects provision we give less weight to the data for 2006. 133 ***, Calgon contends that it was forced to begin importing certain activated carbon from China because itscustomers urged it to do so in the face of extremely low prices from China. Hearing Tr. at 22 (O’Brien). Calgon hasstated that it was conscious not to undercut prices for its domestic production to the extent possible, and notes that itssubject imports ***. Petitioners’ Prehearing Brief at 56. Moreover, ***. Petitioners’ Prehearing Brief at Exh. 2. 134 Production increased from *** pounds in 2003 to *** pounds in 2004, fell to *** pounds in 2005, beforeincreasing to *** pounds in 2006. CR/PR at Table III-2. 135 U.S. producers’ U.S. shipments by quantity declined from *** pounds in 2003 to *** pounds in 2004, andthen to *** pounds in 2005, before increasing to *** pounds in 2006. U.S. producers’ U.S. shipments by valuedeclined from $*** in 2003 to $*** in 2004, and then to $*** in 2005, before increasing to $*** in 2006. CR/PR atTable III-2. 136 CR/PR at III-2. Due to the capital-intensive nature of the production process, certain activated carbon plantsare designed to run continuously at full capacity, except for scheduled maintenance shutdowns. Petitioners’Prehearing Brief at 30; Hearing Tr. at 30 (Hudgens), and 173 (O’Brien). Despite increasing demand for certainactivated carbon throughout the period of investigation, low-priced competition from Chinese imports has forcedU.S. producers to reduce prices (or not raise them) to maintain volumes, rather than cut sales. Hearing Tr. at 30(Hudgens). By 2005, contract prices could not ***. In 2006, due to the pendency of this investigation, the domesticindustry was ***. Compare Tables V-1-V-3 with Table VI-1. 137 The average number of production workers decreased irregularly from *** in 2003 to *** in 2005, beforeincreasing *** to *** in 2006. Hours worked decreased irregularly from *** in 2003 to *** in 2005, and continuedto fall to *** in 2006. CR/PR at Table III-2. 138 CR/PR at Table III-2. 139 CR/PR at Table C-1. *** decreased from $*** in 2003 to $*** in 2004, then fell to *** in 2005, beforeincreasing to $*** in 2006. CR/PR at Table VI-1. 140 CR/PR at Table VI-1.
22
Industry data show declining overall trends, which are most evident in the financial data, until 2006, afterthe petition in this investigation was filed.132 133
Regarding trade data, we note that performance indicators were mixed over the period examined. U.S. producers’ production of certain activated carbon decreased irregularly from 2003 to 2005, butincreased in 2006.134 Even though domestic consumption of certain activated carbon increased ***percent from 2003 to 2005, domestic producers’ total shipments of certain activated carbon declined by*** percent by quantity and *** percent by value, before both increased in 2006.135 Overall industrycapacity fell from 2003 to 2005, before increasing in 2006, while capacity utilization rose irregularly from*** percent in 2003 to *** percent in 2005, and then increased to *** percent in 2006.136 The averagenumber of production and related workers and hours worked for certain activated carbon experienced anoverall decline from 2003 to 2006.137 Wages paid increased *** from 2003 to 2005.138
Many of the domestic industry’s consolidated financial indicators declined overall from 2003-2005, before recovering only somewhat in 2006. *** fell steadily by *** percent from 2003 to 2005, andwas *** percent lower in 2006 than in 2003.139 The domestic industry’s *** fell by *** percentage pointsfrom 2003 to 2005, and was *** percentage points lower in 2006 than in 2003. Operating marginsdeclined from *** percent in 2003 to *** percent in 2004, and fell further to *** percent in 2005, beforeincreasing to *** percent in 2006.140

141 CR/PR at Table VI-1. Net sales measured by quantity decreased from *** pounds in 2003 to *** pounds in2004, and to *** pounds in 2005, before increasing to *** pounds in 2006. Net sales measured by value decreasedfrom $*** in 2003 to $*** in 2004, and to $*** in 2005, before increasing to $*** in 2006. CR/PR at Table VI-1. 142 As we have noted previously, the decline in the volume of subject imports coincided with the imposition ofpreliminary duties and the modest improvement in the financial condition of the domestic industry coincided withthe decline in subject imports. 143 CR/PR at Table C-1. 144 We note that capital expenditures for the domestic industry increased from $*** in 2003 to $*** in 2005,before increasing to $*** in 2006. CR/PR at Table VI-5. This level of capital expenditures is relatively lowconsidering the embedded investment in plant and equipment of this industry and its related depreciation expenses. With the exception of 2006, capital expenditures were ***. CR/PR at Tables VI-1 and VI-5. Moreover, a portion ofthe domestic industry’s capital expenditures was for the purposes of ***. CR at VI-9-VI-10, PR at VI-3. Researchand development expenses decreased from $*** in 2003 to $*** in 2005 and increased *** to $*** in 2006. CR/PRat Table VI-5. 145 Commissioner Lane has found that domestic prices also exhibited a small but measurable degree of pricedepression from 2003 through 2005, prior to the filing of the petition initiating this investigation.
23
Net sales measured by quantity and value decreased by *** percent and *** percent, respectively,from 2003 to 2005.141 From 2005 to 2006, net sales by quantity increased by *** percent, and increasedby value by *** percent. Despite domestic consumption declining *** from 2005 to 2006, the domesticindustry was able to increase both its prices and quantities of sales as the volume of low-riced subjectimports declined.142
As discussed previously, COGS as a ratio to net sales increased steadily from 2003 to 2005. COGS was *** percent of net sales in 2003, and increased steadily to *** percent of net sales in 2005,before declining to *** percent of sales in 2006.143 Declines in U.S. industry performance indicatorsoccurred as subject imports entered the U.S. market in increased and significant volumes, and gainedmarket share almost exclusively at the expense of the domestic industry.144 At the same time, subjectimports undersold the domestic like product, typically by double-digit margins, and suppressed domesticprices to a significant degree. In a period of rising raw material and energy costs, domestic producerswere not able to raise prices sufficiently to cover these costs.
We conclude that subject imports had an adverse impact on the condition of the domestic industryduring the period of investigation. We find that the absolute and relative volume, and the increase involume of subject imports, as well as the underselling by the subject imports, are significant. As subjectimports captured market share, they suppressed domestic prices to a significant degree, causing declinesin the domestic industry’s financial performance.145 From 2003-2005, ***, ***, and net sales measuredby both quantity and value, declined as the domestic industry lost market share, and it was not until 2006that any of these financial indicators began to improve. This modest improvement in 2006 occurred whenthe domestic industry was able to (1) raise prices after the filing of the petition in this investigation, and(2) gain market share because of the reduction of the volume of low-priced Chinese imports after theimposition of the preliminary duty deposits by Commerce.
We find that the record contains substantial evidence showing that subject imports had a causalconnection to the injury experienced by the domestic industry. While we have given reduced weight topost-petition data in 2006 for the purpose of evaluating levels and trends of unrestrained subject importsand their relationship to levels and trends of injury to the domestic industry, record evidence for theperiod of time after the petition was filed and after preliminary duties were imposed further supports thefinding that subject imports were a cause of material injury to the domestic industry. After the filing ofthe petition, prices in the domestic market increased. Moreover, after the preliminary affirmativedetermination was made by Commerce, the quantity of subject imports declined. The combination of

146 CR/PR at Table C-1. 147 CR/PR at Table C-1. 148 444 F.3d at 1369 (Fed. Cir. 2006). 149 Bratsk, 444 F.3d at 1375. 150 Bratsk, 444 F.3d at 1375. 151 For a full discussion of our views on the applicability of Bratsk, see our Views in the Remand Determinationfor Silicon Metal from Russia, Inv. No. 731-TA-991 (Final) (Second Remand), USITC Pub. 3910 (March 2007). For a full discussion of Chairman Pearson’s views on the applicability of Bratsk, see his Separate and AdditionalViews in Silicon Metal from Russia. For a full discussion of Commissioner Okun’s views of the applicability ofBratsk, see her Separate and Dissenting Views in Certain Lined Paper School Supplies from China, India, andIndonesia, Inv. Nos. 701-TA-442-443, 731-TA-1095-1097 (Final), USITC Pub. 3884 (Sept. 2006).
24
these two events brought about significant improvements for the domestic industry. Domestic producersnot only were able to increase prices but also were able to expand production and sales volume, and thefinancial position of the domestic industry improved.146
Nonsubject imports were in the U.S. market throughout the period of investigation. However,nonsubject import volume actually declined in 2006, even as subject imports declined in the U.S. marketdue to the pendency of this investigation.147 The simultaneous drop in the volume of both subject importsand nonsubject imports in 2006 is explained by the fact that subject imports and nonsubject importsprimarily are sold for different end uses. Likewise, the AUV and pricing data on the record show that theprices of the nonsubject imports typically are much higher, ***. Given that the primary cause of materialinjury to the domestic industry was the intense price suppression caused by low-priced subject imports,this suggests that nonsubject imports were not a factor affecting prices. Thus, removing subject importsfrom the U.S. market allowed the domestic industry to capture both higher prices and additional salesvolumes. This pattern further indicates that subject imports were a significant factor suppressing pricesover the period of investigation.
We find that an industry in the United States is materially injured by reason of subject imports ofcertain activated carbon from China that are found to be sold in the United States at less than fair value.
V. Application of the Bratsk Aluminum Smelter v. United States Replacement/Benefit Test
Having reached an affirmative determination by application of the statutorily-mandated factors,the Federal Circuit’s decision in Bratsk Aluminum Smelter v. United States requires that we turn to anadditional analysis which can, in some circumstances, negate an affirmative determination.148 TheFederal Circuit directed the Commission to undertake an “additional causation inquiry” whenever certaintriggering factors are met: “whenever the antidumping investigation is centered on a commodity product,and price competitive non-subject imports are a significant factor in the market.”149 The additionalinquiry required by the Bratsk panel, which we refer to as the Bratsk replacement/benefit test, is “whethernon-subject imports would have replaced the subject imports without any beneficial effect on domesticproducers.”150
We respectfully disagree with the Bratsk panel that the statute requires any analysis beyond thatalready included in our discussion of volume, price, and impact above.151 The statutory scheme contemplates that an industry may be facing difficulties from a variety of sources, including nonsubjectimports and other factors, but the existence of injury caused by other factors does not compel a negativedetermination if the subject imports themselves are making more than a minimal or tangential
152 See SAA at 851-52, 885. 153 H.R. Rep. No. 317, 96th Cong., 1st Sess. at 47 (“Any such requirement has the undesirable result of makingrelief more difficult to obtain for those industries facing difficulties from a variety of sources, precisely thoseindustries that are most vulnerable to subsidized or dumped imports.”). 154 Huaiyin Foreign Trade Corp. v. United States, 322 F.3d 1369, 1380 (Fed. Cir. 2003) 155 SAA at 883-85, 889-90. 156 Wooden Bedroom Furniture From China, Inv. No. 731-TA-1058 (Final), USITC Pub. 3742 (Dec. 2004) at 27,n. 222. 157 See Silicon Metal from Russia, Inv. No. 731-TA-991 (Second Remand), USITC Pub. 3910 (Mar. 2007), at 3-8 (articulating the standard). 158 Chairman Pearson and Commissioner Okun discern two possible interpretations of the Bratsk opinion, whichdiffer substantially. The so-called “replacement/benefit test” is noted above. The second one is that Bratsk is afurther restatement of the causation approach prescribed by Gerald Metals. Under this interpretation, the Bratskdecision stands to remind the Commission of its obligation under Gerald Metals that the Commission may not satisfythe “by reason of” causation requirement by showing that subject imports contributed only “minimally ortangentially to the material harm.” In other words, the Bratsk Court’s relatively short discussion of the underlyingdetermination may not have established a new and rigid replacement/benefit test. Rather, the Court may havediscussed the triggering factors as a reminder that the Commission, before it makes an affirmative determination,must satisfy itself that it has not attributed material injury to factors other than subject imports. See Separate andAdditional Views of Chairman Daniel R. Pearson and Commissioner Deanna Tanner Okun Concerning BratskAluminum v. United States in, Sodium Hexametaphosphate from China, Inv. No. 731-TA-1110 (Preliminary),USITC Pub. 3912 (April 2007). We have included this analysis in the Commission’s affirmative causation analysis.
25
contribution to material injury.152 The legislative history further clarifies that the dumped imports neednot be the “principal” cause of material injury and that the “by reason of” standard does not contemplatethat injury from dumped imports be weighed against injury from other factors, such as nonsubjectimports, which may be contributing to overall injury to an industry.153 Thus, once the Commissionestablishes the existence of a causal link between subject imports and material injury, the existence ofother concurrent causes is legally irrelevant to its determination.
Similarly, the statute does not permit the Commission to reach a negative determination based onthe likely ineffectiveness of an order. Indeed, the purpose of the statute is not to bar or eliminate subjectimports from the U.S. market or award subject import market share to U.S. producers, but is meantinstead to “level [] competitive conditions” by imposing a duty on subject imports and thus enabling thedomestic industry to compete against fairly traded imports.154 The statutory scheme in fact contemplatesthat subject imports may remain in the U.S. market after an order is imposed and even that the industryafterwards may continue to suffer material injury.155 As the Commission has previously explained,
[N]othing in the statute or case law requires (or allows) us to consider the likelyeffectiveness of a dumping order in making our injury determination. Thepossibility that non-subject imports will increase in the future after anantidumping order is imposed is ... not relevant to our analysis of whethersubject imports are currently materially injuring the industry.156
The Commission has a well established approach to addressing causation.157 However, we applythe Bratsk replacement/benefit test to our analysis because the Federal Circuit has directed us to do so,notwithstanding that, in our considered view, this test is not required by, or consistent with, the statute.158

159 Petitioners’ Prehearing Brief at 30-35. In its preliminary determination, the Commission invited the parties inany final phase determination to comment on the applicability of Bratsk to the facts of this investigation. 160 Petitioners’ Prehearing Brief at 35. 161 No producers/exporters from nonsubject countries responded to the Commission’s request for information.CR at VII-3, PR at VII-3. 162 The most significant source of nonsubject coconut-based certain activated carbon is Southeast Asia,specifically Sri Lanka, the Philippines, Indonesia, India and Thailand. *** percentage of nonsubject imports werecoal- and peat-based and were produced by domestic producer *** operations in Europe. CR/PR at Table IV-1,Hearing Tr. at 118 (Wruble). 163 It is improper to assume that because goods are interchangeable for defining the domestic like product, theyare “commodities” for purposes of assessing causation, which is the function of the Bratsk test. See Bic Corp v.United States, 964 F. Supp. 391, 397, 399 (Ct. Int’l Trade 1997) (“[L]ike product, cumulation and causation arefunctionally different inquiries because they serve different statutory purposes . . . . As a result, each inquiryrequires a different level of fungibility. Hence the record may contain substantial evidence that two products arefungible enough to support a finding in one context (e.g., one like product), but not in another (e.g., cumulation orcausation.”). 164 CR at I-9, PR at I-7. 165 CR at I-9 - I-10, PR at I-7, Petitioners’ Posthearing Brief at Exhs. 6 & 10. 166 Hearing Tr. at 55 (O’Brien). The process of recovering gold from mined ore involves the adsorption of goldon activated carbon. The extra hardness of coconut-based activated carbon helps to reduce the loss of gold that mayoccur when the activated carbon particles break into smaller pieces. CR at I-9-I-10, PR at I-7. In cigarette filters,
(continued...)
26
Only Petitioners have provided arguments regarding the applicability of the Bratskreplacement/benefit test to this investigation.159 As a threshold matter, Petitioners stated that the Bratskanalysis is not required under the statute. Nevertheless, Petitioners argue that, in this investigation,neither of the triggering factors are met. Even assuming that the triggering factors are met, Petitionersstate that nonsubject imports would not replace subject imports and that the domestic industry will benefitfrom the imposition of an antidumping duty order on imports from China.160
A. The First Triggering Factor – Commodity Product161
The Bratsk panel referred to a “commodity product” as “meaning that it is generallyinterchangeable regardless of its source.” The record in this investigation indicates that all types ofactivated carbon, as defined by the scope, are not “interchangeable regardless of . . . source.” Asdiscussed in Conditions of Competition, all domestic production of certain activated carbon and virtuallyall Chinese imports of certain activated carbon are coal-based. The vast majority, *** percent, ofnonsubject imports are of coconut-based certain activated carbon.162 Although it appears that coal-basedcertain activated carbon is generally interchangeable, and that coconut-based certain activated carbon isgenerally interchangeable, the record indicates that there is very little interchangeability between coal-based and coconut-based activated carbon.163
Information on the record indicates that coal-based and coconut-based activated carbons havedifferent physical structures.164 The smaller pore size, pore distribution, and the greater hardness ofcoconut-based certain activated carbon make it most useful in applications that require removing verysmall size impurities. As a result, coal-based and coconut-based activated carbon are generally directed todifferent uses. The bulk of coal-based activated carbon is used in the processing of drinking water,industrial wastewater and certain foods, as well as the filtration of air and gas, whereas coconut-basedactivated carbon is *** to cigarette filters, home water filters, and gold mining.165 166 There is little

166 (...continued)coconut-based activated carbon is better suited than coal-based carbon at adsorbing chemicals that affect the flavorof the cigarette. CR at I-10, PR at I-7. These two industries accounted for almost *** percent of *** sales ofcoconut-based activated carbon in 2006. Petitioners’ Prehearing Brief at Exh. 10. 167 CR at I-9, n. 30, PR at I-7, n. 30. Coconut-based carbons intrinsically have finer pore structures that lead tobetter trace removal capacities if one is targeting specific organic compounds. Also, coconut-based activated carbonwould typically have lower levels of leachables (water soluble ash) than coal-based activated carbon, which isdesirable to home water filter manufacturers. CR at I-9, n. 30, PR at I-. Home water filters accounted for ***percent of *** sales of coconut-based activated carbon in 2006. Petitioners’ Prehearing Brief at Exh. 10. 168 Hearing Tr. at 56 (O’Brien). 169 CR at IV-2, PR at IV-1. 170 CR/PR at Table C-1. 171 No importer with the exception of *** provided the Commission with usable pricing data on nonsubjectimports. Calgon accounted for more than *** of certain activated carbon nonsubject imports in 2006, ***, andprovided the Commission with information related to its nonsubject imports, including pricing data.
27
competition with coal-based carbons in the upscale home filter market due to the premium nature andprice of the coconut-based product.167 Coconut-based activated carbon is largely directed to theaforementioned markets where customers are willing to pay a price premium for this product, because inmany other applications coconut-based activated carbon performs worse than coal-based activatedcarbon.168
The limited interchangeability of coconut-based and coal-based activated carbons is furtherconfirmed by record evidence indicating a lack of customer overlap for the two products. ***.169 Thisshows that coconut- and coal-based activated carbons are being sold to different markets, demonstratinglimited substitutability between the two.
For the purpose of the first triggering factor for the Bratsk replacement/benefit test, we find thatcertain activated carbon is not a “commodity” product.
B. The Second Triggering Factor – Whether Price Competitive Nonsubject ImportsAre a Significant Factor in the Market
We find that the second triggering factor, price competitive nonsubject imports, is also notpresent, providing additional support for our view that the Bratsk replacement/benefit test is notapplicable to this investigation.
With respect to the issue of whether nonsubject imports were a significant factor in the market,we note that nonsubject imports were present in the market in each year of the period of investigation. Imports from nonsubject sources increased from *** percent of apparent U.S. consumption by quantity in2003, to *** percent in 2004, and then to *** percent in 2005, before declining to *** percent in 2006.170
As a share of total imports, nonsubject imports increased from *** percent in 2003 to *** percent in2004, and then to *** percent in 2005, before declining to *** percent in 2006. Based on the foregoing,we find that nonsubject imports were significant in the market for purposes of the Bratskreplacement/benefit test.
However, we find that nonsubject imports were not price-competitive in the market.171 Given therecord evidence that activated carbon is not a “commodity” product, and that coconut-based activatedcarbon is used primarily in specialty applications for which customers are willing to pay a price premium,coconut-based and coal-based activated carbon do not compete on the basis of price. Moreover, theaverage unit values (“AUVs”) of nonsubject imports were consistently higher than both the AUVs ofsubject imports and domestic producers’ U.S. shipments of certain activated carbon in every year of the

172 CR/PR at Table IV-2 and Table C-1. We are mindful that the use of AUVs for establishing price trends maypresent product mix issues in that values may reflect different merchandise rather than differences in price. SeeAllegheny Ludlum Corp. v. United States, 287 F.3d 1365, 1373-74 (Fed. Cir. 2002). In this investigation, the higherAUVs for coconut-based activated carbon supports our finding that coal-based and coconut-based activated carbonsare not commodities, and shows that customers are willing to pay a price premium for the coconut-based activatedcarbon because it is better suited than coal-based activated carbon for their required applications. The AUVcomparison is confirmed by ***, allowing us to give the AUV data additional weight in this investigation. 173 In determining whether nonsubject imports are price competitive in this investigation, Commissioner Pinkerthas primarily analyzed whether nonsubject imports are price competitive with the domestic like product, although hehas also taken into account relative pricing levels for nonsubject and subject imports. 174 CR at V-1, n. 1, PR at V-1, n. 1, Petitioners’ Posthearing Brief at Exh. 4. 175 CR/PR at V-1.
28
period of investigation.172 173 The AUVs of imports from nonsubject countries ranged from *** than theAUVs of subject imports. Additionally, these nonsubject AUVs were higher than the AUVs of domesticproducers’ U.S. shipments of certain activated carbon by *** over the period of investigation. Thedifferences in AUVs reflect the market reality that coconut-based certain activated carbon is pricedsignificantly higher in the United States than coal-based activated carbon.
Moreover, a comparison of Calgon’s prices for sales of its imported nonsubject coconut-basedcertain activated carbon to prices for domestic producers’ U.S. shipments and imported certain activatedcarbon from China confirms the differences shown by the AUVs. These data indicate that the sellingprices of Calgon’s coconut-based certain activated carbon from nonsubject countries were ***.174 Moreover, for Product 1, the price of Calgon’s coconut-based certain activated carbon from nonsubjectcountries ***. For product 3, the price of Calgon’s coconut-based certain activated carbon fromnonsubject countries ***. For product 2, the price of Calgon’s coconut-based certain activated carbonfrom nonsubject countries ***. Although Product 2 accounts for *** of Calgon’s sales of nonsubjectcertain activated carbon, Product 2 accounted for *** of sales of domestically produced certain activatedcarbon.175
Moreover, as discussed above, and consistent with our finding that certain activated carbon is nota “commodity” product, as the Bratsk panel defined that term, Calgon has provided evidence that there is*** between its customers that purchase its coal-based certain activated carbon and its customers thatpurchase its coconut-based certain activated carbon. This indicates that customers are purchasing eithercoconut-based or coal-based activated carbon for a specific application, for which one or the other isbetter suited based on their physical structures, and are not choosing between the two based on price. Accordingly, we do not find that the second triggering factor identified in Bratsk to be present.

176 Bratsk, 444 F.3d 1375. Nevertheless, even if both triggering factors were present, we would not find thatnonsubject imports “would have replaced subject imports without any beneficial effect on domestic producers.” Bratsk, 444 F.3d at 1375. Throughout the period, imports of certain activated carbon from China exceedednonsubject imports by a significant amount. To replace subject imports in the U.S. market, nonsubject importswould have needed to increase between 50 percent to 83 percent per year of the period of investigation. The limitedinformation on the record regarding capacity utilization rates of activated carbon producers in nonsubject countries,as well as the capital intensive nature of the industry, does not indicate that nonsubject imports have the additionalcapacity to replace subject imports. CR/PR at Table IV-2, CR at VII-3, n. 6, PR at VII-3, n. 6. Currently, China andthe United States supply nearly all of the imports of coal-based certain activated carbon world-wide, and the onlyother significant exporter of coal-based certain activated carbon, Australia, exported no activated carbon to theUnited States in 2006, and does not have the capacity to replace the portion of Chinese production currentlydedicated to the U.S. market. CR at VII-4, PR at VII-4.
As discussed previously, the Commission gave reduced weight to post-petition data in 2006 for the purposeof evaluating levels and trends of unrestrained subject imports and their relationship to levels and trends of injury tothe domestic industry. This does not mean that we find the 2006 data to be unreliable. In fact, the 2006 data supportour finding of a causal link between subject imports and injury to the domestic industry. After the filing of thepetition and imposition of preliminary duties, the quantity of subject imports fell, prices increased, and the financialposition of the domestic industry improved. Moreover, even after subject imports declined in the U.S. market in2006 due to the pendency of this case, nonsubject imports in the United States not only did not increase to replacethe subject imports, but declined as well. CR/PR at Table C-1. The simultaneous drop in the volume of both subjectimports and nonsubject imports in 2006 is not surprising, given that the they are sold primarily for different end uses.
Finally, the record demonstrates that even if some replacement of subject imports by nonsubject importscould occur, the domestic industry would still benefit from the order. The AUV and pricing data on the record showthat if nonsubject imports replaced the volume of Chinese imports, the prices of the nonsubject imports would likelybe much higher, *** based on data reported during the period of investigation. Given that the primary cause ofmaterial injury to the domestic industry was the intense price suppression caused by low-priced subject imports, therecord evidence shows that if all of the subject imports were replaced by nonsubject imports, the domestic industrywould benefit from ***. 177 Chairman Pearson and Commissioners Okun and Williamson do not join the previous footnote. They do notapply the replacement/benefit test of Bratsk given their conclusion that neither of the two triggering factors is met. 178 Vice Chairman Aranoff joins her colleagues’ analysis as to the replacement/benefit test, as expressed infootnote 176. She finds, in addition, that the partial recovery of the domestic industry in 2006, concurrent with thefiling of the petition is further evidence that nonsubject imports would not have replaced subject imports without anybeneficial effect on domestic producers. Her views as to reasons for that partial recovery are explained in footnote99 above.
29
Because we find that neither Bratsk triggering factor is present in this investigation, we thereforeare not required to address “whether non-subject imports would have replaced subject imports withoutany beneficial effect on domestic producers.” 176 177 178
CONCLUSION
For the reasons stated above, we determine that an industry in the United States is materiallyinjured by reason of subject imports of certain activated carbon from China that are found to be sold inthe United States at less than fair value.

1 For purposes of this investigation, the Department of Commerce has defined the subject merchandise asfollows:
“Certain activated carbon is a powdered, granular, or pelletized carbon product obtained by “activating”with heat and steam various materials containing carbon, including but not limited to coal (including bituminous,lignite, and anthracite), wood, coconut shells, olive stones, and peat. The thermal and steam treatments removeorganic materials and create an internal pore structure in the carbon material. The producer can also use carbondioxide gas (CO2) in place of steam in this process. The vast majority of the internal porosity developed during thehigh temperature steam (or CO2 gas) activated process is a direct result of oxidation of a portion of the solid carbonatoms in the raw material, converting them into a gaseous form of carbon.
The scope of this investigation covers all forms of activated carbon that are activated by steam or CO2,regardless of the raw material, grade, mixture, additives, further washing or post-activation chemical treatment(chemical or water washing, chemical impregnation or other treatment), or product form. Unless specificallyexcluded, the scope of this investigation covers all physical forms of certain activated carbon, including powderedactivated carbon (“PAC”), granular activated carbon (“GAC”), and pelletized activated carbon.
Excluded from the scope of the investigation are chemically-activated carbons. The carbon-based rawmaterial used in the chemical activation process is treated with a strong chemical agent, including but not limited tophosphoric acid, zinc chloride sulfuric acid or potassium hydroxide, that dehydrates molecules in the raw material,and results in the formation of water that is removed from the raw material by moderate heat treatment. Theactivated carbon created by chemical activation has internal porosity developed primarily due to the action of thechemical dehydration agent. Chemically activated carbons are typically used to activate raw materials with alignocellulosic component such as cellulose, including wood, sawdust, paper mill waste and peat.
To the extent that an imported activated carbon product is a blend of steam and chemically activatedcarbons, products containing 50 percent or more steam (or CO2 gas) activated carbons are within this scope, andthose containing more than 50 percent chemically activated carbons are outside this scope. This exclusion languageregarding blended material applies only to mixtures of steam and chemically activated carbons.
Also excluded from the scope are reactivated carbons. Reactivated carbons are previously used activatedcarbons that have had adsorbed materials removed from their pore structure after use through the application ofheat, steam and/or chemicals.
Also excluded from the scope is activated carbon cloth. Activated carbon cloth is a woven textile fabricmade of or containing activated carbon fibers. It is used in masks and filters and clothing of various types where awoven format is required.
Any activated carbon meeting the physical description of subject merchandise provided above that is notexpressly excluded from the scope is included within this scope. The products under investigation are currentlyclassifiable under the Harmonized Tariff Schedule of the United States (“HTS”) subheading 3802.10.00. AlthoughHTS subheadings are provided for convenience and customs purposes, the written description of the scope of thisinvestigation is dispositive.” 72 F.R. 9508, March 2, 2007. 2 Federal Register notices cited in the tabulation are presented in app. A.
I-1
PART I: INTRODUCTION
BACKGROUND
This investigation results from a petition filed by Calgon Carbon Corp. (“Calgon”), Pittsburgh,PA, and Norit Americas, Inc. (“Norit”), Marshall, TX, on March 8, 2006, alleging that an industry in theUnited States is materially injured and threatened with material injury by reason of less-than-fair-value(“LTFV”) imports of certain activated carbon (“CAC”)1 from China. Information relating to thebackground of the investigation is presented in the tabulation on the following page.2

3 The list of witnesses appearing at the hearing is presented in app. B. 4 The term activated carbon refers to both CAC (which can also be referred to as steam-activated carbon) andchemically activated carbon (“CHAC”). 5 71 FR 5688, February 2, 2006. 6 71 FR 9155, February 22, 2006. 7 ***. 8 In the preliminary phase investigation, the Commission collected data concerning CHAC and consideredrespondent parties’ arguments that CHAC should be included in the “domestic like product.” Ultimately, after dueconsideration, the Commission determined that CHAC was not included in the “domestic like product.” CertainActivated Carbon from China, Investigation No. 731-TA-1103 (Preliminary), USITC Publication 3852, May 2006, pp. 7-11. 9 In addition to collecting CAC data in the final phase of this investigation, the Commission collected dataconcerning reactivated carbon (“RAC”). Comments from producer, importer, and purchaser questionnairerespondents in this investigation concerning the differences and similarities between CAC and RAC are presented inapp. D. Trade and financial data concerning RAC are presented in app. E. Only one importer reported imports ofRAC during 2003-06. Details regarding these imports of RAC are presented in Part IV of this report, U.S. Imports,Apparent Consumption, and Market Shares.
I-2
Date Action
March 8, 2006 . . . . . Petition filed with Commerce and the Commission; institution of Commissioninvestigation
April 4, 2006 . . . . . . Commerce’s notice of initiationApril 24, 2006 . . . . . Commission’s preliminary determinationOctober 11, 2006 . . . Commerce’s preliminary determinationNovember 16, 2006 . Commission’s scheduling of final phase investigation (71 FR 66793)February 23, 2007 . . Commerce’s final determination (72 FR 9508; March 2, 2007)February 27, 2007 . . Commission’s hearing3
March 29, 2007 . . . . Commission’s voteApril 16, 2007 . . . . . Commission’s determination transmitted to Commerce
PREVIOUS INVESTIGATION
On January 26, 2006, petitioners in the instant investigation (Calgon and Norit) filed a petition alleging that an industry in the United States was materially injured and threatened with material injuryby reason of LTFV imports of activated carbon4 from China. As a result of that filing, the Commissioninstituted investigation No. 731-TA-1102 (Preliminary): Activated Carbon from China.5 Subsequently,on February 15, 2006, petitioners withdrew their petition at Commerce and the Commission. Commercehad not initiated its investigation by that date and the Commission discontinued its investigation effectivethat date.6
SUMMARY DATA
A summary of data collected in the investigation concerning CAC is presented in appendix C,table C-1. For table C-1, except as noted, CAC U.S. industry data are based on questionnaire responsesof three firms that accounted for virtually all of U.S. production during 2003-06.7 8 9 U.S. imports arebased on official import statistics.

I-3
NATURE AND EXTENT OF SALES AT LTFV
Commerce’s final LTFV margins are presented in table I-1. Final margins for individualexporter/supplier(s) ranged from 62.08 percent to 78.89 percent, with the PRC-wide rate being 228.11percent.
Table I-1CAC: Commerce’s final LTFV margins
Exporter Supplier(s)Weighted-average
margin(percent)
Beijing Pacific Activated Carbon Products Co., Ltd. Alashan Yongtai Activated Carbon Co., Ltd.Changji Hongke Activated Carbon Co., Ltd.Datong Forward Activated Carbon Co., Ltd.Datong Locomotive Coal & Chemicals Co., Ltd.Datong Yunguang Chemicals PlantNingxia Guanghua Cherishment Activated Carbon Co., Ltd.Ningxia Luyuangheng Activated Carbon Co., Ltd.
73.60
Calgon Carbon Tianjin Co., Ltd. Calgon Carbon Tianjin Co., Ltd.Datong Carbon Corp.Datong Changtai Activated Carbon Co., Ltd.Datong Forward Activated Carbon Co., Ltd.Datong Fuping Activated Carbon Co., Ltd.Datong Hongtai Activated Carbon Co., Ltd.Datong Huanqing Activated Carbon Co., Ltd.Datong Huibao Activated Carbon Co., Ltd.Datong Kangda Activated Carbon FactoryDatong Runmei Activated Carbon FactoryDushanzi Chemical FactoryFangyuan Carbonization Co., Ltd.Hongke Activated Carbon Co., Ltd.Huairen Jinbei Chemical Co., Ltd.Jiaocheng Xinxin Purification Material Co., Ltd.Ningxia Guanghua Cherishment Activated Carbon Co., Ltd.Ningxia Guanghua A/C Co., Ltd.Ningxia Honghua Carbon Industrial Corp.Ningxia Luyuangheng Activated Carbon Co., Ltd.Ningxia Pingluo Yaofu Activated Carbon FactoryNingxia Tianfu Activated Carbon Co., Ltd.Ningxia Yinchuan Lanqiya Activated Carbon Co., Ltd.Nuclear Ningxia Activated Carbon Co., Ltd.Pingluo Xuanzhong Activated Carbon Co., Ltd.Shanxi Xuanzhong Chemical Industry Co., Ltd.Xingtai Coal Chemical Co., Ltd.Yuyang Activated Carbon Co., Ltd.
78.89
Datong Juqiang Activated Carbon Co., Ltd. Datong Juqiang Activated Carbon Co., Ltd. 73.60
Datong Locomotive Coal & Chemicals Co., Ltd Datong Locomotive Coal & Chemicals Co., Ltd 73.60
Datong Municipal Yunguang Activated Carbon Co., Ltd Datong Municipal Yunguang Activated Carbon Co., Ltd 73.60
Datong Yunguang Chemicals Plant Datong Yunguang Chemicals Plant 73.60
Hebei Foreign Trade and Advertising Corp. Da Neng Zhen Da Activated Carbon Co., Ltd.Shanxi Bluesky Purification Material Co., Ltd.
73.60
Jacobi Carbons AB Datong Forward Activated Carbon Co., Ltd.Datong Hongtai Activated Carbon Co., Ltd.Datong Huibao Activated Carbon Co., Ltd.Ningxia Guanghua Activated Carbon Co., Ltd.Ningxia Huahui Activated Carbon Co., Ltd.
62.08
Jilin Bright Future Chemicals Co., Ltd. Shanxi Xinhua Activated Carbon Co., Ltd.Tonghua Bright Future Activated Carbon PlantZuoyun Bright Future Activated Carbon Plant
228.11
Table continued on next page.

I-4
Table I-1–ContinuedCAC: Commerce’s final LTFV margins
Jilin Province Bright Future Industry and Commerce Co., Ltd.
Shanxi Xinhua Activated Carbon Co., Ltd.Tonghua Bright Future Activated Carbon PlantZuoyun Bright Future Activated Carbon Plant
228.11
Ningxia Guanghua Cherishmet Activated Carbon Co., Ltd.
Ningxia Guanghua Cherishmet Activated Carbon Co., Ltd.
73.60
Ningxia Huahui Activated Carbon Co., Ltd. Ningxia Huahui Activated Carbon Co., Ltd. 73.60
Ningxia Mineral and Chemical, Ltd. Ningxia Baota Activated Carbon Co., Ltd. 73.60
Shanxi DMD Corp. China Nuclear Ningxia Activated Carbon Plant 73.60
Shanxi DMD Corp. Ningxia Guanghua Activated Carbon Co., Ltd.Shanxi Xinhua Chemical Co., Ltd.Tonghua Xinpeng Activated Carbon Factory
73.60
Shanxi Industry Technology Trading Co., Ltd. Actview Carbon Technology Co., LtdDatong Forward Activated Carbon Co., Ltd.Datong Tri-Star & Power Carbon PlantFu Yuan Activated Carbon Co., Ltd.Jing Mao (Dongguan) Activated Carbon Co., Ltd.Xi Li Activated Carbon Co., Ltd..
73.60
Shanxi Newtime Co., Ltd. Datong Forward Activated Carbon Co., Ltd.Ningxia Guanghua Chemical Activated Carbon Co., Ltd.Ningxia Tianfu Activated Carbon Co., Ltd.
73.60
Shanxi Qixian Foreign Trade Corp. Datong Locomotive Coal & Chemicals Co., Ltd.Datong Tianzhao Activated Carbon Co., Ltd.Ningxia Huinong Xingsheng Activated Carbon Co., Ltd.Ningxia Yirong Alloy Iron Co., Ltd.Ninxia Tongfu Coking Co., Ltd.Shanxi Xiaoyi Huanyu Chemicals Co., Ltd.
73.60
Shanxi Sincere Industrial Datong Guanghua Activated Co.Ningxia Guanghua Cherishmet Activated Carbon Co., Ltd.Ningxia Pingluo County Yaofu Activated Carbon Factory
73.60
Shanxi Xuanzhong Chemical Industry Co., Ltd. Ningxia Pingluo Xuanzhong Activated Carbon Co., Ltd. 73.60
Tangshan Solid Carbon Co., Ltd. Datong Zuoyun Biyun Activated Carbon Co., Ltd.Ningxia Guanghua Activated Carbon Co., Ltd.Ningxia Xingsheng Coal and Active Carbon Co., Ltd.Pingluo Yu Yang Activated Carbon Co., Ltd.
73.60
Tianjin Maijin Industries Co., Ltd. Hegongye Ninxia Activated Carbon FactoryNingxia Pingluo County Yaofu Activated Carbon PlantYinchuan Lanqiya Activated Carbon Co., Ltd.
73.60
United Manufacturing International (Beijing), Ltd. Datong Fu Ping Activated Carbon Co., Ltd.Datong Locomotive Coal & Chemicals Co., Ltd.Xinhua Chemical Co., Ltd.
73.60
Xi’an Shuntong International Trade & Industrials Co., Ltd. Datong Tri-Star and Power Carbon PlantNingxia Huahui Activated Carbon Co., Ltd.
73.60
PRC-wide rate 228.11
Source: 72 FR 9508, March 2, 2007.

10 In this section, the term activated carbon refers to both CAC (also referred to as steam-activated carbon) andCHAC. 11 Petition, p. 13. 12 Ibid. 13 Mesh numbers refer to holes sizes in sieves used to separate granular materials. For example, an 80 mesh hassieve openings that are nominally 0.177 mm. Lower mesh numbers typically have larger-sized holes. See, Petition,p. 12. 14 Petition, p. 12. 15 ***. 16 Ibid. 17 Ibid. 18 Since the iodine number is relatively simple to measure, it is often used as a substitute for surface areameasurements, which require specialized equipment and highly trained technicians. Ibid.
I-5
THE SUBJECT PRODUCT
The imported CAC covered by the scope of this investigation is described in detail in the“Background” section earlier in Part I.
Physical Characteristics and Uses10
Activated carbon is a solid material comprised primarily of carbon that has been specially treatedto increase the porosity, and thus the surface area, of the material. The high surface area that results from“activation” allows greater adsorption of chemical species onto the solid carbon. The surface area andpore structure of activated carbon depend greatly on the raw materials and processing methods used. Theprimary raw material for the production of activated carbon can be most any solid material that has a highcarbon content. Common raw materials for making activated carbon are coal, wood, coconut shells, olivestones, and peat.11 In the United States and China, coal is the most often used raw material.12
Activated carbon is sold in three basic forms: powdered, granular, and pelletized. Powderedactivated carbon (“PAC”) is usually defined as being predominately material that passes through an 80mesh.13 Granular activated carbon (“GAC”) has larger particles than PAC. The size range for GAC isusually specified by two mesh numbers between which most of the material is retained. For example, an8x30 GAC predominately contains particles that pass through an 8 mesh (2.38 mm sieve openings) but donot pass through a 30 mesh (0.59 mm sieve openings).14 Pelletized activated carbon consists of uniformlysized cylinders with typical diameters of 2 mm and lengths of 0.5 to 2 cm.15 The primary benefit ofpelletized activated carbon is that it produces a lower pressure drop over a fixed bed than GAC.16
Along with the size and shape of the activated carbon particles, factors that influence theefficiency of activated carbon in a given application are surface area, pore size distribution, ash content,and hardness.17 These properties depend on the raw materials used as well as the activation process. Thesurface area and pore size distribution are related properties that determine how much of the desiredchemical species will adsorb onto the activated carbon. Two characteristics of a given activated carbonsample that are related to the pore size distribution and surface area are the iodine number and themolasses number. The iodine number measures the mass of iodine that is absorbed from a standardsolution by a given mass of activated carbon and is usually reported in units of milligrams of iodineabsorbed per gram of activated carbon.18 Since iodine is a small molecule, the iodine number indicatesthe abundance of small diameter pores in the activated carbon. The molasses number measures theefficiency with which a sample of activated carbon removes the color-inducing molecules from a mixtureof molasses and water. Since the molecules that give molasses its color are large relative to iodine, the

19 Transcript of Commission’s March 30, 2006 conference (“Conference transcript”), p. 167 (Clark). 20 Petitioners’ postconference brief, p. 11. 21 Frederick S. Baker, Charles E. Miller, Albert J. Repik, and E. Donald Tolles, “Carbon, Activated,” Kirk-Othmer Encyclopedia of Chemical Technology, John Wiley & Sons, Inc., 2003, Section 10. 22 Ibid. 23 Thermally activated carbon is often referred to as steam-activated carbon. For purposes of this report, the term“CAC” should be viewed as thermally/steam activated carbon. 24 Petition, p. 72; Conference transcript, p. 29 (Thompson); *** importers’ questionnaire responses, Question II-7. 25 In the preliminary phase of this investigation, some importers’ questionnaire responses and conferencetestimony stated either that there are no differences in the physical characteristics of CHAC and CAC or that there isas much variation among CACs as there is between CHACs and CACs. *** importers’ questionnaire responses,Question II-7; Conference transcript, p. 107 (Kovach). 26 Emissions canisters in automobiles capture gasoline vapors from the fuel tank while the engine is off. Whenthe engine is running, hot gases pass through the canister, remove the adsorbed gasoline vapors, and carry them tothe engine for combustion. The larger-sized pores in CHAC may allow it to perform better than CAC in this task. Conference transcript, p. 66 (Wruble). 27 While the U.S. automobile makers predominately use CHAC at this time, CAC was used in this applicationprior to the 1980s. Conference transcript, p. 67 (O’Brien). Some automakers outside the United States use coal-based CAC in this application. Conference transcript, p. 162 (Skeini).
I-6
molasses number measures the abundance of medium- to large-sized pores. A purchaser of activatedcarbon chooses an appropriate pore size distribution based on the size (and chemical properties) of thechemical species to be captured. Ash content of activated carbons varies greatly according to the rawmaterial used to produce it. Since the ash is inorganic material that cannot be “activated,” a higher ashcontent reduces the effectiveness of a given mass of activated carbon. Manufacturers generally controlash content by selecting low-ash starting materials. If a higher-ash raw material is used, it may besubjected to an acid wash step to reduce the ash content after activation. Hardness is an importantproperty for specifying granular activated carbon. Harder activated carbons produce fewer fines duringshipping and use. In some applications, generation of fines can be problematic.19 Because CHAC isgenerally made using wood, it has lower hardness than certain activated, coal-based, carbon. CHACs aregenerally powdered or pelletized due to their lower hardness.20
The primary use for activated carbon is in the separation of small concentrations of chemicalspecies from liquid and gas streams. Because activated carbon has a low affinity for water but stronglyabsorbs organic and sulfur-containing chemicals, it is widely used to remove undesirable tastes and odorsfrom drinking water and to eliminate contaminants from industrial waste water.21 In the processing offoods (e.g., sugar, corn syrup, and vegetable oils), pharmaceuticals, and alcoholic beverages, activatedcarbon is used to remove unwanted color and impurities. Activated carbon is also used in the chemicalprocess industries for solvent recovery. Applications of activated carbon in gas-phase systems include airpurification, automobile emissions reduction, and solvent vapor recovery.22
There are two activation processes for producing activated carbon: thermal processing23 andchemical processing. (See subsequent section for a discussion of the production processes.) Petitionersclaim that the different processing methods produce different products that are used in separateapplications. In general, CHACs are wood-based carbons and have more large- and medium-sized poresthan coal-based CACs.24 25 According to the petitioners, this property makes CHACs more suitable forcertain applications, including emissions canisters that capture gasoline vapors from automobile fueltanks.26 27 CHACs may also retain some of the activating agent (usually phosphoric acid or zinc chloride)

28 Conference transcript, p. 83 (Rester). 29 Transcript of the Commission’s February 27, 2007 hearing (“Hearing transcript”), p. 53 (Rester) and p. 54(O’Brien). 30 Hearing transcript, pp. 54-55 (O’Brien) and petitioners’ posthearing brief, exh. 1, pp. 32-33. See also, exh. 10of petitioners’ posthearing brief. In addition to these uses, *** of Calgon’s sales of coconut-based CAC. Accordingto Calgon: “***.” *** and hearing transcript, pp. 54-55 (O-Brien). 31 Hearing transcript, p. 55 (O’Brien). 32 Hearing transcript, pp. 54-55 (O’Brien). 33 Hearing transcript, p. 50 (Thompson). 34 U.S. EPA, http://www.epa.gov/mercuryrule/basic.htm, retrieved April 5, 2006. 35 Conference transcript, p. 132 (Nelson). 36 Thomas J. Feeley, III, Lynn A. Brickett, B. Andrew O’Palko, and James T. Murphy, “Field Testing of MercuryControl Technologies for Coal-fired Power Plants,” U.S. Department of Energy/National Energy TechnologyLaboratory, May 2005, http://www.netl.doe.gov/technologies/coalpower/ewr/pubs/mercuryR%26D-v4-0505.pdf,retrieved March 30, 2006. 37 Ibid. 38 ***. 39 Norit America, Inc., Material Safety Data Sheet, Activated Carbon,http://www.norit-americas.com/pdf/MSDS117_rev4.pdf, retrieved March 14, 2006.
I-7
that could leach out during processing and may make them unacceptable for certain applications such asaquarium filters or pharmaceutical purification.28
CAC made from coconut shells typically has different properties from CAC made from coal. Specifically, coconut-based activated carbon usually has greater hardness and smaller pore sizes thancoal-based activated carbon.29 These differences may make coconut-based carbon better than coal-basedcarbon for certain applications. In the United States, two industries for which coconut-based activatedcarbon is preferred over coal-based activated carbon are gold mining and manufacturing filters forcigarettes.30 The process of recovering gold from mined ore involves the adsorption of gold on activatedcarbon. The extra hardness of coconut-based carbon helps to reduce the loss of gold that can occur whenthe activated carbon particles break into smaller pieces.31 In cigarette filters, coconut-based carbon maybe better than coal-based activated carbon at adsorbing chemicals that affect the flavor of the cigarette.32 In other applications, these property differences may not be meaningful and either coconut- or coal-basedactivated carbon could be used.33
One use of activated carbon that may increase in the future is the control of mercury emissionsfrom coal-fired power plants. In 2005, the U.S. Environmental Protection Agency (EPA) issued theClean Air Mercury Rule to cap and reduce mercury emissions from coal-fired power plants. When fullyimplemented in 2018, this regulation will reduce mercury emissions by nearly 70 percent.34 Many statesare also enacting limits for mercury emissions.35 To meet the final mercury emissions cap, it is likely thata new mercury control technology will be needed.36 While still in the demonstration stage ofdevelopment, injection of powdered activated carbon into the flue gas from coal-fired plants has to thispoint shown the most promise for meeting the mercury emissions cap,37 although other technologies willcompete for this demand.38
Activated carbon is non-toxic and has no adverse environmental effects.39 However, once theactivated carbon has been used, it may take on the toxicity of adsorbed materials. Like nearly allpowdered and granular materials, eye or skin exposure to activated carbon may cause mild irritation. Inhalation of the dust from powdered or granular activated carbon may cause irritation of the respiratorytract. Activated carbon is generally packaged and stored in plastic bags at weights ranging from 25

40 Conference transcript, p. 99 (Wruble). 41 In this section, the term activated carbon refers to both CAC (also referred to as steam-activated carbon) andCHAC. 42 MeadWestvaco produces CHAC from wood. Norit also produced wood-based CHAC until January 2005. 43 Petition, p. 71. 44 ***. 45 A rotary kiln consists of a long cylindrical combustion chamber that is slightly tilted from horizontal. Thematerial to be burned is added to the elevated end of the kiln. The tilt and rotation of the combustion chamber movethe material out the opposite end. Residence time is controlled by the feed and rotation rates. 46 Petition, p. 14. 47 A multiple hearth kiln consists of a vertical column with grates at various heights in the column. Solidmaterials are fed into the top of the kiln and arms attached to a rotating center shaft push the material to the lowergrates. Steam and/or air are fed into the bottom of the kiln. The residence time of the solid material in the kiln isdetermined by the rotation rate of the center shaft and by the feed rate, which controls the bed height on each grate. 48 Petition, p. 14. 49 Carbon dioxide, CO2, may also be used as an oxidizing agent.
I-8
pounds to 2,000 pounds. Bags of activated carbon are shipped either by rail or truck. Bulk delivery bytruck is also common.40
Manufacturing Facilities41
The process of making activated carbon differs based on the starting material used and whetherthe carbon is thermally or chemically activated. The two most common methods for producing activatedcarbon in the United States are thermal activation (also called steam activation) of coal, which is theprocess that the petitioners, Calgon and Norit, use, and chemical activation of wood.42 A small amount ofwood-based CAC, ***, is produced domestically.43
Two commonly used processes for thermally activating coal are direct activation andreagglomeration. These processes only differ in the initial treatment of the coal. In direct activation, thecoal is simply crushed to the desired size before undergoing subsequent processing steps. Forreagglomeration, the coal is first crushed, then mixed with a binder, such as coal tar or petroleum pitch,and finally pressed into briquettes. These briquettes are crushed to the desired size before beginning thecarbonization and activation process. To make pelletized carbon in either of these processes, the crushedstarting material is mixed with a binder and extruded to produce cylinders that are typically 2 mm indiameter and 0.5 to 2 cm in length.44
For both direct activation and reagglomeration, the crushed material is added to one or morerotary kilns45 for the carbonization step. The raw material is heated in the kiln, in the absence of oxygen,to approximately 400 degrees Celsius.46 During this step, the water and volatile organic compounds arevaporized and removed from the kiln in the exhaust gases. The charred material is removed from the kilnafter approximately six hours, ready for the activation step.
In thermal activation, the carbonized material is transferred to a rotary kiln or multiple hearthkiln.47 The kiln is maintained at a temperature of approximately 1,000 degrees Celsius.48 An oxidizingagent, usually steam,49 is fed to the kiln. The high surface area of activated carbon is created in this stepas the reaction between steam and carbon removes much of the material and leaves a porous structure. Variables such as the pore size and surface area are controlled by the kiln temperature and residence timeof the material. After the activated carbon is removed from the kiln, it can be milled and screened to finalsize and packaged for sale.

50 In addition to phosphoric acid, other chemicals such as zinc chloride, sulfuric acid, or potassium hydroxide canbe used to chemically activate steam. Zinc chloride is no longer used in the United States because of environmentalconcerns regarding zinc. Petition, p. 16. 51 Baker et al., “Carbon, Activated,” op. cit., Sections 10 and 11. 52 Petition, p. 17. 53 Baker et al., “Carbon, Activated,” op. cit., Section 3. 54 Ibid. 55 Desorption is the process in which a molecule leaves the surface to which it is adsorbed. 56 Conference transcript, p. 193 (Enniking). 57 ***, reported that RAC is a substitute for CAC. 58 As noted earlier, only one importer reported imports of RAC during 2003-06. Details regarding these importsof RAC are presented in Part IV of this report, U.S. Imports, Apparent Consumption, and Market Shares.
I-9
In the chemical activation of wood, an activating agent, typically phosphoric acid,50 is added tosawdust before it is added to a rotary kiln. Both the carbonization process and the activation process takeplace in this kiln. The activating agent extracts moisture, reduces tar formation, and generates an openpore structure.51 The pores created by chemical activation are generally larger than the pores formedduring thermal activation.52 The yield of activated carbon is generally 50 percent by weight of the rawmaterial for chemical activation compared to 30 to 35 percent by weight for thermal activation.53
After activation, CACs and CHACs can be further treated depending on the application for whichit will be used. Two common treatments are acid washing, which is usually only used for CAC, andimpregnation with metals. Acid washing is often used for CACs that have a high ash content.54 Washingthe CAC with hydrochloric or other acids removes minerals and ash resulting in a higher purity product. Acid-washed CACs are often used in applications where process streams are acidic, such as purificationof corn syrup. For some speciality applications, the activated carbon, either thermally or chemicallyactivated, may be impregnated with metals or other chemicals. The impregnation gives the activatedcarbon the ability to adsorb a particular impurity or catalyze a desired reaction.
In some instances, used CAC can be “reactivated.” Spent carbon is reactivated by heating it in akiln until the adsorbed species are desorbed55 or destroyed. RAC tends to have slightly lower activitythan virgin CAC. Reactivation is usually performed on granular or pelletized activated carbon and israrely used on powdered activated carbon. Reactivation is sometimes done by the end user and thenreused by the same user. However, there are some firms who take spent carbon from the end user,reactivate it, and return it to the original user. In processes where environmentally regulated chemicalsare being captured on activated carbon, strict bookkeeping of the amount of regulated chemical producedand how it is disposed of is required. For this reason, firms that reactivate carbon for a user usuallyprocess the carbon as single batch and return the same carbon to the user. In some applications, such asusing activated carbon to capture molecules in the gas phase, there is little risk that residual species inreactivated carbon will leach into the process. In these applications, it is possible for spent carbons fromdifferent users to be mixed together, reactivated, and sold to yet another user as “pooled” RAC.56
Interchangeability and Customer and Producer Perceptions
Nearly all producer and importer questionnaire respondents reported that there was at least someinterchangeability between Chinese and U.S.-produced CAC. *** reported that there are no directsubstitutes for CAC.57 For importers, the most commonly mentioned substitute was RAC, which sells at alower price than CAC.58 In the preliminary phase of the investigation, six importers suggested CHAC asa substitute in certain applications (e.g, water purification, decolorization, air treatment, etc.), although itis perceived as commanding a higher price than CAC or RAC. More detailed information on

59 For RAC, more than 90 percent of shipments by U.S. producers and the lone importer went to end users. 60 Certain Activated Carbon from China, Investigation No. 731-TA-1103 (Preliminary), USITC Publication 3852,May 2006, pp. 7-11. 61 Coalition of Importers of Activated Carbon (“CIAC”) postconference brief, p. 9. 62 Ibid. 63 Certain Activated Carbon from China, Investigation No. 731-TA-1103 (Preliminary), USITC Publication 3852,May 2006, pp. I-7-I-8.
I-10
interchangeability and customer and producer perceptions can be found in Part II of this report,Conditions of Competition in the U.S. Market.
Channels of Distribution
For the most part, shipments of CAC by both U.S. producers and importers went to end users. Over *** percent of shipments by U.S. producers of CAC went to end users during the period examined,while 66 to 74 percent of shipments of Chinese product by U.S. importers went to end users.59 Moredetailed information on channels of distribution can be found in Part II of this report, Conditions ofCompetition in the U.S. Market.
Price
Information with regard to prices of CAC is presented in Part V of this report, Pricing andRelated Information.
DOMESTIC LIKE PRODUCT ISSUES
As noted earlier, in the preliminary phase investigation, the Commission collected dataconcerning CHAC and considered respondent parties’ arguments that CHAC should be included in the“domestic like product.” Ultimately, after due consideration, the Commission determined that CHACwas not included in the domestic like product, and defined the domestic like product as CAC, coextensivewith the scope of the investigation.60 For purposes of the preliminary determination, no party took theposition that the Commission should expand the domestic like product to include RAC.61 Nevertheless,respondents argued that the reality is that RAC is part of the same domestic like product as CAC andCHAC. 62 In its views in the preliminary phase investigation, the Commission offered the followingconcerning RAC:
“Reactivated carbon is made by thermally or chemically removing chemicalspecies adsorbed onto used activated carbon.63 It appears that reactivated carbon andactivated carbon cannot be physically distinguished within the same type or form ofcarbon (i.e., pelletized, powdered, granulated, etc.), and that both have the same use: totrap contaminants in liquids or gases through adsorption. Nonetheless, interchangeabilitybetween certain activated carbon and reactivated carbon is limited. Due to contaminationand liability concerns, most reactivated carbon can be used only in its originalapplication. Moreover, while some reactivated carbon is pooled for use in the sameapplication for which the virgin product was directed, many purchasers are unwilling tobuy reactivated carbon previously used by any other end-user. Additionally, reactivated
64 Ibid., p. I-8. Conference transcript, pp. 164-166 (Clark); third-party RAC is never used in drinking waterapplications. 65 Certain Activated Carbon from China, Investigation No. 731-TA-1103 (Preliminary), USITC Publication 3852,May 2006, pp. I-7, I-8. 66 Ibid., II-2-II-3. According to one of CIAC’s witnesses at the preliminary conference, there is some overlap inthe equipment that can be used to produce activated and RACs. Specifically, the furnaces can be used to producedboth products, with some cleaning and adjustment necessary for switching between producing the two products. Conference transcript, p. 110 (Kovach). Although petitioners acknowledged that both activation and reactivationoccur in a furnace or kiln, they stated that activation and reactivation occur in separate facilities to avoidcontamination. One domestic producer, ***, stated that it uses the same machinery and employees to produceactivated and reactivated carbon. For that producer, however, reactivated carbon accounted for *** percent ofproduction using the common machinery and employees. Certain Activated Carbon from China, Investigation No.731-TA-1103 (Preliminary), USITC Publication 3852, May 2006, p. II-3. 67 Petitioners stated that reactivated carbon does not require the production of char from the raw materials, andthat the organic compounds removed during activation are different from the adsorbed compounds removed duringreactivation. Petitioners’ postconference brief, pp. 23-24. Respondents argued that the processes are almostidentical, although they acknowledged minor differences between the two processes regarding what is beingcarbonized, and that reactivated carbon needs to be blended with virgin activated carbon to make up for carbon lostin the reactivated carbon production process. CIAC’s postconference brief, pp. 12-14. 68 Certain Activated Carbon from China, Investigation No. 731-TA-1103 (Preliminary), USITC Publication 3852,May 2006, p. II-4. 69 Ibid., pp. 11-12.
I-11
carbons can never be used in certain beverage applications and food grade applications.64 Although activated carbons can be used in any applications that use reactivated carbons,reactivated carbons are frequently limited to their original application, and are used onlyas a cost-saving measure. Even though almost all domestic producers of certain activatedcarbon market and sell reactivated carbon, the channels of distribution for the twoproducts differ. Certain activated carbon is sold on the commercial market to a variety ofend-users, much reactivated carbon is produced (reactivated) and consumed internally byend-users.65 Moreover, because of contamination concerns, activation and reactivationare performed in different facilities using different equipment.66
Although the parties acknowledge differences in the production processes, theparties disagree as to the importance of these differences.67 While some customersperceive reactivated carbon to be identical to low-grade virgin carbons, as previouslydiscussed, some end-users accept only virgin activated carbon, and numerous other end-users use only their own reactivated carbons due to contamination concerns. There arealso significant differences in price between the two products.68 Reactivated carbon sellsat much lower prices than does certain activated carbon. For the reasons discussedabove, we find a clear dividing line between certain activated carbon and reactivatedcarbon for purposes of the preliminary phase of this investigation.”69
At the hearing in this investigation, the Commission raised questions as to whether the domesticlike product should be expanded to include RAC. In response, petitioners, in their domestic like productanalysis, stated:
“That analysis shows that under the Commission’s six-part test, reactivatedcarbon is not like the subject imports. Reactivated carbon is made from different rawmaterials than CAC (virgin coal vs. contaminated CAC), has different important physical

70 Petitioners’ posthearing brief, pp. 3-4. See also, exh. 1, pp. 17-22 and pp. 25-29, petitioners’ postconferencebrief, pp. 19-25, and petitioners’ prehearing brief, pp. 3-18.
I-12
characteristics than CAC (contamination), is produced on different equipment in differentfacilities than CAC, has limited interchangeability with CAC, is perceived as differentfrom CAC due to the potential for contamination, is distributed differently than CAC, andis priced differently than CAC.
Reactivated carbon was excluded from the scope because there are no imports ofreactivated carbon from China and the product does not directly compete with CAC otherthan in exceptional circumstances. As a result, the Commission should follow its practiceof not expanding the like product to include a non-scope downstream product likereactivated carbon.”70
1 ***. 2 Ibid. 3 Eight of the responding purchasers also reported purchasing RAC. 4 ***’s purchaser questionnaire response, section IV-5. 5 *** also produce RAC. In this section, they are discussed as producers of CAC. The discussion of producers ofRAC refers to the six additional responding commercial producers.
II-1
PART II: CONDITIONS OF COMPETITION IN THE U.S. MARKET
U.S. MARKET SEGMENTS
U.S. producers’ U.S. commercial shipments of CAC and RAC, as well as U.S. shipments ofimported CAC from China, are made primarily to end users. Types of end users include municipal watertreatment facilities for both drinking and waste water, food processing plants, chemical processing plants,filter manufacturers, and reactivators. Data provided in the petitioners’ posthearing brief indicate that***.1 Calgon reported that ***.2 Most end users use CAC to filter contaminants, color impurities, andodors out of water (potable and waste); food (for example, corn syrup); and chemicals. Reactivators usevirgin CAC to mix with their reactivated product. Staff received usable questionnaire responses from 34purchasers of CAC.3 These purchasers span the types of end users mentioned above.
The two largest responding purchasers of CAC, ***, as well as several other purchasers, are alsoreactivators of used CAC. As such they compete directly with each other and sometimes with producersof CAC. As noted above, municipal water treatment plants account for a large share of the CAC market. In the municipal water treatment industry, sales are often determined by a bidding process where thelowest bidder wins the contract (assuming that this bidder’s product can pass through the prequalificationprocess). Some of these plants limit their purchases to domestic products and others do extensiveperformance-cost analyses. By and large, however, the lowest cost supplier will win the bid. Quality-related issues are often more important for other types of purchasers, including those in the foodprocessing industry and those in the filter manufacturing industry. According to ***, filters are ***.4
Due to the large municipal water treatment segment, some minor seasonality is present in themarket for CAC. Specifically, while purchases are made year-round, municipal water treatment plantsgenerally try not to have CAC replaced during the summer months which see a high level of water usage. Markets do not appear to be limited geographically, with *** responding producers of CAC andfour of six responding producers of RAC reporting nationwide sales. One remaining producer of RACreported sales to *** while the other reported selling ***. Seventeen of 27 responding importers alsoreported nationwide sales of CAC, with another four reporting sales to at least four regions.
CHANNELS OF DISTRIBUTION
***5 two responding U.S. producers of RAC, and eight of 18 responding importers of CACreported sales to both distributors and end users of CAC. Nine importers of CAC and the remaining threeresponding U.S. producers of RAC, as well as the third responding producer of CAC, reported sales onlyto end users. One importer of CAC reported sales only to distributors. *** of U.S. producers’ U.S.shipments of CAC were shipped directly to end users throughout the period for which data werecollected. Approximately *** percent of U.S. producers’ U.S. shipments of CAC, and *** percent ofU.S. producers’ U.S. shipments of RAC, went to end users in each year between 2003 and 2006. Acomparatively higher share of importers’ U.S. shipments of CAC went to distributors, with shipments toend users accounting for between 66 and 74 percent of U.S. imports from China during the period 2003

II-2
to 2006. *** suggested that sales to distributors are often made at a discount due to the lower cost ofsales involved in such transactions. To the extent that this is true, it may place a downward bias on theobserved price of imported CAC, which is more frequently sold to distributors. Table II-1 presentsinformation on channels of distribution for U.S. producers of CAC and RAC as well as for U.S. importersof CAC from China.
Table II-1CAC and RAC: U.S. producers’ and U.S. importers’ U.S. shipments, by channels of distribution,2003-06
ShipmentsCalendar year
2003 2004 2005 2006U.S. producers’ U.S. shipments of CAC (in short tons)
To distributors *** *** *** ***To end users *** *** *** ***
U.S. producers’ U.S. shipments of RAC (in short tons)To distributors *** *** *** ***To end users *** *** *** ***
U.S. importers’ U.S. shipments of subject CAC (in short tons)To distributors 16,021 20,065 23,327 20,851To end users 37,298 45,863 45,439 59,135
Share of U.S. producers’ U.S. shipments of CAC (in percent)To distributors *** *** *** ***To end users *** *** *** ***
Share of U.S. producers’ U.S. shipments of RAC (in percent)To distributors *** *** *** ***To end users *** *** *** ***
Share of U.S. importers’ U.S. shipments of subject CAC (in percent)To distributors 30.0 30.4 33.9 26.1To end users 70.0 69.6 66.1 73.9Source: Compiled from data submitted in response to Commission questionnaires.
SUPPLY AND DEMAND CONSIDERATIONS
U.S. Supply
Domestic Production
Based on available information, staff believes that U.S. producers of CAC are likely to respond tochanges in demand with moderate changes in shipments of U.S.-produced CAC to the U.S. market. Asmall amount of unused capacity as well as limited ability to shift production to and from alternativeproducts suggest a low degree of responsiveness, while the existence of alternative markets, ***, andmoderately high inventories suggest a higher degree of responsiveness.

6 See table III-2 for additional details concerning capacity and capacity utilization. 7 Petitioners’ postconference brief, p. 31. 8 Hearing transcript, p. 71 (Thompson). 9 See table III-2. 10 Conference transcript, p. 110 (Kovach).
II-3
Industry capacity
Total U.S. capacity fell *** from *** million pounds in 2003 to *** million pounds in 2006. U.S. producers’ reported capacity utilization for CAC rose from *** percent in 2003 to *** percent in2006. Overall, the level of capacity utilization indicates that U.S. producers of CAC have *** currentlyavailable capacity with which they could increase production of CAC in the event of a price change.6 However, according to petitioners’ postconference brief, ***.7 According to testimony at the hearing,high levels of capacity utilization are necessary to keep costs low.8 Alternative markets
Overall, domestic producers’ exports fell *** between 2003 and 2005 but ***.9 ***. *** levelof exports during the period indicates that domestic producers ***. Inventory levels
Moderate inventories relative to total shipments indicate that U.S. producers are able to respondto changes in demand simply by increasing shipments from inventory. According to questionnaireresponses, U.S. producers’ aggregate beginning inventories were *** percent of total shipments in 2006. Table III-2 presents complete inventory data for U.S. producers.
Production alternatives
*** reported producing other products on the same equipment or machinery used to produceCAC. *** reported that some production personnel will occasionally work on reactivating carbon. ***reported that RAC accounts for *** percent of production by the personnel that produce CAC. ***reported producing a small amount of CAC on the same machinery and using the same employees as doesproduction of RAC. This producer reported that RAC accounted for *** percent of production using thismachinery and these employees. Aside from this producer, no U.S. producers of RAC reported producingany other product using the same equipment, machinery, or personnel as is used in the production ofRAC. Testimony by witnesses for the respondent parties during the staff conference indicated that thesame equipment (specifically, the furnace) can be used to both activate virgin carbon and reactivatepreviously activated carbon with some cleaning and adjustment between production of the two products.10
Subject Imports
According to official Commerce statistics, U.S. imports of CAC from China as a share of totalU.S. imports of CAC (in terms of quantity) fell from *** percent in 2003 to *** percent in 2006. U.S.imports of CAC from China rose from *** million pounds in 2003 to *** million pounds in 2006. As ashare of total U.S. consumption, U.S. imports from China rose from *** percent in 2003 to *** percent in2006. Based on available information, importers of CAC from China are likely to respond to changes

11 In the preliminary phase of this investigation, one of 24 responding Chinese producers reported producing otherproducts using the same machinery, equipment, and/or employees as are used to produce CAC.
II-4
in demand with moderate to large changes in the quantity shipped to the U.S. market. A large response issupported by the existence of alternative markets and moderate levels of inventory, while the response islimited by a high capacity utilization rate and an inability to produce other products using the sameequipment with which CAC is produced.
Industry capacity
From 2003 to 2006, reported Chinese capacity grew from 36.8 million pounds to 55.1 millionpounds (see table VII-1). Production growth lagged slightly behind growth in capacity as capacityutilization fell from 98.4 percent in 2003 to 91.7 percent in 2006. These data indicate that Chinesesuppliers of CAC have limited excess capacity with which they could increase production of CAC in theevent of a price change.
Alternative markets
According to questionnaire responses from Chinese producers of CAC, exports to the UnitedStates accounted for 41.5 percent of all exports of CAC from China in 2006, up from 37.7 percent in2003. Total exports accounted for 75.9 percent of total shipments of Chinese-produced CAC in 2006,down from 91.1 percent in 2003. Due to large existing export markets, Chinese producers have theability to divert product to or from other markets in response to relative changes in the price of CACbetween the United States and these other markets.
Inventory levels
Chinese producers’ inventories, as a share of total shipments, rose from 12.2 percent in 2003 to17.4 percent in 2006. These data indicate that responding Chinese producers of CAC have some ability touse inventories as a means of increasing shipments of CAC to the U.S. market.
Production alternatives
Only one of 11 responding Chinese producers of CAC indicated that it produced other productsusing the same equipment used to produce CAC.11 This foreign producer reported that CAC accountedfor 90 percent of production using this equipment. It appears that Chinese producers are constrained intheir ability to switch capacity to or from alternative products in the event of a change in demand forCAC.
U.S. Demand
Based on available information, CAC consumers are likely to respond to changes in the price ofCAC with moderate to large changes in their purchases of CAC. The main contributing factor to theresponsiveness of demand is the availability of substitute products that can compete with CAC in manyend uses. Specifically, since reactivation of used carbon is a viable alternative for many customers, anincrease in the price of virgin CAC may lead to more widespread use of reactivated product. However,the ability of end users to use reactivated product is not universal and many end users can use only virginCAC. In addition, a substantial increase in the price of CAC may lead to more direct competition withthe higher-priced CHAC which is a viable substitute for a number of end uses.

12 ***’s importer questionnaire response, section III-B-15. 13 Hearing transcript, p. 143 (Thompson). 14 Only one of these two actually reported purchasing RAC.
II-5
Demand Characteristics
Available data indicate that apparent U.S. consumption of CAC rose from *** million pounds in2003 to *** million pounds in 2006, an increase of *** percent.
When asked if demand for CAC had changed since 2003, *** responding *** producers of CAC,four responding producers of RAC, 22 of 24 responding importers of CAC, and 12 of 23 respondingpurchasers of CAC (including five of seven purchasers of RAC) reported that demand had increasedbetween 2003 and 2006. Two importers of CAC and 10 purchasers stated that demand had beenunchanged between 2003 and 2006 and one purchaser stated that demand had decreased. One U.S.producer of CAC and one importer of CAC stated that demand has been growing consistently at 3 to 5percent per year. The most commonly cited reason for the increase is stricter EPA regulations regardingthe treatment of water as well as the emission of pollutants. *** U.S. producers of CAC, as well as threeof four responding U.S. producers of RAC, 17 of 24 responding importers of CAC, and ten of 30responding purchasers (including five of eight purchasers of RAC) anticipate further growth in demanddue to more stringent regulations on drinking water and the future restrictions on mercury emissions bypower plants. In general, all parties who had an opinion on the issue indicated that new mercuryemissions standards could have a significant effect on demand for CAC. While one importer reportedthat the effect of the new standards is already being seen in higher demand and prices in the CACmarket,12 as noted at the hearing, the first stage of implementation will not occur until 2010 with the finalimplementation of the new standards not occurring until 2018.13 It is therefore unlikely that a large effectwill be felt in the near future.
Substitute Products
*** reported that no direct substitutes exist. ***. Two U.S. producers of RAC reported thatsubstitutes exist. These producers of RAC listed biofiltration, thermal oxidizers, and air strippers aspotential substitutes. Fifteen of 28 responding importers of CAC reported that there are substitutes forCAC. The most widely reported substitute was RAC, which was mentioned by 12 responding importersof CAC. Six importers of CAC listed CHAC as a substitute. Thirteen of 34 responding purchasers ofCAC (including four of eight that also purchase RAC) reported that there are substitutes for CAC. Onlytwo of these 13 mentioned RAC.14 Other substitutes listed by responding parties were ion exchangeresins, zeolite, clay, activated alumina, activated coke, phosphoric acid, zinc chloride, decolorizing resin,alum and anthracite (together), oxidants, ozone, potassium permanganate, and ferric chloride.
While many potential substitutes were listed, it is clear that only RAC and the more expensiveCHAC are realistic substitutes for most end uses. Both RAC and CHAC are reported by importers ofCAC to be adequate substitutes in many applications in which CAC is used. However, as noted in Part Iof this report, reactivation is normally performed on granular or pelletized CAC and is rarely used onpowdered CAC. In addition, for end users such as potable water treatment facilities, only RAC resultingfrom the reactivation of carbon from that specific customer can be used. Other customers can purchase“pooled” RAC which can originate from a variety of sources. When asked to compare CAC to RAC,purchasers had varying opinions. While some reported that the two were, by and large, interchangeable,most reported either that they could not use RAC for their end uses or that the two were notinterchangeable. For end uses in the food, potable water, or medical industries, either virgin or customer-specific RAC is needed and pooled RAC cannot be used. When asked about the price differences,

15 See app. E for more information concerning the price of RAC, and app. D for complete purchaser statementsconcerning the comparability of CAC and RAC. 16 Hearing transcript, pp. 44-45 (Luberda), and p. 111 (O’Brien). 17 One purchaser, ***, reported that it purchases a high-grade Chinese-produced steam-activated CAC thatcompetes directly with domestic CHAC. According to ***’s purchaser questionnaire response, this grade issubstantially more expensive than most other grades of CAC. ***. 18 Conference transcript, p. 174 (Nelson). 19 Ibid., p. 119 (Jordan). 20 Petitioners’ postconference brief, exh. 1, p. 16.
II-6
several purchasers suggested that RAC is approximately 10 to 20 percent cheaper than virgin CAC. However, as one purchaser pointed out, the less-effective RAC must be replaced more often in manyapplications, thereby increasing the replacement costs associated with using RAC.15 In addition to thefactors discussed above, petitioners state that the production of reactivated carbon more closely resemblesa service rather than the production of a new product.16
While CHAC can often be used in the same applications as CAC, the price is substantially higher. In addition, for most applications that use CHAC (such as applications within the automotive industry),CAC does not meet the required specifications.17
Cost Share
One producer reported that CAC accounts for ***. Other responding U.S. producers did notprovide any information on this issue. Responding importers of CAC reported a wide range of estimatesconcerning the share of CAC costs in all end-use related costs. These estimates ranged from less than 1percent to 90 percent for a variety of end uses. For the largest end use (water treatment), estimates of thecost share attributable to CAC supplied by the treatment facilities themselves were normally in the rangeof 5 to 10 percent of treatment costs (excluding any cost of the water itself). One purchaser in the foodproducts industry reported that CAC accounted for *** of the total cost of the products produced usingCAC.
SUBSTITUTABILITY ISSUES
Factors Affecting Purchasing Decisions
It is generally agreed that as long as CAC meets the specifications required for the particular enduse in question, then price is the largest single factor affecting purchase decisions. There may, however,be some differences in quality between domestically produced CAC and CAC imported from China. During the staff conference for the preliminary phase of this investigation, representatives for therespondent interested parties reported that U.S.-produced CAC is often more effective and thereforerequires less product for the same end use than Chinese-produced product.18 This sentiment was echoedby some purchasers in their questionnaire responses. Some end users require CAC with a lower ashcontent than is available with unwashed Chinese product. In such cases, the Chinese product must beacid-washed to remove ash and meet the required specifications. According to an industry witnessappearing on behalf of respondent interested parties at the staff conference, such washing may increasecosts by 30 to 40 percent.19 Finally, many orders of granular CAC (***20) include removal of old productalong with installation of new product. Service costs, therefore, may influence the purchase decisionalong with the cost of the CAC itself.

21 CIAC postconference brief, pp. 25-26. 22 Petitioners’ postconference brief, p. 34. 23 None of these four purchasers reported purchasing RAC, which is almost always domestically produced.
II-7
While not Federally mandated in this industry, municipalities may enact their own “BuyAmerican” regulations to CAC. Respondents claim that a substantial portion (20 to 30 percent) ofmunicipal water treatment facilities purchase only U.S.-produced product.21 Petitioners state that theybelieve these estimated percentages to be “overblown.” In addition, they report that many of these “BuyAmerican” policies are informal and could be ignored should price differences between domestic andimported product become too great.22 When asked about the issue, three of 34 purchasers stated thatsome of their sales were limited to domestic CAC by law. For these purchasers, such purchasesaccounted for 5-20 percent of their total purchases. Four purchasers also stated that a certain percentageof their purchases was limited to domestic CAC due to the requirements of their customers. Suchpurchases accounted for 90 percent of all purchases for one purchaser and less than 10 percent for theremaining three. Finally, five purchasers reported that some or all of their purchases were limited todomestic CAC for “other” reasons. For four of these five purchasers, such purchases accounted for 100percent of their CAC purchases. For two of these four purchasers, the “other” reason given to limit theirpurchases to domestic sources was the superior quality of domestic CAC.23
Purchasers were asked to identify the three major factors considered by their firm in decidingfrom whom to purchase CAC (table II-2). Twenty of the 32 responding firms reported that quality ormeeting specifications was the most important factor, whereas nine of the 32 reported that price was themost important factor. No other factor was listed as “most important” by more than one purchaser. Pricewas also listed as second most important by 14 purchasers and third by another eight, while quality waslisted as second by nine purchasers and third by one. Availability was listed as the most important factorby one purchaser, the second most important factor by three purchasers, and the third most importantfactor by 10 purchasers. Delivery or removal performance was listed as second most important by twopurchasers and as third most important by four more and product reliability/consistency was listed secondby two purchasers and third by two purchasers. No other factor received more than one vote.
When asked what factors determine the quality of CAC, purchasers provided a wide variety ofanswers. Nine of 30 stated that the CAC must meet either firm or industry standards and specifications;16 mentioned physical characteristics such as particle size, bulk density, moisture content, ash content,hardness, iodine number, adsorption capacity, and dustiness; and six mentioned product performance(often based on in-house testing).
Purchasers were asked if they always, usually, sometimes, or never purchased the lowest-pricedCAC. Four purchasers reported always purchasing the lowest-priced product; 14 reported that theyusually purchased the lowest-priced product; nine reported only sometimes purchasing the lowest-pricedproduct; and four reported never purchasing the lowest-priced product.

II-8
Table II-2CAC: Most important factors in selecting a supplier, as reported by purchasers
Factor First Second Third
Price 9 14 8
Quality/meets specifications 20 9 1
Availability 1 3 10
Delivery/removal performance 0 2 4
Domestic supplier 1 0 0
Customer requires specific supplier 1 0 0
Reliability/consistency 0 2 2
Customer/technical service 0 0 1
Packaging 0 1 0
Extension of credit 0 1 0
Traditional supplier 0 0 1
References 0 0 1
Source: Compiled from data submitted in response to Commission questionnaires.
Purchasers were asked to rate the importance of 15 factors in their purchasing decisions (tableII-3). Meeting industry standards was listed as very important by all 33 responding purchasers, whileproduct consistency was listed as very important by 32 of the responding purchasers, and reliability ofsupply was listed as very important by 31 firms. Twenty-nine listed product availability as being veryimportant, while 26 reported that price was very important and 25 reported that delivery time was veryimportant. Price was listed as somewhat important by the remaining seven purchasers.

II-9
Table II-3CAC: Importance of purchase factors, as reported by purchasers
Factor
Very important Somewhat important Not important
Number of firms responding
Product availability 29 4 0
Delivery terms 19 12 2
Delivery time 25 7 1
Discounts offered 2 15 16
Extension of credit 6 13 14
Price 26 7 0
Minimum quantity requirements 4 14 14
Packaging 15 14 4
Product consistency 32 1 0
Quality meets industry standards 33 0 0
Quality exceeds industrystandards 11 16 6
Product range 4 21 8
Reliability of supply 31 1 1
Technical support/service 8 17 8
U.S. transportation costs 10 14 9
Note.--Not all purchasers responded for each factor.
Source: Compiled from data submitted in response to Commission questionnaires.
Purchasers were asked for a country-by-country comparison of U.S.-produced CAC compared toCAC from China. Results are shown in table II-4. By and large, product from China and product fromthe United States are fairly comparable. However, it is clear that the Chinese CAC is generally lessexpensive, while the U.S. product is accompanied by superior technical support and may have morereliable supply and lower delivery times. The U.S. product may also exhibit a greater degree of productconsistency. These patterns are consistent with statements made by suppliers concerning the differencesbetween U.S. and Chinese CAC.

24 *** are not produced in the United States, but are available from China.
II-10
Table II-4CAC: Comparisons of product by source country, as reported by purchasers
Factor
U.S. vs. China
S C I
Number of firms responding
Product availability 5 13 3
Delivery terms 3 16 2
Delivery time 7 13 1
Discounts offered 1 15 4
Extension of credit 1 17 2
Lower price1 0 3 18
Lower U.S. transportation costs1 4 15 1
Minimum quantity requirements 2 18 1
Packaging 1 20 0
Product consistency 7 14 0
Product range 3 16 0
Quality meets industry standards 2 18 0
Quality exceeds industry standards 4 14 0
Reliability of supply 5 12 3
Technical support/service 13 8 01 A rating of “S” on price and U.S. transportation costs indicates that the U.S. product has lower prices/costs thanthe product from China.
Note.--S=first listed country’s product is superior; C=both countries’ products are comparable; I=first listed country’sproduct is inferior.
Note.--Not all companies gave responses for all factors. Source: Compiled from data submitted in response to Commission questionnaires.
Producers, importers, and purchasers were asked if certain grades, types, or sizes of CAC wereavailable from a single source. While *** of the three U.S. producers of CAC stated that certain gradeswere only available from a single source or country, three of five responding U.S. producers of RAC and14 of 28 responding importers of CAC stated that certain grades were only available from a single sourceor country.24 Eight of the 32 responding purchasers of CAC also reported that certain grades of CACwere not universally available. In general, purchasers that responded in the affirmative to this questionreported that coal-based pellets are only available from China and that coconut-based CAC (pelletized,powdered, and granular) are not available in the United States and must be imported (primarily from

25 According to testimony given at the hearing, “Coconut-based products are typically more expensive than coal-based products and are largely sold to a different customer base.” (Hearing transcript, p. 17 (Thompson)). Theseassertions are supported in the petitioners’ posthearing brief by data presented in exh. 1, p. 32, which shows that ***,and exh. 4, which shows that ***. 26 In the cases of failure to qualify by domestic producers, it is not clear whether the product in question wasproduced in the United States or imported from China.
II-11
China, Sri Lanka, and the Philippines).25 They also noted that several high-quality grades are availableonly from ***.
When asked about trends in purchasing levels of CAC from different sources, 12 of 14responding purchasers stated that they had increased shipments of CAC from China in the last four years. Six of these purchasers stated that their purchases of CAC from the United States decreased during thesame period. Price was the most commonly given reason for this pattern. Four of the 14 respondingpurchasers also reported increased orders of U.S.-produced CAC.
In most cases, new suppliers of CAC must obtain certification before their product can bepurchased. When purchasers were asked if they required certification or prequalification for CAC, 28 ofthe 32 responding purchasers reported that they required certification or prequalification for all of theirsuppliers, one reported that it required certification for 75 percent of its purchases, and the remainingthree reported that they do not require certification or prequalification. According to purchaser responses,prequalification normally entails certification from the National Sanitation Foundation and/or theAmerican Waste Water Association in addition to, in many cases, passing a series of in-houseperformance tests. Due to the health-related nature of many of the end uses of CAC, maintainingminimum standards of product quality and performance is essential in this industry.
Thirty of 32 responding purchasers of CAC reported factors they considered in qualifying a newsupplier. The most common factors considered included meeting required specifications, quality, price,reliability of supply, customer service, and references regarding performance with other customers. Thetime required to qualify a new supplier was reported by 14 purchasers and ranged from one month to oneyear, with six purchasers reporting that qualification of new suppliers takes at least 6 months. A lengthyprequalification process increases the cost of changing suppliers in the short term. Purchasers were askedif any suppliers had failed to qualify their product or lost their approved status. Eleven respondingpurchasers reported that suppliers had failed to qualify, mostly due to quality-related issues. Those thatfailed included both domestic and Chinese suppliers.26
Purchasers were asked whether they or their customers were aware of, or based their purchaseson, the producer or the country of origin of CAC (table II-5). Overall, the manufacturer and country oforigin are commonly known by purchasers. In addition, country of origin appears to matter to a sizeableshare of their customers. However, the identity of the manufacturer normally does not make a differencein purchasing decisions made by the customers of responding purchasers.

27 According to questionnaire responses, 18.1 percent of CAC imported from China is pelletized while only ***percent of U.S.-produced CAC is pelletized. Pelletized CAC is similar in use to granular CAC and would normallybe used by low-volume users using smaller filters. With smaller filters, less pressure is required to pass the mediumthrough pelletized CAC than through granular CAC.
II-12
Table II-5CAC: The role of producer and country of origin in purchaser and customer decisions
Always Usually Sometimes Never
Purchaser is aware of country of origin 28 3 3 0
Purchaser is aware of manufacturer 17 9 6 2
Purchaser’s customers are aware of/interested in thecountry of origin 9 7 10 5
Purchaser’s customers make purchasing decisionbased on manufacturer of CAC 2 2 13 9
Source: Compiled from data submitted in response to Commission questionnaires.
Nineteen of the 33 responding purchasers reported that they contacted at least two suppliersbefore making a purchase, with five reporting that they send out bid packages to anywhere from 5 to 12potential suppliers and one reporting that it publicly advertises for bids. Twelve purchasers reported thatthey only contact the one supplier with which they have a long-term contract or relationship. Seventeenof 33 responding purchasers reported changing suppliers since January 1, 2003. There is no distinctpattern regarding country of origin in the reported changes. The annual bid process involved with manysales of CAC means that suppliers are often changed to the new lowest bidder (assuming that the lowestbidder passes prequalification).
Comparisons of Domestic Products, Subject Imports, and Nonsubject Imports
U.S. producers, importers, and purchasers were asked to report how frequently CAC fromdifferent countries was used in the same applications (table II-6).
*** responding U.S. producers of CAC, two of five responding U.S. producers of RAC, four of26 responding importers of CAC, and 10 of 26 purchasers who reported having knowledge of bothChinese and U.S.-produced CAC reported that Chinese and U.S. CAC are always interchangeable. Nineimporters of CAC, two producers of RAC, and eight purchasers reported that product from the twocountries is frequently interchangeable, while 13 importers of CAC and five purchasers reported thatproduct from China is sometimes interchangeable with U.S.-produced CAC. Three purchasers reportedthat these products were never interchangeable. Importers of CAC, purchasers of CAC and RAC, andproducers of RAC also reported imperfect interchangeability between the United States, China, and non-subject countries (primarily Sri Lanka, the Philippines, and India). The most-commonly stated reasonsfor a lack of interchangeability include the unavailability in the United States of coconut-based CAC andpelletized CAC.27 One importer of CAC also cited quality issues as the reason for imperfectinterchangeability (in that the Chinese product is of lower quality), and one purchaser cited inferiordelivery and availability on the part of the Chinese suppliers.

II-13
Table II-6CAC: U.S. producers’ and importers’ perceived degree of interchangeability of products producedin the United States and other countries1
Countrycomparison
U.S. producers of CAC U.S. producers of RAC U.S. importers U.S. purchasers
A F S N 0 A F S N 0 A F S N 0 A F S N 0
U.S. vs.China *** *** *** *** *** 2 2 0 0 1 4 9 13 0 0 10 8 5 3 0
U.S. vs.Nonsubject *** *** *** *** *** 0 3 0 0 2 3 5 8 1 9 3 2 4 2 15
China vs.Nonsubject *** *** *** *** *** 0 2 1 0 2 4 5 7 1 9 2 2 5 2 15
1 Producers, importers, and purchasers were asked if CAC produced in the United States and in othercountries is used interchangeably.
Note: “A” = Always, “F” = Frequently, “S” = Sometimes, “N” = Never, and “0” = No familiarity.
Source: Compiled from data submitted in response to Commission questionnaires.
Producers of CAC and RAC and importers of CAC were also asked to assess how oftendifferences other than price were significant in sales of CAC from the United States, China, or nonsubjectcountries (table II-7).
Table II-7CAC: U.S. producers’ and importers’ perceptions concerning the importance of non-pricedifferences in purchases of CAC from the United States and other countries1
Country comparison
U.S. producers of CAC U.S. producers of RAC U.S. importers
A F S N 0 A F S N 0 A F S N 0
U.S. vs. China *** *** *** *** *** 2 1 1 0 1 4 11 6 4 1
U.S. vs. Nonsubject *** *** *** *** *** 0 1 2 0 2 6 5 2 4 9
China vs. Nonsubject *** *** *** *** *** 0 1 2 0 2 3 6 2 4 11
1 Producers and importers were asked if differences other than price between CAC produced in the UnitedStates and in other countries are a significant factor in their firm’s sales of the product.
Note: “A” = Always, “F” = Frequently, “S” = Sometimes, “N” = Never, and “0” = No familiarity.
Source: Compiled from data submitted in response to Commission questionnaires.
*** responding producers of CAC, as well as four of 26 responding importers of CAC, reportedthat non-price differences are never a factor in sales of CAC from the United States and China. Fourimporters of CAC and two of five U.S. producers of RAC reported that such differences are always afactor; 11 importers of CAC and one producer of RAC reported that such differences are frequently afactor; and six importers of CAC and one producer of RAC reported that non-price differences weresometimes a factor. Quality, availability, particular product characteristics, service, and technical supportwere listed as factors other than price that may influence their purchase decisions. One importer of CACstated that U.S.-produced CAC is of higher quality. Several others stated that availability for “specialty”products is superior for importers of Chinese CAC. The unavailability of pelletized CAC

II-14
from the United States was mentioned by three importers of CAC. With regard to nonsubject countries,several importers of CAC noted that CAC made from coconut shells was available from only nonsubjectsources.
ELASTICITY ESTIMATES
U.S. Supply Elasticity
The domestic supply elasticity for CAC measures the sensitivity of the quantity of CAC suppliedby U.S. producers to changes in the U.S. market price of CAC. The elasticity of domestic supply dependson several factors including the level of excess capacity, the ease with which producers can alterproduction, producers’ ability to shift to production of other products, the existence of inventories, andthe availability of alternative markets for U.S.-produced product. Earlier analysis of these factors,specifically the modest amount of unused capacity, *** exports, and sizeable inventories, indicates thatthe U.S. industry has some ability to increase shipments to the U.S. market; an estimate in the range of 2to 4 is suggested.
U.S. Demand Elasticity
The U.S. demand elasticity for CAC measures the sensitivity of the overall quantity demanded toa change in the U.S. market price of CAC. This estimate depends on factors discussed earlier such as theexistence, availability, and commercial viability of substitute products, as well as the component share ofCAC in the production of any downstream products. The only realistic substitute for CAC in most enduses is RAC. While RAC is not as effective as CAC in many end uses, a large rise in the price in CACmay bring about an increase in the use of RAC. While a movement into RAC in response to a priceincrease is likely, total usage of all activated carbon and RAC will not be responsive to price changes asthere are few alternatives and the products are essential to many end uses (most notably, water treatment). For these reasons staff suggests an elasticity of demand in the range of -0.8 to -1.2. In other words, due tothe availability of a close substitute, purchasers may be sensitive to changes in the price of CAC.
Substitution Elasticity
The elasticity of substitution measures the extent to which the ratio of subject-country imports tothe domestic like product changes in response to changes in their relative prices. This reflects how easilypurchasers switch from the U.S. product to the subject products (or vice versa) when prices change. Theelasticity of substitution depends upon the extent of product differentiation between the domestic andimported products. Product differentiation, in the case of CAC, depends upon such factors as quality,consistency, availability, and reliability of supply. According to responding parties in this investigation,domestic and subject CAC are interchangeable in most end uses. While some end users prefer or insistupon domestic product, the elasticity of substitution is thought to be high—in the range of 4 to 6.

1 California Carbon ***. 2 Acticarb stopped producing in October 2005 and is not currently in operation. Petition, p. 3, n. 6. ***. 3 Cal Pacific ***. 4 Petition, exh. General-1. 5 Petition, p. 3. 6 In response to a question from Commission staff as to whether the five firms named in the petition are the onlyfirms that actually activate carbon, counsel for CIAC stated:
“To our knowledge, that’s correct. Some of our clients also do what’s being characterized asfurther processing, but they don’t include the activation step. There are others that are notrepresented in the proceeding that also do some further processing that does not involveactivation.”
Conference transcript, p. 158 (Heckendorn). 7 ***. Calgon’s questionnaire. 8 Calgon’s Pearlington facility was closed from August 27, 2005, through November 7, 2005, due to damagecaused by Hurricanes Katrina and Rita. In its postconference submission, CIAC argued that petitioner’s (Calgon)claim that it is being materially injured by Chinese imports is “flatly unfounded,” noting that Calgon’s CEO, JohnStanik’s statements in conference calls held on October 26, 2005, and March 29, 2006, concerning the company’searnings in the third and fourth quarters of 2005, addressed the impact of Hurricanes Katrina and Rita on Calgon’sfinancial performance without mentioning subject imports. In part, Mr. Stanik stated:
(continued...)
III-1
PART III: U.S. PRODUCERS’ PRODUCTION, SHIPMENTS, ANDEMPLOYMENT
The Commission analyzes a number of factors in making injury determinations (see 19 U.S.C. §§1677(7)(B) and 1677(7)(C)). Information on the margins of dumping was presented earlier in this reportand information on the volume and pricing of imports of the subject merchandise is presented in Parts IVand V. Information, as it relates to CAC, on the other factors specified is presented in this section and/orPart VI and (except as noted) is based on the questionnaire responses of three firms that accounted forvirtually all of U.S. production during 2003-06.
U.S. PRODUCERS
The petition identified five firms that produced CAC during 2003-06. In addition to Calgon andNorit, California Carbon,1 Acticarb Tailored Products, LLC (Acticarb),2 and Cal Pacific Carbon (CalPacific)3 were listed as producers of the subject product. Petitioners estimated the 2005 production of thelatter three firms to be nearly *** pounds compared with the combined Calgon and Norit production ofmore than *** pounds.4 Petitioners noted that they determined the “universe” of domestic producers inthe following manner.
“Principally as domestic producers of certain activated carbon, petitioners are aware ofthe other producers in the market by virtue of directly competing with them in bids. Many companies that hold themselves out as domestic producers of certain activatedcarbon are actually engaging in reactivation of used activated carbon or other post-production processing of activated carbon that is imported or produced by other domesticproducers.”5 6
Calgon is headquartered in Pittsburgh, PA, with separate CAC and RAC production facilitieslocated in Catlettsburg, KY7 and a CAC production facility in Pearlington, MS.8 It is *** of CAC in the

8 (...continued)“Hurricanes Katrina and Rita both impacted the company’s sales and costs. Regarding sales, theeffects of the hurricanes were two-fold: Hurricane Katrina’s path was directly over our PearlRiver facility resulting in the plant being partially submerged under water. The consequence ofthis was to shutdown the facility, which remains down today (October 26, 2005). This downtimehindered our ability to meet some customer requests. The second effect was the effect that bothhurricanes had on customer carbon and service consumption. Many of our Gulf Coast industrialand municipal customers experienced and continue to experience downtime in their operations.”
CIAC postconference brief, p. 43. 9 In 2006, Calgon accounted for *** percent of U.S. producers’ U.S. shipments of CAC. ***. 10 Conference transcript, p. 15 (O’Brien). Calgon Carbon (Tianjin) Co., Ltd., a Chinese producer/exporter ofsubject product, is a subsidiary of Calgon. 11 http://www.calgoncarbon.com/company/index.html, retrieved March 31, 2006. Calgon Carbon is self-described as the world’s largest manufacturer of granular activated carbon, with production and operations in NorthAmerica, Europe, and Asia. Ibid. 12 Conference transcript, p. 174 (Vander Schaaf). 13 Certain Activated Carbon from China, Investigation No. 731-TA-1103 (Preliminary), USITC Publication 3852,May 2006, p. 13. 14 Calgon also ***. 15 ***. Calgon questionnaire. 16 Hearing transcript, pp. 22-23 (O’Brien). 17 Conference transcript, pp. 26-27 (Thompson). Norit also has separate RAC production facilities in the UnitedStates. Ibid. Norit closed its CHAC production facilities in Marshall, TX, in January 2005. Those facilities wereseparate from the CAC production facilities. In addition to Norit, MeadWestvaco produced CHAC (but no CAC)during the period examined. Additionally, MeadWestvaco ***. 18 In 2006, Norit accounted for *** percent of U.S. producers’ U.S. shipments of CAC. ***.
III-2
United States, accounting for *** percent of 2006 production,9 and also has operations around the world,including China.10 According to its website, Calgon, along with its European operation ChemvironCarbon, is a “global manufacturer and supplier of granular activated carbon, innovative treatmentsystems, value added technologies and services for optimizing production processes and safely purifyingthe environment.”11 During the staff conference in the preliminary phase investigation, counsel for CIACstated that it was “appropriate to at least probe the issue of exclusion of Calgon as a related party” in viewof its imports from and operations in China;12 however, CIAC provided no further discussion of thispotential issue in its postconference submission. In its preliminary determination, the Commission chosenot to exclude Calgon as a related party.13 During 2003-06, Calgon’s imports of CAC from China werethe equivalent of ***, ***, ***, and *** percent, respectively, of its U.S. production.14 15 With respect toits decision to import CAC from China, Calgon stated:
“Our customer base in the United States was encouraging us to purchase Chinesematerial to supply them. They wanted to get the advantages of the low prices for Chinesematerial while having Calgon’s technical support and quality assurance.
We had established relationships with a number of Chinese producers and wewould fulfill our customers’ requests, but it was very clear to us that whatever advantageswe might have in service and quality were secondary to price. If we did not sell themChinese material, we would lose the sale and other importers of Chinese carbon wouldget the sale.”16
Norit is headquartered in Marshall, TX, with CAC production facilities located there as well as inPryor, OK.17 In 2006, Norit accounted for *** percent of U.S. production.18 Norit’s parent company,

19 Conference transcript, p. 27 (Thompson). 20 http://www.norit-ac.com/ retrieved April 3, 2006. 21 Norit ***. 22 California Carbon ***. 23 California Carbon ***. California Carbon accounted for less than *** percent of U.S. producers’ U.S.shipments of CAC. Of California Carbon’s shipments of its U.S.-produced product, ***. California Carbon also***. During 2003-06, its *** pounds, respectively, which were the equivalent of ***. Additionally, CaliforniaCarbon is ***. Ibid.
III-3
Norit NV, is located in the Netherlands and has production facilities there.19 According to its website,Norit is:
“. . .the world’s largest producer of activated carbon and related services. With over 80years of experience, NORIT has grown to produce well over 150 different types ofactivated carbon products, enabling them to offer the most choices, precise fit and bestperformance for any application. NORIT also offers activated carbon reactivation,carbon change out services, and both granular and powdered carbon systems &equipment.”20
Norit is also an importer of CAC from China. During 2003-06, Norit’s imports from China were theequivalent of ***, ***, ***, and *** percent, respectively, of its U.S. production of CAC.21
California Carbon22 is located in Wilmington, CA, where it operates a small production facilityfor CAC as well as a facility for RAC production. According to its ***, *** percent of its operationswere used for the production of ***. In 2006, California Carbon’s production of CAC amounted to ***pounds, or *** percent of total U.S. production.23
Presented in table III-1 is a list of the U.S. CAC producers that responded to the Commission’sproducer questionnaire. Also presented is information concerning each company’s position on thepetition, production locations, and its share of reported 2006 domestic production of CAC.

24 Hearing transcript, pp. 29-30 (Hudgens).
III-4
Table III-1CAC: U.S. producers, positions on the petition, U.S. production locations, and shares of reported2006 production
Firm PositionProductionlocation (s)
Share of 2006reported production
(percent)
Calgon Supports (Petitioner) Kentucky, Mississippi ***
Norit Supports (Petitioner) Oklahoma, Texas ***
California Carbon *** California ***
Total 100.0Source: Compiled from data submitted in response to Commission questionnaires.
U.S. PRODUCERS’ CAPACITY, PRODUCTION, CAPACITY UTILIZATION, SHIPMENT, INVENTORY, AND EMPLOYMENT DATA
Table III-2 presents U.S. producers’ capacity, production, capacity utilization, shipment,inventory, and employment data, for CAC. Capacity was below apparent U.S. consumption of CAC ineach of the years 2003-06. In testimony at the hearing in this investigation, petitioners indicated thatgiven the nature of the CAC production process, it behooves producers to operate at, or near, fullcapacity. In this regard, they stated:
“. . . the nature of the production process requires high capacity utilization for thedomestic producers. Given the very high capital intensive nature of activated carbonproduction and the highly integrated nature of the production process, the domesticproducers are designed for and depend on running at very high capacity utilization ratesto spread the high fixed cost over as much production volume as possible.
The domestic producers operate 24 hours a day, seven days a week, except forscheduled maintenance shutdowns. This condition of competition is particularly relevantto the Commission’s analysis because as U.S. producers have experienced low pricedcompetition from Chinese imports they have been forced to reduce prices significantly tomaintain volumes rather than cut production.”24
With respect to their ability to add to capacity by restarting an idled production line, Calgonstated:
“As I mentioned we have closed some of our production lines. One of them wecould restart. We’d have to make some capital investment to get it completely back intooperation. There are some environmental additions we need to make on the furnaces. Ifwe could see that the demand was going to be there and we could sell it at prices thatwere attractive we would certainly consider investing to restart one of our productionlines. So we could, with that, absorb the growing demand that is in the U.S. Certainlythat would be something we would be considering. But as Ron mentioned, our Board of

25 Hearing transcript, pp. 137-138 (O’Brien). Norit indicated that any capacity it might consider adding in thefuture would be new capacity rather than the restart of an idled production line that would take roughly 18 monthsfrom the time an environmental permit is obtained. Hearing transcript, p. 150 (Thompson) and petitioners’posthearing brief, p. 6, fn. 5.
III-5
Directors obviously would be looking for some assurance that if we made that investmentwe’d be able to generate a return.”25
Table III-2CAC: U.S. capacity, production, capacity utilization, shipments, end-of-period inventories, andemployment-related indicators, 2003-06
* * * * * * *


1 The Commission sent questionnaires to those firms identified in the petition and firms identified by U.S. Customs and Border Protection (“Customs”) as possible importers. 2 One importer, ***, reported imports of RAC. ***. 3 Norit’s nonsubject CAC imports were coal- and peat-based and were produced at its operations in Europe. Hearing transcript, p. 118 (Wruble). 4 For 2003, 2004, 2005, and 2006, coconut-based imports from nonsubject sources accounted for ***,***, ***,and *** percent, respectively, of all nonsubject imports reported by questionnaire respondents. 5 Petitioners’ posthearing brief, exh. 1, pp. 32-33. See also, exh. 10 of petitioners’ posthearing brief.
IV-1
PART IV: U.S. IMPORTS, APPARENT CONSUMPTION, AND MARKET SHARES
U.S. IMPORTERS
The Commission sent importer questionnaires to 61 firms believed to be importers of CAC, aswell as to all U.S. producers.1 Usable questionnaire responses were received from 25 companies thatimported CAC from China for all, or part, of the period 2003-06.2 The 21 firms that reported imports ofChinese CAC in 2006 accounted for 95.9 percent of total CAC imports (based on official statistics) fromChina. The five largest responding importers of CAC from China were ***, collectively accounting for61.0 percent of reported imports of activated carbon from China in 2006. In 2006, GAC, PAC, andpelletized product accounted for 58.6, 23.5, and 17.9 percent, respectively, of shipments of Chinese CAC. Nearly all of the CAC imports from China were coal-based.
Of the 25 companies reporting imports of CAC from China during 2003-06, nine also reportedimports from nonsubject sources. The nine firms accounted for virtually all of CAC imports (based onofficial statistics) from nonsubject sources. With the exception of ***,3 all of the CAC imports fromnonsubject sources were coconut-based.4 *** of CAC imports from nonsubject sources in 2006. Inresponse to Commission questions at the hearing in this investigation concerning end uses of coconut-based CAC, Calgon stated:
“According to internal data from Calgon, cigarette filters and gold miningaccount for ***, there is very little overlap in the ultimate end users of coconut- and coal-based CAC.
An analysis of Calgon’s sales of coal and coconut based carbons illustrates thepoint. As indicated in these data, *** purchase exclusively coal-based CAC and ***purchase exclusively coconut-based CAC. Of the remaining *** purchasers, *** aredistributors that purchase both coconut- and coal-based CAC. These distributors, likeCalgon, in turn resell to end users that generally purchase exclusively one or the otherCAC. Thus, of the *** customers that purchase CAC from Calgon, only *** of thesecustomers purchase both coconut- and coal-based CAC. Based on sales volume, only*** of coconut-based CAC is sold to customers that also purchase coal-based CAC. Consequently, there is extremely limited overlap in the end uses of coconut- and coal-based CAC in the U.S. market. Hence, it would be unlikely that imports of coconut-based CAC would prevent the domestic industry from obtaining a benefit under theorder.”5
In 2006, GAC, PAC, and pelletized product accounted for 89.5, 9.6, and 0.9 percent, respectively,of shipments of nonsubject CAC. A list of responding U.S. importers of CAC, the countries they import

6 Collectively, Sri Lanka, the Philippines, Indonesia, India, and Thailand accounted for *** percent of U.S. CACimports in 2006.
IV-2
from, and their shares of reported 2006 imports from China and nonsubject sources are presented in tableIV-1.
Table IV-1CAC: U.S. importers, countries they import from, and shares (in percent) of 2006 imports
* * * * * * *
U.S. IMPORTS
U.S. imports (based on official statistics) of CAC are presented in table IV-2. In 2006, China wasthe largest exporter of subject CAC to the United States, accounting for *** percent of total imports (on aquantity basis) of CAC, followed (in order) by Sri Lanka, the Philippines, Indonesia, India, and Thailand.6 U.S. imports of CAC and shipments of those imports, as reported by importer questionnaire respondents,are presented in table C-2.
Table IV-2CAC: U.S. imports, by sources, 2003-06, based on adjusted official Commerce statistics
* * * * * * *
Changes in importers’ operations since January 1, 2003 were reported by six firms and arepresented in table IV-3.
Table IV-3CAC: U.S. importers and changes in operations since January 1, 2003
* * * * * * *
NEGLIGIBILITY
The Tariff Act provides for the termination of an investigation if imports of the subject productfrom a subject country are less than 3 percent of total imports, or, if there is more than one such country,their combined share is less than or equal to 7 percent of total imports, during the most recent 12 monthsfor which data are available preceding the filing of the petition–in this case March 2005 to February 2006. The shares (in percent) of the total quantity of U.S. imports, by sources, are presented in table IV-4.

IV-3
Table IV-4CAC: U.S. imports, by sources, and shares of total imports (in percent), March 2005-February2006
Imports (1,000 pounds)
Share of total imports(percent)
China 77,943 58.7
Nonsubject countries 54,839 41.3
Total 132,782 100.0
Source: Compiled from official Commerce statistics, using proportions gathered from questionnaire data toexclude imports of CHAC.
APPARENT U.S. CONSUMPTION
Data on U.S. consumption of CAC are presented in table IV-5. The quantity of U.S. consumptionof CAC increased by *** percent from 2003 to 2006. The value of U.S. consumption of CAC increasedby *** percent from 2003 to 2006.
Table IV-5CAC: U.S. producers’ U.S. shipments, U.S. imports, by sources, and apparent U.S. consumption, 2003-06
* * * * * * *
U.S. MARKET SHARES
Market shares for CAC are presented in table IV-6. The U.S. producers’ market share of CACdecreased irregularly from 2003 through 2006, both by quantity and value.
Table IV-6CAC: U.S. consumption and market shares, 2003-06
* * * * * * *
RATIO OF IMPORTS TO U.S. PRODUCTION
Information concerning the ratio of imports to U.S. production of CAC is presented in table IV-7.
Table IV-7CAC: Ratio of U.S. imports to U.S. production, by sources, 2003-06
* * * * * * *


1 *** 2 Petition, p. 13. 3 Petitioners’ posthearing brief, exh. 1, p. 2. 4 Hearing transcript, p. 58 (Thompson). 5 Petition, pp. 51-61. 6 These estimates are based on HTS subheading 3802.10.00. 7 *** also produce RAC. In this section, they are discussed only as producers of CAC. The discussion ofproducers of RAC refers to the six additional responding commercial producers. *** is treated as a producer of bothCAC and RAC even though CAC ***. 8 The four responding producers of RAC that arrange for shipment of the product reported that transportation costsaccounted for 13-15 percent of total costs.
V-1
PART V: PRICING AND RELATED INFORMATION
FACTORS AFFECTING PRICES
Raw Materials
The production of CAC begins with materials that contain a high level of carbon. Such materialsinclude, but are not limited to, coal (bituminous, lignite, and anthracite), wood, coconut shells, olivestones, and peat.1 According to petitioners, coal is the raw material most widely used by both U.S. andChinese producers of CAC.2 In the petitioners’ posthearing brief, Calgon reported that coal accounted for *** percent of total costs while Norit *** reported that coal accounted for *** percent of total costs.3 As shown in figure V-1, the price of coal has risen over the period for which data were collected(although the price has leveled off in 2006). Prices in the third quarter of 2006 were 59 percent higherthan they were in the first quarter of 2003. During the hearing, however, petitioners pointed out that theyuse a very specialized type of coal in the production of CAC.4 The coal prices presented here, thereforemay not capture their true raw material costs. In addition, producers of CAC often engage in long-termcontracts for coal inputs. Such contracts will cause the actual price paid for coal inputs to differ from themarket price. Other raw materials used in the production of CAC include pitch, phosphoric acid, oxygen,steam, and water.5 Overall, raw materials accounted for *** percent of the cost of goods sold for CAC in2006, up from *** percent in 2005 and *** percent in 2003. Electricity and natural gas are also used inthe production process of CAC and accounted for *** percent of the total costs of good sold in 2006, up*** from *** percent in 2003.
Transportation Costs to the U.S. Market
Transportation costs for CAC from China to the United States (excluding U.S. inland costs) in2006 are estimated to be equivalent to approximately 20.0 percent of the customs value for product fromChina, down from 24.4 percent in 2005. These estimates are derived from official import data andrepresent the transportation and other charges on imports valued on a c.i.f. basis, as compared withcustoms value.6
U.S. Inland Transportation Costs
Reported U.S. inland transportation costs for CAC were approximately *** percent for Calgonand *** percent for Norit.7 ***.8 Reported U.S. inland transportation costs ranged from 0 to 30 percentfor the 27 responding importers of CAC from China, with all but one reporting transportation costs of 20percent or less, and 16 reporting costs of less than 10 percent.

9 Source: IMF International Financial Statistics. Downloaded from http://imfstatistics.org/imf/ifsBrowser.aspx,March 5, 2007.
V-2
Figure V-1Coal prices: Average domestic price of coal to industrial plants, January-March 2003 - July-September 2006
Source: Quarterly Coal Reports (various issues, 2003-06), Table 25 - Average Price of Coal Receipts at OtherIndustrial Plants. Energy Information Administration, Office of Coal, Nuclear, Electric, and Alternate Fuels, U.S.Department of Energy. Available at http://tonto.eia.doe.gov/FTPROOT/coal/qcrhistory.htm.
Producers and importers also were asked to estimate the percentage of their sales that occurredwithin certain distance ranges. Norit reported shipping *** percent of its sales under 100 miles andCalgon reported that *** percent of its sales were shipped less than 100 miles. California Carbonreported that *** percent of its sales were shipped under 100 miles. Calgon reported shipping ***percent of sales between 100 and 1,000 miles, Norit reported that *** percent of its sales were shippedbetween 100 and 1,000 miles, and California Carbon reported that *** percent of its sales were shippedbetween 100 and 1,000 miles. Finally, *** reported shipping *** percent of its sales more than 1,000miles, *** reported that *** percent of its sales were shipped more than 1,000 miles, and CaliforniaCarbon reported that *** percent of its sales were shipped over 1,000 miles. One of six responding U.S.producers of RAC reported no shipments made outside of 100 miles while the remaining five reportedthat the majority (from 60 to 95 percent) of their shipments were further than 100 miles, with threereporting that 30 percent or more were shipped outside of 1,000 miles. Six of 27 responding importers ofCAC reported shipping at least 50 percent of their sales more than 1,000 miles; 11 reported shipping atleast 50 percent of their sales between 100 and 1,000 miles; and 9 reported shipping at least 50 percent oftheir sales less than 100 miles, with 3 of those shipping 100 percent of their sales less than 100 miles.
Exchange Rates
From 2000 to June of 2005, the Chinese currency was pegged at 8.28 yuan per U.S. dollar. There was a small revaluation in the third quarter of 2005, raising the value of the Chinese currency to8.14 yuan per dollar, after which the yuan was moved to a crawling peg against the dollar. The yuanappreciated further into the fourth quarter of 2006, averaging 7.86 yuan per dollar during that quarter.9

V-3
PRICING PRACTICES
Pricing Methods
CAC is sold on both a spot and a contract basis. *** U.S. producers of CAC reported that at least*** percent of their sales were on a spot basis, with the remaining sales *** long- and short-termcontracts. Short-term contracts last *** while long-term contracts range from *** in length. The thirdresponding U.S. producer of CAC reported that *** sales were made on a spot basis. Five of sixresponding U.S. producers of RAC reported that a majority of their commercial sales were on a contractbasis, with two reporting that over *** percent of their sales were on a long-term contract basis. Theremaining U.S. producer of RAC reported that *** percent of its sales were made on a spot basis. Sevenof 27 responding importers of CAC reported that 100 percent of their sales were on a spot basis, with sixmore reporting that at least 50 percent of their sales were on a spot basis. Fourteen of the 27 respondingimporters of CAC reported that more than half of their sales were made on a contract basis. Of those 14importers of CAC, seven reported that most of their sales were on a long-term contract basis and sevenreported that most of their sales were on a short-term contract basis.
While *** reported having a price list for new customers, *** responding producers of CACreported that prices are determined primarily on a transaction-by-transaction basis and that many factorsinfluence the final price. *** reported that they ***. ***. *** reported ***. *** reported determiningprice based on costs and standard margins while two reported basing prices on the market and theremaining *** reported using either transaction-by-transaction negotiations or contracts for multipleshipments. One U.S. producer of RAC reported that ***, while the remaining five reported no discountpolicy. While a majority (18 of 28) of responding importers of CAC reported determining price on atleast some of their sales on a transaction-by-transaction basis, five reported using a price list for some(usually the smaller) or all of their customers. Other importers of CAC determine prices based on costsand standard margins or on previous bid prices. Fifteen responding importers of CAC reported givingdiscounts based on, among other things, quantity, long-term orders, and early payment. The remaining 13importers of CAC reported that they either do not give discounts or have no formalized discount policy.
PRICE DATA
The Commission requested U.S. producers and importers of CAC to provide quarterly data forthe total quantity and f.o.b. (U.S. point of shipment) value of CAC that was shipped to unrelatedcustomers in the U.S. market. Data were requested for the period January 2003 to December 2006. Theproducts for which pricing data were requested are defined as follows:
Product 1.–Granular activated carbon that is steam activated from coal (bituminous, lignite, andanthracite), unwashed, no more than 15 percent greater than 8 mesh and no more than 4 percentunder 30 mesh, iodine no. 900 mg/g min, moisture 2% max;
Product 2.– Granular activated carbon that is steam activated from coal (bituminous, lignite, andanthracite), unwashed, no more than 5 percent greater than 12 mesh and no more than 4 percentunder 40 mesh, iodine no. 1000 mg/g min, moisture 2% max; and
Product 3.–Powder activated carbon that is steam activated from coal (bituminous, lignite, andanthracite), unwashed, particle size 90% min, 325 mesh, iodine no. 700 mg/g min, moisture 5%max.

10 *** In addition, five U.S. producers of RAC also supplied prices for the reactivated counterparts to the productslisted here. These data are available in app. E. 11 See Part VI of this report for more details concerning the ***.
V-4
Three U.S. producers of CAC and 21 importers of CAC from China provided usable pricing datafor sales of the requested products, although not all firms reported pricing for all quarters.10 Tables V-1through V-3 and figures V-2 through V-4 present f.o.b. (U.S. point of shipment) selling prices for thethree CAC products defined above produced and sold in the United States as well as for productsproduced in China and imported into the United States. By quantity, pricing data reported by respondingfirms in 2003 through 2006 accounted for *** percent of reported U.S. commercial shipments of U.S.-produced CAC and 41.8 percent of reported U.S. commercial shipments of Chinese-produced CAC.
Price Trends
U.S. producers’ average prices for product 1 showed no discernable trend over the period forwhich data were collected. While prices moved from quarter to quarter, no sustained rise or fall isevident. Overall, prices for product 1 fell by *** percent between January-March 2003 and October-December 2006. Prices for product 2 fell by *** percent between January-March 2003 and October-December 2006. This decrease was punctuated by a ***-percent drop in July-September 2006 followedby a ***-percent rise in the final quarter of the period. The outlying quarter corresponds to *** in thatquarter. ***. Prices for product 3, *** of the three pricing products, show little movement over thesample until showing a *** upward trend in the fourth quarter of 2006. Overall, prices in October-December 2006 were *** percent higher than in January-March 2003. *** of this increase is due to theprice increase observed in the final quarter of 2006. ***. ***. ***.11

V-5
Table V-1CAC: Weighted-average f.o.b. prices and quantities of domestic and imported product 11 andmargins of underselling/(overselling), by quarters, January 2003-December 2006
Period
United States China
Price(per pound)
Quantity(pounds)
Price(per pound)
Quantity(pounds)
Margin(percent)2
2003: Jan.-Mar. $*** *** $*** *** 34.2
Apr.-June *** *** *** *** 26.7
July-Sept. *** *** *** *** 30.1
Oct.-Dec. *** *** *** *** 27.1
2004: Jan.-Mar. *** *** *** *** 25.1
Apr.-June *** *** *** *** 25.4
July-Sept. *** *** *** *** 28.8
Oct.-Dec. *** *** *** *** 27.7
2005:Jan.-Mar. *** *** *** *** 24.1
Apr.-June *** *** *** *** 15.4
July-Sept. *** *** *** *** (7.8)
Oct.-Dec. *** *** *** *** 43.5
2006: Jan.-Mar. *** *** *** *** 58.3
Apr.-June *** *** *** *** 39.2
July-Sept. *** *** *** *** 37.7
Oct.-Dec. *** *** *** *** 18.2
1 Product 1.–Granular activated carbon that is steam activated from coal (bituminous, lignite, and anthracite),unwashed, no more than 15 percent greater than 8 mesh and no more than 4 percent under 30 mesh, iodine no.900 mg/g min, moisture 2% max. 2 Based on unrounded data.
Source: Compiled from data submitted in response to Commission questionnaires.

V-6
Table V-2CAC: Weighted-average f.o.b. prices and quantities of domestic and imported product 21 andmargins of underselling/(overselling), by quarters, January 2003-December 2006
Period
United States China
Price(per pound)
Quantity(pounds)
Price(per pound)
Quantity(pounds)
Margin(percent)2
2003: Jan.-Mar. $*** *** $*** *** 49.9
Apr.-June *** *** *** *** 52.5
July-Sept. *** *** *** *** 48.7
Oct.-Dec. *** *** *** *** 42.7
2004: Jan.-Mar. *** *** *** *** 50.5
Apr.-June *** *** *** *** 49.7
July-Sept. *** *** *** *** 36.7
Oct.-Dec. *** *** *** *** 41.3
2005: Jan.-Mar. *** *** *** *** 45.4
Apr.-June *** *** *** *** 47.1
July-Sept. *** *** *** *** 38.7
Oct.-Dec. *** *** *** *** 29.4
2006: Jan.-Mar. *** *** *** *** 52.5
Apr.-June *** *** *** *** 57.7
July-Sept. *** *** *** *** 0.6
Oct.-Dec. *** *** *** *** 18.8
1 Product 2.– Granular activated carbon that is steam activated from coal (bituminous, lignite, and anthracite),unwashed, no more than 5 percent greater than 12 mesh and no more than 4 percent under 40 mesh, iodine no.1000 mg/g min, moisture 2% max. 2 Based on unrounded data.
Source: Compiled from data submitted in response to Commission questionnaires.

V-7
Table V-3CAC: Weighted-average f.o.b. prices and quantities of domestic and imported product 31 andmargins of underselling/(overselling), by quarters, January 2003-December 2006
Period
United States China
Price(per pound)
Quantity(pounds)
Price(per pound)
Quantity(pounds)
Margin(percent)2
2003: Jan.-Mar. $*** *** $*** *** 36.9
Apr.-June *** *** *** *** 29.1
July-Sept. *** *** *** *** 33.1
Oct.-Dec. *** *** *** *** (3.3)
2004: Jan.-Mar. *** *** *** *** 17.9
Apr.-June *** *** *** *** 23.7
July-Sept. *** *** *** *** 23.4
Oct.-Dec. *** *** *** *** 9.4
2005: Jan.-Mar. *** *** *** *** 19.9
Apr.-June *** *** *** *** 16.6
July-Sept. *** *** *** *** 14.9
Oct.-Dec. *** *** *** *** 11.9
2006: Jan.-Mar. *** *** *** *** 36.6
Apr.-June *** *** *** *** 15.1
July-Sept. *** *** *** *** (3.2)
Oct.-Dec. *** *** *** *** 0.1
1 Powder activated carbon that is steam activated from coal (bituminous, lignite, and anthracite), unwashed,particle size 90% min, 325 mesh, iodine no. 700 mg/g min, moisture 5% max. 2 Based on unrounded data.
Source: Compiled from data submitted in response to Commission questionnaires.

V-8
Figure V-2CAC: Weighted-average f.o.b. prices of domestic and imported product 1, by quarters, January 2003-December 2006
* * * * * * *
Figure V-3CAC: Weighted-average f.o.b. prices of domestic and imported product 2, by quarters, January 2003-December 2006
* * * * * * *
Figure V-4CAC: Weighted-average f.o.b. prices of domestic and imported product 3, by quarters, January 2003-December 2006
* * * * * * *
After rising unevenly by *** percent from January-March 2003 to July-September 2005, pricesof U.S. shipments of product 1 imported from China fell by *** percent in the ensuing two quarters. Prices then rebounded quickly through 2006 and in October-December 2006 were *** percent higherthan they were in January-March 2003. Prices of U.S. shipments of product 2 imported from China roseirregularly from January-March 2003 to October-December 2005, increasing *** percent in that time. These prices declined in the next two quarters before rising through the end of 2006; overall, these priceswere *** percent higher at the end of the period as compared to the beginning. Prices of U.S. sales ofproduct 3 imported from China rose irregularly throughout the period and ended the period at a level ***percent higher than they were in the beginning of the period.
Price Comparisons
Prices of imports from China were lower than prices of U.S.-produced product 1 in all but onequarter during the period for which data were collected; margins of underselling for product 1 rangedfrom 15.4 to 58.3 percent. The average margin of underselling over the period for product 1 was 29.6percent. In one quarter, the price of Chinese product 1 was 7.8 percent higher than the price of U.S.-produced product 1. For product 2, prices of imports from China were lower than the prices of U.S.-produced product in all quarters during the period for which data were collected. Margins of undersellingfor product 2 ranged from 0.6 percent in July-September 2006 (a quarter in which the price of the U.S.-produced product was *** due to ***) to 57.7 percent in April-June 2006. Margins for product 2 wereover 40 percent in 10 of the first 11 quarters of the period for which data were collected, but shranksignificantly in the last half of 2006. The average margin of underselling for product 2 over the entireperiod was 41.4 percent. For product 3, the prices of product imported from China were below prices forthe U.S. product in 14 of 16 quarters. Over the entire period, margins of underselling ranged from 0.1 to36.9 percent; the average margin of underselling for product 3 was 20.6 percent. In two quarters, theChinese product was priced 3.2 and 3.3 percent above the U.S. product. U.S.-produced product 3accounted for *** percent of sales of product 3 in the United States over the period for which data werecollected.

12 Petitioners provided information on *** (Petitioners posthearing brief, Responses to Commissioners questions,pp. 7-8.) Petitioner notes that in each case, ***.
V-9
LOST SALES AND LOST REVENUES
During the preliminary phase of this investigation, the petitioners provided a list of *** allegedlost sales to Chinese competitors totaling $*** between January 2003 and December 2005. Staffattempted to contact customers associated with $***, or approximately *** percent, of those lost sales. Inaddition, petitioners alleged another $*** per year of lost revenues attributable to lower prices on retainedcontracts caused by competition from Chinese producers. Staff was able to confirm $*** of the alleged$*** in total lost sales, and *** of the alleged *** in annual lost revenue. Customers rejected theallegation for various reasons in $*** of the total lost sales. In the largest of the rejected allegations(accounting for $*** in lost sales), the purchaser stated that while a Chinese supplier did win the initialbid, the supplied product did not pass quality tests and was replaced by domestically supplied CAC. Ofthose contacted, staff was unable to obtain information on $*** in alleged lost sales and $*** in lostrevenue. In questionnaire responses submitted for the final phase of this investigation, domesticproducers alleged an additional 31 lost sales totaling $*** that took place during 2006. Staff was able toconfirm $*** of those lost sales while purchasers disagreed with *** alleged lost sales totaling $***. Staff was unable to obtain responses pertaining to $*** in alleged lost sales. Despite the large number of“no” responses, the alleged lost sales in 2006 were overwhelmingly confirmed.12
By and large, price was the reason for choosing the Chinese product. Many of the lost sales wereto municipal water treatment facilities which, in many cases, must accept the lowest-priced productprovided that it meets the required standards. A few respondents indicated that while the lowest-pricedoption was of Chinese product, the product did not pass initial tests or performed poorly upon use. As aresult, these purchasers have switched or plan to switch back to domestically produced CAC. Since mostof the alleged lost sales are from accounts with open annual bids, any bid lost to a supplier of Chineseproduct, regardless of who won the contract the previous year, was counted as a lost sale. Information onalleged lost sales and lost revenues can be seen in tables V-4, V-5, and V-6.
Table V-4 CAC: U.S. producers’ lost revenue allegations, 2003-05
* * * * * * *
Table V-5CAC: U.S. producers’ lost sales allegations, 2003-05
* * * * * * *
Table V-6CAC: U.S. producers’ lost sales allegations, 2006
* * * * * * *


1 Staff verified Calgon’s questionnaire response, and the changes have been incorporated into the report. SeeMemorandum to the Commission, INV-EE-014, February 15, 2007. 2 A third firm, ***, stated that it could not provide financial data on CAC, but did provide data for production,shipment, and pricing. Differences between the aggregated data on shipments and sales were *** in 2006. *** dataare included in app. E, operations on RAC. 3 At the Commission’s hearing, personnel from Norit and Calgon testified that the firms were able to raise pricesand win back customers after the petition was filed and the preliminary duties were established. Hearing transcript,pp. 68-69, 93-94 (Thompson and O’Brien). They cautioned that the improvement in financial results in 2006 was“slight-to-modest” (hearing transcript, p. 70 (O’Brien)), partly because of the time lag between winning a bid andshipment of material against the sale. Hearing transcript, p. 95 (O’Brien). Petitioners stated that their operatingprofits have declined *** although the domestic industry experienced “modest improvement as a result of theantidumping case” in 2006. Also, see petitioners’ posthearing brief, p. 13, exh. 1, pp. 4-5 (operating results), p. 11(2006 improvement), and exh. 2 (operating results by firm). There would be an expected lag between winning bidsand gaining higher prices and improvement in operating results because such revenues would only be recognized atthe time of shipment in accordance with accounting principles of revenue recognition generally accepted in theUnited States. 4 Petitioners’ postconference brief, exh. 1, p. 19. Also, see petitioners’ posthearing brief, exh. 1, p. 41.
VI-1
PART VI: FINANCIAL EXPERIENCE OF U.S. FIRMS
BACKGROUND
Two firms, Calgon1 and Norit, provided production, shipment, and financial data on theiroperations on CAC. Each of them reported on a calendar-year basis, and these data accounted for ***U.S. production of CAC in 2006.2
OPERATIONS ON CAC
The results of U.S. firms’ operations on CAC (table VI-1) are briefly summarized here. Total netsales quantities decreased irregularly between 2003 and 2006 although sales values and sales unit values(representing the combined data of Calgon and Norit) increased *** between the two years. All threemetrics declined from 2003 to 2005, and then all three rebounded and approximated or exceeded 2003values. The cost of raw materials and other factory costs (factory overhead) accounted for much of theoverall increase in the industry’s cost of goods sold (“COGS”) between 2003 and 2006 even though laborand energy costs also rose. Selling, general, and administrative (“SG&A”) expenses declined irregularlybetween 2003 and 2006. The industry’s operating *** between 2005 and 2006, attributable to an increasein the ***.3
Table VI-1CAC: Results of operations of U.S. firms, 2003-06
* * * * * * *
In table VI-1, the data of *** differ in several important respects from those of ***: ***. Thesedifferences were ascribed to several factors, including *** between the two firms.4 ***. The rawmaterial input for the granular product reportedly is a harder (bituminous) coal that costs more than the

5 Both Mr. O’Brien and Mr. Thompson testified regarding coal costs. They stated that Calgon and Norit purchasecoal on long-term and shorter-term (one-to-two-year) contracts, and that coal purchase contracts increasingly haveprice escalator clauses. Hearing transcript, pp. 56-58 (O’Brien and Thompson). Compare petitioners’ posthearingbrief, exh. 1, p. 23 *** with exh. 9 (EIA price series for Eastern coals by type of coal). Hence, any comparison withreported spot market prices is not likely to be apt. 6 Hearing transcript, pp. 59 and 99 (Thompson), pp. 60 and 99 (O’Brien), and p. 98 (Rester). 7 Hearing transcript, pp. 124-125 (Thompson) and pp. 126-127. 8 For a discussion and price series of coal and natural gas, see petitioners’ postconference brief, pp. 35-36 andexh. 5. Also, see petitioners’ posthearing brief, exh. 1, p. 2 (ratios of coal costs to total raw materials and COGS in2006 by firm) and p. 23 (*** coal costs by type of coal). With respect to natural gas and electricity costs, seepetitioners’ posthearing brief, exh. 1, p. 40.
VI-2
soft (lignite) coal used to produce the powdered product;5 ***.6 Norit and Calgon consume natural gasduring the production process, which has increased in cost,7 and ***.
Sales and cost data for operations on CAC on a firm-by-firm basis are shown in table VI-2.
Table VI-2CAC: Results of operations of U.S. producers, by firm, 2003-06
* * * * * * *
Raw materials and energy represent a large component of total COGS. The raw material costs ofCAC are chiefly composed of the costs of coal.8 The ratio of raw material costs to total COGS, the ratioof raw material costs to sales, and the average unit value of raw materials rose between 2003 and 2005,but fell between 2005 and 2006. The ratio of energy costs to total COGS, the ratio of energy costs tosales, and the average unit value of energy costs rose between 2003 and 2006. These data are shown intable VI-3.
Table VI-3CAC: Raw material and energy costs, by firm, 2003-06
* * * * * * *
Changes in the operating income of these firms are further evidenced by a variance analysis thatshows the effects of prices and volume on net sales and of costs and volume on their total costs. Becausethe usefulness of the analysis may be diminished by the product mix and cost differences *** at the endof table VI-4.
Table VI-4CAC: Variance analysis on results of operations, 2003-06
* * * * * * *
This analysis shows that the decrease in the industry’s operating income between 2003 and 2006of $*** generally was attributable to combined net cost/expense *** and lower sales volume that weregreater than the favorable price variance ***. However, the mix of favorable and unfavorable variances*** differed considerably and shifted between the full calendar years, as depicted by the data in table VI-4.

9 Petitioners’ postconference brief, exh. 14. Also, see hearing transcript, pp. 16-18 (Thompson) and p. 21(O’Brien). 10 ***. 11 Also, see hearing transcript, pp. 21 and 25 (O’Brien). 12 ***.
VI-3
CAPITAL EXPENDITURES AND RESEARCH AND DEVELOPMENT EXPENSES
*** reported capital expenditures and research and development (“R&D”) expenses for CAC thatare shown in table VI-5. It appears that the primary purpose of ***.9
Table VI-5CAC: Capital expenditures and R&D expenses, by firm, 2003-06
* * * * * * *
ASSETS AND RETURN ON INVESTMENT
The Commission’s questionnaire requested data on assets used in the production, warehousing,and sale of CAC to compute return on investment (“ROI”) for 2003 to 2006. The data for total net salesand operating income are from table VI-1. Operating income was divided by total net sales, resulting inthe operating income ratio. Total net sales was divided by total assets, resulting in the asset turnoverratio. The operating income ratio was then multiplied by the asset turnover ratio, resulting in ROI; theexpanded form of this equation shows how the profit margin and assets turnover ratio interact todetermine the return on investment. These data and calculations are shown in table VI-6.
Table VI-6CAC: Value of assets used in the production, warehousing, and sale, and return on investment,2003-06
* * * * * * *
CAPITAL AND INVESTMENT
The Commission requested U.S. producers to describe any actual or anticipated negative effectsof imports of CAC from China on their firms’ growth, investment, and ability to raise capital ordevelopment and production efforts (including efforts to develop a derivative or more advanced versionof the product). U.S. producer responses are presented on the following page.
Actual Negative Effects10
Calgon: ***.11 ***.Norit ***.
Anticipated Negative Effects12
Calgon ***.Norit ***.


1 Of the eight firms, seven are producer/exporters, while one is an exporter only. ***. 2 Twenty-four firms, 19 of which exported CAC to the United States, provided useable data in the preliminaryphase of this investigation. The exports to the United States of these firms were equivalent to 56.4 percent of CACU.S. imports from China in 2005. ***. Seventeen firms noted that CAC represented 100 percent of their firm’s totalsales in 2005, with only two noting that it represented less than 50 percent.
VII-1
PART VII: THREAT CONSIDERATIONS
The Commission analyzes a number of factors in making threat determinations (see 19 U.S.C. §1677(7)(F)(i)). Information on the volume and pricing of imports of the subject merchandise is presentedin Parts IV and V; and information on the effects of imports of the subject merchandise on U.S.producers’ existing development and production efforts is presented in Part VI. Information oninventories of the subject merchandise; foreign producers’ operations, including the potential for“product-shifting;” any other threat indicators, if applicable; and any dumping in third-country markets,follows.
THE INDUSTRY IN CHINA
Table VII-1 presents data provided by Chinese producers/exporters with respect to their CACoperations in China. Eight firms, which exported CAC to the United States, provided useable data.1 Theexports to the United States of these firms were equivalent to *** percent of CAC U.S. imports fromChina in 2006. One firm noted that CAC represented 100 percent of its firm’s total sales in 2005, fourstated that CAC accounted for more than 90 percent of their sales, one firm reported CAC as 60 percentof its sales, and one stated that CAC accounted for 30 percent of its sales.2

VII-2
Table VII-1CAC: Chinese production capacity, production, shipments, and inventories, 2003-06 and projected 2007-08
Item
Actual experience Projections
2003 2004 2005 2006 2007 2008
Quantity (1,000 pounds)
Capacity 36,755 58,300 55,900 55,100 57,100 58,100
Production 36,155 47,296 52,095 50,551 50,131 51,992
End of period inventories 7,436 7,749 12,151 15,064 10,973 12,473
Shipments:Internal consumption 0 4,951 6,991 8,478 6,920 6,920
Home market 5,389 8,158 6,701 12,325 12,049 12,750
Exports to--The United States 20,839 32,854 27,038 27,209 19,321 19,487
European Union 19,940 22,426 21,378 13,055 21,092 23,132
Asia 11,388 14,674 13,318 22,110 24,824 27,146
All other markets 3,152 3,235 3,223 3,181 3,888 4,232
Total exports 55,320 73,188 64,957 65,555 69,125 73,997
Total shipments 60,709 86,298 78,649 86,358 88,094 93,667
Ratios and shares (percent)
Capacity utilization 98.4 81.1 93.2 91.7 87.8 89.5
Inventories to production 20.6 16.4 23.3 29.8 21.9 24.0
Inventories to total shipments 12.2 9.0 15.4 17.4 12.5 13.3
Share of total quantity of shipments:Internal consumption 0.0 5.7 8.9 9.8 7.9 7.4
Home market 8.9 9.5 8.5 14.3 13.7 13.6
Exports to--The United States 34.3 38.1 34.4 31.5 21.9 20.8
European Union 32.8 26.0 27.2 15.1 23.9 24.7
Asia 18.8 17.0 16.9 25.6 28.2 29.0
All other markets 5.2 3.7 4.1 3.7 4.4 4.5
All export markets 91.1 84.8 82.6 75.9 78.5 79.0
Note.–Because of rounding, figures may not add to the totals shown.
Source: Compiled from data submitted in response to Commission questionnaires.

3 Norit’s nonsubject CAC imports were coal- and peat-based and were produced at its operations in Europe. Hearing transcript, p. 118 (Wruble). 4 For 2003, 2004, 2005, and 2006, coconut-based imports from nonsubject sources accounted for ***, ***, ***,and *** percent, respectively, of all nonsubject imports reported by questionnaire respondents. 5 Questionnaires were sent to ***. 6 ***.
VII-3
NONSUBJECT PRODUCERS/EXPORTERS
As noted earlier in the report, the nine firms that reported imports of CAC from nonsubjectcountries accounted for virtually all of CAC imports (based on official statistics) from those sources. With the exception of ***,3 all of the CAC imports from nonsubject sources were coconut-based.4 *** ofCAC imports from nonsubject sources in 2006. No producers/exporters from nonsubject sourcesresponded to the Commission’s request for information.5 6 With respect to the possibility of nonsubjectimports replacing Chinese imports in the event of an antidumping order, petitioners stated:
“The Commission should not assume that the imposition of antidumping duties willnecessarily lead to the replacement of Chinese imports by any third country source ofactivated carbon. Petitioners’ assumption is that dumped Chinese imports will largely bereplaced by non-dumped Chinese imports at higher prices dictated by the discipline of theorder . . . To the extent that some replacement occurs from third countries, as discussed inthe body of the brief, it will be at higher, non-dumped prices or will be more expensivecoconut-based CAC. In either case, the industry will continue to benefit from any order.. . .
In fact, the availability of such replacement material, particularly coal-basedcarbons, is limited. NORIT and Calgon have world-wide sales networks and theirproducts are exported and sold to various countries. Those countries that require coal-based CAC and do not produce their own in sufficient quantity generally will purchase itfrom either the United States or China, the two largest coal-based CAC producingcountries. To the extent that China exports more CAC to third countries rather than tothe United States as a result of this case, it will free current U.S. export production for theU.S. market.
Currently, China and the United States supply nearly all of the import needs forcoal-based CAC world-wide . . . coal-based products are basically produced in the UnitedStates and China, and really, not any significance in volume outside of that, at least froma bituminous coal standpoint.
NORIT also has a coal based operation in Germany from which it imports CAC tothe U.S. The only remaining coal-based operations in the world that export to asignificant degree is Australia, which has not been a large participant in the United Statesmarket and does not have the capacity to replace the Chinese producers here. The recorddoes not identify any other major exporters of coal-based CAC, and there are no othersuch coal-based CAC industries on the scale of those in the United States and China inthe world. . . .
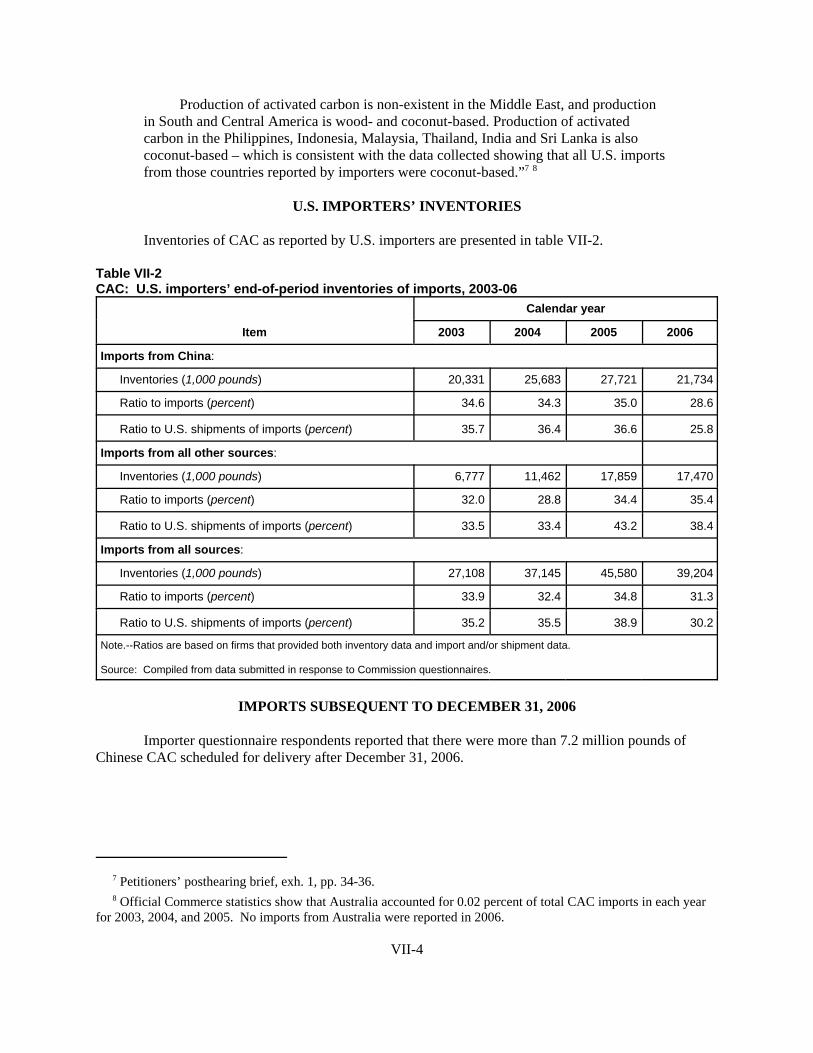
7 Petitioners’ posthearing brief, exh. 1, pp. 34-36. 8 Official Commerce statistics show that Australia accounted for 0.02 percent of total CAC imports in each yearfor 2003, 2004, and 2005. No imports from Australia were reported in 2006.
VII-4
Production of activated carbon is non-existent in the Middle East, and productionin South and Central America is wood- and coconut-based. Production of activatedcarbon in the Philippines, Indonesia, Malaysia, Thailand, India and Sri Lanka is alsococonut-based – which is consistent with the data collected showing that all U.S. importsfrom those countries reported by importers were coconut-based.”7 8
U.S. IMPORTERS’ INVENTORIES
Inventories of CAC as reported by U.S. importers are presented in table VII-2.
Table VII-2CAC: U.S. importers’ end-of-period inventories of imports, 2003-06
Item
Calendar year
2003 2004 2005 2006
Imports from China:
Inventories (1,000 pounds) 20,331 25,683 27,721 21,734
Ratio to imports (percent) 34.6 34.3 35.0 28.6
Ratio to U.S. shipments of imports (percent) 35.7 36.4 36.6 25.8
Imports from all other sources:
Inventories (1,000 pounds) 6,777 11,462 17,859 17,470
Ratio to imports (percent) 32.0 28.8 34.4 35.4
Ratio to U.S. shipments of imports (percent) 33.5 33.4 43.2 38.4
Imports from all sources:
Inventories (1,000 pounds) 27,108 37,145 45,580 39,204
Ratio to imports (percent) 33.9 32.4 34.8 31.3
Ratio to U.S. shipments of imports (percent) 35.2 35.5 38.9 30.2
Note.--Ratios are based on firms that provided both inventory data and import and/or shipment data.
Source: Compiled from data submitted in response to Commission questionnaires.
IMPORTS SUBSEQUENT TO DECEMBER 31, 2006
Importer questionnaire respondents reported that there were more than 7.2 million pounds ofChinese CAC scheduled for delivery after December 31, 2006.

9 Petitioners’ postconference brief, exh. 1, p. 5, responding to a question from the Commission staff. See also,petitioners’ postconference brief, exh. 11.
VII-5
ANTIDUMPING DUTY ORDERS IN THIRD-COUNTRY MARKETS
An antidumping order was originally put into place covering imports of PAC from China (bothcertain activated and chemically activated) into the European Union (EU) in June 1996, with anantidumping rate of 66.8 percent. In June 2002, the EU set new antidumping duties of 323 Euros/ton(@$0.18/lb.) on PAC imports from China, replacing the 66.8-percent duty set in June 1996.9

A-1
APPENDIX A
FEDERAL REGISTER NOTICES


66793 Federal Register / Vol. 71, No. 221 / Thursday, November 16, 2006 / Notices
Total Estimated Burden Hours: 8,500. Status of the proposed information
collection: Extension of a currently approved collection.
Authority: Section 3506 of the Paperwork Reduction Act of 1995, 44 U.S.C. Chapter 35, as amended.
Dated: November 8, 2006. Merrie Nichols-Dixon, Acting Deputy Assistant Secretary, Office of Policy, Program and Legislative Initiative. [FR Doc. E6–19299 Filed 11–15–06; 8:45 am] BILLING CODE 4210–67–P
DEPARTMENT OF THE INTERIOR
Bureau of Land Management
[OR–050–1020–MJ; HAG 07–0021]
John Day/Snake Resource Advisory Council; Meeting
AGENCY: Bureau of Land Management (BLM), Prineville District. ACTION: Notice of public meeting—John Day/Snake Resource Advisory Council.
INTERNATIONAL TRADE COMMISSION
[Investigation No. 731–TA–1103 (Final)]
Certain Activated Carbon From China
AGENCY: United States International Trade Commission. ACTION: Scheduling of the final phase of an antidumping investigation.
SUMMARY: The Commission hereby gives notice of the scheduling of the final phase of antidumping investigation No. 731–TA–1103 (Final) under section 735(b) of the Tariff Act of 1930 (19 U.S.C. 1673d(b)) (the Act) to determine whether an industry in the United States is materially injured or
VerDate Aug<31>2005 20:27 Nov 15, 2006 Jkt 211001 PO 00000 Frm 00045 Fmt 4703 Sfmt 4703 E:\FR\FM\16NON1.SGM 16NON1pwal
ker
on P
RO
D1P
C61
with
NO
TIC
ES

66794 Federal Register / Vol. 71, No. 221 / Thursday, November 16, 2006 / Notices
1 For purposes of this investigation, the Department of Commerce has defined the subject merchandise as follows:
‘‘Certain activated carbon is a powdered, granular, or pelletized carbon product obtained by ‘‘activating’’ with heat and steam various materials containing carbon, including but not limited to coal (including bituminous, lignite, and anthracite), wood, coconut shells, olive stones, and peat. The thermal and steam treatments remove organic materials and create an internal pore structure in the carbon material. The producer can also use carbon dioxide gas (CO2) in place of steam in this process. The vast majority of the internal porosity developed during the high temperature steam (or CO2 gas) activated process is a direct result of oxidation of a portion of the solid carbon atoms in the raw material, converting them into a gaseous form of carbon. The scope of this investigation covers all forms of activated carbon that are activated by steam or CO2, regardless of the raw material, grade, mixture, additives, further washing or post-activation chemical treatment (chemical or water washing, chemical impregnation or other treatment), or product form. Unless specifically excluded, the scope of this investigation covers all physical forms of certain activated carbon, including powdered activated carbon (‘‘PAC’’), granular activated carbon (‘‘GAC’’), and pelletized activated carbon.
Excluded from the scope of the investigation are chemically-activated carbons. The carbon-based raw material used in the chemical activation process is treated with a strong chemical agent, including but not limited to phosphoric acid, zinc chloride sulfuric acid or potassium hydroxide, that dehydrates molecules in the raw material, and results in the formation of water that is removed from the raw material by moderate heat treatment. The activated carbon created by chemical activation has internal porosity developed primarily due to the action of the chemical dehydration agent. Chemically activated carbons are typically used to activate raw materials with a lignocellulosic component such as cellulose, including wood, sawdust, paper mill waste and peat.
To the extent that an imported activated carbon product is a blend of steam and chemically activated carbons, products containing 50 percent or more steam (or CO2 gas) activated carbons are within this scope, and those containing more than 50 percent chemically activated carbons are outside this scope.
Also excluded from the scope are reactivated carbons. Reactivated carbons are previously used activated carbons that have had adsorbed materials removed from their pore structure after use through the application of heat, steam and/or chemicals.
Also excluded from the scope is activated carbon cloth. Activated carbon cloth is a woven textile fabric made of or containing activated carbon fibers. It is used in masks and filters and clothing of various types where a woven format is required.
Any activated carbon meeting the physical description of subject merchandise provided above that is not expressly excluded from the scope is included within this scope. The products under investigation are currently classifiable under the Harmonized Tariff Schedule of the United States (‘‘HTSUS’’) subheading 3802.10.00. Although HTSUS subheadings are provided for convenience and customs purposes, the written description of the scope of this investigation is dispositive.’’ 71 FR 59721, October 11, 2006.
threatened with material injury, or the establishment of an industry in the United States is materially retarded, by reason of less-than-fair-value imports from China of certain activated carbon, provided for in subheading 3802.10.00 of the Harmonized Tariff Schedule of the United States.1
For further information concerning the conduct of this phase of the investigation, hearing procedures, and rules of general application, consult the Commission’s Rules of Practice and Procedure, part 201, subparts A through E (19 CFR part 201), and part 207, subparts A and C (19 CFR part 207). EFFECTIVE DATE: October 11, 2006. FOR FURTHER INFORMATION CONTACT: Jim McClure (202–205–3191), Office of Investigations, U.S. International Trade Commission, 500 E Street, SW., Washington, DC 20436. Hearing- impaired persons can obtain information on this matter by contacting the Commission’s TDD terminal on 202– 205–1810. Persons with mobility impairments who will need special assistance in gaining access to the Commission should contact the Office of the Secretary at 202–205–2000. General information concerning the Commission may also be obtained by accessing its internet server (http:// www.usitc.gov). The public record for this investigation may be viewed on the Commission’s electronic docket (EDIS) at http://edis.usitc.gov. SUPPLEMENTARY INFORMATION:
Background.—The final phase of this investigation is being scheduled as a result of an affirmative preliminary determination by the Department of Commerce that imports of certain activated carbon from China are being sold in the United States at less than fair value within the meaning of section 733 of the Act (19 U.S.C. 1673b). The investigation was requested in a petition filed on March 8, 2006, by Calgon Carbon Corporation, Pittsburgh, PA, and Norit Americas, Inc., Marshall, TX.
Participation in the investigation and public service list.—Persons, including industrial users of the subject merchandise and, if the merchandise is sold at the retail level, representative consumer organizations, wishing to participate in the final phase of this investigation as parties must file an entry of appearance with the Secretary to the Commission, as provided in section 201.11 of the Commission’s rules, no later than 21 days prior to the hearing date specified in this notice. A party that filed a notice of appearance during the preliminary phase of the investigation need not file an additional notice of appearance during this final phase. The Secretary will maintain a public service list containing the names and addresses of all persons, or their representatives, who are parties to the investigation.
Limited disclosure of business proprietary information (BPI) under an administrative protective order (APO)
and BPI service list.—Pursuant to section 207.7(a) of the Commission’s rules, the Secretary will make BPI gathered in the final phase of this investigation available to authorized applicants under the APO issued in the investigation, provided that the application is made no later than 21 days prior to the hearing date specified in this notice. Authorized applicants must represent interested parties, as defined by 19 U.S.C. 1677(9), who are parties to the investigation. A party granted access to BPI in the preliminary phase of the investigation need not reapply for such access. A separate service list will be maintained by the Secretary for those parties authorized to receive BPI under the APO.
Staff report.—The prehearing staff report in the final phase of this investigation will be placed in the nonpublic record on February 12, 2007, and a public version will be issued thereafter, pursuant to section 207.22 of the Commission’s rules.
Hearing.—The Commission will hold a hearing in connection with the final phase of this investigation beginning at 9:30 a.m. on February 27, 2007, at the U.S. International Trade Commission Building. Requests to appear at the hearing should be filed in writing with the Secretary to the Commission on or before February 16, 2007. A nonparty who has testimony that may aid the Commission’s deliberations may request permission to present a short statement at the hearing. All parties and nonparties desiring to appear at the hearing and make oral presentations should attend a prehearing conference to be held at 9:30 a.m. on February 21, 2007, at the U.S. International Trade Commission Building. Oral testimony and written materials to be submitted at the public hearing are governed by §§ 201.6(b)(2), 201.13(f), and 207.24 of the Commission’s rules. Parties must submit any request to present a portion of their hearing testimony in camera no later than 7 business days prior to the date of the hearing.
Written submissions.—Each party who is an interested party shall submit a prehearing brief to the Commission. Prehearing briefs must conform with the provisions of section 207.23 of the Commission’s rules; the deadline for filing is February 20, 2007. Parties may also file written testimony in connection with their presentation at the hearing, as provided in section 207.24 of the Commission’s rules, and posthearing briefs, which must conform with the provisions of section 207.25 of the Commission’s rules. The deadline for filing posthearing briefs is March 6, 2007; witness testimony must be filed
VerDate Aug<31>2005 20:27 Nov 15, 2006 Jkt 211001 PO 00000 Frm 00046 Fmt 4703 Sfmt 4703 E:\FR\FM\16NON1.SGM 16NON1pwal
ker
on P
RO
D1P
C61
with
NO
TIC
ES

66795 Federal Register / Vol. 71, No. 221 / Thursday, November 16, 2006 / Notices
1 The record is defined in § 207.2(f) of the Commission’s Rules of Practice and Procedure (19 CFR 207.2(f)).
no later than three days before the hearing. In addition, any person who has not entered an appearance as a party to the investigation may submit a written statement of information pertinent to the subject of the investigation, including statements of support or opposition to the petition, on or before March 6, 2007. On March 22, 2007, the Commission will make available to parties all information on which they have not had an opportunity to comment. Parties may submit final comments on this information on or before March 26, 2007, but such final comments must not contain new factual information and must otherwise comply with section 207.30 of the Commission’s rules. All written submissions must conform with the provisions of section 201.8 of the Commission’s rules; any submissions that contain BPI must also conform with the requirements of §§ 201.6, 207.3, and 207.7 of the Commission’s rules. The Commission’s rules do not authorize filing of submissions with the Secretary by facsimile or electronic means, except to the extent permitted by section 201.8 of the Commission’s rules, as amended, 67 FR 68036 (November 8, 2002). Even where electronic filing of a document is permitted, certain documents must also be filed in paper form, as specified in II (C) of the Commission’s Handbook on Electronic Filing Procedures, 67 FR 68168, 68173 (November 8, 2002).
Additional written submissions to the Commission, including requests pursuant to section 201.12 of the Commission’s rules, shall not be accepted unless good cause is shown for accepting such submissions, or unless the submission is pursuant to a specific request by a Commissioner or Commission staff.
In accordance with §§ 201.16(c) and 207.3 of the Commission’s rules, each document filed by a party to the investigation must be served on all other parties to the investigation (as identified by either the public or BPI service list), and a certificate of service must be timely filed. The Secretary will not accept a document for filing without a certificate of service.
Authority: This investigation is being conducted under authority of title VII of the Tariff Act of 1930; this notice is published pursuant to § 207.21 of the Commission’s rules.
By order of the Commission. Issued: November 9, 2006.
Marilyn R. Abbott, Secretary to the Commission. [FR Doc. E6–19404 Filed 11–15–06; 8:45 am] BILLING CODE 7020–02–P
INTERNATIONAL TRADE COMMISSION
[Investigation Nos. 731–TA–1105–1106 (Preliminary)]
Lemon Juice From Argentina and Mexico
Determinations On the basis of the record 1 developed
in the subject investigations, the United States International Trade Commission (Commission) determines, pursuant to section 733(a) of the Tariff Act of 1930 (19 U.S.C. 1673b(a)) (the Act), that there is a reasonable indication that an industry in the United States is materially injured by reason of imports from Argentina and Mexico of lemon juice, provided for in subheadings 2009.31.40, 2009.31.60, and 2009.39.60 of the Harmonized Tariff Schedule of the United States, that are alleged to be sold in the United States at less than fair value (LTFV).
Commencement of Final Phase Investigations
Pursuant to § 207.18 of the Commission’s rules, the Commission also gives notice of the commencement of the final phase of its investigations. The Commission will issue a final phase notice of scheduling, which will be published in the Federal Register as provided in § 207.21 of the Commission’s rules, upon notice from the Department of Commerce (Commerce) of affirmative preliminary determinations in the investigations under section 733(b) of the Act, or, if the preliminary determinations are negative, upon notice of affirmative final determinations in the investigations under section 735(a) of the Act. Parties that filed entries of appearance in the preliminary phase of the investigations need not enter a separate appearance for the final phase of the investigations. Industrial users, and, if the merchandise under investigation is sold at the retail level, representative consumer organizations have the right to appear as parties in Commission antidumping and countervailing duty investigations. The Secretary will prepare a public service list containing the names and addresses of all persons, or their representatives, who are parties to the investigations.
Background On September 21, 2006, a petition
was filed with the Commission and Commerce by Sunkist Growers, Inc.,
Sherman Oaks, CA, alleging that an industry in the United States is materially injured and threatened with material by reason of LTFV imports of lemon juice from Argentina and Mexico. Accordingly, effective September 21, 2006, the Commission instituted antidumping duty investigation Nos. 731–TA–1105–1106 (Preliminary).
Notice of the institution of the Commission’s investigations and of a public conference to be held in connection therewith was given by posting copies of the notice in the Office of the Secretary, U.S. International Trade Commission, Washington, DC, and by publishing the notice in the Federal Register of September 27, 2006 (71 FR 56550). The conference was held in Washington, DC, on October 13, 2006, and all persons who requested the opportunity were permitted to appear in person or by counsel.
The Commission transmitted its determinations in these investigations to the Secretary of Commerce on November 6, 2006. The views of the Commission are contained in USITC Publication 3891 (November 2006), entitled Lemon Juice from Argentina and Mexico: Investigation Nos. 731–TA– 1105–1106 (Preliminary).
Issued: November 9, 2006. By order of the Commission.
Marilyn R. Abbott, Secretary to the Commission. [FR Doc. E6–19318 Filed 11–15–06; 8:45 am] BILLING CODE 7020–02–P
DEPARTMENT OF LABOR
Employment and Training Administration
[TA–W–59,788]
Ace Products, LLC, Newport, TN; Notice of Affirmative Determination Regarding Application for Reconsideration
By letter dated October 3, 2006, a petitioner requested administrative reconsideration of the Department of Labor’s Notice of Negative Determination Regarding Eligibility to Apply for Worker Adjustment Assistance, applicable to workers of the subject firm. The denial notice was signed on September 14, 2006, and published in the Federal Register on September 26, 2006 (71 FR 56172).
The initial investigation resulted in a negative determination based on the finding that imports of semi pneumatic and solid rubber tires did not contribute importantly to worker separations at the
VerDate Aug<31>2005 20:27 Nov 15, 2006 Jkt 211001 PO 00000 Frm 00047 Fmt 4703 Sfmt 4703 E:\FR\FM\16NON1.SGM 16NON1pwal
ker
on P
RO
D1P
C61
with
NO
TIC
ES

9508 Federal Register / Vol. 72, No. 41 / Friday, March 2, 2007 / Notices
DEPARTMENT OF COMMERCE
International Trade Administration
[A–570–904]
Final Determination of Sales at Less Than Fair Value: Certain Activated Carbon from the People’s Republic of China
AGENCY: Import Administration, International Trade Administration, Department of Commerce. DATES: March 2, 2007. SUMMARY: On October 11, 2006, the Department of Commerce (‘‘the Department’’) published its preliminary determination of sales at less than fair value (‘‘LTFV’’) in the antidumping investigation of certain activated carbon from the People’s Republic of China (‘‘PRC’’). The period of investigation (‘‘POI’’) is July 1, 2005, through December 31, 2005. We invited interested parties to comment on our preliminary determination of sales at LTFV. Based on our analysis of the comments we received, we have made changes to our calculations for the mandatory respondents. The final dumping margins for this investigation are listed in the ‘‘Final Determination Margins’’ section below. FOR FURTHER INFORMATION CONTACT: Catherine Bertrand or Anya Naschak, AD/CVD Operations, Office 9, Import Administration, International Trade Administration, U.S. Department of Commerce, 14th Street and Constitution Avenue, NW, Washington, DC, 20230; telephone: (202) 482–3207 or 482–6375, respectively.
Final Determination
We determine that certain activated carbon from the PRC is being, or is likely to be, sold in the United States at LTFV as provided in section 735 of the Tariff Act of 1930, as amended (‘‘the Act’’). The estimated margins of sales at LTFV are shown in the ‘‘Final Determination Margins’’ section of this notice. SUPPLEMENTARY INFORMATION:
Case History
The Department published its preliminary determination of sales at LTFV on October 11, 2006. See Preliminary Determination of Sales at Less Than Fair Value and Postponement of Final Determination: Certain Activated Carbon from the People’s Republic of China, 71 FR 59721 (October 11, 2006) (‘‘Preliminary Determination’’). The Department conducted verification of Calgon Carbon (Tianjin) Co., Ltd. (‘‘CCT’’) and certain
of its suppliers. As the Department determined in the Preliminary Determination that Jacobi Carbons AB (‘‘Jacobi AB’’) was the appropriate mandatory respondent in this case (see Preliminary Determination at 71 FR at 59725), the Department conducted verification of Jacobi AB and certain of its suppliers. The Department also conducted verification of Jilin Province Bright Future Chemicals Co. Ltd. (‘‘JBF Chemical’’) and its affiliated company Jilin Province Bright Future Industry & Commerce Co. Ltd. (‘‘JBF Industry’’) (collectively, ‘‘Jilin Bright Future’’) and one of its suppliers, in both the PRC and the United States (where applicable), and Ningxia Huahui Activated Carbon Co., Ltd., one of the separate rate applicants. See the ‘‘Verification’’ section below for additional information.
We invited parties to comment on the Preliminary Determination. We received a case brief from Carbochem Inc. (‘‘Carbochem’’) on January 11, 2007. We received case briefs from respondents Jacobi AB and CCT on January 16, 2007. We also received a case brief from Calgon Carbon Corporation and Norit Americas Inc. (‘‘Petitioners’’), on January 12, 2007. We received rebuttal briefs on January 22, 2007, from the following companies: Jacobi AB, CCT, Jilin Bright Future, and Petitioners. All parties that timely requested a hearing in this case withdrew those requests prior to the submission of case briefs. Therefore, the Department did not hold a hearing in this case.
On February 2, 2007, we invited parties to comment on the revised NME wage rate, to be used in the final determination of this investigation. No parties submitted comments on this issue.
Analysis of Comments Received
All issues raised in the case and rebuttal briefs by parties to this investigation are addressed in the Issues and Decision Memorandum for the Final Determination in the Investigation of Certain Activated Carbon from the People’s Republic of China, dated February 23, 2007, which is hereby adopted by this notice (‘‘Issues and Decision Memorandum’’). A list of the issues which parties raised and to which we respond in the Issues and Decision Memorandum is attached to this notice as an Appendix. The Issue and Decision Memorandum is a public document and is on file in the Central Records Unit (‘‘CRU’’), Main Commerce Building, Room B–099, and is accessible on the Web at http://www.trade.gov/ia. The paper copy and electronic version
of the memorandum are identical in content.
Changes Since the Preliminary Determination
Based on our analysis of comments received, we have made changes to the margin calculation for CCT, Jacobi AB and Jilin Bright Future as follows.
CCT: We have made changes resulting from
minor corrections and findings at CCT’s verifications. For a detailed analysis of CCT’s margin calculation see the Final Analysis Memorandum for CCT, dated February 23, 2007.
Jacobi: We have made the following changes
to Jacobi AB’s margin calculation: We have determined that it is
appropriate to apply partial adverse facts available (‘‘AFA’’) to Jacobi for its reported factors of production supplied by Ningxia Guanghua Activated Carbon Co., Ltd.’s (‘‘NXGH’’). See below and Issues and Decision Memorandum at Comment 7. We have revised the application of facts available for one of Jacobi AB’s suppliers. In addition, we have made changes to Jacobi AB’s U.S. sales and factors of production resulting from minor corrections and findings at Jacobi AB’s verifications. See Issues and Decision Memorandum at Comment 19 and Memorandum to the File from Anya L. Naschak: Jacobi Carbons AB, Tianjin Jacobi International Trading Co., Ltd., and Jacobi Carbons, Inc. Program Analysis for the Final Determination, dated February 23, 2007 (‘‘Jacobi Final Analysis Memorandum’’). For a detailed analysis of Jacobi AB’s margin calculation, see Jacobi Final Analysis Memorandum. Jilin Bright Future:
As discussed in Comment 27 of the Issues and Decision Memorandum, we have determined to apply total adverse facts available to Jilin Bright Future. We have assigned the PRC–wide margin of 228.11 percent to Jilin Bright Future.
In addition, the Department has made changes to its calculation of the truck freight surrogate value as described in the Issues and Decision Memorandum at Comment 3, and to the calculation of certain chemical inputs as described in the Issues and Decision Memorandum at Comment 18. See also, Jacobi and CCT’s Final Analysis Memoranda. The Department has also revised the surrogate value for labor to $0.83, a the revised expected wage rate posted on the Department’s website on February 2, 2007. Further, the Department determines that it is appropriate to apply the methodology described in the December 27, 2006 Federal Register
VerDate Aug<31>2005 18:44 Mar 01, 2007 Jkt 211001 PO 00000 Frm 00008 Fmt 4703 Sfmt 4703 E:\FR\FM\02MRN1.SGM 02MRN1pwal
ker
on P
RO
D1P
C71
with
NO
TIC
ES

9509 Federal Register / Vol. 72, No. 41 / Friday, March 2, 2007 / Notices
1 We excluded the supplier NXGH of Jacobi as well as CCT’s suppliers who did not provide FOP information.
Notice to this investigation. See Issues and Decision Memorandum at Comment 4 and Final Modification; Calculation of the Weighted–Average Dumping Margin During an Antidumping Investigation, 71 FR 77722 (December 27, 2006).
Affiliation The Department preliminarily
determined that Jacobi AB, Tianjin Jacobi International Trading Co., Ltd. (‘‘Jacobi Tianjin’’), and Jacobi Carbons, Inc. (‘‘Jacobi US’’) (collectively, ‘‘Jacobi’’) are affiliated with each other, and that Jacobi AB is the appropriate mandatory respondent in this case. See Memorandum to the File: Certain Activated Carbon from the People’s Republic of China: Affiliation and Treatment of Sales of Jacobi Tianjin International Trading Co., Ltd., Jacobi Carbons AB, and Jacobi Carbons, Inc., dated October 4, 2006, for further details regarding this issue. No comments were received on this issue and no information was placed on the record that would call into question the Department’s determination in this regard. Therefore, the Department continues to find that Jacobi AB, Jacobi Tianjin, and Jacobi US are affiliated and Jacobi AB is the appropriate mandatory respondent in this case.
Scope of Investigation The merchandise subject to this
investigation is certain activated carbon. Certain activated carbon is a powdered, granular, or pelletized carbon product obtained by ‘‘activating’’ with heat and steam various materials containing carbon, including but not limited to coal (including bituminous, lignite, and anthracite), wood, coconut shells, olive stones, and peat. The thermal and steam treatments remove organic materials and create an internal pore structure in the carbon material. The producer can also use carbon dioxide gas (CO2) in place of steam in this process. The vast majority of the internal porosity developed during the high temperature steam (or CO2 gas) activated process is a direct result of oxidation of a portion of the solid carbon atoms in the raw material, converting them into a gaseous form of carbon.
The scope of this investigation covers all forms of activated carbon that are activated by steam or CO2, regardless of the raw material, grade, mixture, additives, further washing or post activation chemical treatment (chemical or water washing, chemical impregnation or other treatment), or product form. Unless specifically excluded, the scope of this investigation covers all physical forms of certain activated carbon, including powdered
activated carbon (‘‘PAC’’), granular activated carbon (‘‘GAC’’), and pelletized activated carbon.
Excluded from the scope of the investigation are chemically–activated carbons. The carbon–based raw material used in the chemical activation process is treated with a strong chemical agent, including but not limited to phosphoric acid, zinc chloride sulfuric acid or potassium hydroxide, that dehydrates molecules in the raw material, and results in the formation of water that is removed from the raw material by moderate heat treatment. The activated carbon created by chemical activation has internal porosity developed primarily due to the action of the chemical dehydration agent. Chemically activated carbons are typically used to activate raw materials with a lignocellulosic component such as cellulose, including wood, sawdust, paper mill waste and peat.
To the extent that an imported activated carbon product is a blend of steam and chemically activated carbons, products containing 50 percent or more steam (or CO2 gas) activated carbons are within this scope, and those containing more than 50 percent chemically activated carbons are outside this scope. This exclusion language regarding blended material applies only to mixtures of steam and chemically activated carbons.
Also excluded from the scope are reactivated carbons. Reactivated carbons are previously used activated carbons that have had adsorbed materials removed from their pore structure after use through the application of heat, steam and/or chemicals.
Also excluded from the scope is activated carbon cloth. Activated carbon cloth is a woven textile fabric made of or containing activated carbon fibers. It is used in masks and filters and clothing of various types where a woven format is required.
Any activated carbon meeting the physical description of subject merchandise provided above that is not expressly excluded from the scope is included within this scope. The products under investigation are currently classifiable under the Harmonized Tariff Schedule of the United States (‘‘HTSUS’’) subheading 3802.10.00. Although HTSUS subheadings are provided for convenience and customs purposes, the written description of the scope of this investigation is dispositive. Scope Comments
We have addressed comments to the Scope in our Issues and Decision Memorandum and have determined not to revise the scope of this investigation
other than to clarify that the exclusion for certain blended activated carbon only applies to mixtures of steam and chemically activated carbons.
Facts Available
Section 776(a)(2) of the Act provides that if an interested party: (A) withholds information that has been requested by the Department; (B) fails to provide such information in a timely manner or in the form or manner requested, subject to subsections 782(c)(1) and (e) of the Act; (C) significantly impedes a determination under the antidumping statute; or (D) provides such information but the information cannot be verified, the Department shall, subject to subsection 782(d) of the Act, use facts otherwise available in reaching the applicable determination.
Section 776(b) of the Act states that if the administering authority finds that an interested party has not acted to the best of its ability to comply with a request for information, the administering authority may, in reaching its determination, use an inference that is adverse to that party. The adverse inference may be based upon: (1) the petition, (2) a final determination in the investigation under this title, (3) any previous review under section 751 or determination under section 753, or (4) any other information placed on the record.
CCT:
For this final determination, in accordance with section 776(a)(2) of the Act and 776(b) of the Act, we have determined that the use of adverse facts available (‘‘AFA’’) is appropriate for CCT’s suppliers that have been deemed uncooperative. See Issues and Decision Memorandum at Comment 20. As partial AFA, we are applying the weighted–average of the two highest calculated CONNUM–specific NVs selected from all of the cooperating suppliers1 of CCT andJacobi to all sales made by CCT of these suppliers products. See Memorandum to the File from Anya Naschak: Calculation of Adverse Facts Available Rate dated February 23, 2007.
Jacobi:
For this final determination, in accordance with section 776(a)(2) of the Act and 776(b) of the Act, we have determined that the use of adverse facts available (‘‘AFA’’) is appropriate for Jacobi’s reported factors of production supplied by Ningxia Guanghua
VerDate Aug<31>2005 18:44 Mar 01, 2007 Jkt 211001 PO 00000 Frm 00009 Fmt 4703 Sfmt 4703 E:\FR\FM\02MRN1.SGM 02MRN1pwal
ker
on P
RO
D1P
C71
with
NO
TIC
ES

9510 Federal Register / Vol. 72, No. 41 / Friday, March 2, 2007 / Notices
2 We excluded the supplier NXGH of Jacobi as well as the CCT’s suppliers who did not provided FOP information.
Activated Carbon Co., Ltd.’s (‘‘NXGH’’). See Issues and Decision Memorandum at Comment 7. As partial AFA, we are applying the weighted–average of the two highest calculated CONNUM– specific NVs selected from all of the cooperating suppliers2 of CCT and Jacobi to all sales made by Jacobi of NXGH–produced products. See Memorandum to the File From Anya Naschak: Calculation of Adverse Facts Available Rate dated February 23, 2007.
Jilin Bright Future:
For the final determination, the Department is applying total adverse facts available to Jilin Bright Future. The Department is applying the facts otherwise available to Jilin Bright Future because it failed to provide verifiable factors of production data and misrepresented and misreported its production operations and factors of production, in accordance with sections 776(a)(2)(A), (C) & (D) of the Act. Furthermore, in accordance with section 776(b) of the Act, the Department found that Jilin Bright Future failed to cooperate to the best of its ability to comply with the Department’s request for information, and, therefore, finds an adverse inference is warranted in determining the facts otherwise available. For a complete discussion of this matter, see Comment 27 of the Issues and Decision Memorandum.
Verification
As provided in section 782(i) of the Act, we verified the information submitted by the respondents and one separate rate applicant for use in our final determination. See the Department’s verification reports on the record of this investigation in the CRU with respect to CCT, Jacobi, Jilin Bright Future, and Ningxia Huahui Activated Carbon Co., Ltd. For all verified companies, we used standard verification procedures, including examination of relevant accounting and production records, as well as original source documents provided by respondents.
Surrogate Country
In the Preliminary Determination, we stated that we had selected India as the appropriate surrogate country to use in this investigation for the following reasons: (1) it is a significant producer of comparable merchandise; (2) it is at a similar level of economic development pursuant to 773(c)(4) of the Act; and (3) we have reliable data from India that we
can use to value the factors of production. See Preliminary Determination. For the final determination, we received no comments and made no changes to our findings with respect to the selection of a surrogate country.
Separate Rates In proceedings involving non–market-
economy (‘‘NME’’) countries, the Department begins with a rebuttable presumption that all companies within the country are subject to government control and, thus, should be assigned a single antidumping duty deposit rate. It is the Department’s policy to assign all exporters of merchandise subject to an investigation in an NME country this single rate unless an exporter can demonstrate that it is sufficiently independent so as to be entitled to a separate rate. See Final Determination of Sales at Less Than Fair Value: Sparklers from the People’s Republic of China, 56 FR 20588 (May 6, 1991) (‘‘Sparklers’’), as amplified by Notice of Final Determination of Sales at Less Than Fair Value: Silicon Carbide from the People’s Republic of China, 59 FR 22585 (May 2, 1994) (‘‘Silicon Carbide’’), and Section 351.107(d) of the Department’s regulations.
In the Preliminary Determination, we found that CCT, Jacobi and Jilin Bright Future, and the separate rate applicants who received a separate rate (‘‘Separate Rate Applicants’’) in the Preliminary Determination demonstrated their eligibility for separate–rate status. For the final determination, we continue to find that the evidence placed on the record of this investigation by CCT, Jacobi and Jilin Bright Future, and the Separate Rate Applicants demonstrate both a de jure and de facto absence of government control, with respect to their respective exports of the merchandise under investigation, and, thus are eligible for separate rate status. We determined in the Preliminary Determination that Panshan Import and Export Corporation is not entitled to a separate rate. We received no comments on this issue and we continue to find that Panshan Import and Export Corporation is not entitled to a separate rate.
The PRC–Wide Rate In the Preliminary Determination, the
Department found that certain companies and the PRC–wide entity did not respond to our requests information. In the Preliminary Determination we treated these PRC producers/exporters as part of the PRC–wide entity because they did not demonstrate that they operate free of government control. No
additional information has been placed on the record with respect to these entities after the Preliminary Determination. The PRC–wide entity has not provided the Department with the requested information; therefore, pursuant to section 776(a)(2)(A) of the Act, the Department continues to find that the use of facts available is appropriate to determine the PRC–wide rate. Section 776(b) of the Act provides that, in selecting from among the facts otherwise available, the Department may employ an adverse inference if an interested party fails to cooperate by not acting to the best of its ability to comply with requests for information. See Notice of Final Determination of Sales at Less Than Fair Value: Certain Cold– Rolled Flat–Rolled Carbon–Quality Steel Products from the Russian Federation, 65 FR 5510, 5518 (February 4, 2000). See also, ‘‘Statement of Administrative Action’’ accompanying the URAA, H.R. Rep. No. 103–316, vol. 1, at 870 (1994) (‘‘SAA’’). We find that, because the PRC–wide entity did not respond to our request for information, it has failed to cooperate to the best of its ability. The PRC wide entity includes Datong Huibao Activated Carbon Co., Ltd and its affiliated company Beijing Hibridge Trading Co., Ltd., who we preliminary determined was part of the PRC–wide entity as it was selected as a mandatory respondent and then withdrew. Therefore, the Department finds that, in selecting from among the facts otherwise available, an adverse inference is appropriate for the PRC– wide entity.
Because we begin with the presumption that all companies within a NME country are subject to government control and because only the companies listed under the ‘‘Final Determination Margins’’ section below have overcome that presumption, we are applying a single antidumping rate - the PRC–wide rate - to all other exporters of subject merchandise from the PRC. Such companies did not demonstrate entitlement to a separate rate. See, e.g., Synthetic Indigo from the People’s Republic of China: Notice of Final Determination of Sales at Less Than Fair Value, 65 FR 25706 (May 3, 2000). The PRC–wide rate applies to all entries of subject merchandise except for entries from the respondents which are listed in the ‘‘Final Determination Margins’’ section below (except as noted).
Corroboration At the Preliminary Determination, in
accordance with section 776(c) of the Act, we corroborated our adverse facts available (‘‘AFA’’) margin using
VerDate Aug<31>2005 18:44 Mar 01, 2007 Jkt 211001 PO 00000 Frm 00010 Fmt 4703 Sfmt 4703 E:\FR\FM\02MRN1.SGM 02MRN1pwal
ker
on P
RO
D1P
C71
with
NO
TIC
ES
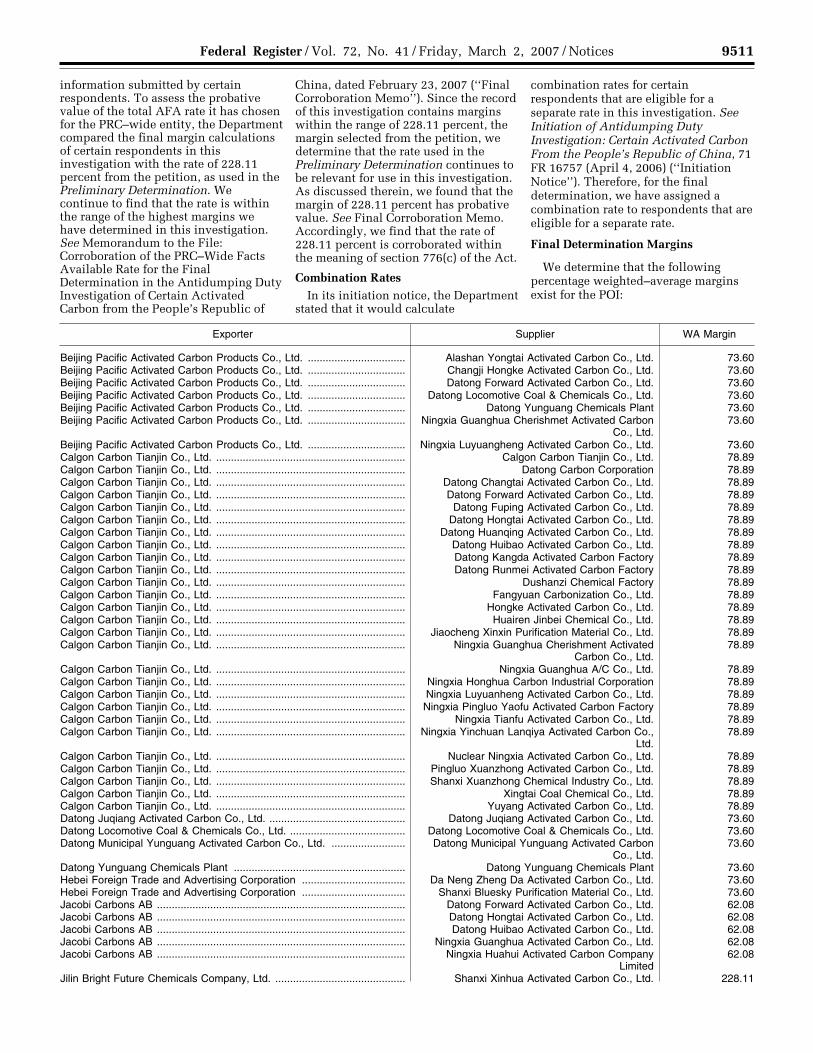
9511 Federal Register / Vol. 72, No. 41 / Friday, March 2, 2007 / Notices
information submitted by certain respondents. To assess the probative value of the total AFA rate it has chosen for the PRC–wide entity, the Department compared the final margin calculations of certain respondents in this investigation with the rate of 228.11 percent from the petition, as used in the Preliminary Determination. We continue to find that the rate is within the range of the highest margins we have determined in this investigation. See Memorandum to the File: Corroboration of the PRC–Wide Facts Available Rate for the Final Determination in the Antidumping Duty Investigation of Certain Activated Carbon from the People’s Republic of
China, dated February 23, 2007 (‘‘Final Corroboration Memo’’). Since the record of this investigation contains margins within the range of 228.11 percent, the margin selected from the petition, we determine that the rate used in the Preliminary Determination continues to be relevant for use in this investigation. As discussed therein, we found that the margin of 228.11 percent has probative value. See Final Corroboration Memo. Accordingly, we find that the rate of 228.11 percent is corroborated within the meaning of section 776(c) of the Act.
Combination Rates In its initiation notice, the Department
stated that it would calculate
combination rates for certain respondents that are eligible for a separate rate in this investigation. See Initiation of Antidumping Duty Investigation: Certain Activated Carbon From the People’s Republic of China, 71 FR 16757 (April 4, 2006) (‘‘Initiation Notice’’). Therefore, for the final determination, we have assigned a combination rate to respondents that are eligible for a separate rate.
Final Determination Margins
We determine that the following percentage weighted–average margins exist for the POI:
Exporter Supplier WA Margin
Beijing Pacific Activated Carbon Products Co., Ltd. ................................. Alashan Yongtai Activated Carbon Co., Ltd. 73.60 Beijing Pacific Activated Carbon Products Co., Ltd. ................................. Changji Hongke Activated Carbon Co., Ltd. 73.60 Beijing Pacific Activated Carbon Products Co., Ltd. ................................. Datong Forward Activated Carbon Co., Ltd. 73.60 Beijing Pacific Activated Carbon Products Co., Ltd. ................................. Datong Locomotive Coal & Chemicals Co., Ltd. 73.60 Beijing Pacific Activated Carbon Products Co., Ltd. ................................. Datong Yunguang Chemicals Plant 73.60 Beijing Pacific Activated Carbon Products Co., Ltd. ................................. Ningxia Guanghua Cherishmet Activated Carbon
Co., Ltd. 73.60
Beijing Pacific Activated Carbon Products Co., Ltd. ................................. Ningxia Luyuangheng Activated Carbon Co., Ltd. 73.60 Calgon Carbon Tianjin Co., Ltd. ................................................................ Calgon Carbon Tianjin Co., Ltd. 78.89 Calgon Carbon Tianjin Co., Ltd. ................................................................ Datong Carbon Corporation 78.89 Calgon Carbon Tianjin Co., Ltd. ................................................................ Datong Changtai Activated Carbon Co., Ltd. 78.89 Calgon Carbon Tianjin Co., Ltd. ................................................................ Datong Forward Activated Carbon Co., Ltd. 78.89 Calgon Carbon Tianjin Co., Ltd. ................................................................ Datong Fuping Activated Carbon Co., Ltd. 78.89 Calgon Carbon Tianjin Co., Ltd. ................................................................ Datong Hongtai Activated Carbon Co., Ltd. 78.89 Calgon Carbon Tianjin Co., Ltd. ................................................................ Datong Huanqing Activated Carbon Co., Ltd. 78.89 Calgon Carbon Tianjin Co., Ltd. ................................................................ Datong Huibao Activated Carbon Co., Ltd. 78.89 Calgon Carbon Tianjin Co., Ltd. ................................................................ Datong Kangda Activated Carbon Factory 78.89 Calgon Carbon Tianjin Co., Ltd. ................................................................ Datong Runmei Activated Carbon Factory 78.89 Calgon Carbon Tianjin Co., Ltd. ................................................................ Dushanzi Chemical Factory 78.89 Calgon Carbon Tianjin Co., Ltd. ................................................................ Fangyuan Carbonization Co., Ltd. 78.89 Calgon Carbon Tianjin Co., Ltd. ................................................................ Hongke Activated Carbon Co., Ltd. 78.89 Calgon Carbon Tianjin Co., Ltd. ................................................................ Huairen Jinbei Chemical Co., Ltd. 78.89 Calgon Carbon Tianjin Co., Ltd. ................................................................ Jiaocheng Xinxin Purification Material Co., Ltd. 78.89 Calgon Carbon Tianjin Co., Ltd. ................................................................ Ningxia Guanghua Cherishment Activated
Carbon Co., Ltd. 78.89
Calgon Carbon Tianjin Co., Ltd. ................................................................ Ningxia Guanghua A/C Co., Ltd. 78.89 Calgon Carbon Tianjin Co., Ltd. ................................................................ Ningxia Honghua Carbon Industrial Corporation 78.89 Calgon Carbon Tianjin Co., Ltd. ................................................................ Ningxia Luyuanheng Activated Carbon Co., Ltd. 78.89 Calgon Carbon Tianjin Co., Ltd. ................................................................ Ningxia Pingluo Yaofu Activated Carbon Factory 78.89 Calgon Carbon Tianjin Co., Ltd. ................................................................ Ningxia Tianfu Activated Carbon Co., Ltd. 78.89 Calgon Carbon Tianjin Co., Ltd. ................................................................ Ningxia Yinchuan Lanqiya Activated Carbon Co.,
Ltd. 78.89
Calgon Carbon Tianjin Co., Ltd. ................................................................ Nuclear Ningxia Activated Carbon Co., Ltd. 78.89 Calgon Carbon Tianjin Co., Ltd. ................................................................ Pingluo Xuanzhong Activated Carbon Co., Ltd. 78.89 Calgon Carbon Tianjin Co., Ltd. ................................................................ Shanxi Xuanzhong Chemical Industry Co., Ltd. 78.89 Calgon Carbon Tianjin Co., Ltd. ................................................................ Xingtai Coal Chemical Co., Ltd. 78.89 Calgon Carbon Tianjin Co., Ltd. ................................................................ Yuyang Activated Carbon Co., Ltd. 78.89 Datong Juqiang Activated Carbon Co., Ltd. .............................................. Datong Juqiang Activated Carbon Co., Ltd. 73.60 Datong Locomotive Coal & Chemicals Co., Ltd. ....................................... Datong Locomotive Coal & Chemicals Co., Ltd. 73.60 Datong Municipal Yunguang Activated Carbon Co., Ltd. ......................... Datong Municipal Yunguang Activated Carbon
Co., Ltd. 73.60
Datong Yunguang Chemicals Plant .......................................................... Datong Yunguang Chemicals Plant 73.60 Hebei Foreign Trade and Advertising Corporation ................................... Da Neng Zheng Da Activated Carbon Co., Ltd. 73.60 Hebei Foreign Trade and Advertising Corporation ................................... Shanxi Bluesky Purification Material Co., Ltd. 73.60 Jacobi Carbons AB .................................................................................... Datong Forward Activated Carbon Co., Ltd. 62.08 Jacobi Carbons AB .................................................................................... Datong Hongtai Activated Carbon Co., Ltd. 62.08 Jacobi Carbons AB .................................................................................... Datong Huibao Activated Carbon Co., Ltd. 62.08 Jacobi Carbons AB .................................................................................... Ningxia Guanghua Activated Carbon Co., Ltd. 62.08 Jacobi Carbons AB .................................................................................... Ningxia Huahui Activated Carbon Company
Limited 62.08
Jilin Bright Future Chemicals Company, Ltd. ............................................ Shanxi Xinhua Activated Carbon Co., Ltd. 228.11
VerDate Aug<31>2005 19:22 Mar 01, 2007 Jkt 211001 PO 00000 Frm 00011 Fmt 4703 Sfmt 4703 E:\FR\FM\02MRN1.SGM 02MRN1pwal
ker
on P
RO
D1P
C71
with
NO
TIC
ES

9512 Federal Register / Vol. 72, No. 41 / Friday, March 2, 2007 / Notices
Exporter Supplier WA Margin
Jilin Bright Future Chemicals Company, Ltd. ............................................ Tonghua Bright Future Activated Carbon Plant 228.11 Jilin Bright Future Chemicals Company, Ltd. ............................................ Zuoyun Bright Future Activated Carbon Plant 228.11 Jilin Province Bright Future Industry and Commerce Co., Ltd. ................ Shanxi Xinhua Activated Carbon Co., Ltd. 228.11 Jilin Province Bright Future Industry and Commerce Co., Ltd. ................ Tonghua Bright Future Activated Carbon Plant 228.11 Jilin Province Bright Future Industry and Commerce Co., Ltd. ................ Zuoyun Bright Future Activated Carbon Plant 228.11 Ningxia Guanghua Cherishmet Activated Carbon Co., Ltd. ..................... Ningxia Guanghua Cherishmet Activated Carbon
Co., Ltd. 73.60
Ningxia Huahui Activated Carbon Co., Ltd. .............................................. Ningxia Huahui Activated Carbon Co., Ltd. 73.60 Ningxia Mineral & Chemical Limited ......................................................... Ningxia Baota Activated Carbon Co., Ltd. 73.60 Shanxi DMD Corporation China Nuclear .................................................. Ningxia Activated Carbon Plant 73.60 Shanxi DMD Corporation ........................................................................... Ningxia Guanghua Activated Carbon Co., Ltd. 73.60 Shanxi DMD Corporation ........................................................................... Shanxi Xinhua Chemical Co., Ltd. 73.60 Shanxi DMD Corporation ........................................................................... Tonghua Xinpeng Activated Carbon Factory 73.60 Shanxi Industry Technology Trading Co., Ltd. .......................................... Actview Carbon Technology Co., Ltd. 73.60 Shanxi Industry Technology Trading Co., Ltd. .......................................... Datong Forward Activated Carbon Co., Ltd. 73.60 Shanxi Industry Technology Trading Co., Ltd. .......................................... Datong Tri–Star & Power Carbon Plant 73.60 Shanxi Industry Technology Trading Co., Ltd. .......................................... Fu Yuan Activated Carbon Co., Ltd. 73.60 Shanxi Industry Technology Trading Co., Ltd. .......................................... Jing Mao (Dongguan) Activated Carbon Co., Ltd. 73.60 Shanxi Industry Technology Trading Co., Ltd. .......................................... Xi Li Activated Carbon Co., Ltd. 73.60 Shanxi Newtime Co., Ltd. .......................................................................... Datong Forward Activated Carbon Co., Ltd. 73.60 Shanxi Newtime Co., Ltd. .......................................................................... Ningxia Guanghua Chemical Activated Carbon
Co., Ltd. 73.60
Shanxi Newtime Co., Ltd. .......................................................................... Ningxia Tianfu Activated Carbon Co., Ltd. 73.60 Shanxi Qixian Foreign Trade Corporation ................................................. Datong Locomotive Coal & Chemicals Co., Ltd. 73.60 Shanxi Qixian Foreign Trade Corporation ................................................. Datong Tianzhao Activated Carbon Co., Ltd. 73.60 Shanxi Qixian Foreign Trade Corporation ................................................. Ningxia Huinong Xingsheng Activated Carbon
Co., Ltd. 73.60
Shanxi Qixian Foreign Trade Corporation ................................................. Ningxia Yirong Alloy Iron Co., Ltd. 73.60 Shanxi Qixian Foreign Trade Corporation ................................................. Ninxia Tongfu Coking Co., Ltd. 73.60 Shanxi Qixian Foreign Trade Corporation ................................................. Shanxi Xiaoyi Huanyu Chemicals Co., Ltd. 73.60 Shanxi Sincere Industrial Co., Ltd. ............................................................ Datong Guanghua Activated Co., Ltd. 73.60 Shanxi Sincere Industrial Co., Ltd. ............................................................ Ningxia Guanghua–Cherishmet Activated Carbon
Co., Ltd. 73.60
Shanxi Sincere Industrial Co., Ltd. ............................................................ Ningxia Pingluo County YaoFu Activated Carbon Factory
73.60
Shanxi Xuanzhong Chemical Industry Co., Ltd. ....................................... Ningxia Pingluo Xuanzhong Activated Carbon Co., Ltd.
73.60
Tangshan Solid Carbon Co., Ltd. .............................................................. Datong Zuoyun Biyun Activated Carbon Co., Ltd. 73.60 Tangshan Solid Carbon Co., Ltd. .............................................................. Ningxia Guanghua Activated Carbon Co., Ltd. 73.60 Tangshan Solid Carbon Co., Ltd. .............................................................. Ningxia Xingsheng Coal and Active Carbon Co.,
Ltd. 73.60
Tangshan Solid Carbon Co., Ltd. .............................................................. Pingluo Yu Yang Activated Carbon Co., Ltd. 73.60 Tianjin Maijin Industries Co., Ltd. .............................................................. Hegongye Ninxia Activated Carbon Factory 73.60 Tianjin Maijin Industries Co., Ltd. .............................................................. Ningxia Pingluo County YaoFu Activated Carbon
Plant 73.60
Tianjin Maijin Industries Co., Ltd. .............................................................. Yinchuan Lanqiya Activated Carbon Co., Ltd. 73.60 United Manufacturing International (Beijing) Ltd. ...................................... Datong Fu Ping Activated Carbon Co., Ltd. 73.60 United Manufacturing International (Beijing) Ltd. ...................................... Datong Locomotive Coal & Chemical Co. Ltd. 73.60 United Manufacturing International (Beijing) Ltd. ...................................... Xinhua Chemical Company Ltd. 73.60 Xi’an Shuntong International Trade & Industrials Co., Ltd. ....................... DaTong Tri–Star & Power Carbon Plant 73.60 Xi’an Shuntong International Trade & Industrials Co., Ltd. ....................... Ningxia Huahui Activated Carbon Company
Limited 73.60
PRC–Wide Rate ........................................................................................ ................................................................................ 228.11
Disclosure We will disclose the calculations
performed within five days of the date of publication of this notice to parties in this proceeding in accordance with 19 CFR 351.224(b).
Continuation of Suspension of Liquidation
Pursuant to section 735(c)(1)(B) of the Act, we will instruct U.S. Customs and Border Protection (‘‘CBP’’) to continue to suspend liquidation of all entries of subject merchandise from the PRC entered, or withdrawn from warehouse, for consumption on or after October 11,
2006, the date of publication of the Preliminary Determination. CBP shall continue to require a cash deposit or the posting of a bond equal to the estimated amount by which the normal value exceeds the U.S. price as shown above. These instructions suspending liquidation will remain in effect until further notice.
ITC Notification
In accordance with section 735(d) of the Act, we have notified the International Trade Commission (‘‘ITC’’) of our final determination of sales at LTFV. As our final determination is
affirmative, in accordance with section 735(b)(2) of the Act, within 45 days the ITC will determine whether the domestic industry in the United States is materially injured, or threatened with material injury, by reason of imports or sales (or the likelihood of sales) for importation of the subject merchandise. If the ITC determines that material injury or threat of material injury does not exist, the proceeding will be terminated and all securities posted will be refunded or canceled. If the ITC determines that such injury does exist, the Department will issue an antidumping duty order directing CBP
VerDate Aug<31>2005 18:44 Mar 01, 2007 Jkt 211001 PO 00000 Frm 00012 Fmt 4703 Sfmt 4703 E:\FR\FM\02MRN1.SGM 02MRN1pwal
ker
on P
RO
D1P
C71
with
NO
TIC
ES

9513 Federal Register / Vol. 72, No. 41 / Friday, March 2, 2007 / Notices
to assess antidumping duties on all imports of the subject merchandise entered, or withdrawn from warehouse, for consumption on or after the effective date of the suspension of liquidation.
Notification Regarding APO This notice also serves as a reminder
to the parties subject to administrative protective order (‘‘APO’’) of their responsibility concerning the disposition of proprietary information disclosed under APO in accordance with 19 CFR 351.305. Timely notification of return or destruction of APO materials or conversion to judicial protective order is hereby requested. Failure to comply with the regulations and the terms of an APO is a sanctionable violation. This determination and notice are issued and published in accordance with sections 735(d) and 777(i)(1) of the Act.
This determination and notice are issued and published in accordance with sections 735(d) and 777(i)(1) of the Act.
Dated: February 23, 2007. David M. Spooner, Assistant Secretary for Import Administration.
Appendix I
Changes from the Preliminary Determination
General Issues Comment 1: Whether to Clarify the Scope With Respect to Blended Products
Comment 2: Whether to Exclude Carbochem Products from the Scope Comment 3: Whether to Correct Freight Ministerial Error Comment 4: Whether to Change the Department’s Zeroing Methodology Comment 5: Whether to Grant a By– Product Offset for Activated Carbon Products
Comment 6: Treatment of Non– Production Electricity and Labor
Company–Specific Issues
Jacobi Issues Comment 7: Whether to Apply Total Adverse Facts Available to Jacobi Comment 8: Treatment of Powdered Activated Carbon Sold to the United States
Comment 9: Whether to Recalculate Jacobi’s FOPs to Include By–products in the Denominator Comment 10: Whether to Apply Adverse Facts Available for DTFH Comment 11: Whether to Apply Adverse Facts Available to Jacobi’s Electricity and Labor
Comment 12: Treatment of Impregnated Material at NXGH for which No Data Were Reported Comment 13: Whether to Impute Verification Findings of NXGH and DTHB to Jacobi’s Other Suppliers Comment 14: Treatment of Water Comment 15: Treatment of Packing and Factory Labor Comment 16: Valuation of Carbonized Material
Comment 17: Valuation of Coal Comment 18: Valuation of Chemical Inputs
Comment 19: Calculation of Indirect Selling Expense
CCT Issues Comment 20: Whether to Continue to Apply Adverse Facts Available to Certain CCT Suppliers Comment 21: PXZ’s Pressroom Product Comment 22: Whether to Impute the Verification Findings of NXGH to CCT Comment 23: Production Denominator Comment 24: Calculation of Indirect Selling Expense Comment 25: U.S. Warehousing Expense
Comment 26: Marine Insurance
Jilin Issues Comment 27: Whether to Apply Adverse Facts Available to Jilin Bright Future [FR Doc. E7–3693 Filed 3–1–07; 8:45 am] BILLING CODE 3510–DS–S
DEPARTMENT OF COMMERCE
International Trade Administration (A–427–801)
Ball Bearings and Parts Thereof from France: Initiation of an Antidumping Duty Changed–Circumstances Review
AGENCY: Import Administration, International Trade Administration, Department of Commerce. SUMMARY: In response to a request for a changed–circumstances review from Societe Nouvelle de Fabrication Aeronautique S.A.S.U., SKF France S.A., and SKF Aerospace France S.A.S. and pursuant to section 751(b) of the Tariff Act of 1930, as amended, and 19 CFR § 351.216 and 351.221(c)(3), the Department of Commerce is initiating a changed–circumstances review of the antidumping duty order on ball bearings and parts thereof from France. EFFECTIVE DATE: March 2, 2007. FOR FURTHER INFORMATION CONTACT: Edythe Artman at (202) 482–3931 or Richard Rimlinger at (202) 482–4477, AD/CVD Operations, Office 5, Import
Administration, International Trade Administration, U.S. Department of Commerce, 14th Street and Constitution Avenue, NW, Washington, DC 20230.
SUPPLEMENTARY INFORMATION:
Background
The Department of Commerce (the Department) published antidumping duty orders on ball bearings, cylindrical roller bearings, and spherical plain bearings and parts thereof from France on May 15, 1989. See Antidumping Duty Orders: Ball Bearings, Cylindrical Roller Bearings, Spherical Plain Bearings, and Parts Thereof From France, 54 FR 20902 (May 15, 1989). The order on cylindrical roller bearings and parts thereof from France was revoked, effective January 1, 2000. See Revocation of Antidumping Duty Orders on Certain Bearings From Hungary, Japan, Romania, Sweden, France, Germany, Italy, and the United Kingdom, 65 FR 42667 (July 11, 2000). The order on spherical plain bearings and parts thereof from France was also revoked, effective July 11, 2005. See Antifriction Bearings and Parts Thereof from France and Singapore: Revocation of Antidumping Duty Orders, 71 FR 54468 (September 15, 2006).
Societe Nouvelle de Fabrication Aeronautique S.A.S.U. (SNFA) and SKF France S.A. have participated in numerous administrative reviews of the order on ball bearings and parts thereof from France. On August 11, 2000, the Department revoked the order, effective May 1, 1999, with respect to sales of bearings by SNFA. See Antifriction Bearings (Other Than Tapered Roller Bearings) and Parts Thereof from France, Germany, Italy, Japan, Romania, Singapore, Sweden and the United Kingdom; Final Results of Antidumping Duty Administrative Reviews and Revocation of Orders in Part, 65 FR 49219 (August 11, 2000).
On January 9, 2007, SNFA and SKF France S.A. and SKF Aerospace France S.A.S. (collectively SKF France) requested that the Department initiate and conduct a changed–circumstances review in order to determine that, for purposes of the order on ball bearings and parts thereof, SNFA is not a successor–in-interest to SKF France following SNFA’s acquisition by that company and that it is the successor–in- interest to the pre–acquisition SNFA.
We did not receive any other comments.
Scope of the Order
The products covered by these orders are ball bearings (other than tapered roller bearings) and parts thereof. These
VerDate Aug<31>2005 18:44 Mar 01, 2007 Jkt 211001 PO 00000 Frm 00013 Fmt 4703 Sfmt 4703 E:\FR\FM\02MRN1.SGM 02MRN1pwal
ker
on P
RO
D1P
C71
with
NO
TIC
ES


B-1
APPENDIX B
CALENDAR OF THE PUBLIC HEARING

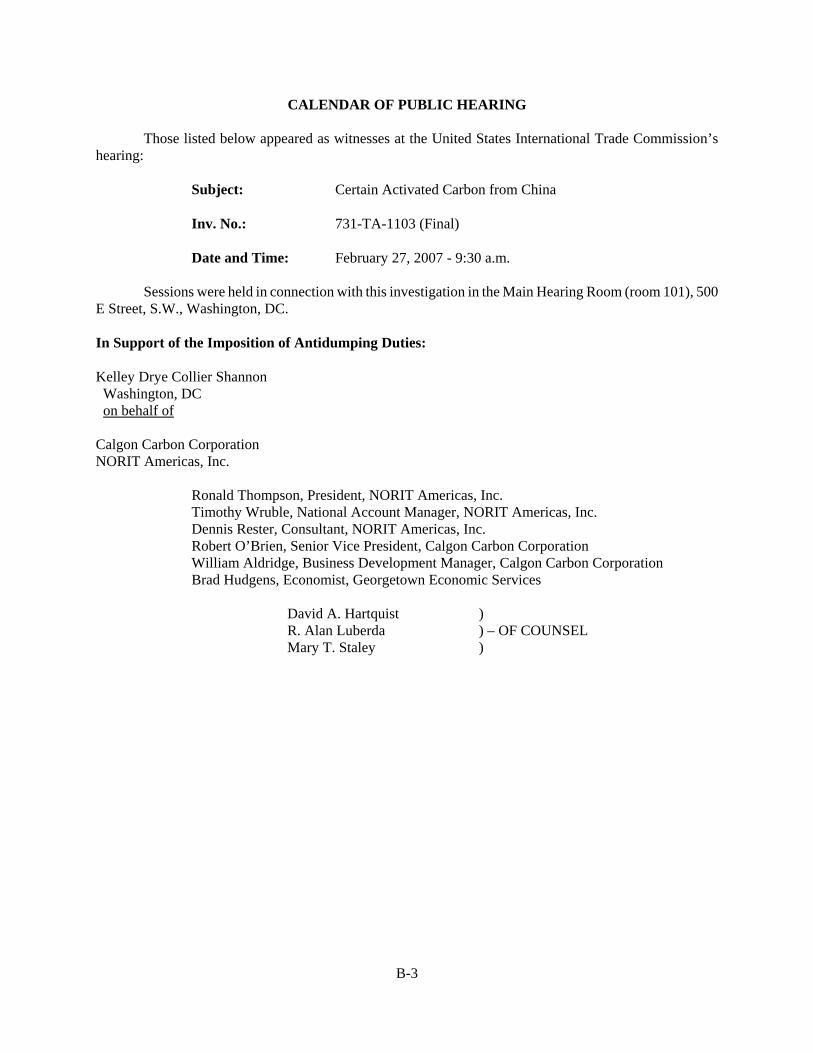
B-3
CALENDAR OF PUBLIC HEARING
Those listed below appeared as witnesses at the United States International Trade Commission’shearing:
Subject: Certain Activated Carbon from China
Inv. No.: 731-TA-1103 (Final)
Date and Time: February 27, 2007 - 9:30 a.m.
Sessions were held in connection with this investigation in the Main Hearing Room (room 101), 500E Street, S.W., Washington, DC.
In Support of the Imposition of Antidumping Duties:
Kelley Drye Collier Shannon Washington, DC on behalf of
Calgon Carbon CorporationNORIT Americas, Inc.
Ronald Thompson, President, NORIT Americas, Inc.Timothy Wruble, National Account Manager, NORIT Americas, Inc.Dennis Rester, Consultant, NORIT Americas, Inc.Robert O’Brien, Senior Vice President, Calgon Carbon CorporationWilliam Aldridge, Business Development Manager, Calgon Carbon CorporationBrad Hudgens, Economist, Georgetown Economic Services
David A. Hartquist )R. Alan Luberda ) – OF COUNSELMary T. Staley )


C-1
APPENDIX C
SUMMARY DATA


C-3
Table C-1CAC: Summary data concerning the U.S. market, 2003-06
* * * * * * *

C-4
Table C-2CAC: U.S. imports and U.S. shipments, by sources, 2003-06, based on questionnaire responses
Source
Calendar year
2003 2004 2005 2006
Quantity (1,000 pounds)
China 58,706 74,816 79,131 76,054
Nonsubject countries 21,188 39,789 51,939 49,350
Total 79,894 114,605 131,069 125,404
Value (1,000 dollars)1
China 18,225 25,592 24,953 24,848
Nonsubject countries 17,692 30,717 33,106 33,549
Total 35,917 56,309 58,059 58,397
Unit value (per pound)1
China $0.31 $0.34 $0.32 $0.33
Nonsubject countries 0.84 0.77 0.64 0.68
Total 0.45 0.49 0.44 0.47
U.S. shipments quantity (1,000 pounds)
China 56,896 70,475 75,709 84,264
Nonsubject countries 20,208 34,268 41,365 45,457
Total 77,104 104,743 117,073 129,721
U.S. shipments value (1,000 dollars)2
China 24,479 30,546 33,156 38,289
Nonsubject countries 20,800 30,873 39,078 44,990
Total 45,279 61,420 72,234 83,279
U.S. shipments unit value (per pound)2
China $0.43 $0.43 $0.44 $0.45
Nonsubject countries 1.03 0.90 0.94 0.99
Total 0.59 0.59 0.62 0.64
1 Landed, duty-paid. 2 F.o.b. point of U.S. shipment.
Note.–Because of rounding, figures may not add to the totals shown.
Source: Compiled from data submitted in response to Commission questionnaires.

D-1
APPENDIX D
PRODUCER, IMPORTER, AND PURCHASER COMMENTS REGARDING DIFFERENCES AND SIMILARITIES BETWEEN
REACTIVATED CARBON AND CERTAIN ACTIVATED CARBON

D-2

D-3
The Commission requested producers, importers, and purchasers to describe the differences andsimilarities between RAC and CAC with respect to: characteristics and uses; interchangeability;manufacturing processes; channels of distribution; customer and producer perceptions; and price. Theresponses follow:
Characteristics and Uses
* * * * * * *
Interchangeability
* * * * * * *
Manufacturing Processes
* * * * * * *
Channels of Distribution
* * * * * * *
Customer and Producer Perceptions
* * * * * * *
Price
* * * * * * *


E-1
APPENDIX E
TRADE AND FINANCIAL INFORMATION ON REACTIVATED CARBON

E-2

1 Nine firms reported they do not produce RAC. They are ***. 2 ***. 3 Calgon, Norit, and California Carbon. ***. 4 All noncommercial production was internally consumed and there were no noncommercial inventory oremployment data reported.
E-3
RAC: U.S. PRODUCERS’ PRODUCTION, SHIPMENTS, AND EMPLOYMENT
Eight producers generally believed to account for nearly all production in the commercial RACmarket and two non-commercial producers which reactivate for their own use provided useable dataconcerning their RAC production.1 2 Three of the eight firms producing RAC for the commercial marketare also producers of CAC.3 Five of the firms producing for the commercial market also reported data ontolling operations. In this industry, the toller provides a reactivation service to a tollee who is the enduser of the tolled product. Presented in table E-1 is a list of the U.S. RAC producers (both commercialand noncommercial) that responded to the Commission’s producer questionnaire. Also presented isinformation concerning each company’s position on the petition, production locations, and their share ofreported 2006 domestic production of RAC.
Table E-2 presents commercial U.S. producers’ capacity, production, capacity utilization,shipment, inventory, and employment data for RAC. Table E-3 presents tolling capacity, capacityutilization, production, shipment, and employment data by U.S. producers of RAC. Table E-4 presentsU.S. producers’ non-commercial RAC capacity, production, capacity utilization, and shipment data.4

E-4
Table E-1RAC: U.S. producers, positions on the petition, U.S. production locations, and shares of reported2006 production
Firm PositionProductionlocation (s)
Share of 2006reported production
(percent)
Commercial:
Calgon Supports Kentucky, Ohio ***
Norit Supports Texas ***
California Carbon *** California ***
American Carbon Services Supports New Jersey ***
*** *** *** ***
*** *** *** ***
*** *** *** ***
*** *** *** ***
Total 100.0
Noncommercial:
*** *** *** ***
*** *** *** ***
Total 100.0
Source: Compiled from data submitted in response to Commission questionnaires.

E-5
Table E-2RAC: Commercial U.S. producers’ capacity, production, capacity utilization, shipments, end-of-period inventories, andemployment-related indicators, 2003-06
Item
Calendar year
2003 2004 2005 2006
Capacity (1,000 pounds) 115,500 118,500 119,300 119,400
Production (1,000 pounds) 87,739 87,676 96,484 97,406
Capacity utilization (percent) 76.0 74.0 80.9 81.6
Commercial shipments:Quantity (1,000 pounds) 79,958 89,289 92,783 93,362
Value (1,000 dollars) 29,252 32,293 34,187 37,736
Unit value (per pound) $0.37 $0.36 $0.37 $0.40
Internal consumption:Quantity (1,000 pounds) *** *** *** ***
Value (1,000 dollars) *** *** *** ***
Unit value (per pound) *** *** *** ***
Company transfers:Quantity (1,000 pounds) *** *** *** ***
Value (1,000 dollars) *** *** *** ***
Unit value (per pound) *** *** *** ***
Total U.S. shipments:Quantity (1,000 pounds) 84,423 92,326 95,682 98,001
Value (1,000 dollars) 31,127 33,641 35,544 39,935
Unit value (per pound) $0.37 $0.36 $0.37 $0.41
Export shipments:Quantity (1,000 pounds) *** *** *** ***
Value (1,000 dollars) *** *** *** ***
Unit value (per pound) *** *** *** ***
Total shipments:Quantity (1,000 pounds) *** *** *** ***
Value (1,000 dollars) *** *** *** ***
Unit value (per pound) *** *** *** ***
Inventories (1,000 pounds) 44,441 38,818 40,061 39,852
Ratio of inventories to total shipments (percent) *** *** *** ***
Production and related workers (PRWs) 160 185 176 163
Hours worked by PRWs (1,000 hours) 339 389 364 337
Hours worked per worker 2,119 2,103 2,068 2,067
Wages paid to PRWs (1,000 dollars) 8,369 9,959 11,021 10,235
Hourly wages $24.69 $25.60 $30.28 $30.37
Productivity (pounds produced per hour) 242.4 215.6 254.4 276.5
Unit labor costs (per pound) $0.10 $0.12 $0.12 $0.11
Source: Compiled from data submitted in response to Commission questionnaires.

5 The firms are: ***. ***. Differences between data reported in the trade and financial sections of theCommission’s producers’ questionnaire primarily are attributable to ***, which provided trade data but did notprovide financial data. 6 These firms are: ***. ***. 7 Also, see petitioners’ posthearing brief, exh. 1, pp. 17-20.
E-6
Table E-3RAC toll conversion: U.S producers’ capacity, production, capacity utilization, shipments, andemployment-related indicators, 2003-06
* * * * * * *
Table E-4RAC: Non-commercial U.S. producers’ capacity, production, capacity utilization, and shipments,2003-06
* * * * * * *
RAC: FINANCIAL EXPERIENCE OF U.S. PRODUCERS
BACKGROUND
Six U.S. firms provided usable financial data for each of their latest four fiscal years on theircommercial non-toll and toll operations on RAC.5 These reported data are believed to represent nearly allof U.S. RAC production in 2006. Also, two firms provided useable data on their non-commercialoperations wherein they reactivate and use RAC entirely within their own operations RAC.6
OPERATIONS ON RAC
Income-and-loss data for the U.S. industry’s RAC operations are presented separately forcommercial non-toll operations and tolling operations of RAC in tables E-5 and E-6, respectively, andsuch data are combined in table E-7.7
Table E-5RAC: Results of commercial non-toll operations of U.S. producers, 2003-06
* * * * * * *
Table E-6RAC: Results of commercial toll operations of U.S. producers, 2003-06
* * * * * * *
Table E-7RAC: Results of commercial non-toll and toll operations combined of U.S. producers, 2003-06
* * * * * * *

8 ***.
E-7
The responding firms’ data on their total assets used in the production, warehousing, and sale ofRAC, return on investment (ROI), and capital expenditures for RAC are shown in table E-8.
Table E-8RAC: Total assets, return on investment, and capital expenditures of U.S. producers, 2003-06
* * * * * * *
With respect to commercial operations, the Commission’s questionnaire requested firms toexplain any price relationship between virgin activated carbon and reactivated carbon. Their commentsare as follows:
***: “***.”
Calgon: “***”.
Norit: “***.”
***: “***”.
Both *** responded that there is a price relationship between CAC and RAC, and that a higherprice of CAC results in a higher price of RAC as well as giving rise to the possibility of expanding thefirms’ reactivation capacity.
With regard to toll conversion of RAC, the Commission’s questionnaire also requestedinformation on the customers, whether reactivation was dedicated (i.e., the customer provides carbon forreactivation, and that material is segregated in storage, processed separately, and the same material isreturned to the customer upon reactivation), and whether there is a price relationship between tolled-RACand CAC. The firms responded follows: ***.
The Commission’s questionnaire requested firms that reactivate the carbon that is used entirelywithin their own operations (i.e., no commercial sales to or tolling performed on behalf of other firms) toreport certain limited data. Useable questionnaire responses were received from two firms: ***.8 Datafor the non-commercial operations on RAC are presented in table E-9. However, these data should beused with caution as they represent only estimates compiled for the specific purpose of responding to theCommission’s questionnaire.
Table E-9RAC: Non-commercial operations of U.S. firms, 2003-06
* * * * * * *The Commission’s questionnaire requested firms and/or municipalities that filled out this section
to provide the names of its suppliers of CAC, whether the firm or municipality has its CAC toll-processed, whether that toll-processing was dedicated, whether its RAC possessed a value, and whetherthere is a price relationship between CAC and RAC. Both ***. Purchases of CAC of the ***.

E-8
RAC: PRICE DATA
In addition to the pricing data for CAC presented in Part V, the Commission requested U.S.producers and importers of RAC to provide quarterly data for the total quantity and f.o.b. (U.S. point ofshipment) value of RAC that was shipped to unrelated customers in the U.S. market. Data were requestedfor the period January 2003 to December 2006. The products for which pricing data were requested aredefined as follows:
Product 1.–Granular reactivated carbon that is steam activated from coal (bituminous, lignite, andanthracite), unwashed, no more than 15 percent greater than 8 mesh and no more than 4 percentunder 30 mesh, iodine no. 900 mg/g min, moisture 2% max
Product 2.– Granular reactivated carbon that is steam activated from coal (bituminous, lignite,and anthracite), unwashed, no more than 5 percent greater than 12 mesh and no more than 4percent under 40 mesh, iodine no. 1000 mg/g min, moisture 2% max
Product 3.–Powder reactivated carbon that is steam activated from coal (bituminous, lignite, andanthracite), unwashed, particle size 90% min, 325 mesh, iodine no. 700 mg/g min, moisture 5%max
Four U.S. producers of RAC, ***, provided usable pricing data for sales of the requestedproducts, although not all firms reported pricing for all products or all quarters. No imports of RAC fromChina were reported. Table E-10 and figures E-1 through E-3 present f.o.b. (U.S. point of shipment)selling prices for the three RAC products defined above produced and sold in the United States. FiguresE-1 through E-3 also show prices of domestic and imported CAC for comparison. By quantity, pricingdata reported by responding firms in 2003 through 2006 accounted for 29.5 percent of U.S. commercialshipments of U.S.-produced RAC.
Table E-10RAC: Weighted-average f.o.b. prices and quantities of domestic reactivated products 1, 2 and 3,January 2003-December 2006
* * * * * * *
Figure E-1CAC and RAC: Weighted-average prices of domestic, imported, and reactivated product 1, byquarters, January 2003-December 2006
* * * * * * *
Figure E-2CAC and RAC: Weighted-average prices of domestic, imported, and reactivated product 2, byquarters, January 2003-December 2006
* * * * * * *
Figure E-3CAC and RAC: Weighted-average prices of domestic, imported and reactivated product 3, byquarters, January 2003-December 2006
* * * * * * *

E-9
Price Trends and Comparisons
U.S. producers’ average prices for reactivated product 1, ***, were *** and, aside from fourquarters in which certain activated product 1 from China undersold reactivated product 1, were *** forboth domestic CAC and subject imported CAC product 1. Overall, prices of reactivated product 1 rose by*** percent between January-March 2003 and October-December 2006. On average, prices forreactivated product 1 during the period were *** percent lower than domestic CAC product 1 and ***percent lower than subject imported CAC product 1. Prices for reactivated product 2 were *** and stood*** the price of U.S. shipments of CAC product 2 imported from China in *** during the period. Overall, prices for reactivated product 2 fell by *** percent between January-March 2003 and October-December 2006. On average, prices for reactivated product 2 during the period were *** percent lowerthan domestic CAC product 2 and *** percent lower than subject imported CAC product 2. Prices forreactivated product 3 show the greatest movement among reactivated products. After fluctuating in thefirst two-and-a-half years of the period, prices of reactivated product 3 rose fairly steadily through thesecond half of 2005 and 2006. Overall, prices in October-December 2006 were *** percent higher thanin January-March 2003. However, almost all of this increase is due to the price increase observed in thefinal six quarters of the period. Prices for U.S.-produced reactivated product 3 were higher than subjectimports of CAC product 3 in eight of 16 quarters in the period. On average, prices for reactivated product3 during the period were *** percent lower than domestic CAC product 3 and *** percent higher thansubject imported CAC product 3.
