ceop-aegis aegis final report (fp7 n°212921) ... the project started with a kick-off meeting held...
TRANSCRIPT
CEOP AEGIS Final Report (FP7 n°212921)
1
Coordinated Asia-European long-term Observing system of Qinghai – Tibet Plateau hydro-
meteorological processes and the Asian-monsoon systEm with Ground satellite Image data and
numerical Simulations
CEOP-AEGIS
Final Report
Website: http://www.ceop-aegis.org/
Contact:
Scientific Coordinator:
Prof. Dr. Massimo Menenti Faculty of Civil Engineering and Geosciences, TU Delft, Delft, The Netherlands Tel: +31 15 2784244 Fax: +31 15 278348 E-mail: [email protected] Deputy coordinator:
Dr. Li Jia Tel: +31 317 481610 Fax: +31 317 419000 E-mail: [email protected] Web site: http://www.alterra.wur.nl/UK/
Project Director:
Dr.J.Colin Tel: +33 3 68 854528 E-mail: [email protected] Web site: http://icube-trio.unistra.fr/fr/index.php/Accueil
Massimo Menenti1, Li Jia2 and Jerome Colin3
1 Faculty of Civil Engineering and Geosciences, TU Delft, Delft, The Netherlands,
2 Alterra, Wageningen University and Research Centre, Wageningen, The Netherlands
3 ICube Laboratory, University of Strasbourg, Illkirch, France

CEOP AEGIS Final Report (FP7 n°212921)
2
CEOP AEGIS Final Report (FP7 n°212921)
3
Contents
Executive Summary ................................................................................................................................... 5
1. Project Context and Main Objectives ............................................................................................... 6
1.1 Context ............................................................................................................................................ 6
1.2 Objectives ........................................................................................................................................ 6
1.3 Work Performed ............................................................................................................................. 7
1.4 Main Results .................................................................................................................................... 8
2. Science and Technology Results ....................................................................................................... 9
2.1 Approach ................................................................................................................................... 9
2.2 Ground observations ................................................................................................................ 9
2.3 Retrieval of surface bio-geophysical variables from EO ......................................................... 11
2.4 Radiative and Energy Balance from EO ................................................................................... 15
2.5 Soil Moisture from EO ............................................................................................................. 18
2.6 Precipitation from EO.............................................................................................................. 21
2.7 Snow and Glaciers ................................................................................................................... 25
2.8 Monsoon and Rainfall Forecasts ............................................................................................. 28
2.9 Plateau Water Balance ............................................................................................................ 32
2.10 Drought Early Warning ............................................................................................................ 35
2.11 Flood Early Warning ................................................................................................................ 38
3. Impact, Dissemination and Exploitation of Results ........................................................................ 41
3.1 Dissemination activities ................................................................................................................ 41
3.1.1 Training sessions .................................................................................................................... 41
3.1.2 Meetings ................................................................................................................................ 45
3.1.3 Website .................................................................................................................................. 46
3.2 Exploitation of Results .................................................................................................................. 47
3.2.1 Data portal ............................................................................................................................. 47
3.2.2 Transnational water resources .............................................................................................. 47
3.3 Impact ........................................................................................................................................... 48
3.3.1 MSc and PhD students ........................................................................................................... 48
3.3.2 Contribution to GEO Activities ............................................................................................... 48
3.3.3 Publications ............................................................................................................................ 51
References .......................................................................................................................................... 51

CEOP AEGIS Final Report (FP7 n°212921)
4
Annex 1 List of Publications .................................................................................................................... 53
Project reports ................................................................................................................................ 53
Other reports .................................................................................................................................. 55
International conferences ............................................................................................................... 56
Journal articles and book chapters ................................................................................................. 57
CEOP AEGIS Final Report (FP7 n°212921)
5
Executive Summary
The headwater areas of seven major rivers in SE Asia, i.e. Yellow River, Yangtze, Mekong, Salween,
Irrawaddy, Brahmaputra and Ganges, are located in the Tibetan Plateau. Estimates of the Plateau water
balance rely on sparse and scarce observations that cannot provide the required accuracy, spatial density
and temporal frequency. Fully integrated use of satellite and ground observations is necessary to support
water resources management in SE Asia and to clarify the roles of the interactions between the land
surface and the atmosphere over the Tibetan Plateau in the Asian monsoon system.
The goal of this project was to:
Construct out of existing ground measurements and current / future satellites an observing system to
determine and monitor the water yield of the Plateau, i.e. how much water is finally going into the
seven major rivers of SE Asia;
Monitor the evolution of snow, vegetation cover, surface wetness and surface fluxes and analyze the
linkage with convective activity, (extreme) precipitation events and the Asian Monsoon;
New or significantly improved algorithms have been developed and evaluated against ground
measurements. Variables retrieved include land surface properties, rain rate, aerosol optical depth, water
vapour, snow cover and water equivalent, soil moisture and lake level. The three years time series of gap-
free daily and hourly evaporation derived from geostationary data collected by the FY-2D satellite is a
major achievement of the project. All expected data products has been generated and made available on
the project data portal.
The hydrologic modeling system has been implemented and applied to the Qinghai Tibet Plateau and the
headwaters of the major rivers in South and East Asia. Case studies on response of atmospheric
circulation and specifically of convective activity to land surface conditions have been completed and the
controlling land surface conditions and processes have been documented.
Two new drought indicators have been developed: Normalized Temperature Anomaly Index (NTAI) and
Normalized Vegetation Anomaly Index (NVAI). Case study in China and India showed that these
indicators capture effectively drought severity and evolution. A new method has been developed for
monitoring and early warning of flooded areas at the regional scale.
The 126 Team Members produced 200 Journal Publications and Technical Reports. Three Stakeholders
Meetings and Advanced Trainings were held and attended by 150 participants from both partner and
external organizations. There are 122 PhD and 110 MSc students completing their education in the
framework of the project. The project was concluded with an International Workshop attended by 150
Participants from 13 Countries.
In 2013 the French Ministère de l'Enseignement Supérieur et de la Recherche awarded to the project the
prize Etoiles de l‘ Europe for the theme Environment: http://www.enseignementsup-
recherche.gouv.fr/cid75867/horizon-2020-lancement-du-programme-europeen-pour-la-recherche-et-l-
innovation.html ; http://multimedia.enseignementsup-recherche.gouv.fr/H2020/index.html#/4/

CEOP AEGIS Final Report (FP7 n°212921)
6
1. Project Context and Main Objectives
1.1 Context
Human life and the entire ecosystem of South East Asia depend upon the monsoon climate and its
predictability. More than 40% of the earth's population lives in this region. Droughts and floods
associated with the variability of rainfall frequently cause serious damage to ecosystems in these
regions and, more importantly, injury and loss of human life.
The headwater areas of seven major rivers in SE Asia, i.e. Yellow River, Yangtze, Mekong, Salween,
Irrawaddy, Brahmaputra and Ganges, are located in the Tibetan Plateau. Estimates of the Plateau water
balance rely on sparse and scarce observations that cannot provide the required accuracy, spatial
density and temporal frequency. Fully integrated use of satellite and ground observations is necessary
to support water resources management in SE Asia and to clarify the roles of the interactions between
the land surface and the atmosphere over the Tibetan Plateau in the Asian monsoon system.
A series of international efforts initiated in 1996 with the GAME-Tibet project. The CEOP – AEGIS
was built upon 10 years of experimental and modeling research and the consortium includes many key-
players and pioneers of this long term research initiative. The identified the elements of a
comprehensive system to observe timely the state of land surface over the Plateau, extract precursor
information to improve forecast precipitation over the headwater areas of the Yellow River, Yangtze,
Mekong, Salween, Irrawaddy, Brahmaputra and Ganga, monitor the water balance of the Plateau and
its water yield, and improve timely detection of floods and droughts, towards an infrastructure for the
Group on Earth Observations (GEO) water theme and capacity building in S and E Asia.
1.2 Objectives
The goal of this project was to:
1. Construct out of existing ground measurements and current / future satellites an observing
system to determine and monitor the water yield of the Plateau, i.e. how much water is finally
going into the seven major rivers of SE Asia; this requires estimating snowfall, rainfall,
evapotranspiration and changes in soil moisture;
2. Monitor the evolution of snow, vegetation cover, surface wetness and surface fluxes and
analyze the linkage with convective activity, (extreme) precipitation events and the Asian
Monsoon; this aims at using monitoring of snow, vegetation and surface fluxes as a precursor
of intense precipitation towards improving forecasts of (extreme) precipitations in SE Asia.
The specific objectives were:
Improve spatial density and temporal frequency of observations with:
1. Ground based observations of radiative and turbulent fluxes and soil moisture over the Plateau at a
limited but representative set of permanent sites; data quality and footprint analysis for upscaling
on satellite grid elements;
2. Satellite observations of snow and vegetation cover, of surface albedo and temperature over the
Plateau;
3. Satellite based estimates of energy and water fluxes over the Plateau;
4. Satellite based estimates of top soil moisture over the Plateau;
5. Integrated ground and satellite observations of precipitation over the Plateau;
6. Estimation of glaciers and snow meltwater using ground and satellite observations;
Contribute to advance understanding of land-atmosphere interactions, monsoon system and
precipitation:
7. Numerical Weather and Climate Prediction modelling system to link these observations with
precipitation forecasts over the Plateau and surrounding areas;
CEOP AEGIS Final Report (FP7 n°212921)
7
Establish a prototype observing system for large area water management by:
8. Monitoring the water balance and water yield of the Plateau
Demonstrate the benefits of the observing system with pilot projects on:
9. Satellite based drought monitoring system of pilot areas of China and India;
10. Satellite based flood monitoring system of pilot areas of China and India;
Contribute to a GEO water theme and capacity building infrastructure for SE Asia
11. Dissemination and Stakeholders Panel
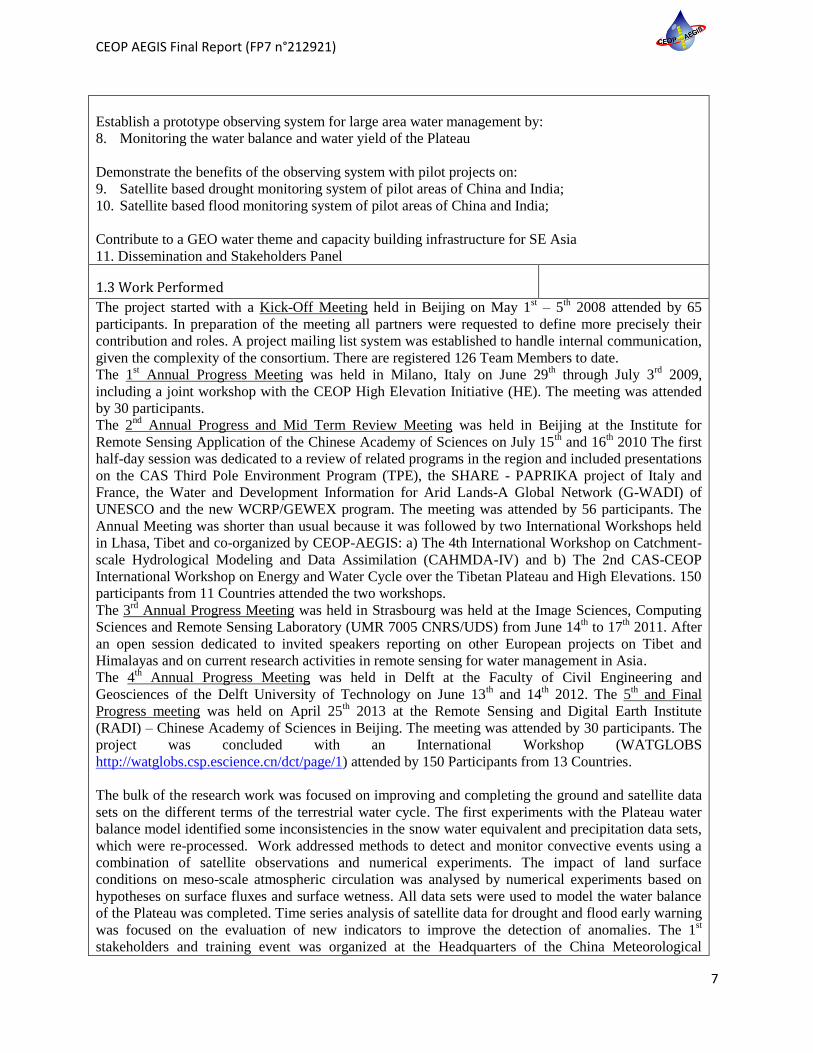
1.3 Work Performed
The project started with a Kick-Off Meeting held in Beijing on May 1st – 5
th 2008 attended by 65
participants. In preparation of the meeting all partners were requested to define more precisely their
contribution and roles. A project mailing list system was established to handle internal communication,
given the complexity of the consortium. There are registered 126 Team Members to date.
The 1st Annual Progress Meeting was held in Milano, Italy on June 29
th through July 3
rd 2009,
including a joint workshop with the CEOP High Elevation Initiative (HE). The meeting was attended
by 30 participants.
The 2nd
Annual Progress and Mid Term Review Meeting was held in Beijing at the Institute for
Remote Sensing Application of the Chinese Academy of Sciences on July 15th and 16
th 2010 The first
half-day session was dedicated to a review of related programs in the region and included presentations
on the CAS Third Pole Environment Program (TPE), the SHARE - PAPRIKA project of Italy and
France, the Water and Development Information for Arid Lands-A Global Network (G-WADI) of
UNESCO and the new WCRP/GEWEX program. The meeting was attended by 56 participants. The
Annual Meeting was shorter than usual because it was followed by two International Workshops held
in Lhasa, Tibet and co-organized by CEOP-AEGIS: a) The 4th International Workshop on Catchment-
scale Hydrological Modeling and Data Assimilation (CAHMDA-IV) and b) The 2nd CAS-CEOP
International Workshop on Energy and Water Cycle over the Tibetan Plateau and High Elevations. 150
participants from 11 Countries attended the two workshops.
The 3rd
Annual Progress Meeting was held in Strasbourg was held at the Image Sciences, Computing
Sciences and Remote Sensing Laboratory (UMR 7005 CNRS/UDS) from June 14th to 17
th 2011. After
an open session dedicated to invited speakers reporting on other European projects on Tibet and
Himalayas and on current research activities in remote sensing for water management in Asia.
The 4th Annual Progress Meeting was held in Delft at the Faculty of Civil Engineering and
Geosciences of the Delft University of Technology on June 13th and 14
th 2012. The 5
th and Final
Progress meeting was held on April 25th 2013 at the Remote Sensing and Digital Earth Institute
(RADI) – Chinese Academy of Sciences in Beijing. The meeting was attended by 30 participants. The
project was concluded with an International Workshop (WATGLOBS
http://watglobs.csp.escience.cn/dct/page/1) attended by 150 Participants from 13 Countries.
The bulk of the research work was focused on improving and completing the ground and satellite data
sets on the different terms of the terrestrial water cycle. The first experiments with the Plateau water
balance model identified some inconsistencies in the snow water equivalent and precipitation data sets,
which were re-processed. Work addressed methods to detect and monitor convective events using a
combination of satellite observations and numerical experiments. The impact of land surface
conditions on meso-scale atmospheric circulation was analysed by numerical experiments based on
hypotheses on surface fluxes and surface wetness. All data sets were used to model the water balance
of the Plateau was completed. Time series analysis of satellite data for drought and flood early warning
was focused on the evaluation of new indicators to improve the detection of anomalies. The 1st
stakeholders and training event was organized at the Headquarters of the China Meteorological

CEOP AEGIS Final Report (FP7 n°212921)
8
Administration in Beijing and saw 39 participants from both partner and external organizations. The
2nd
Training Session and Stakeholders Panel Meeting was held in Rourkela, India, 16-20 April 2012.
More than 90 participants followed the lectures and took part in the interactive sessions of the
Stakeholders Panel meeting. The 3rd
Stakeholders and Training event saw 20 participants from both
partner and external organizations A full list of publications is available on the project web-site.
1.4 Main Results
Improvement of retrieval algorithms, process models and land-atmospheric models. New or
significantly improved algorithms have been developed and evaluated against ground measurements.
Variables retrieved include land surface properties, rain rate, aerosol optical depth, water vapour, snow
cover and water equivalent, soil moisture and lake level. Common to all algorithms developed is the
capability to make use of heterogeneous raw data. A new system has been implemented to monitor
actual evaporation and evaluated against new heat flux data from eddy-covariance and scintillometer
raw data. The three years time series of gap-free daily and hourly evaporation derived from
geostationary data collected by the FY-2D satellite is a major achievement of the project.
Production of data sets. An improved and final version of all expected data products has been
generated and made available on the project data portal.
Case-studies with hydrologic and atmospheric models. The hydrologic modeling system has been
implemented and applied to the Qinghai Tibet Plateau and the headwaters of the major rivers in South
and East Asia. Evaluation against river flow data in China and India has been done. Case studies on
response of atmospheric circulation and specifically of convective activity to land surface conditions
have been completed and the controlling land surface conditions and processes have been documented.
Case-studies on drought monitoring and early warning. A tool-kit has been developed and applied to
monitor recent and severe drought events for the evaluation of the system. Two new drought indicators
were proposed which are Normalized Temperature Anomaly Index (NTAI) and Normalized
Vegetation Anomaly Index (NVAI). Case study in China and India showed that these two drought
indicators were able to capture the drought evolution at different stage of drought occurrence. i.e. the
NTAI responds earlier than the NVAI.
Modeling and visualization of flood events and inundation. A new method has been developed for
monitoring and early warning of flooded areas at the regional scale. Several case studies have been
completed in China and India making use of very diverse satellite data.
Stakeholders and capacity building. Three Stakeholders Meetings and Advanced Trainings were held
and attended by 150 participants from both partner and external organizations. There are 122 PhD and
110 MSc students completing their education in the framework of the project. The project was
concluded with an International Workshop attended by 150 Participants from 13 Countries.
Final Results
- Data base containing ground observations, satellite data and higher level products, hydrologic and
atmospheric model fields for the period 2008 – 2010 over the Qinghai – Tibet Plateau.
- System to generate daily streamflow in the upper catchment of all major river in SE Asia gridded
to 5 km x 5 km.
Potential Impact and Use of Results
Implementation and demonstration of an observing system of water balance and water flow on and
around the Qinghai – Tibet Plateau will provide to all countries information on water resources and the
role of the Plateau in determining weather and climate in the region. The data portal developed and
populated by the project is resident at the Institute of Tibetan Plateau Research of the Chinese
Academy of Sciences, the leading Chinese organization of the Third Pole Environment Program. The
project has contributed to GEO in several ways which are detailed below (see 3.3.2). This included
presenting the project at GEO Plenaries and the GEO Workshops on European Projects and led to the
inclusion of the project in the GEO ST Portfolio and to significant contributions to the GEO water
Strategy and the new Initiative on Cold Regions.
CEOP AEGIS Final Report (FP7 n°212921)
9
2. Science and Technology Results
2.1 Approach
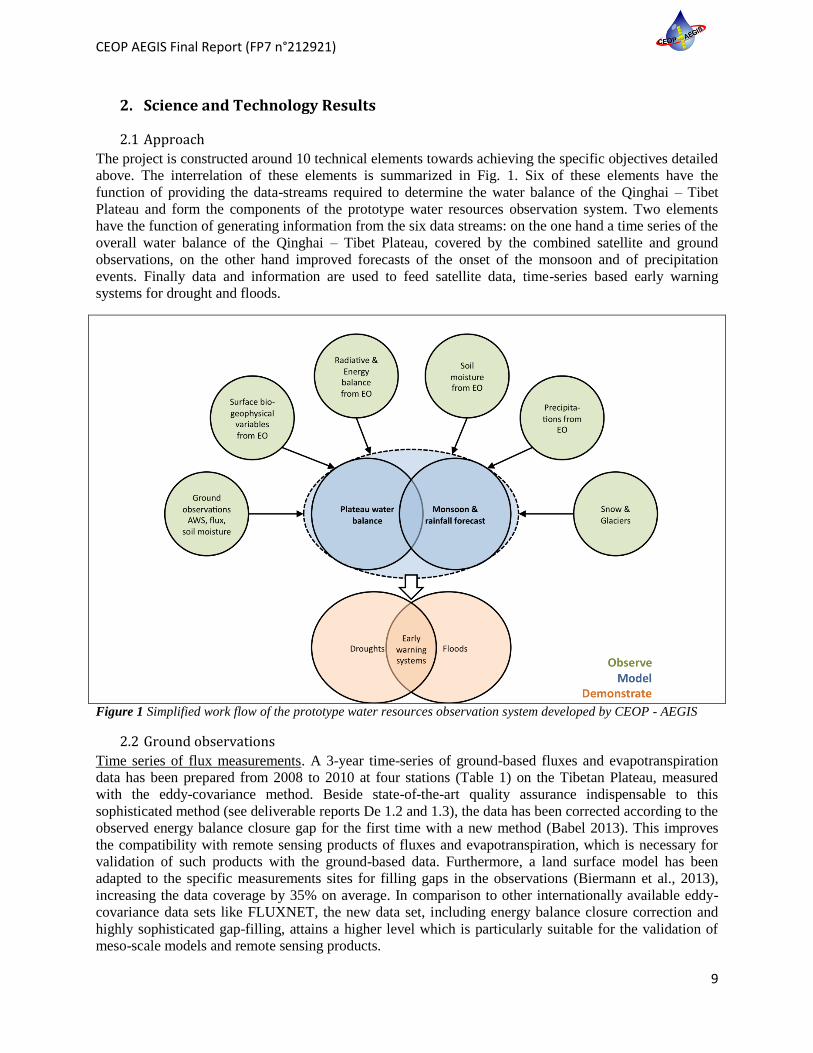
The project is constructed around 10 technical elements towards achieving the specific objectives detailed
above. The interrelation of these elements is summarized in Fig. 1. Six of these elements have the
function of providing the data-streams required to determine the water balance of the Qinghai – Tibet
Plateau and form the components of the prototype water resources observation system. Two elements
have the function of generating information from the six data streams: on the one hand a time series of the
overall water balance of the Qinghai – Tibet Plateau, covered by the combined satellite and ground
observations, on the other hand improved forecasts of the onset of the monsoon and of precipitation
events. Finally data and information are used to feed satellite data, time-series based early warning
systems for drought and floods.
Figure 1 Simplified work flow of the prototype water resources observation system developed by CEOP - AEGIS
2.2 Ground observations
Time series of flux measurements. A 3-year time-series of ground-based fluxes and evapotranspiration
data has been prepared from 2008 to 2010 at four stations (Table 1) on the Tibetan Plateau, measured
with the eddy-covariance method. Beside state-of-the-art quality assurance indispensable to this
sophisticated method (see deliverable reports De 1.2 and 1.3), the data has been corrected according to the
observed energy balance closure gap for the first time with a new method (Babel 2013). This improves
the compatibility with remote sensing products of fluxes and evapotranspiration, which is necessary for
validation of such products with the ground-based data. Furthermore, a land surface model has been
adapted to the specific measurements sites for filling gaps in the observations (Biermann et al., 2013),
increasing the data coverage by 35% on average. In comparison to other internationally available eddy-
covariance data sets like FLUXNET, the new data set, including energy balance closure correction and
highly sophisticated gap-filling, attains a higher level which is particularly suitable for the validation of
meso-scale models and remote sensing products.

CEOP AEGIS Final Report (FP7 n°212921)
10
Table 1 Characteristics and data coverage at the flux measurements sites on the Tibetan Plateau; data coverage for
evapotranspiration is expressed as percentage of the maximum possible number of observations in 2008 - 2010.
Naqu (BJ) Nam Co Linzhi Qomolangma
Latitude 31°22‘7‘‘N 30°46‘22‘‘N 29°45‘56‘‘N 28°21‘29‘‘N
Longitude 91°53‘55‘‘E 90°57‘47‘‘E 94°44‘18‘‘E 86°56‘47‘‘E
Altitude 4502m 4745m 3327m 4293m
Land Cover (target land use) Alpine steppe Alpine steppe Alpine grassland Gravel
Coverage of quality checked
measurements
18.5% 53.4% 34.2% 70.6%
Coverage of gap-filled data 82.2% 83.6% 55.5% 95.0%
Lake evaporation. Evaporation above a lake surface in the monsoon season has been measured with the
eddy-covariance method for the first time on the Tibetan Plateau (Babel, 2013; Biermann et al., 2013).
For the technical realization of such measurements a footprint analysis method has been adapted to
distinguish evaporation flux contributions of the lake surface from the land surface for observations
conducted at the shoreline. The data has been successfully reproduced by a model specially tailored for
lake surfaces which has not been done on the Tibetan Plateau before with this degree of accuracy and
temporal resolution. The measurements and simulations pose a valuable basis for further quantification of
lake surface evaporation on the Plateau scale.
Figure 2 The distribution (left) and frequency statistics (right) of free convection events (FCEs) times at Nam Co
site
Momentum and heat transfer coefficients. Eddy covariance flux data collected from three stations
(Qomolangma station, Namco station and Southeast Tibet station-Linzhi station) on the Tibetan Plateau
were used (Wang and Ma, 2011) to analyze the variation of momentum transfer coefficient (CD), heat
transfer coefficient (CH), aerodynamic roughness length (z0m), thermal roughness length (z0h) and
excess resistance to heat transfer (kB-1). All the data was checked under the data quality control firstly.
The monthly average surface roughness, bulk transfer coefficient and excess resistance to heat transfer at
all three sites are obtained. Momentum transfer coefficient (CD) is quite variable during the day but
relatively stable and lower in the night. The parameter kB-1 exhibits clear diurnal variations with lower
values in the night and higher values in the daytime, especially in the afternoon. Negative values of kB-
1are often observed in the night for relatively smooth surfaces on the Tibetan Plateau.
Free Convection Events. The spatial and temporal structure in the quality of eddy covariance (EC)
measurements at Nam Co site was analyzed (Zhou et al., 2010), by using the comprehensive software
package TK2 together with a footprint model, and the high quality turbulent flux data have been obtained
0 6 12 18 0
Apr
Jun
Aug
Oct
Local time
(a)
Monsoon
Sunrise
Sunset
FCEs
n.V.
6 8 10 12 14 16 180
20
40
60
80
100
120
Local time
FC
Es
freq
uen
cy (
-)
(b) Before monsoon
During monsoon
CEOP AEGIS Final Report (FP7 n°212921)
11
for the investigation of free convection events (FCEs). The research of FCEs at Nam Co site indicates that
the generation of FCEs not only can be detected (Fig.2) in the morning hours, when the diurnal
circulation system changes its previously prevailed wind direction, but also can be triggered by the quick
variation of heating difference between different types of land use during the daytime when clouds cover
the underlying surface or move away. FCEs at Nam Co site are found to occur frequently, which can lead
to the effective convective release of near ground air masses into the atmosphere boundary layer (ABL)
and may strongly influence its local moisture and temperature profiles and its structure.
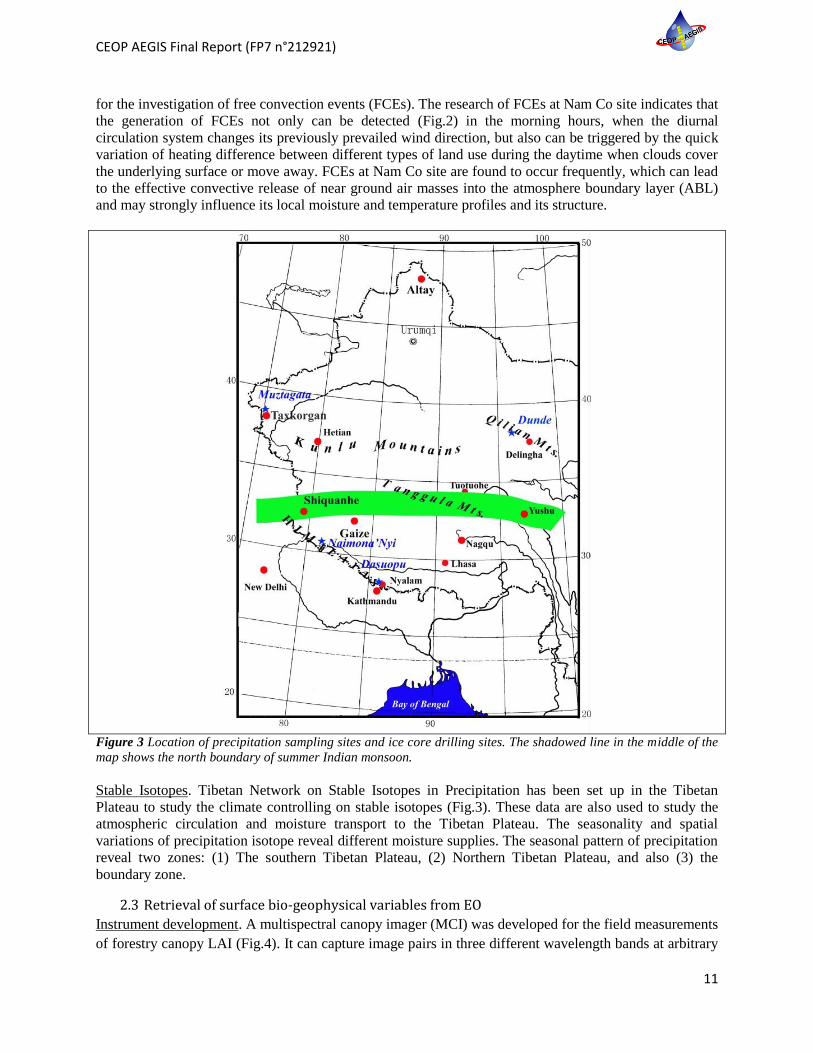
Figure 3 Location of precipitation sampling sites and ice core drilling sites. The shadowed line in the middle of the
map shows the north boundary of summer Indian monsoon.
Stable Isotopes. Tibetan Network on Stable Isotopes in Precipitation has been set up in the Tibetan
Plateau to study the climate controlling on stable isotopes (Fig.3). These data are also used to study the
atmospheric circulation and moisture transport to the Tibetan Plateau. The seasonality and spatial
variations of precipitation isotope reveal different moisture supplies. The seasonal pattern of precipitation
reveal two zones: (1) The southern Tibetan Plateau, (2) Northern Tibetan Plateau, and also (3) the
boundary zone.
2.3 Retrieval of surface bio-geophysical variables from EO
Instrument development. A multispectral canopy imager (MCI) was developed for the field measurements
of forestry canopy LAI (Fig.4). It can capture image pairs in three different wavelength bands at arbitrary

CEOP AEGIS Final Report (FP7 n°212921)
12
zenithal and horizontal directions. The MCI image pairs can be used to discriminate the sky, leaves, cloud
and woody components. As a result, this instrument is capable of measuring the woody area index .
Finally, the LAI values were obtained in several locations after consider the correcting of the clumping
effects and woody components.
Canon 40D
IS-1
LinkPan tilt
Tripod
Metallic arm
Figure 4 Multispectral canopy imager: MCI structure (top left); the clumping indices (bottom left)and woody-to-
total area ratio(bottom right) of one plot at Heihe River in June 2008
Generic inversion algorithm. In order to enable the application of the method to several satellite sensors,
the observation model SLC (soil-leaf-canopy) was extended for applications in the thermal domain. In
addition, look-up table (LUT) techniques were optimized in order to allow for efficient image simulations
under various conditions. A unified equation was derived to describe the TOA radiance as a function of
surface and atmospheric parameters in the optical and thermal domains with the incorporation of
topographic effects. The MODTRAN interrogation technique was also extended into the thermal domain,
and several MODTRAN outputs were identified with physical quantities of four-stream radiative transfer
theory.
Retrieval models to estimate land surface radiative flux under all sky conditions. New methods have been
proposed to simultaneously derive surface shortwave (or longwave) radiative flux components based on
MODIS products using an artificial neural network (ANN), and were validated using in situ measurement
and at Tibetan Plateau region. Based on the ANN, a MODTRAN-CF model driven from the MODTRAN
CEOP AEGIS Final Report (FP7 n°212921)
13
model by incorporating two cloud fraction related factors (hemispherical effective cloud fraction and
regional cloud fraction), was developed to estimate the shortwave flux components under cloudy sky
from MODIS 1-7 channels‘ TOA radiances, and topographic correction was also perform on the
estimated flux.
Albedo retrieval model for topography and scale effect. A scale effect correction factor was defined to
correct the topography and scale effects on the albedo product. This factor is only dependent on DEM and
the geometry of sun and sensor. The correction algorithm includes three steps: (1) a database for slope
and aspect angle, and scale effect correction factor; (2) topography effect correction for finer directional
reflectance; (3) topography and scale effect correction for coarser directional reflectance.
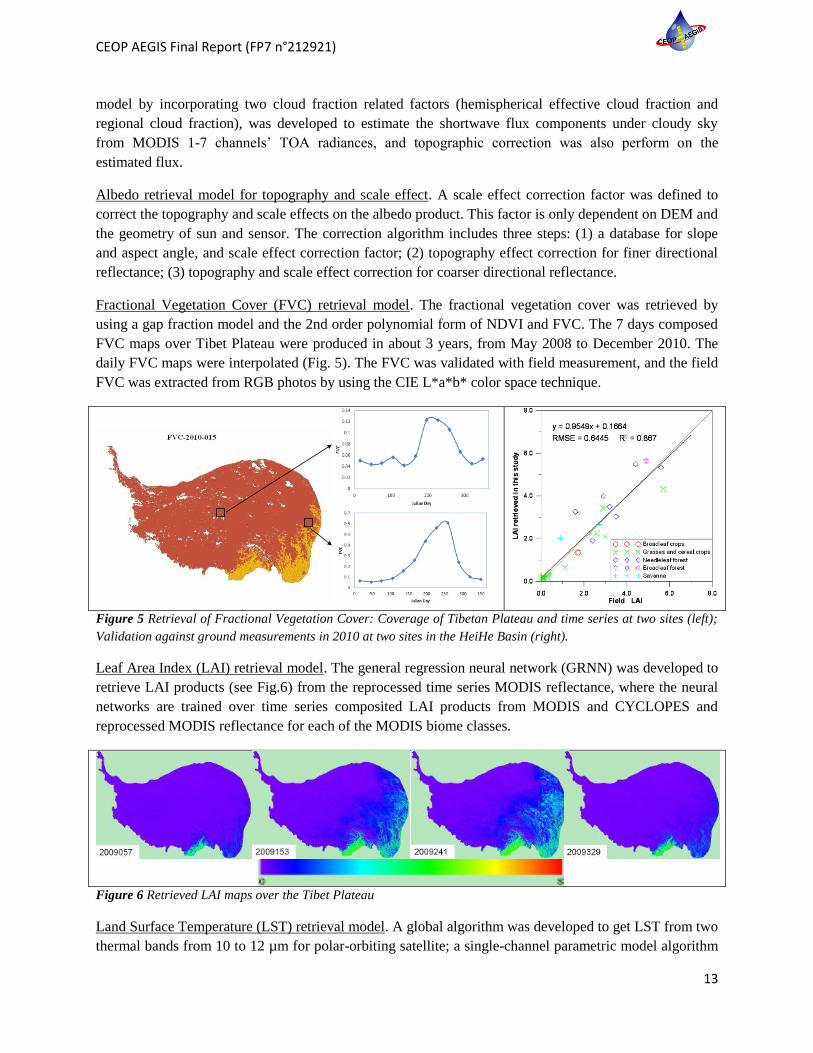
Fractional Vegetation Cover (FVC) retrieval model. The fractional vegetation cover was retrieved by
using a gap fraction model and the 2nd order polynomial form of NDVI and FVC. The 7 days composed
FVC maps over Tibet Plateau were produced in about 3 years, from May 2008 to December 2010. The
daily FVC maps were interpolated (Fig. 5). The FVC was validated with field measurement, and the field
FVC was extracted from RGB photos by using the CIE L*a*b* color space technique.
Figure 5 Retrieval of Fractional Vegetation Cover: Coverage of Tibetan Plateau and time series at two sites (left);
Validation against ground measurements in 2010 at two sites in the HeiHe Basin (right).
Leaf Area Index (LAI) retrieval model. The general regression neural network (GRNN) was developed to
retrieve LAI products (see Fig.6) from the reprocessed time series MODIS reflectance, where the neural
networks are trained over time series composited LAI products from MODIS and CYCLOPES and
reprocessed MODIS reflectance for each of the MODIS biome classes.
Figure 6 Retrieved LAI maps over the Tibet Plateau
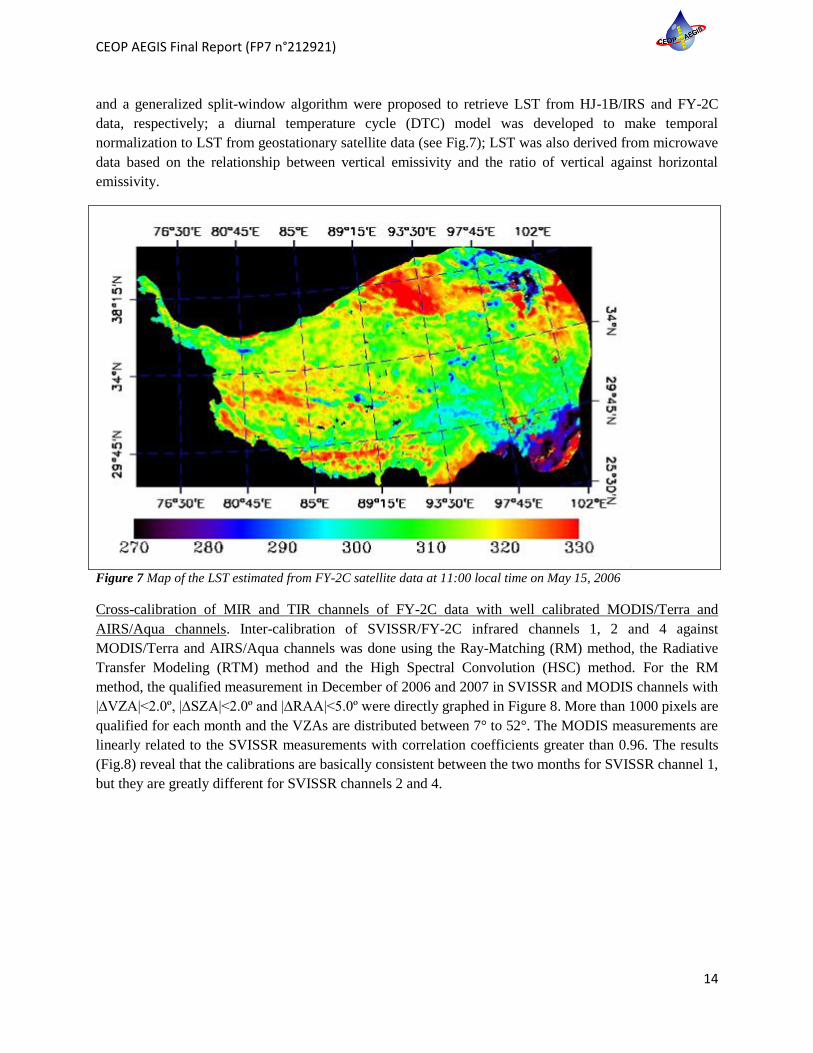
Land Surface Temperature (LST) retrieval model. A global algorithm was developed to get LST from two
thermal bands from 10 to 12 µm for polar-orbiting satellite; a single-channel parametric model algorithm
CEOP AEGIS Final Report (FP7 n°212921)
14
and a generalized split-window algorithm were proposed to retrieve LST from HJ-1B/IRS and FY-2C
data, respectively; a diurnal temperature cycle (DTC) model was developed to make temporal
normalization to LST from geostationary satellite data (see Fig.7); LST was also derived from microwave
data based on the relationship between vertical emissivity and the ratio of vertical against horizontal
emissivity.
Figure 7 Map of the LST estimated from FY-2C satellite data at 11:00 local time on May 15, 2006
Cross-calibration of MIR and TIR channels of FY-2C data with well calibrated MODIS/Terra and
AIRS/Aqua channels. Inter-calibration of SVISSR/FY-2C infrared channels 1, 2 and 4 against
MODIS/Terra and AIRS/Aqua channels was done using the Ray-Matching (RM) method, the Radiative
Transfer Modeling (RTM) method and the High Spectral Convolution (HSC) method. For the RM
method, the qualified measurement in December of 2006 and 2007 in SVISSR and MODIS channels with
|∆VZA|<2.0º, |∆SZA|<2.0º and |∆RAA|<5.0º were directly graphed in Figure 8. More than 1000 pixels are
qualified for each month and the VZAs are distributed between 7° to 52°. The MODIS measurements are
linearly related to the SVISSR measurements with correlation coefficients greater than 0.96. The results
(Fig.8) reveal that the calibrations are basically consistent between the two months for SVISSR channel 1,
but they are greatly different for SVISSR channels 2 and 4.

CEOP AEGIS Final Report (FP7 n°212921)
15
180 200 220 240 260 280 300 320
180
200
220
240
260
280
300
320
Value Error
Intercept 21.673 1.548
Slope 0.9218 0.0056
R 0.980
Stdev 3.857
N 1134
Value Error
Intercept 18.924 1.342
Slope 0.9345 0.0049
R 0.986
Stdev 3.300
N 1032
M
ea
su
rem
en
ts in
MO
DIS
ch
an
ne
l 3
1 (
K)
Measurements in SVISSR channel 1 (K)
Dec., 2006
Linear Fit
(a) Dec., 2007
Linear Fit
180 200 220 240 260 280 300 320
180
200
220
240
260
280
300
320
Measure
ments
in M
OD
IS c
hannel 32 (
K)
Measurements in SVISSR channel 2 (K)
Dec., 2006
Linear Fit
(b)
Value Error
Intercept 16.921 1.671
Slope 0.9404 0.0061
R 0.977
Stdev 4.098
N 1134
Value Error
Intercept 5.493 1.591
Slope 0.9851 0.0058
R 0.983
Stdev 3.735
N 1032
Dec., 2007
Linear Fit
180 200 220 240 260 280 300 320
180
200
220
240
260
280
300
320
Value Error
Intercept -6.921 2.683
Slope 1.0212 0.0092
R 0.961
Stdev 3.153
N 1032
Me
asu
rem
en
ts in
MO
DIS
ch
an
ne
l 2
0 (
K)
Measurements in SVISSR channel 4 (K)
Dec., 2006
Linear fit
(c)
Value Error
Intercept -16.005 2.671
Slope 1.0510 0.0092
R 0.960
Stdev 3.718
N 1134 Dec., 2007
Linear fit
180 200 220 240 260 280 300 320
-9
-6
-3
0
3
6
9
MO
DIS
-SV
ISS
R t
em
pe
ratu
re a
dju
stm
en
t (K
)
BT in SVISSR channels (K)
IR1 (2006) IR1 (2007)
IR2 (2006) IR2 (2007)
IR4 (2006) IR4 (2007)
(d)
Figure 8 Relationships between the MODIS/Terra measurements and the SVISSR/FY-2C measurements (a, b, and c)
and the MODIS-SVISSR temperature adjustments for the BT in SVISSR channels changing from 190 K to 310 K (d)
2.4 Radiative and Energy Balance from EO
A new, dedicated application code name SEBI-Common Framework (SEBI-CF) was developed to
perform the Surface Energy Balance (SEB) calculations over the Tibetan Plateau at high temporal and
spatial resolution. Following a review of existing algorithms, the SEBI-CF has been implemented to
include multiple Surface Energy Balance algorithms. Details about the implementation of the SEBI-
Common Framework were detailed by Colin et al. (2011). The SEBI-CF system provided a gap—free
time series of daily soil heat flux for the period 1/1/2008 – 31/12/2010. This time series was combined
with the corresponding time series of Land Surface Temperature to estimate the thermal admittance of the
land surface for each one of the dominant periodic components identified in LST time series by Fourier
analysis. This spectral thermal admittance was then used to infer the soil thermal properties at different
depths.
Land Surface Temperature (LST): gap-filled hourly time series. At any given time a number of image
pixel capture emittance by clouds, since such observations do not provide valid retrievals of Land Surface
Temperature. Cloud-screening, such as the one included in the retrieval procedure described above, does

CEOP AEGIS Final Report (FP7 n°212921)
16
not completely remove cloud-affected observations. We have developed a new procedure which refines
detection and removal of invalid observations due to erroneous retrieval and clouds and fills the gap thus
created in the time series. Using several surface observations per day (albedo, LST, etc.), which is
feasible when using radiometric data acquired by geo-stationary platforms, makes estimating and
monitoring surface heat fluxes accurate and reliable. The HANTS algorithm is based on discrete Fourier
transform (Menenti et al., 1993; Verhoef et al., 1996) and it was developed to deal with time series of
irregularly spaced observations and to identify and remove cloud-contaminated observations. Under
CEOP – AEGIS it was adapted to deal with the high temporal resolution of observations by geo-
stationary platforms. The results (Fig. 9) of a test on 1 month of hourly data over the entire Qinghai –
Tibet Plateau show that such complex signals are reconstructed accurately, notwithstanding frequent and
long gaps due to clouds. To evaluate the accuracy of signal modeling and reconstruction the gaps have
been created by removing segments of observations and the r.m.s.e. of the reconstructed signal has been
evaluated against the removed observations.
Figure 9 Modeling and gap-filling of LST time series retrieved from radiometric data collected by the Feng-Yun 2C
satellite
Monitoring of turbulent fluxes with geostationary satellite data. The hourly LST observations made it
feasible to calculate actual Evapo-Transpiration hourly for the entire period 2008 – 2010 and the entire
study area (2.4 106 km2), although the computational load of hourly estimates remains very considerable.
The gain obtained during the month of June 2008 by integrating the estimations of hourly evaporation at
the Qomolangma station, in comparison with the two methods to estimate the total daily ETd described
below is clearly documented by the scatter plots in Fig. 10. The data products on radiative and turbulent
fluxes for the period 2008 – 2010 and the entire study area were improved on the basis of the evaluations
described above. Although the intended temporal frequency was initially one week, we succeeded in the
production of a continuous, gap-free daily ET data product for the reference period and the entire study
area (Fig.11).
CEOP AEGIS Final Report (FP7 n°212921)
17
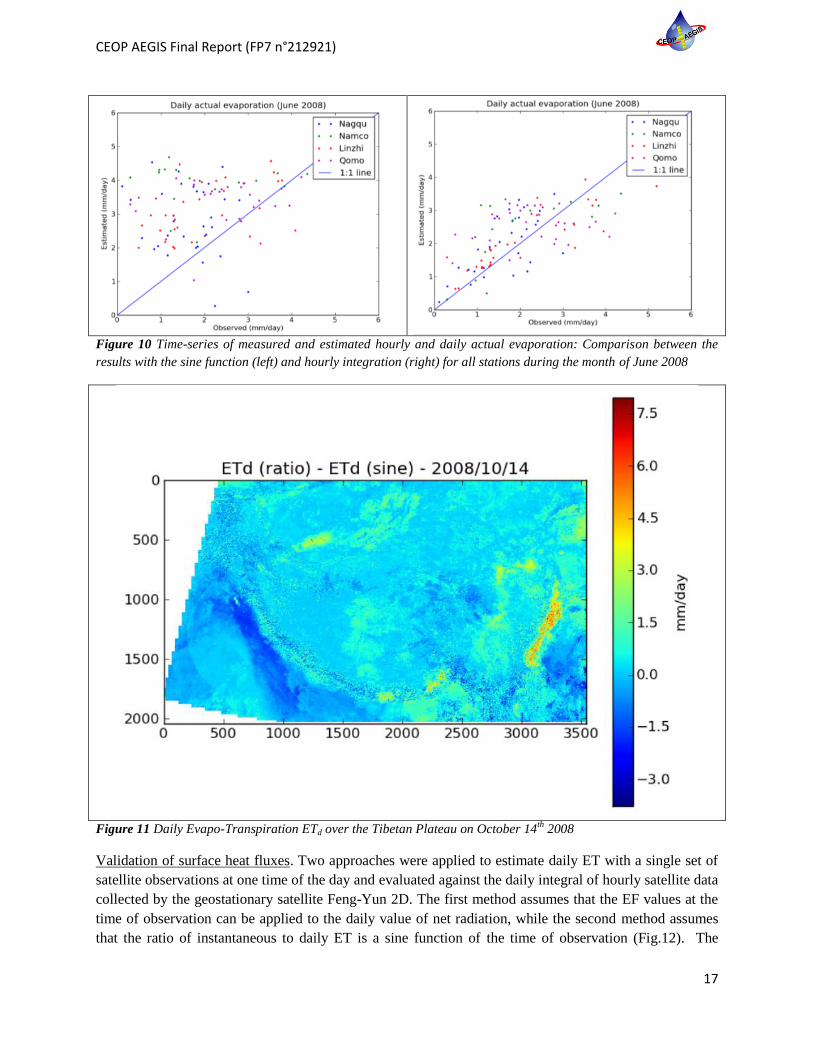
Figure 10 Time-series of measured and estimated hourly and daily actual evaporation: Comparison between the
results with the sine function (left) and hourly integration (right) for all stations during the month of June 2008
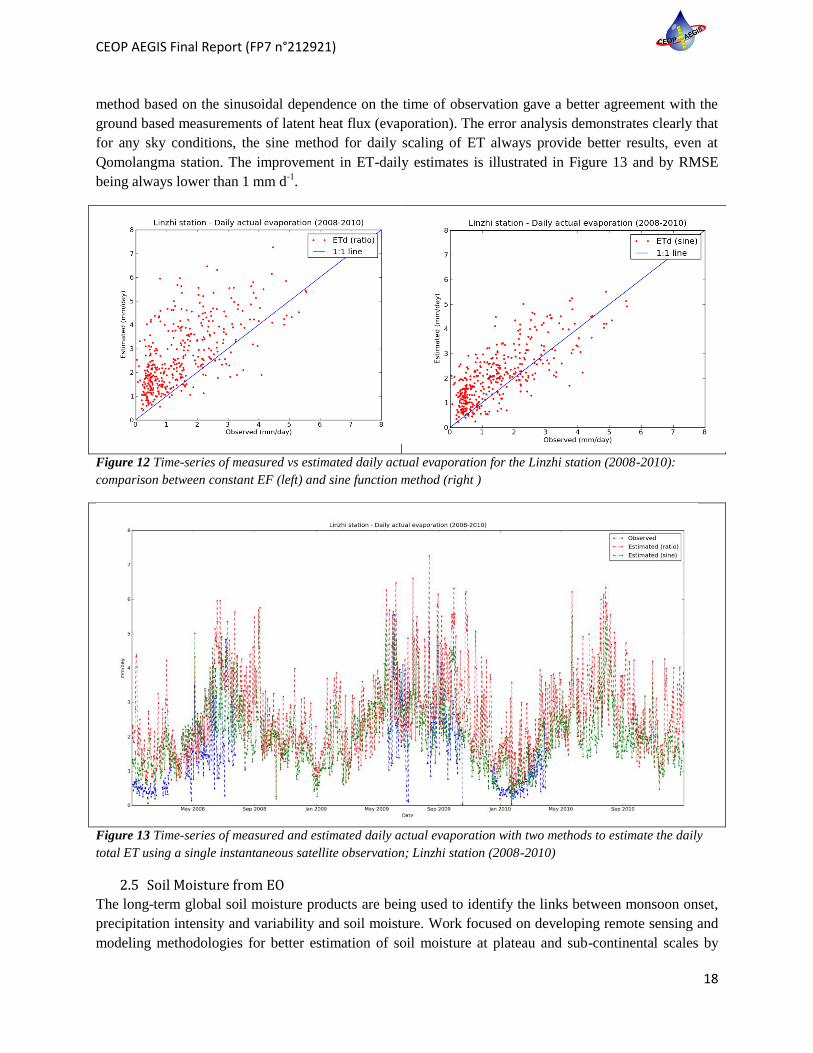
Figure 11 Daily Evapo-Transpiration ETd over the Tibetan Plateau on October 14
th 2008
Validation of surface heat fluxes. Two approaches were applied to estimate daily ET with a single set of
satellite observations at one time of the day and evaluated against the daily integral of hourly satellite data
collected by the geostationary satellite Feng-Yun 2D. The first method assumes that the EF values at the
time of observation can be applied to the daily value of net radiation, while the second method assumes
that the ratio of instantaneous to daily ET is a sine function of the time of observation (Fig.12). The
CEOP AEGIS Final Report (FP7 n°212921)
18
method based on the sinusoidal dependence on the time of observation gave a better agreement with the
ground based measurements of latent heat flux (evaporation). The error analysis demonstrates clearly that
for any sky conditions, the sine method for daily scaling of ET always provide better results, even at
Qomolangma station. The improvement in ET-daily estimates is illustrated in Figure 13 and by RMSE
being always lower than 1 mm d-1
.
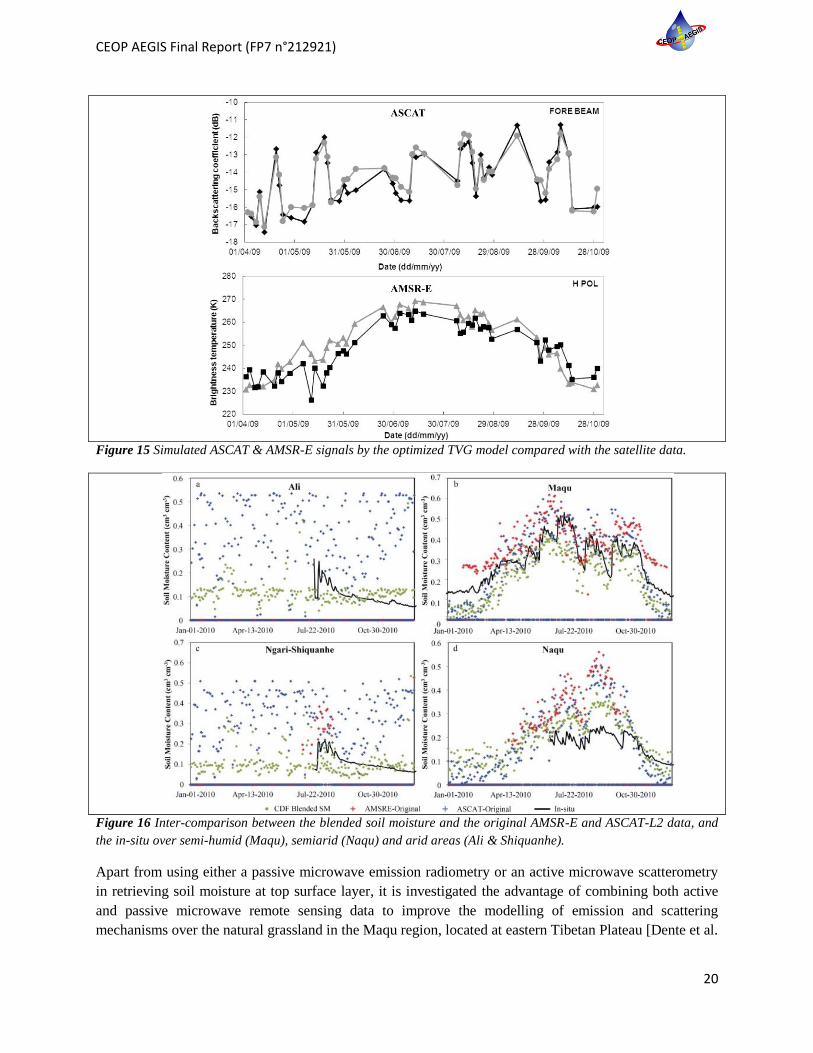
Figure 12 Time-series of measured vs estimated daily actual evaporation for the Linzhi station (2008-2010):
comparison between constant EF (left) and sine function method (right )
Figure 13 Time-series of measured and estimated daily actual evaporation with two methods to estimate the daily
total ET using a single instantaneous satellite observation; Linzhi station (2008-2010)
2.5 Soil Moisture from EO
The long-term global soil moisture products are being used to identify the links between monsoon onset,
precipitation intensity and variability and soil moisture. Work focused on developing remote sensing and
modeling methodologies for better estimation of soil moisture at plateau and sub-continental scales by

CEOP AEGIS Final Report (FP7 n°212921)
19
using available and future space observations, and validations of the developed methodologies using
observation data from both routine observations from the monitoring sites and dedicated field
experiments.
We aimed at building up continuous in-situ soil moisture measurements at regional scale of selected sites
on the Tibetan Plateau after understanding the state of the art algorithms and available soil moisture
products. This task leads to the establishment of the Tibetan-Plateau Soil Moisture (SM) and Soil
Temperature (ST) Observatory (Figure 14). This observatory includes three observation networks
distributed in three different climate conditions (e.g. cold-humid, cold semi-arid, and cold arid) [Su et al.
2011].
Figure 14 Location of the three regional networks of the Tibetan Plateau soil moisture and soil temperature
Observatory (Tibet-Obs).
The continuous 3+ year in-situ soil moisture and soil temperature data have been collected from this
observatory [van de Velde et al. 2008, Su et al. 2011, Dente et al. 2012, Bhatti et al. 2013]. The data
collection is still on-going and data analysis is maintained. The in-situ data has been used to examine the
ECMWF‘s soil moisture analysis [Su et al. 2013], to calibrate and validate soil moisture retrieval from
ASAR data [van der Velde et al. 2012], to calibrate and validate the blended soil moisture from both
AMSR-E and ASCAT-L2 data [Zeng et al. 2013], and to be used as one of core validation sites for SMOS
and SMAP satellite missions. The preliminary results and documentation of uncertainties have been
reported. It is suggested that the in-situ soil moisture and soil temperature measurements are valuable
references in this particular environment and shall be maintained and updated whenever it is possible [Su
et al. 2011; Zeng et al. 2013].
CEOP AEGIS Final Report (FP7 n°212921)
20
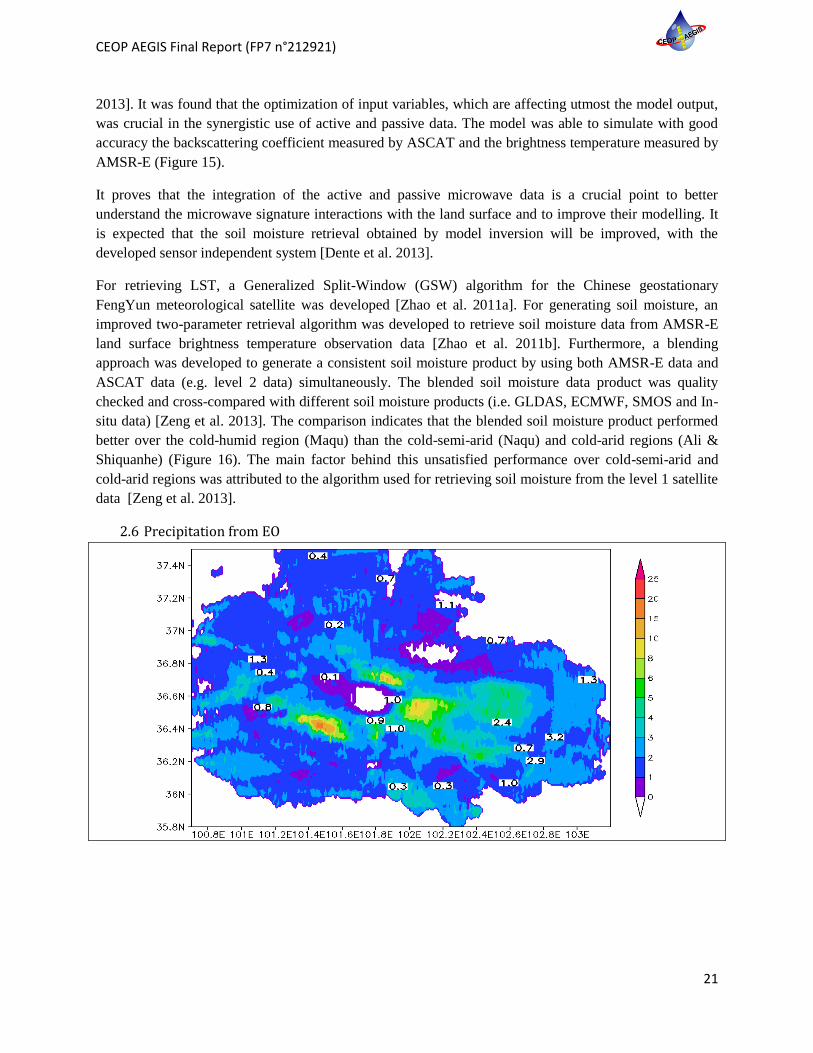
Figure 15 Simulated ASCAT & AMSR-E signals by the optimized TVG model compared with the satellite data.
Figure 16 Inter-comparison between the blended soil moisture and the original AMSR-E and ASCAT-L2 data, and
the in-situ over semi-humid (Maqu), semiarid (Naqu) and arid areas (Ali & Shiquanhe).
Apart from using either a passive microwave emission radiometry or an active microwave scatterometry
in retrieving soil moisture at top surface layer, it is investigated the advantage of combining both active
and passive microwave remote sensing data to improve the modelling of emission and scattering
mechanisms over the natural grassland in the Maqu region, located at eastern Tibetan Plateau [Dente et al.
CEOP AEGIS Final Report (FP7 n°212921)
21
2013]. It was found that the optimization of input variables, which are affecting utmost the model output,
was crucial in the synergistic use of active and passive data. The model was able to simulate with good
accuracy the backscattering coefficient measured by ASCAT and the brightness temperature measured by
AMSR-E (Figure 15).
It proves that the integration of the active and passive microwave data is a crucial point to better
understand the microwave signature interactions with the land surface and to improve their modelling. It
is expected that the soil moisture retrieval obtained by model inversion will be improved, with the
developed sensor independent system [Dente et al. 2013].
For retrieving LST, a Generalized Split-Window (GSW) algorithm for the Chinese geostationary
FengYun meteorological satellite was developed [Zhao et al. 2011a]. For generating soil moisture, an
improved two-parameter retrieval algorithm was developed to retrieve soil moisture data from AMSR-E
land surface brightness temperature observation data [Zhao et al. 2011b]. Furthermore, a blending
approach was developed to generate a consistent soil moisture product by using both AMSR-E data and
ASCAT data (e.g. level 2 data) simultaneously. The blended soil moisture data product was quality
checked and cross-compared with different soil moisture products (i.e. GLDAS, ECMWF, SMOS and In-
situ data) [Zeng et al. 2013]. The comparison indicates that the blended soil moisture product performed
better over the cold-humid region (Maqu) than the cold-semi-arid (Naqu) and cold-arid regions (Ali &
Shiquanhe) (Figure 16). The main factor behind this unsatisfied performance over cold-semi-arid and
cold-arid regions was attributed to the algorithm used for retrieving soil moisture from the level 1 satellite
data [Zeng et al. 2013].
2.6 Precipitation from EO
CEOP AEGIS Final Report (FP7 n°212921)
22
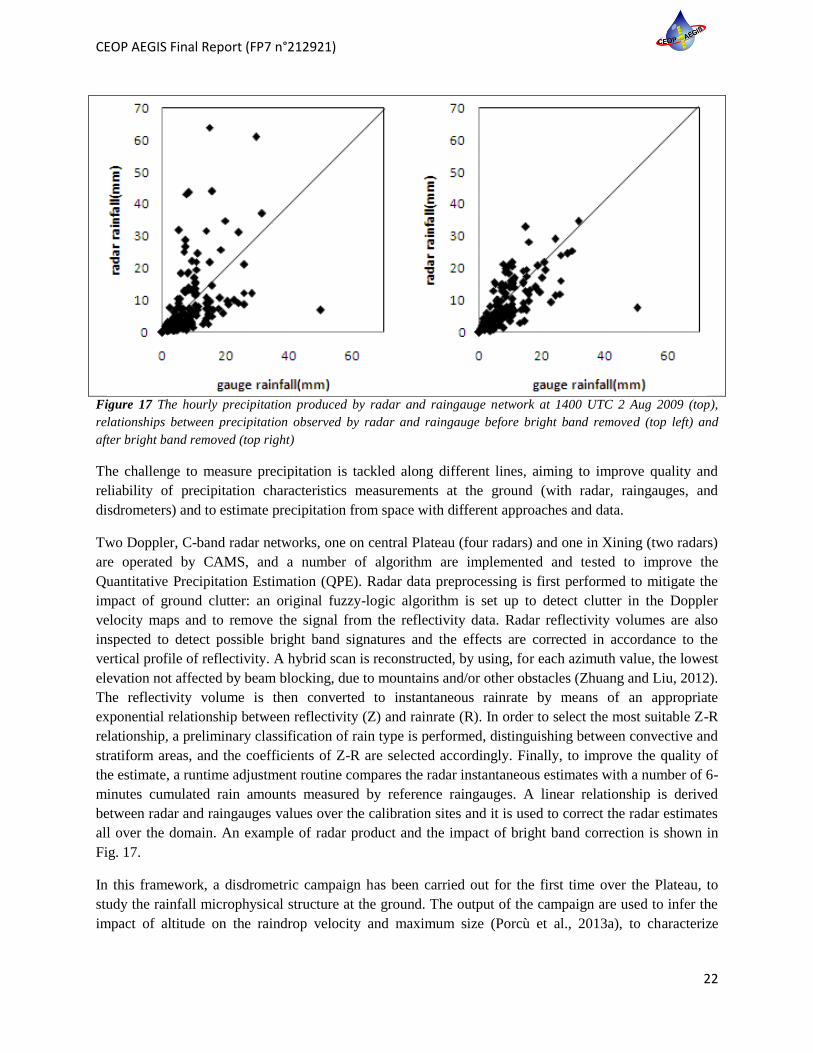
Figure 17 The hourly precipitation produced by radar and raingauge network at 1400 UTC 2 Aug 2009 (top),
relationships between precipitation observed by radar and raingauge before bright band removed (top left) and
after bright band removed (top right)
The challenge to measure precipitation is tackled along different lines, aiming to improve quality and
reliability of precipitation characteristics measurements at the ground (with radar, raingauges, and
disdrometers) and to estimate precipitation from space with different approaches and data.
Two Doppler, C-band radar networks, one on central Plateau (four radars) and one in Xining (two radars)
are operated by CAMS, and a number of algorithm are implemented and tested to improve the
Quantitative Precipitation Estimation (QPE). Radar data preprocessing is first performed to mitigate the
impact of ground clutter: an original fuzzy-logic algorithm is set up to detect clutter in the Doppler
velocity maps and to remove the signal from the reflectivity data. Radar reflectivity volumes are also
inspected to detect possible bright band signatures and the effects are corrected in accordance to the
vertical profile of reflectivity. A hybrid scan is reconstructed, by using, for each azimuth value, the lowest
elevation not affected by beam blocking, due to mountains and/or other obstacles (Zhuang and Liu, 2012).
The reflectivity volume is then converted to instantaneous rainrate by means of an appropriate
exponential relationship between reflectivity (Z) and rainrate (R). In order to select the most suitable Z-R
relationship, a preliminary classification of rain type is performed, distinguishing between convective and
stratiform areas, and the coefficients of Z-R are selected accordingly. Finally, to improve the quality of
the estimate, a runtime adjustment routine compares the radar instantaneous estimates with a number of 6-
minutes cumulated rain amounts measured by reference raingauges. A linear relationship is derived
between radar and raingauges values over the calibration sites and it is used to correct the radar estimates
all over the domain. An example of radar product and the impact of bright band correction is shown in
Fig. 17.
In this framework, a disdrometric campaign has been carried out for the first time over the Plateau, to
study the rainfall microphysical structure at the ground. The output of the campaign are used to infer the
impact of altitude on the raindrop velocity and maximum size (Porcù et al., 2013a), to characterize
CEOP AEGIS Final Report (FP7 n°212921)
23
raindrop spectra of liquid precipitation (D‘Adderio et al., 2013), and to calibrate radar estimates,
improving the relationship between actual rainrate and measured reflectivity.
Radar data and estimates contributed in different ways to the implementation of the satellite precipitation
estimates. First, the reflectivity volumes are used, for selected case studies, to assess the consistency of
the cloud resolving model outputs used for the development of the passive microwave part of the
algorithm. Secondly, the radar derived rainrate maps are assumed as ground reference to construct the
supervised dataset used to train of the artificial neural network, which is the framework for the multi-
spectral rain retrieval techniques. Finally, case studies are performed, comparing different global satellite
precipitation products, the output of the multi-spectral technique, and the ground radar estimates.
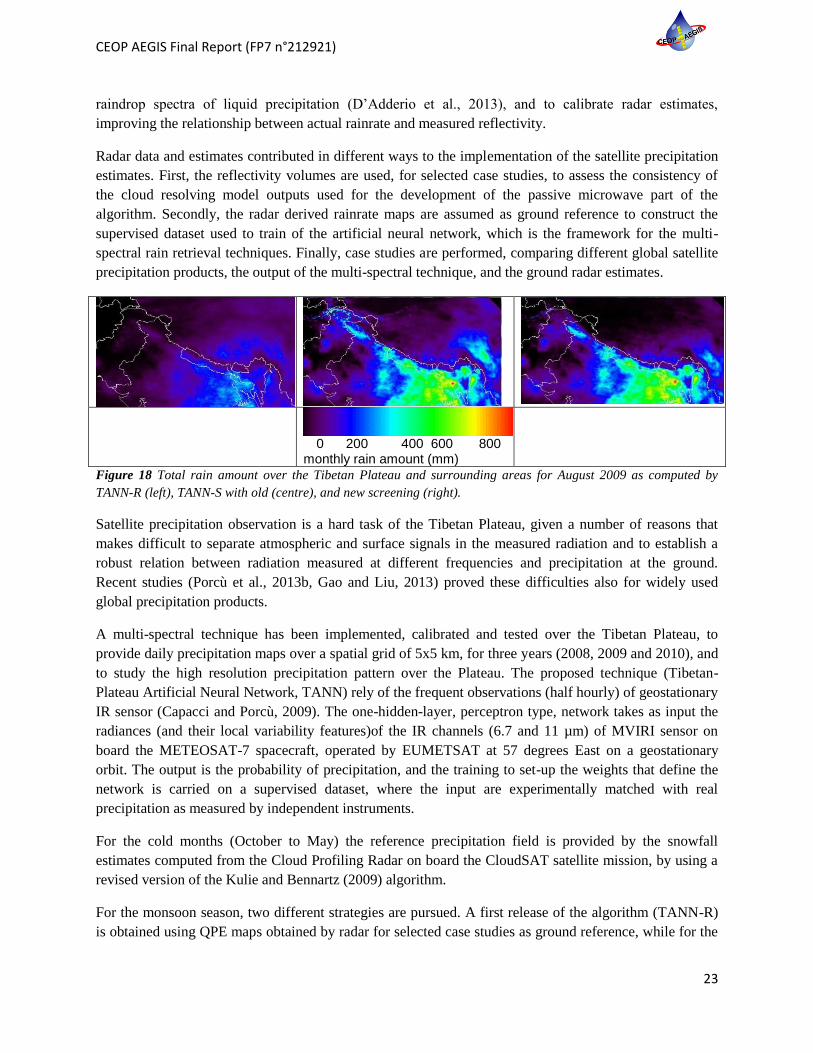
0 200 400 600 800
monthly rain amount (mm)
Figure 18 Total rain amount over the Tibetan Plateau and surrounding areas for August 2009 as computed by
TANN-R (left), TANN-S with old (centre), and new screening (right).
Satellite precipitation observation is a hard task of the Tibetan Plateau, given a number of reasons that
makes difficult to separate atmospheric and surface signals in the measured radiation and to establish a
robust relation between radiation measured at different frequencies and precipitation at the ground.
Recent studies (Porcù et al., 2013b, Gao and Liu, 2013) proved these difficulties also for widely used
global precipitation products.
A multi-spectral technique has been implemented, calibrated and tested over the Tibetan Plateau, to
provide daily precipitation maps over a spatial grid of 5x5 km, for three years (2008, 2009 and 2010), and
to study the high resolution precipitation pattern over the Plateau. The proposed technique (Tibetan-
Plateau Artificial Neural Network, TANN) rely of the frequent observations (half hourly) of geostationary
IR sensor (Capacci and Porcù, 2009). The one-hidden-layer, perceptron type, network takes as input the
radiances (and their local variability features)of the IR channels (6.7 and 11 µm) of MVIRI sensor on
board the METEOSAT-7 spacecraft, operated by EUMETSAT at 57 degrees East on a geostationary
orbit. The output is the probability of precipitation, and the training to set-up the weights that define the
network is carried on a supervised dataset, where the input are experimentally matched with real
precipitation as measured by independent instruments.
For the cold months (October to May) the reference precipitation field is provided by the snowfall
estimates computed from the Cloud Profiling Radar on board the CloudSAT satellite mission, by using a
revised version of the Kulie and Bennartz (2009) algorithm.
For the monsoon season, two different strategies are pursued. A first release of the algorithm (TANN-R)
is obtained using QPE maps obtained by radar for selected case studies as ground reference, while for the
CEOP AEGIS Final Report (FP7 n°212921)
24
second release (TANN-S) the output of a passive microwave algorithm, based on SSMIS data, used in the
training set. The passive algorithm used here is the Cloud Radiation Database (CRD, Mugnai et al., 2008)
that makes use of a Cloud Resolving Model to construct a database of cloud profiles in the region of
interest; a radiative transfer model is applied to the cloud profile to retrieve a corresponding brightness
temperature (Tb) set, simulating the sensors observation. To perform the retrieval, the Tb database is
searched for the Tb set closest to the observed one and the precipitation rate at the ground of the
corresponding cloud profile is assigned. In general, the screening of surface signal is a key issue of any
passive microwave precipitation algorithm.
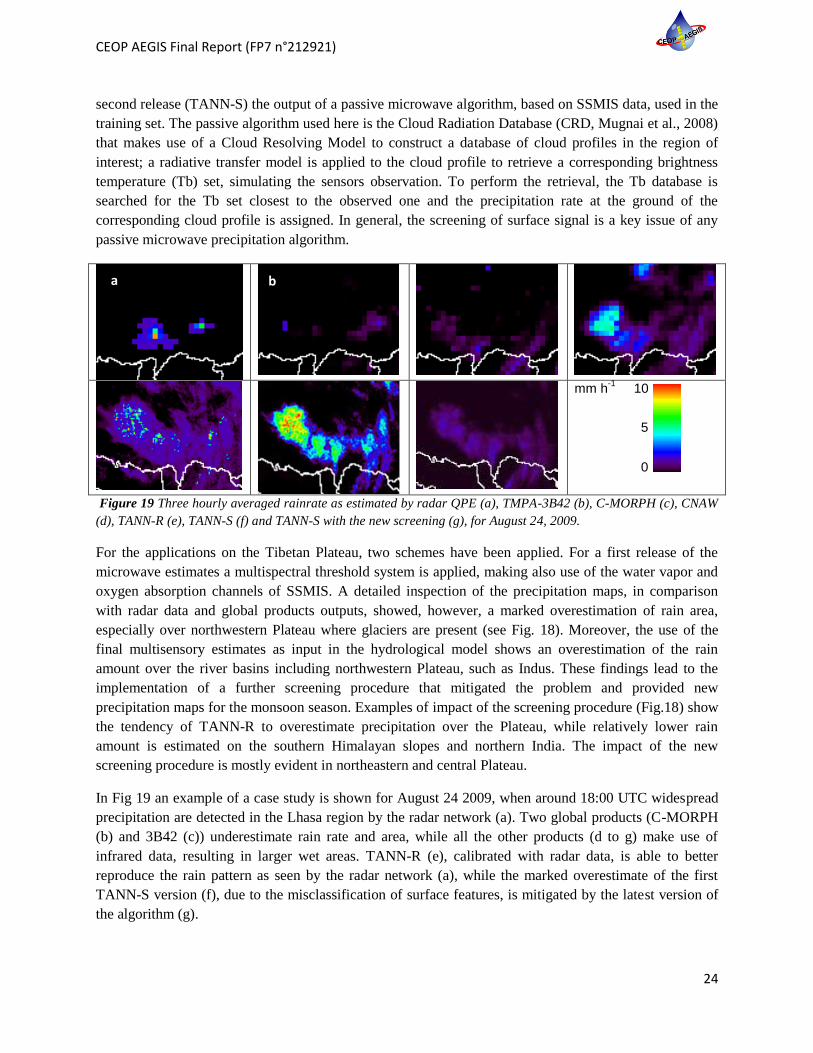
mm h-1
10
5
0
Figure 19 Three hourly averaged rainrate as estimated by radar QPE (a), TMPA-3B42 (b), C-MORPH (c), CNAW
(d), TANN-R (e), TANN-S (f) and TANN-S with the new screening (g), for August 24, 2009.
For the applications on the Tibetan Plateau, two schemes have been applied. For a first release of the
microwave estimates a multispectral threshold system is applied, making also use of the water vapor and
oxygen absorption channels of SSMIS. A detailed inspection of the precipitation maps, in comparison
with radar data and global products outputs, showed, however, a marked overestimation of rain area,
especially over northwestern Plateau where glaciers are present (see Fig. 18). Moreover, the use of the
final multisensory estimates as input in the hydrological model shows an overestimation of the rain
amount over the river basins including northwestern Plateau, such as Indus. These findings lead to the
implementation of a further screening procedure that mitigated the problem and provided new
precipitation maps for the monsoon season. Examples of impact of the screening procedure (Fig.18) show
the tendency of TANN-R to overestimate precipitation over the Plateau, while relatively lower rain
amount is estimated on the southern Himalayan slopes and northern India. The impact of the new
screening procedure is mostly evident in northeastern and central Plateau.
In Fig 19 an example of a case study is shown for August 24 2009, when around 18:00 UTC widespread
precipitation are detected in the Lhasa region by the radar network (a). Two global products (C-MORPH
(b) and 3B42 (c)) underestimate rain rate and area, while all the other products (d to g) make use of
infrared data, resulting in larger wet areas. TANN-R (e), calibrated with radar data, is able to better
reproduce the rain pattern as seen by the radar network (a), while the marked overestimate of the first
TANN-S version (f), due to the misclassification of surface features, is mitigated by the latest version of
the algorithm (g).
a b

CEOP AEGIS Final Report (FP7 n°212921)
25
A B 0 500 1000 1500 2000 mm y-1
Figure 20 Daily precipitation data product Tibetan Plateau 2008 - 2010: daily averages over the headwaters of
main river basins (a) and mean annual precipitation (b)
These algorithms were applied to generate a daily time series of precipitation for the entire Tibetan
Plateau and the period 2008 – 2010 (Fig.20a). The time series of 10-days averaged daily precipitation
over four river basins (restricted to the Plateau area) show different seasonal and annual variability
moving from East (Indus) to West (Yangtze). The mean annual precipitation amount shown in Fig. 20b
has been computed for the three years of the Project using TANN-S technique
2.7 Snow and Glaciers
Meltwater from snow, glaciers and permafrost if an important term of the Plateau water balance. First, we
developed a prototype system for mapping snow cover, fractional snow cover, and snow depth. Next a
modeling and data assimilation procedure was developed to use satellite retrievals of Snow Water
Equivalent, SWE, and maps of the soil freeze/thaw status to produce data sets on these variables from
2008 to 2010 and the entire Plateau area. The data set have been issued in project ftp. We also provided a
high-resolution forcing data set and soil parameter data sets from a microwave land data assimilation
system from 2008 to 2010. As regards the glaciers meltwater, we have carried out the first glacier
investigation data set on China. We modeled the energy and mass balance of the Zhadang glacier surface
in the Nam Co basin. In addition, we monitored the lake level change from ICESat and determined
geometric dependency of 244 lakes directly fed by glacial runoff on QTP. Finally, we presented a
synthesized scheme for simulation of snow distribution and melt on the QTP.
Snow Cover Mapping and SWE Retrieval. We developed a new blending daily snow cover algorithm
through improving the NSIDC snow algorithms and combining the Terra and Aqua MODIS with AMSR-
E data on the Qinghai Tibet Plateau (QTP). There are three major steps in our methodology. At first,
AMSR-E Snow Depth (SD) data and MODIS Fractional Snow Cover (FSC) data were collected and
processed. Also, we have demonstrated a cubic spline interpolation method for improving the accuracy of
FSC data with cloudy removal in the QTP region. There we proposed a combination rule to produce a
new SD dataset (with spatial resolution 0.1◦), using the AMSR-E SD data (with spatial resolution 0.25◦)
and MODIS FSC data (with spatial resolution 500m). The new synthetic SD dataset combining AMSR-E
and MODIS was named AMSD. Secondly, meteorological fields were modeled using the WRF model.
Driven by the distributed meteorological data, parameters of snow model were calibrated against the
combined SD and station observation in-situ. Thirdly, combined SD was assimilated into snow model

CEOP AEGIS Final Report (FP7 n°212921)
26
using Ensemble Kalman Filter (ENKF) method. The results were validated by different methods. Figure
21 shows the flowchart of simulation of snowmelt using different RS data.
Figure 21 The flowchart of simulation of snowmelt using different RS data
The combination rule determines the merging of MODIS SCF data and AMSR-E SD data and is based on
two key-assumptions. First, in a AMSR-E grid with the spatial resolution 0.25°, the snowpack is
inhomogeneously distributed in the regions where MODIS SCF value is greater than zero. Second, the SD
value in one grid from AMSR-E is an average value over the entire grid. Figure 22 shows the
combination of AMSR-E SWE data and MODIS FSC data, where the blended product shos the variability
of FSC modulating the low resolution SWE.

CEOP AEGIS Final Report (FP7 n°212921)
27
Figure 22 Combination of AMSR-E SWE data and MODIS FSC data. A is the filtered FSC data with spatial
resolution of 0.1 degree, B is the AMSR-E SWE data with spatial resolution of 0.25 Degree. C is the combined SWE
data with resolution of 0.1 Degree.
The snow cover area was further validated using the in-situ snow depth data and the snow cover area data
set were produced from 2008 to 2010.
Observations of lake levels with ICESat/GLAS. Direct glacial elevation changes on the Tibetan plateau
are difficult to obtain. It is however possible to use elevation data from the GLAS laser altimetry
instrument on board of the ICESat satellite to accurately monitor lake level changes. Lake level variations
between 2003 and 2009 for 157 Tibetan lakes were obtained and trends of each lake evaluated (Fig.23).

CEOP AEGIS Final Report (FP7 n°212921)
28
Figure 23 Lake level trends on the Tibetan plateau between 2003 and 2009 determined with ICESAT / GLAS
observations (Phan Hien et al., 2011)
Next we linked glaciers and lakes in the entire QTP using the SRTM DTM and evaluated the contribution
of glacier meltwater to the water balance of each lake (Fig.24).
Figure 24 Dependency of the Tibetan lakes on direct glacial runoff determined by integrating the SRTM and
glaciers inventory (Phan Hien et al., 2013)
2.8 Monsoon and Rainfall Forecasts
The purpose of this study was to understand the land-atmosphere interaction processes in influencing the
daily precipitation events, and to help improving the heavy rainfall forecast skill of meso-scale numerical
models over the Tibetan Plateau (TP) and surrounding regions. The work had a two-fold focus: (a)
Numerical experiments on effects of underlying surface heterogeneities on initiations of meso-scale
CEOP AEGIS Final Report (FP7 n°212921)
29
convections and (b) Impact of surface heterogeneity on the forecasts of rainfall and other near surface
variables and evaluation of land surface effects on daily rainfall forecasts.
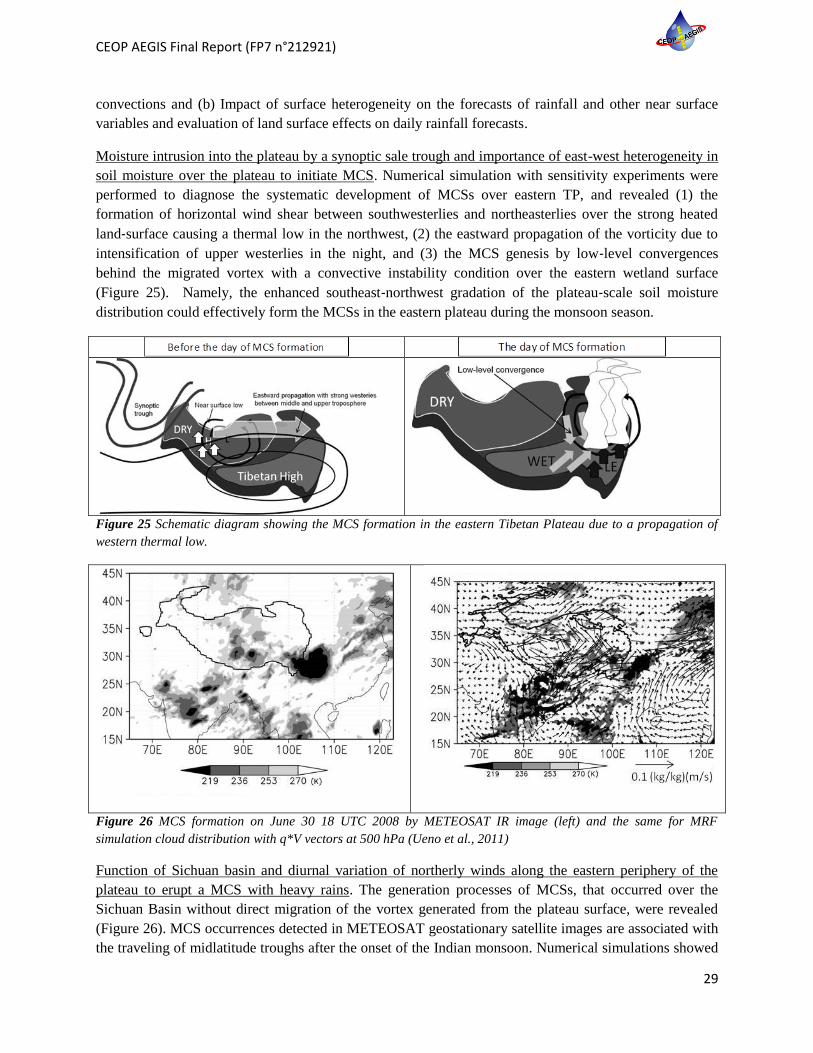
Moisture intrusion into the plateau by a synoptic sale trough and importance of east-west heterogeneity in
soil moisture over the plateau to initiate MCS. Numerical simulation with sensitivity experiments were
performed to diagnose the systematic development of MCSs over eastern TP, and revealed (1) the
formation of horizontal wind shear between southwesterlies and northeasterlies over the strong heated
land‐surface causing a thermal low in the northwest, (2) the eastward propagation of the vorticity due to
intensification of upper westerlies in the night, and (3) the MCS genesis by low‐level convergences
behind the migrated vortex with a convective instability condition over the eastern wetland surface
(Figure 25). Namely, the enhanced southeast‐northwest gradation of the plateau‐scale soil moisture
distribution could effectively form the MCSs in the eastern plateau during the monsoon season.
Figure 25 Schematic diagram showing the MCS formation in the eastern Tibetan Plateau due to a propagation of
western thermal low.
Figure 26 MCS formation on June 30 18 UTC 2008 by METEOSAT IR image (left) and the same for MRF
simulation cloud distribution with q*V vectors at 500 hPa (Ueno et al., 2011)
Function of Sichuan basin and diurnal variation of northerly winds along the eastern periphery of the
plateau to erupt a MCS with heavy rains. The generation processes of MCSs, that occurred over the
Sichuan Basin without direct migration of the vortex generated from the plateau surface, were revealed
(Figure 26). MCS occurrences detected in METEOSAT geostationary satellite images are associated with
the traveling of midlatitude troughs after the onset of the Indian monsoon. Numerical simulations showed

CEOP AEGIS Final Report (FP7 n°212921)
30
that the MCS was triggered in the evening by strengthening of the low‐level wind convergences with
horizontal shear between the southerly monsoon flow, with large convective available potential energy,
and the northerly dry intrusion. Sensitivity numerical experiments revealed that the topography of the
Sichuan Basin was able to cause the sudden onset of MCSs apart from the plateau and higher soil
moisture in the basin could enhance a heavy precipitation zone.
Study on the interaction between land surface, PBL and convective activities by using a single column
model. A Single Column Model (SCM) for GRAPES is constructed for the purpose of evaluating
parameterizations of physical processes. Two observational datasets including Wangara and the third
Global Energy and Water Cycle Experiment Atmospheric Boundary Layer Study (GABLS-3) SCM field
observations have been applied to evaluate this SCM. CASE3 (CoLM land surface scheme coupled with
ABL scheme) simulates less sensible heat fluxes and smaller surface temperature which corresponds with
its lower potential temperature at the bottom of the ABL. Moreover, CASE3 simulates turbulence that is
weaker during the daytime and stronger during nighttime which corresponds with a wind speed at 200 m
higher during daytime and lower during nighttime. CASE1 (observed surface temperature taken as lower
thermal forcing) and CASE2 have no soil moisture prediction and simulate a similar water vapor mixing
ratio, while CASE3 has a soil moisture prediction and simulates wetter conditions.
Figure 27 Seasonal mean daily precipitation (mm d
-1) of 24-hour forecast and GPCP. The left and right panels are
for winter and summer respectively. (a) DJF-mean daily precipitation of 24-hour forecast using initial soil data
from T639; (b) DJF-mean daily precipitation of 24-hour forecast using initial soil data from GLDAS; (c) DJF-mean
daily precipitation of GPCP. (d), (e) and (f) are similar to (a), (b) and (c) but for JJA-mean.
CEOP AEGIS Final Report (FP7 n°212921)
31
Systematic evaluation of land surface effects on daily rainfall forecasts over Tibetan Plateau. Successive
24-hour forecast experiments by using GRAPES_Meso have been conducted with 15-km horizontal
resolution for winter (December to February of 2011/2012) and summer months (June to August of
2012). The experiments are designed to utilize different initial values of soil moisture and temperature,
which are from the CMA operational global forecast model - TL639 and NCEP global land data
assimilation system (GLDAS) respectively. The experiments show that GRAPES model can well capture
the rainfall distribution, but exhibits excessive rainfall amount on average. Despite of the obvious
difference of initial soil data, there exists little difference in rainfall forecast both in winter and summer.
This is understandable because the two initial soil moisture values exhibit little difference comparing with
the two initial soil temperature. And, it is believed that soil moisture should play much more important
roles. This conclusion is preliminary and in an average sense.
The seasonal mean daily precipitation of 24-hour forecast using initial soil data from TL639 and GLDAS
was compared with observations from GPCP (Fig.27). Clearly, GRAPES model can well capture the
rainfall distribution. The observational precipitation in winter as shown in Fig.27c has three rainfall areas
located at north-western part of Tibetan Plateau, south-eastern part of China and north-eastern Indian
subcontinent. Comparing with the observations, the GRAPES_Meso reasonably forecasts these three
rainfall areas except for the excessive rainfall over the Sichuan Basin of China. Also, it is noted that the
two forecasts using different initial soil conditions exhibit little difference at the 24-hour forecast range
(Figs.27a and 27b). Summer is the rainy season in south-eastern and eastern Asia, characterizing as the
Asian monsoon season. As shown in Fig.27f, observational main rain belt extends from the Indian
subcontinent to the southern and eastern China. Again, the GRAPES_Meso does good job in forecasting
the main features of monsoon rainfall (Figs.27d and 27e). Comparing the two forecasts with different
initial soil conditions as plotted in Figs.27d and 27e, again there exists little difference between the two,
indicating the minor effects of LSM as having found in the winter-time forecast. It seems that beyond the
12-hour forecast range, initial soil conditions play little roles in influencing the rainfall amount and
distribution on average. However, whether the initial soil conditions influence the precipitating systems or
not still needs to be investigated further.
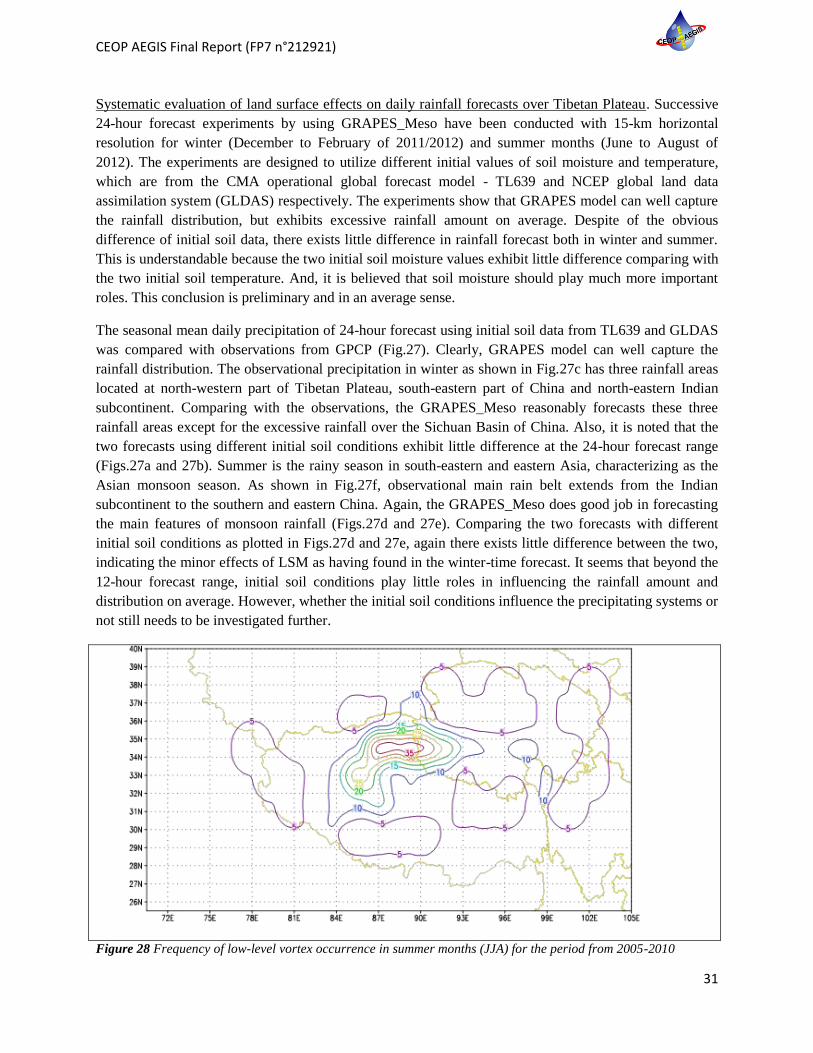
Figure 28 Frequency of low-level vortex occurrence in summer months (JJA) for the period from 2005-2010
CEOP AEGIS Final Report (FP7 n°212921)
32
Statistical analysis of low-level vortex occurrence and its relationship with Plateau-scale land surface
inhomogeneity over Qinghai – Tibet Plateau. Statistical analysis of low-level vortex occurrence are
conducted by using the ECMWF reanalysis data for the boreal summer during 2005-2010. It is interesting
to note that most of the low–level vortices always occur over the almost fixed region as shown in Fig.28.
And, further analysis show that this rather fixed region corresponds to the strong east-west gradients of
soil moisture and thermal conditions of PBL. Except for 2 cases, 98% of low-level vortex occurrence
show significant correlations with soil moisture at 90% significance level, and 93% exhibit high
correlations with east-west gradient of soil moisture at 95% significance level. If the occurred low-level
vortices are classified into developing (life time more than 36 hours) and short duration ones, the
developing vortices show much higher correlations with soil moisture and its gradient. Also, the PBL
thermal conditions and their east-west gradients show the similar relationship with low-level vortex
occurrence. These indicate the strong coupling between the low-level vortex occurrence and plateau-scale
land surface inhomogeneities. However, to what extent land surface inhomogeneities influence the
occurrence of low-level vortex, or there exists only simultaneous coupling between the two, need to be
further analysed.
2.9 Plateau Water Balance
We developed a GIS-based hydrological model, named ‗Qinghai-Tibetan Plateau Spatial Processes in
Hydrology (QTP-SPHY), to monitor the water balance of the QTP for 2008-2010. In addition, long-term
changes in the water balance elements of the QTP have been analyzed for the period 1970 to 2010 based
on the data from the ground meteorological stations and E.O. database. The SPHY is based on the
PCRGLOB-WB model, but with additional improved routines for cryospheric processes. The SPHY
model is a raster based highly detailed full distributed cryospheric-hydrological model, based on
commonly accepted standards from multiple proven hydrological models. The model is setup at a high
spatial resolution (5km) and simulates the complete hydrological cycle on a daily step. The actual runoff
which is calculated for each grid cell consists of four contributing factors. These are: runoff originating
from rain, runoff originating from snow melt, runoff originating from glacial melt, and baseflow. Runoff
and groundwater base flow are transferred to the to the drainage network and routed along the digital
elevation model.
The long-term ground observed dataset has been built based on the observed climate and hydrologic data
during the period 1970 to 2010 from 89 meteorological stations of the Qinghai – Tibet Plateau. Spatial
interpolation has been processing to provide 5×5 km climate dataset for the entire plateau considering the
location and the elevation of the grids. The climate and hydrologic variables include mean, maximum and
minimum daily temperature, vapor pressure, wind speed and sunshine duration. For the water balance
elements, changes in precipitation, potential evapotranspiration, evapotranspiration and streamflow have
been evaluated using the Mann-Kendall method.

CEOP AEGIS Final Report (FP7 n°212921)
33
Figure 29 Water balance components Tibetan Plateau (area within red boundary) 2008-2010 (mm/yr).
Water balance of the QTP from the hydrologic model. The SPHY model simulates the contribution of
glacier melt, snow melt, rainfall-runoff and base flow to the total flow from the plateau. For 2008-2010
their relative contributions to total flow were 4%, 55%, 15% and 26%, respectively (Fig.29). Besides, the
SPHY model is used to assess the average annual water yield for each of the major river basins with
sources on the Tibetan Plateau (Table 2).
Table 2 Annual water yield for major river basins originating on the Tibetan Plateau. Numbers are representative
for the area of the river basins on the Plateau (area within the red boundary in Figure 25) for 2008-2010.
River basin Annual water yield (km3/yr) Annual water yield (mm/yr)
Indus 9 94
Ganges-Brahmaputra 285 747
Mekong 74 855
Salween 68 631
Yangtze 475 916
Yellow River 185 809
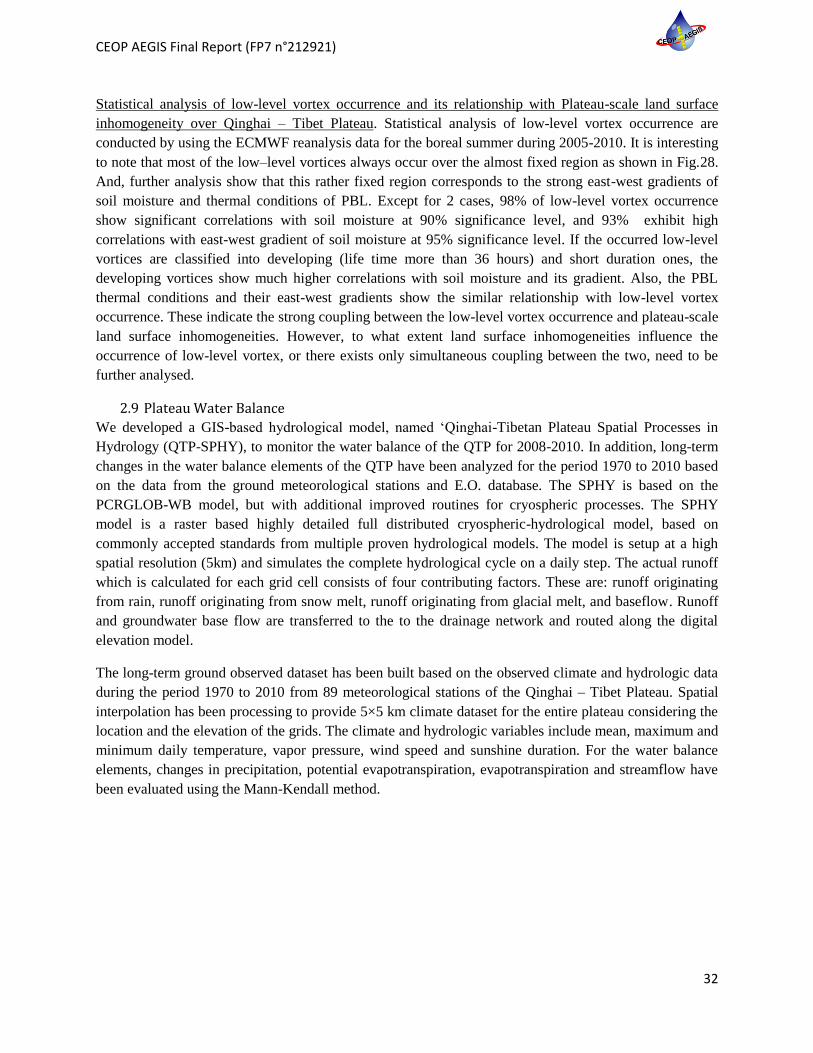
Time series analysis of water balance of the QTP. Fig.30a shows the variation of annual precipitation
from 1970 to 2010. Annual precipitation had increasing trend (P<0.1), and the increasing rate was about
0.11mm/10a. Fig.30b shows the spatial distribution of changes in annual precipitation from 1970 to 2010.
Annual precipitation increased at 66 stations (74.2%), and the increase trend is significant at 37 stations.
CEOP AEGIS Final Report (FP7 n°212921)
34
Figure 30 (a) Annual precipitation from 1970 to 2010 averaged over the entire Plateau and (b) spatial distribution
of changes in annual precipitation from 1970 to 2010.
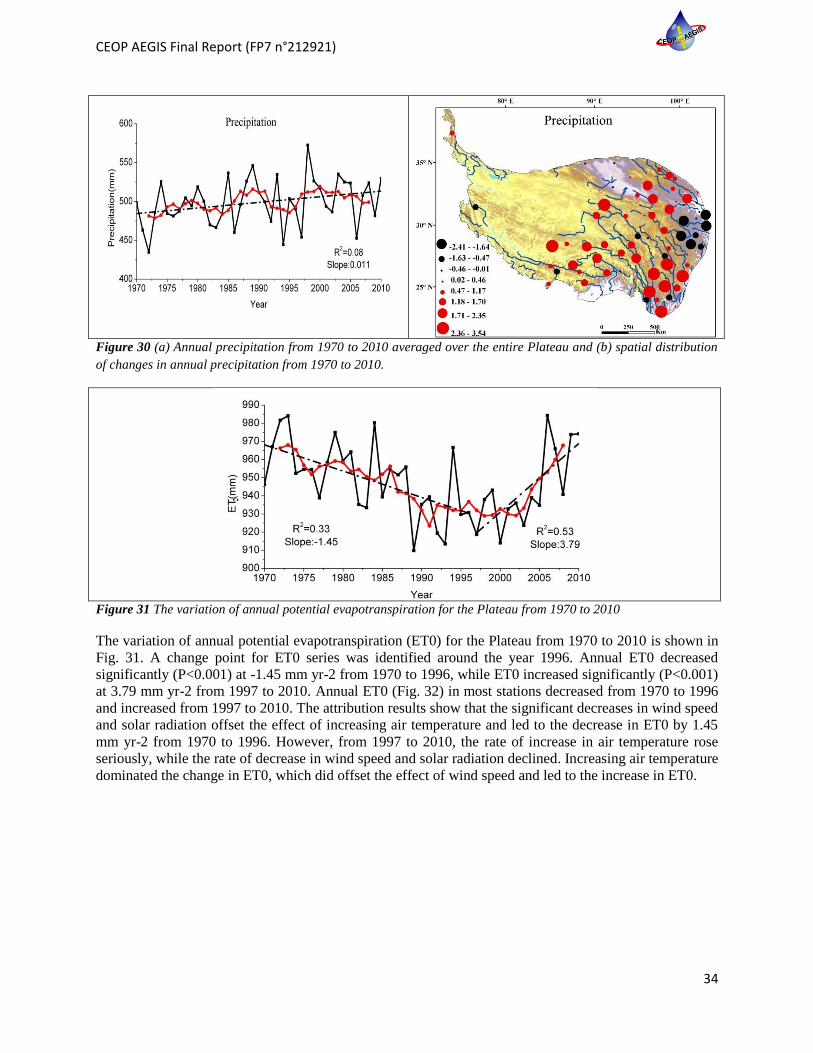
Figure 31 The variation of annual potential evapotranspiration for the Plateau from 1970 to 2010
The variation of annual potential evapotranspiration (ET0) for the Plateau from 1970 to 2010 is shown in
Fig. 31. A change point for ET0 series was identified around the year 1996. Annual ET0 decreased
significantly (P<0.001) at -1.45 mm yr-2 from 1970 to 1996, while ET0 increased significantly (P<0.001)
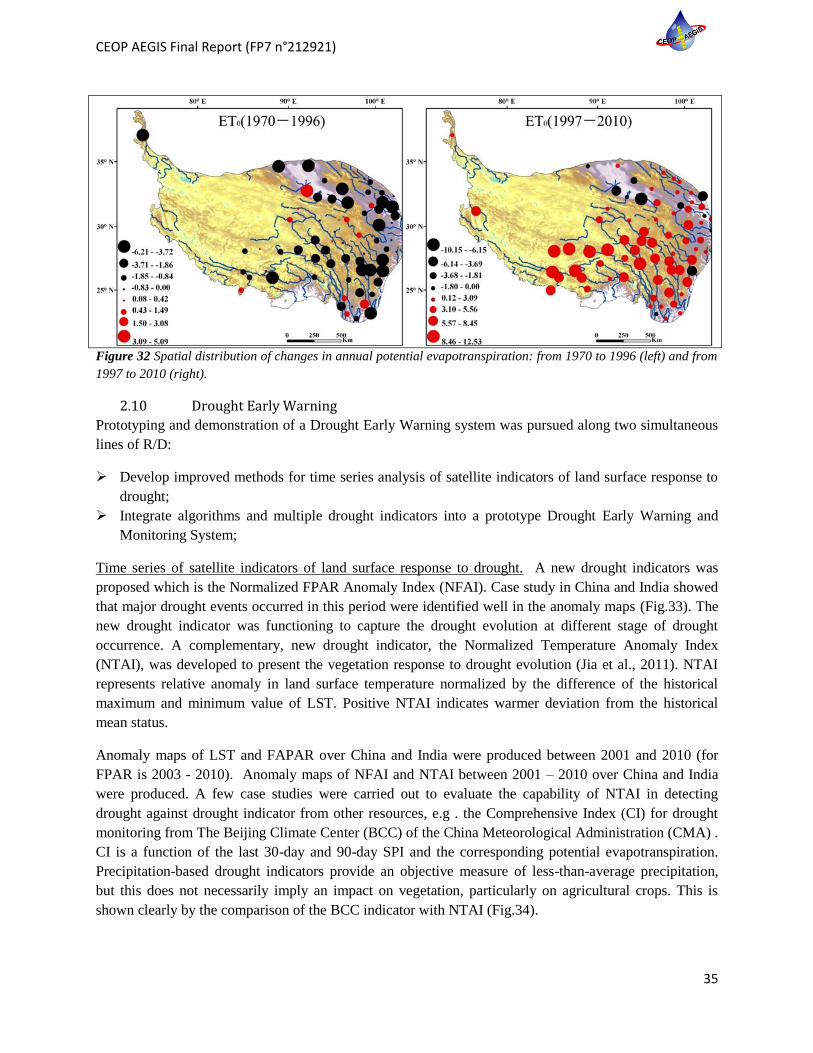
at 3.79 mm yr-2 from 1997 to 2010. Annual ET0 (Fig. 32) in most stations decreased from 1970 to 1996
and increased from 1997 to 2010. The attribution results show that the significant decreases in wind speed
and solar radiation offset the effect of increasing air temperature and led to the decrease in ET0 by 1.45
mm yr-2 from 1970 to 1996. However, from 1997 to 2010, the rate of increase in air temperature rose
seriously, while the rate of decrease in wind speed and solar radiation declined. Increasing air temperature
dominated the change in ET0, which did offset the effect of wind speed and led to the increase in ET0.
CEOP AEGIS Final Report (FP7 n°212921)
35
Figure 32 Spatial distribution of changes in annual potential evapotranspiration: from 1970 to 1996 (left) and from
1997 to 2010 (right).
2.10 Drought Early Warning
Prototyping and demonstration of a Drought Early Warning system was pursued along two simultaneous
lines of R/D:
Develop improved methods for time series analysis of satellite indicators of land surface response to
drought;
Integrate algorithms and multiple drought indicators into a prototype Drought Early Warning and
Monitoring System;
Time series of satellite indicators of land surface response to drought. A new drought indicators was
proposed which is the Normalized FPAR Anomaly Index (NFAI). Case study in China and India showed
that major drought events occurred in this period were identified well in the anomaly maps (Fig.33). The
new drought indicator was functioning to capture the drought evolution at different stage of drought
occurrence. A complementary, new drought indicator, the Normalized Temperature Anomaly Index
(NTAI), was developed to present the vegetation response to drought evolution (Jia et al., 2011). NTAI
represents relative anomaly in land surface temperature normalized by the difference of the historical
maximum and minimum value of LST. Positive NTAI indicates warmer deviation from the historical
mean status.
Anomaly maps of LST and FAPAR over China and India were produced between 2001 and 2010 (for
FPAR is 2003 - 2010). Anomaly maps of NFAI and NTAI between 2001 – 2010 over China and India
were produced. A few case studies were carried out to evaluate the capability of NTAI in detecting
drought against drought indicator from other resources, e.g . the Comprehensive Index (CI) for drought
monitoring from The Beijing Climate Center (BCC) of the China Meteorological Administration (CMA) .
CI is a function of the last 30-day and 90-day SPI and the corresponding potential evapotranspiration.
Precipitation-based drought indicators provide an objective measure of less-than-average precipitation,
but this does not necessarily imply an impact on vegetation, particularly on agricultural crops. This is
shown clearly by the comparison of the BCC indicator with NTAI (Fig.34).

CEOP AEGIS Final Report (FP7 n°212921)
36
2009145
2009153
2009161
2009169
2009177
2009185
2009193
2009201
2009209
Figure 33 Maps of NFAI covering western China and northern India between DOY145 – DOY209 in 2009
(a) NTAI, 2006201
(b) NTAI, 2006217
(c) NTAI, 2006233
(d) BCC-CI 2006.07.21
(e) BCC-CI 2006.08.05
(f) BCC-CI 2006.08.31
Figure 34 Spatial distribution of NTAI (a, b, c) and BCC drought index (CI) (d, e, f) on the three periods
corresponding to China Sichuan-Chongqing 2006 summer drought.
The severe to extreme anomaly assessed with the BCC indicator does not appear in the NTAI maps,
which indicate a more limited and localized drought event. Moreover both NTAI indicate more extensive

CEOP AEGIS Final Report (FP7 n°212921)
37
anomalies, particularly in the North – East of India along the southern side of the Himalayas, where the
BCC does not indicate any anomaly.
The difference is not inherent to the indicators, but related to how the processes linking precipitation, land
surface energy balance and vegetation growth interact in a specific region and during each event. This is
shown clearly by the results in Fig.34. Spatial patterns of NVAI (not shown here) and NTAI in the three
periods of China Sichuan-Chongqing drought in 2006 were very consistent to the BCC drought index
(Fig. 34).
Figure 35 Workflow of the East-South Asia Drought Monitor (ESADroM)
Drought early warning and monitoring system integration. A drought early warning and monitoring
system was developed (Fig.35; Jia et al., 2013) by integrating the tools for precipitation, land surface
temperature and vegetation response to drought. What the system deals with is the agricultural drought,
say starting from the precipitation deficit to the impact on the agricultural and nature ecosystem. The lake
levels and river streams, that are associated to hydrological drought, are not concerned. Since all the
droughts are resulted by lacking of precipitation for a certain time, the anomaly in precipitation is taken as
the first alerting indicator. Lacking of precipitation does not necessarily lead to agricultural drought due to
many other factor such as irrigation and plant extraction of shallow ground water. Vegetation will respond
to drought by increasing foliage temperature and thermal emission and by changing spectral properties

CEOP AEGIS Final Report (FP7 n°212921)
38
since the photosynthesis and transpiration are reduced by insufficient water supply. Land surface
temperature is an indicator with fast response to water deficit, higher canopy and soil temperature occur
during drought. Therefore LST is the second indicator to be monitored. If water deficit continues and lasts
for a longer period, vegetation may becoming wilting and decreased vegetation index than normal
conditions is observed. Indicators based on vegetation index or fPAR is therefore depicting the
consequence of meteorological drought (i.e. lack of precipitation) and can be used to assess the ultimate
impact or damage of drought on ecosystems (agriculture, prairie, and forest). According to the logic
mentioned above, a drought early warning and monitoring system for the East and South Asia region,
ESADroM - East-South Asia Drought Monitor, was developed by implementing (Fig.35) two sub-
systems for drought indicator analysis: system for rainfall deficit index (RainMonitor), system for time
series of land surface temperature anomaly analysis (i.e. the Normalized Temperature Anomaly Index -
NTAI) and for vegetation response analysis (i.e. the Normalized Vegetation Anomaly Index - NVAI) .
The two indices, NTAI and NVAI, together with the combined index Normalized Drought Anomaly
Index (NDAI) (Jia et al., 2012) are used to identify the drought evolution and impact.
2.11 Flood Early Warning
Four main objectives were pursued: (a) Early flood warning using surface wetness indicator derived from
satellite data; (b) Real time flood forecasting using data from the atmospheric-hydrologic network; (c)
Mapping and visualizing flood inundation, flood risk using combined satellite data and hydraulic models,
and (d) real time forecasting flood inundation, depth, areal extent and return period of flooding.
Figure 36 Fractional area of water saturated soil at a reference pixel and the river stage at Xiangjiang
hydrological station from 2000 to 2001.
Hydrological model and microwave measurements for flood early warning. For flood early warning, the
estimation of the soil water storage capacity and the prediction of the precipitation are the major two
problems. In a river basin with the evident rainy season, such as the Xiangjiang river basin, the soil water
30
32
34
36
38
40
42
44
46
48
50
0
100
200
300
400
500
600
Frac
tio
nal
are
a o
f w
ate
r sa
tura
ted
so
il (k
m2 )
DOY
fractional area of water saturated soil
river stage

CEOP AEGIS Final Report (FP7 n°212921)
39
storage capacity plays the most important role in the flood early warning system. The Polarization
Difference Brightness Temperature (PDBT) of 37GHz has been proved to be very sensitive to the soil
water saturation of top soil. At regional scale, we defined the fractional area of water-saturated soil as the
degree of soil water saturation at top soil. Due to the shallow detected depth, this is a good indication of
the full soil water retention, because when the top soil is saturated, the additional precipitation will
become surface runoff. Thus we used the PDBT value of 37GHz to retrieve (Shang et al., 2009) the
fractional area of water-saturated soil to indicate the residual water retention capacity of a certain area.
This work by combining the satellite observations and the hydrological model identifies critical areas,
whose soil water storage capacity has a close relationship with the river stage at XiangJiang hydrological
station (Fig.36).
Real Time Flood Forecasting Using Data from Atmospheric Hydrologic Network. Stochastic time series
model (ARIMA), SCS-Curve Number, HEC-GeoHMS model, Probability Distributed Model (PDM) and
ANN models were applied for (a) Kosi River System, which is an important sub-basin of Ganga river
system, India, and (b) Heihe upstream river basin and Xiangjiang basin, China. All the models were
applied to estimate the runoff at different locations.
Figure 37 Observed and computed runoff using different methods: Runoff from sub-basins- SCS Unit Hydrograph
(left) and Base flow separation - Constant mean monthly values (right)
A comparison (Fig.37) is carried out once the model calibration and testing is done. In the model various
important parameter were computed using the following equations methods: (a) Runoff from sub-basins-
SCS Unit Hydrograph; (b) Base flow separation - Constant mean monthly values; (c) Flood Routing -
Muskingum-Cunge method; (d) Soil Moisture Accounting- Initial Loss Method.
Mapping and Visualizing Flood Inundation, Flood Risk using combined Satellite Data and Hydraulic
Models. The Chang Sha channel segment of Xiang Jiang River, China and Kosi river, India were selected
as study areas. Water level data of each day were collected for the analysis. Socio-economic data of each
district were collected from 1998 to 2004. The digital 2.5-meter intervals contours and 0.1-meter intervals
spot heights were used to generate the DEM with 5-meter grid size. The final DEM of study area is
generated using ArcView and ArcGIS software. Flood frequency of every pixel is calculated by
overlaying flood area of eight years. A hierarchical classification system of 18 land-use classes was
applied to the Landsat ETM data. The flood risk assessment model (FRAM) was developed using Model
Builder of the ArcGIS 9.x. The model is used to produce vulnerability class map, hazard class map and
flood risk class map. After running the flood risk assessment model and inputting all need data, the flood
risk map is produced by combining all the hazard map and vulnerability map where the pixel by pixel
sum of each map.
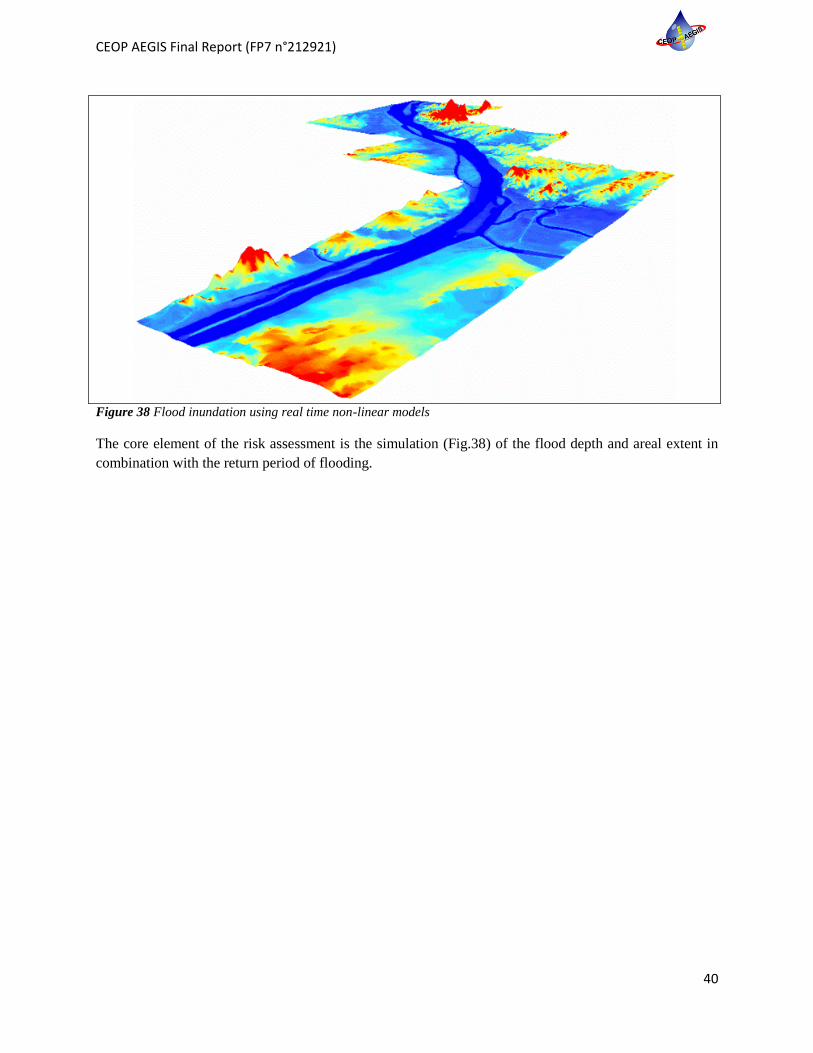
CEOP AEGIS Final Report (FP7 n°212921)
40
Figure 38 Flood inundation using real time non-linear models
The core element of the risk assessment is the simulation (Fig.38) of the flood depth and areal extent in
combination with the return period of flooding.

CEOP AEGIS Final Report (FP7 n°212921)
41
3. Impact, Dissemination and Exploitation of Results
3.1 Dissemination activities
The interface of the CEOP-AEGIS project with its stake-holders was a combination of dissemination
activities. We aimed at disseminating the information about the project and the results generated within
each element of the project. Three main instruments were used: 1) training sessions and workshops, 2)
tailored capacity building and 3) a website. Furthermore, several other means were utilized, among others,
scientific publications, presentations, videos, posters, etc.
3.1.1 Training sessions
Three training sessions were held during the project lifetime, as it is described in Table 3. A total of 106
participants completed the courses, representing 49 institutions from China, India, Nepal and Pakistan.
The lecturers were the PI‘s and selected researchers of the project Team.
Table 3 Schedule of training sessions
Event Date Location Status
1st Training 17-19 May 2011 Beijing, China Completed
2nd
Training 16-20 April 2012 Rourkela, India Completed
3rd
Training April 26-May 3, 2013 Beijing, China Completed
Final Workshop April 26-30, 2013 Beijing, China Completed
Two partially overlapping groups of the stakeholders panel were targeted by the training sessions and the
capacity building plans: the water management related institutions (including meteorological
organizations) sent middle level practitioners for the trainings, and the young researchers of the
universities and research organizations participated in the MSc and PhD research. Some members of this
latter group joined the courses as well. Interactive stakeholders panel meetings were held during the
training courses, as forums for exchanging ideas and getting feedbacks from the participants. More than
250 representatives of stakeholders participated on these events.
First training session of the Stakeholders Panel. The first training session took place at the HeadQuarters
of the China Meteorological Authority in Beijing, on 17-19 May, 2011 and was attended by 39
participants from the stakeholder institutions (Fig.39). The objective of the advanced training course was
to introduce the stakeholders/participants from China and Asian countries to the CEOP-AEGIS project
results related to in-situ and earth observation, retrievals and modeling of land surface processes and land-
atmosphere interactions with emphasis on the Tibetan Plateau. The course included explanations about
theory, instruments, validation, retrievals and modeling as well as applications. Practical sessions were
organized with hands-on exercises with data collected in different work packages. The lecturers were
experts responsible for the relevant project tasks. Furthermore, this occasion provided a feedback to the
CEOP-AEGIS consortium from the stakeholders of the project.

CEOP AEGIS Final Report (FP7 n°212921)
42
Figure 39 CEOP – AEGIS Advanced Training Sessions: Beijing (China) May 17 – 19 2011
The program was designed to cover the available products of the CEOP-AEGIS project according to their
relevance for the stakeholders. The course consisted of lectures, demonstrations and exercises in 3 days.
The target group is the senior technical staff of the stakeholder institutions, like meteorological and water
agencies of China and other Asia countries. Furthermore, PhD students, MSc students, and post-docs
were admitted to the available places.
The three-day program was as follows:
Day 1 –measurement and observation techniques, and the analysis of the measured data, as well as
dissemination of results via the Data Portal.
Day 2 –evapotranspiration (based on surface energy balance) and soil moisture.
Day 3 –In the morning: snow observations and drought monitoring; in the afternoon: interactive
session of the Stakeholders Panel for the evaluation of the project data and products, analysis of gaps
and suggestions how to close the gaps.
The interactive session showed that the stakeholders are very much interested in getting the results, and
they see still gaps between their daily work and the applicability of the project outputs. They had clear
suggestions about how these gaps can be closed, e.g., with validation of the results. They showed that the
easy access to the data and results is essential for operationalization.
Second training session of the Stakeholders Panel. The 2nd
Training Session and Stakeholders Panel
meeting in Rourkela, India, 16-20 April 2012. More than 90 participants followed the lectures and took
part in the interactive sessions of the Stakeholders Panel meeting. The one-day program focused on
informing the partners about the results of CEOP-AEGIS and discussing how the results can be used in

CEOP AEGIS Final Report (FP7 n°212921)
43
water management in South-East Asia. The Stakeholders phrased their expectations and comments about
the EO-based water management data, tools and products of the project.
A five-day training session followed the Stakeholders Panel meeting, where 53 participants from India
and the surrounding countries (Fig.40) learnt about the details of the project results. Besides the lectures,
most of the time was spent on hands-on training with exercises. The feedback session consisted of two
parts: i.) an evaluation part, where the course participants shared their opinion about the course and the
learnt topics with us, and ii.) an interactive feedback part, where in a forum-like setup, the course
participants shared their ideas about how EO and the project results could be the best integrated in to their
daily work.
Figure 40 CEOP – AEGIS Advanced Training Sessions: Rourkela (India) April 16 – 20 2012
The program started with and attractive opening ceremony, with the participation of state governmental
representatives and the dignitaries of NIT. A keynote lecture was delivered by Professor Dr. Massimo
Menenti and a demonstration of the CEOP-AEGIS data portal. Active involvement of the stakeholders in
the project is a basic principle of CEOP-AEGIS, thus in the afternoon, the participants introduced their
activity and their institutions in an interactive session, which focused on the recent water management
practices in the region and the expectations of the stakeholders from EO technology. Besides the scientific
insight into the role of the Tibetan Plateau related to the hydrological systems of the region, data
availability and access to analysis results were mentioned as the key expectations.
Lectures explained the theoretical background and practical exercises made the participants familiar with
the data and the processing tools. The topics covered were:
Ground-based observations: measured parameters, sites setup and data base
Satellite observations: land surface temperature and vegetation properties

CEOP AEGIS Final Report (FP7 n°212921)
44
Monitoring of surface fluxes with satellite observations
Satellite observations: rainfall
Snow cover and water equivalent
Soil moisture retrieval and time series
Water balance and water yield of the Tibetan Plateau
Drought monitoring and early warning system
Satellite based flood monitoring of pilot areas
The training part was closed by an interactive session to learn about and discuss the suggestions of the
participants in relation to the project activities and results. First, they filled up a questionnaire then Prof.
Menenti convened the discussion about the topics of the training course with the following concluding
remarks:
The course was an eye-opener in understanding how EO can contribute to water management.
Processes on the Tibetan Plateau are of extreme importance for the countries downstream of the big
rivers.
Data for flow estimates (floods) are expected from CEOP-AEGIS.
Precise snow information is needed for water resources estimates.
An evaluation form was filled up after the course by the participants anonymously, using the Internet-
based service "Survey Monkey". The results show a general satisfaction of the course participants. The
2nd
Stakeholders Meeting and Training Course in Rourkela reached out to more stakeholders than the first
one, there were more than 90 participants on the first day and 53 experts completed the course in India.
Since one busy working year has been elapsed from the first event, more research findings
(results/products) have been shown and distributed to the trainees, and the dialogue with the stakeholders
and the decision makers provided more focused suggestions and ideas.
Third training session of the Stakeholders Panel. The course was originally designed to be hosted by
International Centre for Integrated Mountain Development (ICIMOD) in Kathmandu, Nepal.
Unfortunately, the overloaded schedule of the institute finally did not allow fulfilling this plan, and the
course was organized as a joint event of the Final Workshop (WATGLOBS), hosted by the Institute for
Remote Sensing and Digital Earth (RADI) in Beijing, China. ITC was responsible for the content and
CMA was organizing the logistics, whilst selecting and inviting the participants was a joint effort of these
institutions.
Six international participants from South and East Asian countries and eight Chinese participants attended
the practical exercise part of the training session. They were water management practitioners representing
different institutions as well as some MSc and PhD students.
The course consisted of two parts: 1.) the WATGLOBS workshop (see 3.1.2), where a part of the
presentations covered the available products of the CEOP-AEGIS project and the current satellite data
products on the terrestrial water cycle. 2.) Demonstrations and exercises, the hands-on part of the course,
with examples developed by the work packages of CEOP-AEGIS.
An evaluation form was filled up after the course by the participants anonymously, using the Internet-
based service "Survey Monkey". The answers showed an overall satisfaction. Maybe the most important
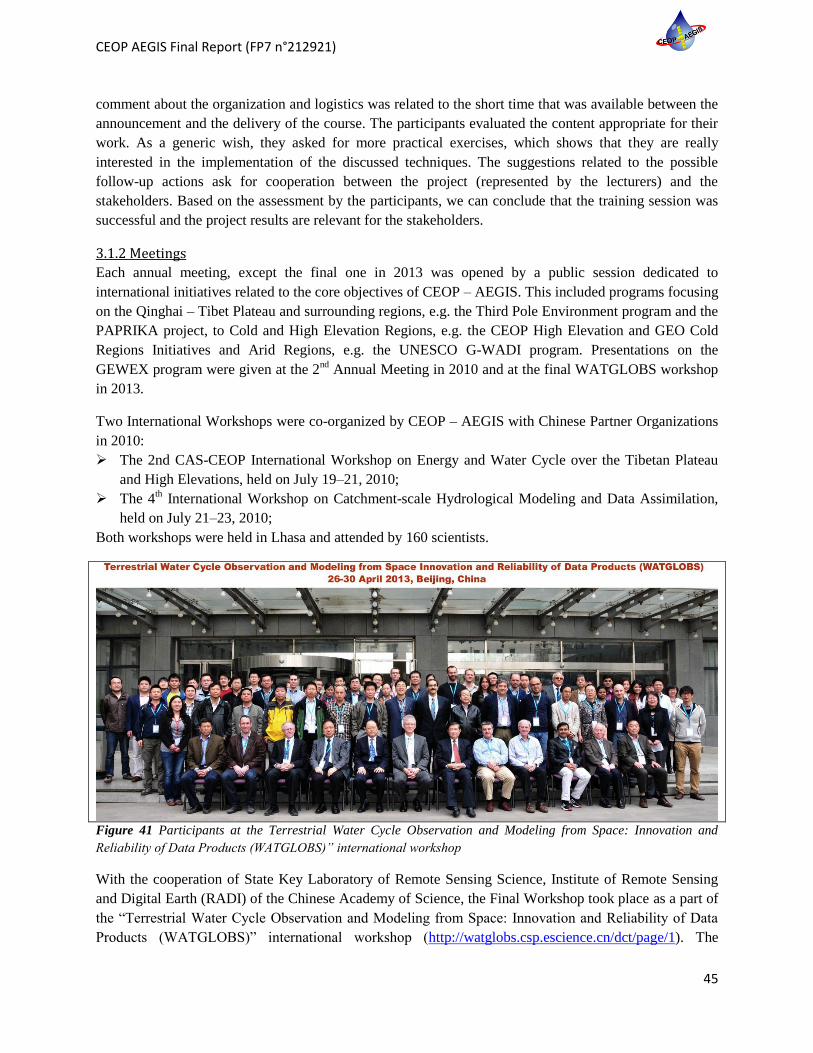
CEOP AEGIS Final Report (FP7 n°212921)
45
comment about the organization and logistics was related to the short time that was available between the
announcement and the delivery of the course. The participants evaluated the content appropriate for their
work. As a generic wish, they asked for more practical exercises, which shows that they are really
interested in the implementation of the discussed techniques. The suggestions related to the possible
follow-up actions ask for cooperation between the project (represented by the lecturers) and the
stakeholders. Based on the assessment by the participants, we can conclude that the training session was
successful and the project results are relevant for the stakeholders.
3.1.2 Meetings
Each annual meeting, except the final one in 2013 was opened by a public session dedicated to
international initiatives related to the core objectives of CEOP – AEGIS. This included programs focusing
on the Qinghai – Tibet Plateau and surrounding regions, e.g. the Third Pole Environment program and the
PAPRIKA project, to Cold and High Elevation Regions, e.g. the CEOP High Elevation and GEO Cold
Regions Initiatives and Arid Regions, e.g. the UNESCO G-WADI program. Presentations on the
GEWEX program were given at the 2nd
Annual Meeting in 2010 and at the final WATGLOBS workshop
in 2013.
Two International Workshops were co-organized by CEOP – AEGIS with Chinese Partner Organizations
in 2010:
The 2nd CAS-CEOP International Workshop on Energy and Water Cycle over the Tibetan Plateau
and High Elevations, held on July 19–21, 2010;
The 4th International Workshop on Catchment-scale Hydrological Modeling and Data Assimilation,
held on July 21–23, 2010;
Both workshops were held in Lhasa and attended by 160 scientists.
Figure 41 Participants at the Terrestrial Water Cycle Observation and Modeling from Space: Innovation and
Reliability of Data Products (WATGLOBS)” international workshop
With the cooperation of State Key Laboratory of Remote Sensing Science, Institute of Remote Sensing
and Digital Earth (RADI) of the Chinese Academy of Science, the Final Workshop took place as a part of
the ―Terrestrial Water Cycle Observation and Modeling from Space: Innovation and Reliability of Data
Products (WATGLOBS)‖ international workshop (http://watglobs.csp.escience.cn/dct/page/1). The

CEOP AEGIS Final Report (FP7 n°212921)
46
workshop, among others, addressed the CEOP-AEGIS objectives and topics in a much broader context,
involving outstanding scientists worldwide. Stakeholder organizations formed the audience.
The last ten years of Earth Observation have witnessed two simultaneous major developments: an
increasing diversity of primary measurements and a concerted effort of the Earth Observation community
to develop and use higher level data products. This has been particularly true for observations to capture
the complexity of the terrestrial water cycle. Two fundamentally different but complementary groups of
state variables need to be captured: the amount of water in the Earth System and the response of the land
surface to water availability.
The workshop kept 140 young and not so young scientists (Fig.41) glued on their chairs over four and
half days through a double week-end: after a western Saturday – Sunday full work days followed a
Chinese – style three days holidays on the occasion of Labour Day 2013. The 48 posters, 40 contributed
and 21 invited presentations provided a state-of-the-art yet realistic overview of achievements and
challenges along the trail from observations to a better grip on the global terrestrial water cycle and water
resources. The Workshop covered the following topics: 1) Terrestrial water cycle – programs ; 2)
Observing the terrestrial water cycle from space: Soil moisture, Precipitation, Evapotranspiration, Snow,
Glaciers, Lakes, Groundwater; 3) Cryosphere processes and land surface hydrology; 4) Land surface state
and atmospheric convection; 5) Assimilation of terrestrial water cycle observations; 6) Global and
regional hydrological modeling; 7) Terrestrial Water Cycle Integration.
The Workshop was opened by Academician Guanhua Xu former Minister of MOST; Dr. Xiaohan Liao,
the China GEO Principal and the director of NRSCC-MOST; Prof. Huadong Guo, the director of the host
institute RADI; Mr. Guocheng Zhang, former director of NRSCC-MOST; Prof. Xiaowen Li,
Academician in Remote Sensing and Jessica Mitchell from European Commission, China Delegation;
Douglas Cripes and Richard Lawford from GEO; and Peter van Oevelen, the director of the International
GEWEX office.
The science priorities emerging from the Workshop were summarized with five questions:
Multiple data products for each variable: does it help?
Way forward: single universal algorithms or local adaptation of multiple algorithms?
Evaluation of data products: does a reference exist or should we stay with deviations from averages?
Would better modeling of measurements improve consistency with model variables?
Use of current data products for model forcing and evaluation: should we wait for better data?
3.1.3 Website
The website of CEOP-AEGIS (www.ceop-aegis.org ) provides the broadest access to the project results
and all information related to the activities. The data and tools generated by the project were first
available only for the project personnel, but by the end of the project, according to the original contract, it
was released to the public domain. The first version of the website was developed in the first phase of the
project with two access areas: 1.) the front page provided generic information for the public with several
links to relevant material; 2.) a password-protected area, accessible to the project personnel contained the
complete project documentation as well as the prototype data engine. During the last year of the project, a
lot of work was carried out to ease access to project foreground and increase the visibility of the data and
the publications of the project. Following recommendations from the stakeholders community, the home
page was redesigned to include a new ―data‖ button in the menu bar, and an ―access data portal‖ button in

CEOP AEGIS Final Report (FP7 n°212921)
47
the side panel. This latter leads to three publicly available functions: 1.) The CEOP-AEGIS Open Library,
containing the links to project documents and their proper citations; 2) The CEOP-AEGIS Data Portal,
presents the key products in a user-friendly environment; and 3) The CEOP-AEGIS OpenDAP Server,
that is dedicated to advanced users familiar with the open data transfer protocol ―OpenDAP‖. This way
CEOP-AEGIS complies with the GEOSS requirements.
The visits to the website increased in the last year considerably (Table 4). The University of Strasbourg
owns the ceop-aegis.org domain name for the coming years to ensure a continuity of service beyond the
lifetime of the project. The IT service of the ICube Lab of the University of Strasbourg is hosting the
services and maintains the portal and servers free of charge.
Table 4 CEOP-AEGIS website visit statistics
Year Single visitors Visits Pages viewed Hits Bandwidth
2011 <=3205 5147 19981 46962 33.70 Go
2012 3622 5681 16300 33786 5.35 Go
2013 5719 12606 99148 120826 6.57 Go
3.2 Exploitation of Results
We have pursued the exploitation of project results in three different ways:
Making available all the ground and satellite data generated by the project through the CEOP-AEGIS
Data Portal;
Promoting the research and outcome of CEOP – AEGIS at GEO events
Publications on diverse online and hard-copy media
3.2.1 Data portal
It is crucial for the scientific community of the CEOP-AEGIS consortium that all the final products and
documents are properly cited in future scientific work. Therefore, it was agreed in the closing project
plenary session that the CEOP-AEGIS Data Section would not require a complex registration process, nor
special permission or password, but users accessing this section should first agree with a license for use of
the products. This license was developed and attached to the website.
The list of available data sets is given in Table 5. The data portal is visible and accessible through the
project web-site and it is resident at the Institute for Tibetan Plateau (ITP) research, Chinese Academy of
Sciences. ITP is the leading organizations of the Third Pole Environment program.
3.2.2 Transnational water resources
The project has generated two data sets of direct relevance to improve freely available information on
shared trans-national water resources:
Daily glacier melt, snow melt, rainfall-runoff, base flow and stream-flow for all channel sections
within each 5 km x 5 km grid over the Qinghai – Tibet Plateau and headwaters of the rivers fed by
Plateau water (see Fig. 29) for the period 2008 – 2010;
Gridded climate and hydrologic variables over the same 5 km x 5 km grid but derived from
observations at 89 stations over the Qinghai – Tibet Plateau and the period 1970 – 2010: mean daily

CEOP AEGIS Final Report (FP7 n°212921)
48
temperature, maximum daily temperature, minimum daily temperature, vapor pressure, wind speed
and sunshine duration.
These data sets are unique and have already provided a first assessment of on the dependence of water
resources in the Countries of South and East Asia on Plateau waters.
Table 5 Overview of main data sets available through the project Data Portal
Variable Spatial Coverage Temporal coverage Spatial and temporal resolution
Surface albedo 29 N – 41 N
70 E – 110 E
2008 - 2010 1 km x 1 km; weekly
Surface temperature 29 N – 41 N
70 E – 110 E
2008 - 2010 5 km x 5 km; hourly
Vegetation fractional cover 29 N – 41 N
70 E – 110 E
2008 - 2010 1 km x 1 km; weekly
Leaf Area Index 29 N – 41 N
70 E – 110 E
2008 - 2010 1 km x 1 km; weekly
Evaporation 29 N – 41 N
70 E – 110 E
2008 - 2010 5 km x 5 km; daily
Soil water content 29 N – 41 N
70 E – 110 E
2008 - 2010 25 km x 25 km; daily
Precipitation 29 N – 41 N
70 E – 110 E
2008 - 2010 5 km x 5 km; daily
Snow cover 29 N – 41 N
70 E – 110 E
2008 - 2010 500 m x 500 m; daily
Snow water equivalent 29 N – 41 N
70 E – 110 E
2008 - 2010 10 km x 10 km; daily
Stream flow 29 N – 41 N
70 E – 110 E
2008 - 2010 5 km x 5 km; daily
Turbulent fluxes 4 stations 2008 - 2010 Stations; 30 min
3.3 Impact
The impact of the project is documented by the large number of completed and on-going MSc and PhD
projects at Partner Organizations, where CEOP AEGIS provided a common framework, ideas for research
and data. A second indicator of impact is the visibility at GEO events since 2009, the specific contribution
of the project to new GEO Water Strategy and the new GEO initiative on Cold Regions. A third indicator
is the large number of publications during the period 2008 – 2013.
3.3.1 MSc and PhD students
Besides the training courses, MSc and PhD research projects were included in the tailored capacity
building plan. At the end of the project, 110 MSc and 122 PhD researches were completed or in progress
(Table 6). These projects were only partly funded by CEOP AEGIS, but do show that the project provided
a natural focus for the research of partner organizations and will lead to a long-lasting impact of CEOP
AEGIS.
3.3.2 Contribution to GEO Activities
The contribution of CEOP AEGIS to the GEO Tasks was defined in some detail in the initial phase of the
project with reference to the GEO Work Plan 2009 – 2011 (Fig. 35).
CEOP – AEGIS Delegates have been attending the following GEO meetings in the reporting period:
6th Meeting of the GEO Science and Technology Committee. 11 – 12 February 2008 Hannover,
Germany.

CEOP AEGIS Final Report (FP7 n°212921)
49
6th Meeting of the GEO Capacity Building Committee. 13 – 14 February 2008, Hannover, Germany.
GEO European Projects 2nd
Workshop. 3 – 4 September 2008. Brussels, Belgium.
GEO European Projects 3rd
Workshop. 8 – 9 October 2009. Istanbul, Turkey.
GEO European Projects 4th Workshop. 29 – 30 April 2010. Athens, Greece
7th Plenary Session and Ministerial Summit of GEO on 2 – 5 November, 2010, in Beijing, China.
Table 6 Summary of MSc and PhD students active in the framework of CEOP – AEGIS
MSc completion PhD completion
Host institution 2009-
2011
2012-
2014
2009-
2011
2012-
2015
Major topics
1 BNU 13 16 6 10 ET, LST, fractional vegetation and snow,
albedo, validation of EO products, SM, radiative
fluxes
2 CAMS 6 8 1 9 Rain radar and convective activities, land
surface models
3 CAREERI 3 8 10 15 Land surface parameters, SM, LST, snow
hydrology, glaciers, ET
4 CAREERI/Duke 0 0 0 1 SAR
5 CAU 7 5 5 1 Vegetation, SM, drought, data integration
6 IGSNRR 0 2 0 6 Vegetation, climate, LST, SM
7 IRSA-CAS 0 3 1 12 Scaling effect, surface fluxes, land surface
parameters
8 ITC (UT) 3 2 2 11 Snow, SM, water level fluctuations in lakes
9 ITP 8 12 5 7 Radiation and heat flux, SM, aerosol, land
surface models, glacier mass balance
10 UDS - TRIO 0 0 0 2 Land surface emissivity, surface fluxes
11 UDS – TUD –
Alterra
0 0 0 1 Land surface albedo in rugged terrain; at surface
radiation balance
11 NIT 0 2 0 1 Flood, water pollution, rainfall runoff modelling
12 TU Delft 2 3 1 3 Glaciers, laser altimetry, river levels, energy
balance
13 TU Delft/Alterra 0 0 0 2 Time series of ET
14 TU Delft/IRSA 0 0 0 1 SAR for flood
15 TU Delft/UBT 0 1 0 0 River level
16 UBT 4 4 0 2 Carbon dioxite and energy fluxes
17 UBT/Cambridge 0 0 0 1 Convective processes
18 UCG/UVEG 0 0 1 3 ET
19 U Tsukuba 0 0 0 1 Convective clouds
20 UNIFE 0 0 0 2 Precipitation
Total 46 64 32 90
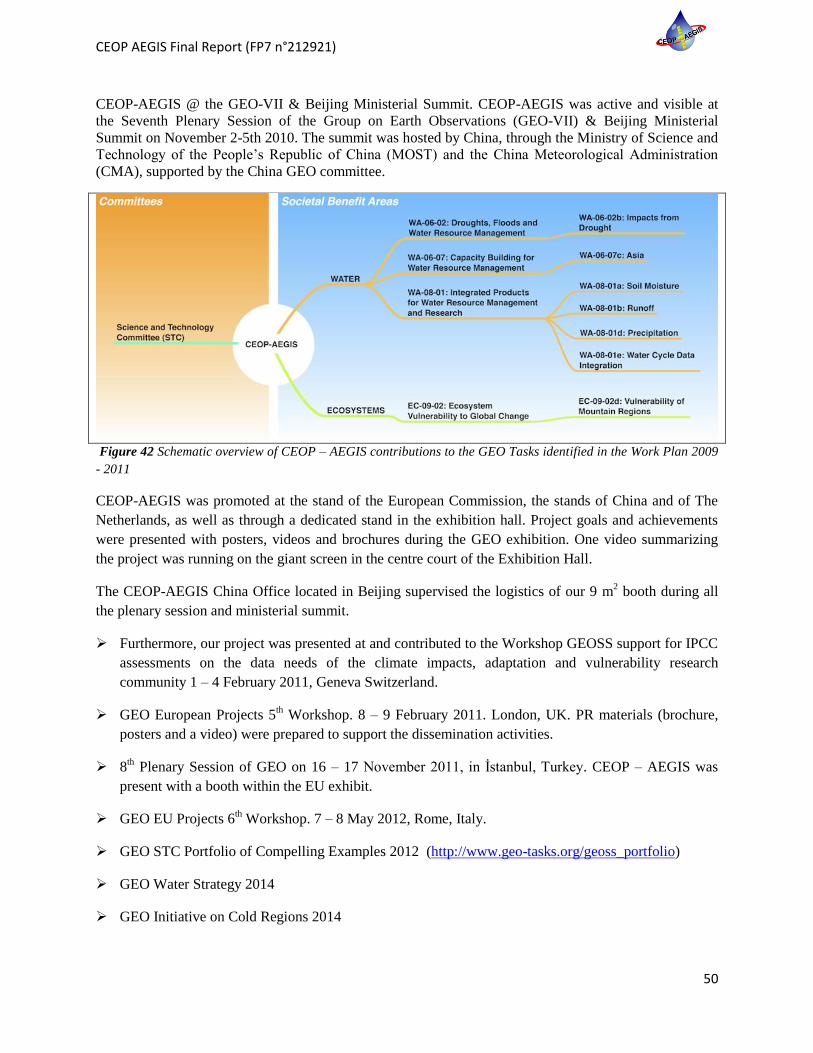
CEOP AEGIS Final Report (FP7 n°212921)
50
CEOP-AEGIS @ the GEO-VII & Beijing Ministerial Summit. CEOP-AEGIS was active and visible at
the Seventh Plenary Session of the Group on Earth Observations (GEO-VII) & Beijing Ministerial
Summit on November 2-5th 2010. The summit was hosted by China, through the Ministry of Science and
Technology of the People‘s Republic of China (MOST) and the China Meteorological Administration
(CMA), supported by the China GEO committee.
Figure 42 Schematic overview of CEOP – AEGIS contributions to the GEO Tasks identified in the Work Plan 2009
- 2011
CEOP-AEGIS was promoted at the stand of the European Commission, the stands of China and of The
Netherlands, as well as through a dedicated stand in the exhibition hall. Project goals and achievements
were presented with posters, videos and brochures during the GEO exhibition. One video summarizing
the project was running on the giant screen in the centre court of the Exhibition Hall.
The CEOP-AEGIS China Office located in Beijing supervised the logistics of our 9 m2 booth during all
the plenary session and ministerial summit.
Furthermore, our project was presented at and contributed to the Workshop GEOSS support for IPCC
assessments on the data needs of the climate impacts, adaptation and vulnerability research
community 1 – 4 February 2011, Geneva Switzerland.
GEO European Projects 5th Workshop. 8 – 9 February 2011. London, UK. PR materials (brochure,
posters and a video) were prepared to support the dissemination activities.
8th Plenary Session of GEO on 16 – 17 November 2011, in İstanbul, Turkey. CEOP – AEGIS was
present with a booth within the EU exhibit.
GEO EU Projects 6th Workshop. 7 – 8 May 2012, Rome, Italy.
GEO STC Portfolio of Compelling Examples 2012 (http://www.geo-tasks.org/geoss_portfolio)
GEO Water Strategy 2014
GEO Initiative on Cold Regions 2014
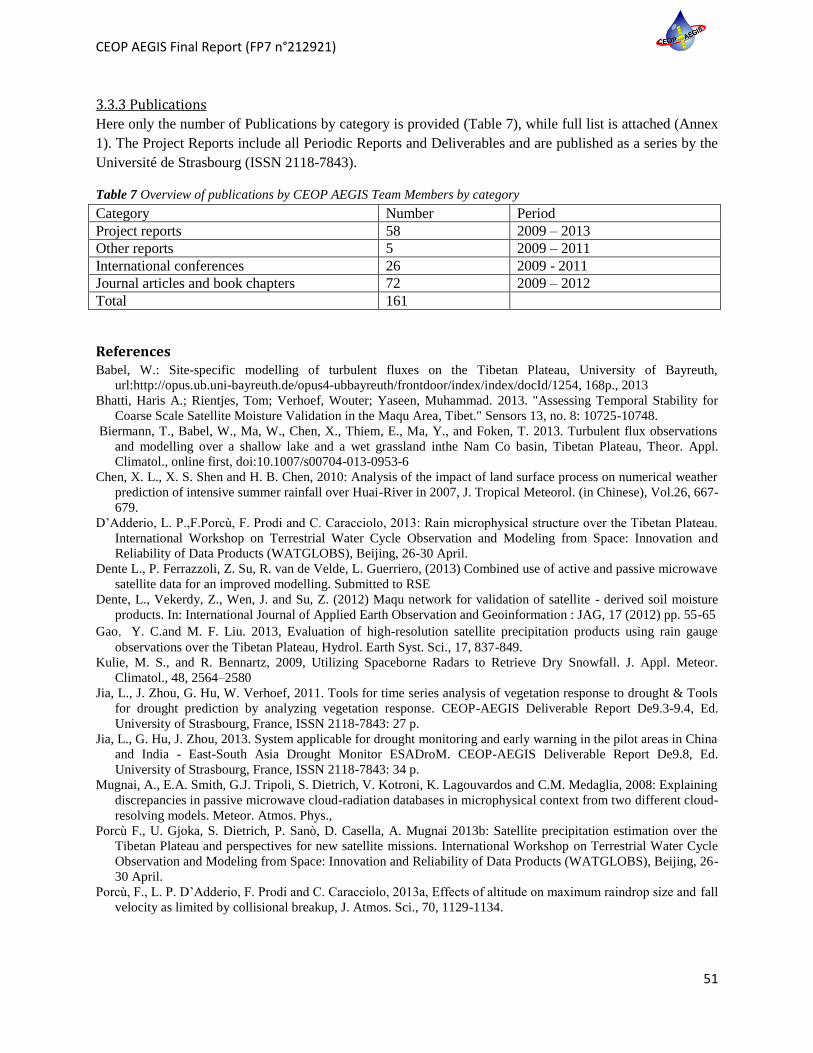
CEOP AEGIS Final Report (FP7 n°212921)
51
3.3.3 Publications
Here only the number of Publications by category is provided (Table 7), while full list is attached (Annex
1). The Project Reports include all Periodic Reports and Deliverables and are published as a series by the
Université de Strasbourg (ISSN 2118-7843).
Table 7 Overview of publications by CEOP AEGIS Team Members by category
Category Number Period
Project reports 58 2009 – 2013
Other reports 5 2009 – 2011
International conferences 26 2009 - 2011
Journal articles and book chapters 72 2009 – 2012
Total 161
References Babel, W.: Site-specific modelling of turbulent fluxes on the Tibetan Plateau, University of Bayreuth,
url:http://opus.ub.uni-bayreuth.de/opus4-ubbayreuth/frontdoor/index/index/docId/1254, 168p., 2013
Bhatti, Haris A.; Rientjes, Tom; Verhoef, Wouter; Yaseen, Muhammad. 2013. "Assessing Temporal Stability for
Coarse Scale Satellite Moisture Validation in the Maqu Area, Tibet." Sensors 13, no. 8: 10725-10748.
Biermann, T., Babel, W., Ma, W., Chen, X., Thiem, E., Ma, Y., and Foken, T. 2013. Turbulent flux observations
and modelling over a shallow lake and a wet grassland inthe Nam Co basin, Tibetan Plateau, Theor. Appl.
Climatol., online first, doi:10.1007/s00704-013-0953-6
Chen, X. L., X. S. Shen and H. B. Chen, 2010: Analysis of the impact of land surface process on numerical weather
prediction of intensive summer rainfall over Huai-River in 2007, J. Tropical Meteorol. (in Chinese), Vol.26, 667-
679.
D‘Adderio, L. P.,F.Porcù, F. Prodi and C. Caracciolo, 2013: Rain microphysical structure over the Tibetan Plateau.
International Workshop on Terrestrial Water Cycle Observation and Modeling from Space: Innovation and
Reliability of Data Products (WATGLOBS), Beijing, 26-30 April.
Dente L., P. Ferrazzoli, Z. Su, R. van de Velde, L. Guerriero, (2013) Combined use of active and passive microwave
satellite data for an improved modelling. Submitted to RSE
Dente, L., Vekerdy, Z., Wen, J. and Su, Z. (2012) Maqu network for validation of satellite - derived soil moisture
products. In: International Journal of Applied Earth Observation and Geoinformation : JAG, 17 (2012) pp. 55-65
Gao,Y. C.and M. F. Liu. 2013, Evaluation of high-resolution satellite precipitation products using rain gauge
observations over the Tibetan Plateau, Hydrol. Earth Syst. Sci., 17, 837-849.
Kulie, M. S., and R. Bennartz, 2009, Utilizing Spaceborne Radars to Retrieve Dry Snowfall. J. Appl. Meteor.
Climatol., 48, 2564–2580
Jia, L., J. Zhou, G. Hu, W. Verhoef, 2011. Tools for time series analysis of vegetation response to drought & Tools
for drought prediction by analyzing vegetation response. CEOP-AEGIS Deliverable Report De9.3-9.4, Ed.
University of Strasbourg, France, ISSN 2118-7843: 27 p.
Jia, L., G. Hu, J. Zhou, 2013. System applicable for drought monitoring and early warning in the pilot areas in China
and India - East-South Asia Drought Monitor ESADroM. CEOP-AEGIS Deliverable Report De9.8, Ed.
University of Strasbourg, France, ISSN 2118-7843: 34 p.
Mugnai, A., E.A. Smith, G.J. Tripoli, S. Dietrich, V. Kotroni, K. Lagouvardos and C.M. Medaglia, 2008: Explaining
discrepancies in passive microwave cloud-radiation databases in microphysical context from two different cloud-
resolving models. Meteor. Atmos. Phys.,
Porcù F., U. Gjoka, S. Dietrich, P. Sanò, D. Casella, A. Mugnai 2013b: Satellite precipitation estimation over the
Tibetan Plateau and perspectives for new satellite missions. International Workshop on Terrestrial Water Cycle
Observation and Modeling from Space: Innovation and Reliability of Data Products (WATGLOBS), Beijing, 26-
30 April.
Porcù, F., L. P. D‘Adderio, F. Prodi and C. Caracciolo, 2013a, Effects of altitude on maximum raindrop size and fall
velocity as limited by collisional breakup, J. Atmos. Sci., 70, 1129-1134.
CEOP AEGIS Final Report (FP7 n°212921)
52
Shang, H., H. Pelgrum, A. Klaasse, M.Menenti. (2009). Algorithm theoretical basis document for surface wetness
indicators retrieved from passive and active microwave satellite data. CEOP-AEGIS Deliverable Report De10.1,
Ed. University of Strasbourg, France, ISSN 2118-7843: 23 p
Su, Z., P. de Rosnay, J. Wen, L. Wang, and Y. Zeng, 2013, Evaluation of ECMWF‘s Soil Moisture Analyses using
Observations on the Tibetan Plateau, Journal of Geophysical Research, Vol. 118, doi:10.1002/jgrd.50468.
Su, Z., Wen, J., Dente, L., van der Velde, R. and ... [et al.] (2011) The Tibetan plateau observatory of plateau scale
soil moisture and soil temperature, Tibet - Obs, for quantifying uncertainties in coarse resolution satellite and
model products. In: Hydrology and earth system sciences (HESS) : open access, 15 (2011)7 pp. 2303-2016.
Sugimoto S., K. Ueno and W. Sha (2008), Transportation of water vapor into the Tibetan Plateau in the case of a
passing synoptic-scale trough. J. Meteor. Soc. Japan, 86, 935-949.
Sugimoto, S., and K. Ueno (2010), Formation of mesoscale convective systems over the eastern Tibetan Plateau
affected by plateau‐scale heating contrasts, J. Geophys. Res., 115, D16105, doi:10.1029/2009JD013609.
Ueno, K., S. Sugimoto, T. Koike, H. Tsutsui, and X. Xu (2011), Generation processes of mesoscale convective
systems following midlatitude troughs around the Sichuan Basin, J. Geophys. Res., 116, D02104,
doi:10.1029/2009JD013780.
van der Velde, R., Su, Z. and Ma, Y. (2008) Impact of soil moisture dynamics on ASAR signatures and its spatial
variability observed over the Tibetan plateau. In: Sensors : journal on the science and technology of sensors and
biosensors : open access, 8 (2008)9 pp. 5479-5491.
van der Velde, R., Su, Z., van Oevelen, P., Wen, J., Ma, Y. and Salama, M.S. (2012) Soil moisture mapping over the
central part of the Tibetan Plateau using a series of ASAR WS images. In: Remote sensing of environment, 120
(2012) pp. 175-187.
Wang, S., Y. Ma, 2011, Characteristics of land–Atmosphere interaction parameters over the Tibetan Plateau, Journal
of Hydrometeorology, 12(4): 702-708. Capacci, D. and F. Porcù, 2009: Evaluation of a satellite multispectral
VIS/IR daytime statistical rain-rate classifier and comparison with passive microwave rainfall estimates, J. Appl.
Meteor. Clim., 48, 284-300.
Xue H., X. Shen and Y. Su, (2011), Parameterization of Turbulent Orographic Form Drag and Implementation in
GRAPES (in Chinese). Journal of Applied Meteorological Sciences, Vol.22, No.2, 169-181.
Yang J. and X. Shen, (2011), The Construction of SCM in GRAPES and Its Applications in Two Field Experiment
Simulations. Advances in Atmospheric Sciences, VOL. 28, NO. 3, 2011, 534-550.
Yang J. and X. Shen, (2012): A case study of the GRAPES single column model. Acta Meteorologica Sinica (in
Chinese). Vol. 70, No.2,275-290
Zeng Y., Z. Su, L. Wang, K. Xu, (2013), A Blended Soil Moisture Product over Tibetan Plateau using Satellite,
Reanalysis and in-situ Data, under submission
Zhao T.J., L. X. Zhang, J. C. Shi, L. M. Jiang, (2011b), A physically based statistical methodology for surface soil
moisture retrieval in the Tibet Plateau using microwave vegetation indices, Journal of Geophysical Research,
116, D08116, doi:10.1029/2010JD015229
Zhao, W., B.-H. Tang and Z.-L. Li. (2011a). Estimation of soil moisture from Geostationary Satellite (GS) data 4
(optical remotely sensed data). CEOP-AEGIS Deliverable Report De4.3, Ed. University of Strasbourg, France,
ISSN 2118-7843: 21 p.
Zhou,D., R.Eigenmann, W.Babel,T.Foken,Y. Ma, 2010, The study of near-ground free convection conditions at
Nam Co station on the Tibetan Plateau, TheoreticalApplied Climatology,DOI 10.1007/s00704-010-0393-5.
Zhuang W. and Liu L., 2012. A reflectivity climatology algorithm for hybrid scans and its application to radar
coverage over the Tibetan Plateau. Acta Meteor. Sinica, 26(6),746-757.
CEOP AEGIS Final Report (FP7 n°212921)
53
Annex 1 List of Publications
This Annex reports all the scientific publications that fully or partly benefit from the CEOP-AEGIS project.
Project reports Note: In the following list, project reports are sorted by numbers. The numbering of the project reports is of the form
X.Y, where X is the work-package number and Y the deliverable number within a given work-package.
(1.1) Eigenmann, R., Babel, W., Foken T., Zhou D. and Ma, Y. (2009). Detailed approach and preliminary data
analysis protocol for the characterization of seasonal and inter-annual time scales fluxes. CEOP-AEGIS
Deliverable Report De1.1, Ed. University of Strasbourg, France, ISSN 2118-7843: 32 p.
(1.2) Babel. W, R.Eigenmann, Y.Ma and T.Foken. (2011). Analysis of turbulent fluxes and their representativeness
for the interaction between the atmospheric boundary layer and the underlying surface on Tibetan Plateau.
CEOP-AEGIS Deliverable Report De1.2, Ed. University of Strasbourg, France, ISSN 2118-7843: 35 p.
(1.3) Babel, W., M.Li, F. Sun, W. Ma, X.Chen, J.Colin, Y.Ma and T.Foken. (2011). Postprocessing of ground based
turbulent measurements and preparation for the CEOP-AEGIS database in NetCDF. CEOP-AEGIS Deliverable
Report De1.3, Ed. University of Strasbourg, France, ISSN 2118-7843: 90 p
(1.4) Ma, Y. (2011). Atmospheric water vapor transport. CEOP-AEGIS Deliverable Report De1.4, Ed. University of
Strasbourg, France, ISSN 2118-7843: 10 p.
(2.1) Yan, G., W. Verhoef, Q. Liu, Z. Xiao, M. Menenti, L. Jia, Q. Liu, X. Mu, J. Li, B. Zhong, H. Ren. (2009).
Generic algorithms to retrieve land surface variables with a multitude of satellite sensors. CEOP-AEGIS
Deliverable Report De2.1, Ed. University of Strasbourg, France, ISSN 2118-7843: 126 p.
(2.2) Liu, Z. and Z.-L. Li. (2009). Algorithms to produce a consistent land surface temperature from polar satellites.
CEOP-AEGIS Deliverable Report De2.2, Ed. University of Strasbourg, France, ISSN 2118-7843: 16 p.
(2.3) Tang, B.-H. and Z.-L. Li. (2011). Algorithms for surface albedo, emissivity and temperature from
geostationary satellite. CEOP-AEGIS Deliverable Report De2.3, Ed. University of Strasbourg, France, ISSN
2118-7843: 25 p.
(2.4) Yan, G., W. Verhoef, Q. Liu, Z. Xiao, M. Menenti, L. Jia, Q. Liu, X. Mu, J. Li, B. Zhong, H. Ren. (2011).
Multi-source remote sensing - ATBD. CEOP-AEGIS Deliverable Report De2.4, Ed. University of Strasbourg,
France, ISSN 2118-7843: 136 p.
(2.5) Yan, G., Z.-L. Li, B.-H. Tang, Z. Xiao, X. Mu, L. Jia, J. Yang, Q. Liu, J. Li, Q. Liu. (2011). Description of
land surface properties retrieved from spectro-radiometric data in the optical spectral region. CEOP-AEGIS
Deliverable Report De2.5, Ed. University of Strasbourg, France, ISSN 2118-7843: 13 p.
(2.6) Yan, G., Z.-L. Li, B.-H. Tang, Z. Xiao, X. Mu, Q. Liu, J. Li, L. Jia, Q. Liu (2013). Validated dataset of land
surface properties over a 3 years period. CEOP-AEGIS Deliverable Report De2.6, Ed. University of Strasbourg,
France, ISSN 2118-7843: 17 p.
(3.1) Jia, L., M. Menenti. (2009). Review of selected existing algorithms and models on local, regional and Plateau
scales data sets. CEOP-AEGIS Deliverable Report De3.1, Ed. University of Strasbourg, France, ISSN 2118-
7843: 27 p.
(3.2) MENENTI, M., J.COLIN, R.FAIVRE, L.ROUPIOZ, L.JIA. (2009). Generalization of the surface energy
balance calculation over the Tibetan Plateau. CEOP-AEGIS Deliverable Report De3.2, Ed. University of
Strasbourg, France, ISSN 2118-7843: 32 p.
(3.3) COLIN, J., L.ROUPIOZ, H.GHAFARIAN, J.BAI, L.JIA, S.M.LIU, R.FAIVRE, F.NERRY, M.MENENTI.
(2011). Surface Radiative and Energy Balance time-series processing and validation procedure document.
CEOP-AEGIS Deliverable Report De3.3, Ed. University of Strasbourg, France, ISSN 2118-7843: 34 p.
(3.4) FAIVRE, R., J.COLIN, L.ROUPIOZ, H.GHAFARIAN, Z.LI, L.JIA, F.NERRY, M.MENENTI (2012).
Preliminary time-series maps of fluxes over 3 years, with a target frequency of one week. CEOP-AEGIS
Deliverable Report De3.4, Ed. University of Strasbourg, France, ISSN 2118-7843: 27 p.
(3.5) FAIVRE, R., J.COLIN, L.ROUPIOZ, H.GHAFARIAN, Z. LI, L.JIA, F.NERRY, M.MENENTI (2013).
Validated time-series maps of fluxes over 3 years, with a frequency of one day. CEOP-AEGIS Deliverable
Report De3.5, Ed. University of Strasbourg, France, ISSN 2118-7843: 22 p.
(4.1) Dente, L., Z. Vekerdy, Z. Su, J.Wen. (2009). Collection of consistent continuous in-situ soil moisture
measurements at regional scale. CEOP-AEGIS Deliverable Report De4.1, Ed. University of Strasbourg, France,
ISSN 2118-7843: 17 p.
CEOP AEGIS Final Report (FP7 n°212921)
54
(4.2) Su, Z., L.Dente, R. van der Velde, J. Wen, L. Zhang, T. Zhao, L. Jiang, T. Zhang, Y. Li, X. Li, L. Xiao. (2011).
Development of a satellite sensor independent system for the soil moisture combined retrieval algorithms.
CEOP-AEGIS Deliverable Report De4.2, Ed. University of Strasbourg, France, ISSN 2118-7843: 60 p.
(4.3) Zhao, W., B.-H. Tang and Z.-L. Li. (2011). Estimation of soil moisture from Geostationary Satellite (GS) data
4 (optical remotely sensed data). CEOP-AEGIS Deliverable Report De4.3, Ed. University of Strasbourg, France,
ISSN 2118-7843: 21 p.
(4.4) Zeng, Y., L.Dente, J.Wen and Z. Su (2012). A data product of the plateau using different sensors
simultaneously. CEOP-AEGIS Deliverable Report De4.4, Ed. University of Strasbourg, France, ISSN 2118-
7843: 16 p.
(4.5) Su, Z., J.Wen, L.Dente, R.van der Velde, L.Wang, Y.Ma, L.Jiang, K.Yang, Z.Hu, X.Li, L.Xiao (2012).
Preliminary results and documentation of Uncertainties. CEOP-AEGIS Deliverable Report De4.5, Ed. University
of Strasbourg, France, ISSN 2118-7843: 21 p.
(4.6) Su, Z., Y.Zeng, L.Dente, L.Wang, J.Wen, R.van der Velde (2012). Soil moisture products on the Qinghai-Tibet
Plateau. CEOP-AEGIS Deliverable Report De4.6, Ed. University of Strasbourg, France, ISSN 2118-7843: 18 p.
(5.1) Liu, L., H. Wang, Y. Xiao, Z. Hu. (2009). Algorithms for QPE, 3D mosaic and hydrometeor classification.
CEOP-AEGIS Deliverable Report De5.1, Ed. University of Strasbourg, France, ISSN 2118-7843: 28 p.
(5.2) Porcu, F., U. Gjoka and Y.-C. Gao. (2011). Provide rainfall estimation algorithms from satellites (MW, VIS-
IR) 5 data. CEOP-AEGIS Deliverable Report De5.2, Ed. University of Strasbourg, France, ISSN 2118-7843: 27
p.
(5.3) Liu, L., W. Zhuang, F.Porcu and U. Gjoka. (2011). Provide 3-years 3-D gridded radar data for case studies.
CEOP-AEGIS Deliverable Report De5.3, Ed. University of Strasbourg, France, ISSN 2118-7843: 11 p.
(5.4) Porcu, F., U.Gjoka and W.Zhuang (2012). Provide high space and temporal resolution precipitation data
retrieved from radar, satellite (both VIS-IR and MW) and ground rain gauge data for case studies. CEOP-AEGIS
Deliverable Report De5.4, Ed. University of Strasbourg, France, ISSN 2118-7843: 14 p.
(5.5) Porcu, F., L.Liu and W.Zhuang (2012). High space and temporal resolution precipitation data retrieved from
radar, satellite (both VIS-IR and MW) and ground rain gauge data for entire QT Plateau and for the years 2008,
2009 and 2010. CEOP-AEGIS Deliverable Report De5.5, Ed. University of Strasbourg, France, ISSN 2118-
7843: 10 p.
(6.1) Hao, X., J. Wang, H. Li, Z. Li, R. Jin, T. Che, K. Yang. (2009). Sample data set and Report on retrieval
performance based on MODIS and AMSR-E data. CEOP-AEGIS Deliverable Report De6.1, Ed. University of
Strasbourg, France, ISSN 2118-7843: 58 p.
(6.2) Hao, X., J. Wang, H. Li, Z. Li, R. Jin, T. Che, K. Yang. (2009). Preliminary Algorithm Theoretical Basis
Documents for Snow/Ice/Frozen soil Properties. CEOP-AEGIS Deliverable Report De6.2, Ed. University of
Strasbourg, France, ISSN 2118-7843: 61 p.
(6.3) Wang, J., X.H. Hao, T. Che, Y.C. Bo, J. Bi, L.Y. dai, R. Jin and C.L. Huang. (2011). Snow and Ice data
products - ATBD. CEOP-AEGIS Deliverable Report De6.3, Ed. University of Strasbourg, France, ISSN 2118-
7843: 90 p.
(6.4) Wang, J., X.H. Hao, T. Che, Y.C. Bo, J. Bi, L.Y. dai, R. Jin and C.L. Huang. (2011). Description of the data
sets: snow cover area, SWE, glacier area and storage from satellite data, and assimilation data sets. CEOP-
AEGIS Deliverable Report De6.4, Ed. University of Strasbourg, France, ISSN 2118-7843: 12 p.
(6.5) Wang, J., X.H.Hao, T.Che, Y.Bo, C.Huang, R.Jin, J.Bi, L. Dai, L. Yan (2012). Validated data set of snow
cover, fractional snow cover, snow depth, glacier area and assimilation data sets. CEOP-AEGIS Deliverable
Report De6.5, Ed. University of Strasbourg, France, ISSN 2118-7843: 49 p.
(6.6) Li, H., J.Wang, S. Kang, Z. Tang, T. Che, X. Pan, C. Huang, X.Wang, X. Hao and S. Sun (2012). Evaluation
of water resources contributed by the snowmelt and glacier melt on Qinghai-Tibet Plateau. CEOP-AEGIS
Deliverable Report De6.6, Ed. University of Strasbourg, France, ISSN 2118-7843: 33 p.
(7.1) Ueno, K., S. Sugimoto and X. Shen. (2011). Report and data set on results of numerical experiments to
document the response to observed evolution of snow and vegetation cover and surface heat fluxes over the
Plateau. CEOP-AEGIS Deliverable Report De7.1, Ed. University of Strasbourg, France, ISSN 2118-7843: 23 p.
(7.2) Shen, X., J. Yang and Y. Su (2013). Successive 24-hour Forecast Experiments by Using GRAPES Meso-scale
Model. CEOP-AEGIS Deliverable Report De7.2, Ed. University of Strasbourg, France, ISSN 2118-7843: 8 p.
(8.1) Zheng, H., W.Immerzeel, G.D'Urso and J.Colin. (2011). Design of a data processing protocol for E.O. based
water balance products. CEOP-AEGIS Deliverable Report De8.1, Ed. University of Strasbourg, France, ISSN
2118-7843: 34 p.

CEOP AEGIS Final Report (FP7 n°212921)
55
(8.2) Immerzeel, W., C.De Michele, N.Holzer and J.Colin (2012). Prototype of data collection, integration and
processing system to monitor the Plateau water balance. CEOP-AEGIS Deliverable Report De8.2, Ed. University
of Strasbourg, France, ISSN 2118-7843: 51 p.
(8.3) Liu, X., H. Zheng and W. Immerzeel (2013). Time series analysis of water balance data. CEOP-AEGIS
Deliverable Report De8.3, Ed. University of Strasbourg, France, ISSN 2118-7843: 15 p.
(8.4) COLIN, J., N.HOLZER, X.GUO. (2011). The CEOP-AEGIS Data Portal Software Requirement and
Specifications Document. CEOP-AEGIS Deliverable Report De8.4, Ed. University of Strasbourg, France, ISSN
2118-7843: 38 p.
(9.1) Sobrino, J.A., Y. Julien, G. Soria, J. C. Jimnez-Munoz, V. Hidalgo, B. Franch, C. Mattar, R. Oltra and J.
Cuenca. (2009). Vegetation dynamic maps over a long-term period.CEOP-AEGIS Deliverable Report De9.1, Ed.
University of Strasbourg, France, ISSN 2118-7843: 24 p.
(9.2) Jia, L., R. Sun, R. Jha, G. Hu, J.A. Sobrino, Y. Julien, N. Huang, Z. Niu. (2011). Maps of drought vulnerability
zones in the study area. CEOP-AEGIS Deliverable Report De9.2, Ed. University of Strasbourg, France, ISSN
2118-7843: 43 p.
(9.3-9.4) Jia, L., J. Zhou, G. Hu, W. Verhoef. (2011). Tools for time series analysis of vegetation response to
drought & Tools for drought prediction by analyzing vegetation response. CEOP-AEGIS Deliverable Report
De9.3-9.4, Ed. University of Strasbourg, France, ISSN 2118-7843: xx p.
(9.5) Pelgrum, H., A. Klaasse, S. Zwart, L. Jia, G. Hu and J. Zhou. (2011). Anomalies maps of rainfall, vegetation
response. CEOP-AEGIS Deliverable Report De9.5, Ed. University of Strasbourg, France, ISSN 2118-7843: 48 p.
(9.6) Pelgrum, H., A. Klaasse. (2011). Tools for evaluating drought impact on agriculture and forestry. CEOP-
AEGIS Deliverable Report De9.6, Ed. University of Strasbourg, France, ISSN 2118-7843: 27 p.
(9.7) Jia, L., L. Roupioz, G. Hu, J. Zhou (2012). Anomalies maps of net radiation, LST and FPAR. CEOP-AEGIS
Deliverable Report De9.7, Ed. University of Strasbourg, France, ISSN 2118-7843: 25 p.
(9.8) Jia, L., G. Hu, J. Zhou (2013). System applicable for drought monitoring and early warning in the pilot areas in
China and India - East-South Asia Drought Monitor ESADroM. CEOP-AEGIS Deliverable Report De9.8, Ed.
University of Strasbourg, France, ISSN 2118-7843: 34 p.
(10.1) Shang, H., H. Pelgrum, A. Klaasse, M.Menenti. (2009). Algorithm theoretical basis document for surface
wetness indicators retrieved from passive and active microwave satellite data. CEOP-AEGIS Deliverable Report
De10.1, Ed. University of Strasbourg, France, ISSN 2118-7843: 23 p.
(10.2) Jha, R., Z. Liu. (2011). Real time flood forecast models based on stochastic time series, ANN and Fuzzy logic
for the study area. CEOP-AEGIS Deliverable Report De10.2, Ed. University of Strasbourg, France, ISSN 2118-
7843: 24 p.
(10.3) Jha, R., Z. Liu (2012). Flood inundation, flood hazard and flood risk zone maps based on the hydraulic
modelling and analysis of satellite data. CEOP-AEGIS Deliverable Report De10.3, Ed. University of Strasbourg,
France, ISSN 2118-7843: 28 p.
(10.4) Jha, R., Z. Liu. (2011). Real time forecasting of flood inundation, depth, areal extent and return period of
flooding. CEOP-AEGIS Deliverable Report De10.4, Ed. University of Strasbourg, France, ISSN 2118-7843: 29
p.
(11.1.1) Menenti, M., J.Colin, Z.Vekerdy. (2009). Capacity building. CEOP-AEGIS Deliverable Report De11.1.1,
Ed. University of Strasbourg, France, ISSN 2118-7843: 16 p.
(11.1.2) VEKERDY, Z., J. COLIN, Y. YAN, B. SU, L. WANG. (2011). Dissemination and Stakeholders Panel
second reporting period. CEOP-AEGIS Deliverable Report De11.1.2, Ed. University of Strasbourg, France,
ISSN 2118-7843: 52 p.
(11.2.2) VEKERDY, Z., R. JHA, J. COLIN, Y. YAN, B. SU (2012). Training Session Nr.2 Involving Major SE
Asia Hydrometeorological Organizations, NIT Rourkela, 16-20th April 2012. CEOP-AEGIS Deliverable Report
De11.2.2, Ed. University of Strasbourg, France, ISSN 2118-7843: 44 p.
(11.2.3) Yan, Y., Z. Vekerdy, J. Colin and B. Su (2013). CEOP-AEGIS 2013 Advanced 3rd Training and closing
workshop (WATGLOBS). CEOP-AEGIS Deliverable Report De11.2.3, Ed. University of Strasbourg, France,
ISSN 2118-7843: 28 p.
Other reports Foken, T. and H.Falke. (2010). Documentation and Instruction Manual for the Krypton Hygrometer Calibration
Instrument. Work Report of the University of Bayreuth, Dept. of Micrometeorology, ISSN 1614-8916, No. 42
Liang, J., Wang, J., Feng, K., Liu, C. (2010). Scattering simulation of snow grains. Dragon 2 programme Mid-Term
results 2008-2010. 17-21 May 2010, Guillin, China.

CEOP AEGIS Final Report (FP7 n°212921)
56
Liang, J., Liu, C., Wang, J., Li, H. (2010). Snow reflectance retrieval from Hyperion imagery. Dragon 2 programme
Mid-Term results 2008-2010. 17-21 May 2010, Guillin, China.
Mauder, M. and Foken, T. (2011). Documentation and Instruction Manual of the Eddy-Covariance Software
Package TK3. Work Report of the University of Bayreuth, Dept. of Micrometeorology, ISSN 1614-8916, No.
46.
MENENTI, M., L. JIA AND J. COLIN. (2009). A Prototype Observation System for the Qinghai-Tibet Plateau in
Southeast Asia, Global Energy and Water cycle EXperiment letter, Vol. 19, no. 3.
International conferences Colin, J., M. Menenti, R. Faivre, Q. Liu, X. Shen, X. Li. (2010). Turbulent flux partitioning from local to meso scale
over high elevation arid regions of China, ESA Living Planet Symposium, Bergen, Norway, pp. 1--5, European
Space Agency (Eds.), June 2010.
COLIN, J., M.MENENTI, L.JIA, Y.MA. (2010). TOWARDS AN INTEGRATED USER-FRIENDLY PORTAL
FOR SHARING CEOP-AEGIS DATASETS, 2nd International Workshop on Energy and Water Cycle over the
Tibetan Plateau and High-elevations, Lhasa, China, 19-21 July 2010.
D'Urso, G., S. Falanga Bolognesi, C. de Michele, W. W. Immerzeel, P. Droogers, L. Changming, and Z. Hongxing.
(2011). Preliminary validation of the Tibetan plateau water balance monitoring system: the Yellow River case-
study, 3rd CEOP-AEGIS Plenary Meeting, Strasbourg, France, June 2011.
Du J. P., Sun R. (2011) Estimation of evapotranspiration for ungauged areas using MODIS measurements and
GLDAS data. The 18th Biennial Conference of International Society for Ecological Modelling, Beijing,
September 20-23, 2011
Hua Li, Qinhuo Liu, Jinxiong Jiang, Heshun Wang and Lin Sun (2011).VALIDATION OF THE LAND SURFACE
TEMPERATURE DERIVED FROM HJ-1B/IRS DATA WITH GROUND MEASUREMENTS. IGARSS
2011:293-296.
Hua Li, Qinhuo Liu, Jinxiong Jiang, Heshun Wang, Qing Li, Lin Sun. (2011). LAND SURFACE EMISSIVITY
RETRIEVAL FROM HJ-1B SATELLITE DATA USING A COMBINED METHOD. IGARSS2011:301-304.
Jinxiong Jiang, Qinhuo Liu, Hua Li and Huaguo Huang. (2011). SPLIT-WINDOW METHOD FOR LAND
SURFACE TEMPERATURE ESTIMATION FROM FY-3A/VIRR DATA. IGARSS 2011:305-308.ma
Li, X., L. Zhang, L. Jiang, S. Zhao and T. Zhao. (2010). Simulation and measurement of relief effects on passive
microwave radiation. IGARSS, 3015-3018.
Malik, M.J., Van der Velde, R., Vekerdy, Z., Su, Z., and Salman, M.F. (2011) Semi-empirical approach for
estimating broadband albedo of snow, Remote Sensing of Environment, 115, pp. 2086-2095. (IF: 4.607)
MENENTI, M., J. COLIN AND L. JIA. (2009). A prototype observation system for water resources in the Qinghai -
Tibet Plateau. Paper EGU2009-10434 EGU General Assembly, Vienna April 19th - 24th 2009.
MENENTI, M., L. JIA AND J. COLIN. (2011). Assessing ET and water use: an overview, The Water Information
Research and Development Alliance (WIRADA) Science, 1 to 5 August 2011 Melbourne, Australia (accepted).
MENENTI, M., J. COLIN AND L. JIA. (2010). Observation and modeling of land surface state and convective
activity over the Qinghai - Tibet Plateau, The Forth International Workshop on Catchment-scale Hydrological
Modeling and Data Assimilation (CAHMDA-IV), Lhasa, China, 21-23 July 2010.
MENENTI, M., J. COLIN AND L. JIA. (2010). A protoype observation system for water resources in South - East
Asia: ground and space observations, 2nd International Workshop on Energy and Water Cycle over the Tibetan
Plateau and High-elevations, Lhasa, China, 19-21 July 2010.
MENENTI, M., J. COLIN AND L. JIA. (2011). CEOP-AEGIS: Towards an integrated water cycle monitoring
system for Asia, 5th GEO European Project Workshop (GEPW5), London, 8 & 9 February 2011.
MENENTI, M., J. COLIN AND L. JIA. (2010). Assessing vulnerability and adaptation‖, GEOSS support for the
IPCC assessments: a workshop on the data needs of the climate impacts, adaptation and vulnerability research
community, Geneva, Switzerland, 1-4 February 2011.
MENENTI, M., J. COLIN AND L. JIA. (2010). The Asian Regional Showcase, 4th EU GEO Project Workshop,
Athens, Greece, 29-30 April 2010.
MENENTI, M., J. COLIN AND L. JIA. (2009). A protoype observation system for water resources in South - East
Asia: ground and space observations. Earth Observation and Water Cycle Science workshop, ESA-ESRIN,
Frascati, Italie, 18-20 novembre 2009.
MENENTI, M., J. COLIN AND L. JIA. (2009). A prototype observation system of water resources in the Qinghai -
Tibet Plateau. Indo-UK Workshop Water Resources Management under Climate and Environment Change. IIT,
Roorkee, September 11th - 13th 2009.
CEOP AEGIS Final Report (FP7 n°212921)
57
MENENTI, M., J. COLIN AND L. JIA. (2009). Coordinated Asia-European long-term Observing system of
Qinghai-Tibet Plateau hydro-meteorological processes and the Asian-monsoon systEm with Ground satellite
Image data and numerical Simulations. 5th International Symposium on Tibetan Plateau and 24th Himalaya -
Karakorum Workshop, Beijing, August 11th - 14th.
MENENTI, M., J. COLIN AND L. JIA. (2009). A prototype observation system of water resources in the Qinghai -
Tibet Plateau. 33rd International Symposium on Remote Sensing of Environment, Stresa, May 4-8th 2009.
SU Tao, WANG Peng-xin. (2009). Retrieval of crop water stress factor using remotely sensed biomass products.
ISRSE 33rd International Symposium on Remote Sensing of Environment, Stresa, Italy, May 4-8, 2009,
electronic version.
WANG Peng-xin, SUN Wei. (2009). Quantification of the vegetation temperature condition index for operational
drought monitoring. ISRSE 33rd International Symposium on Remote Sensing of Environment, Stresa, Italy,
May 4-8, 2009, electronic version.
Xu Hongwei, Sun Rui, Du Junping. (2011). Estimation of evapotranspiration in Heihe River Basin with HJ-1A/B
data. The 5th Cross Strait Conference on Remote Sensing, 2011, Harbin, China.
Zhang, Z, G. Sun, L. Zhang, Z. Guo and W. Huang. (2010). Biomass retrieval based on uavsar polarimetric data.
IGARSS, 604-607.
Zhang, T, L. Zhang, L. Jiang and T. Zhao. (2010). Effects of spatial heterogeneity of bare soil on soil moisture
retrieval from passive microwave remote sensing. IGARSS, 3886-3889.
Zhao, T., L. Zhang, R. Bindlish, J. Shi, L. Jiang, Y. Li, S. Zhao, T. Zhang and X. Li. (2011). Estimating vegetation
water content during a growing season of cotton. IGARSS, 791-794.
Journal articles and book chapters Babel, W., Huneke, S., and Foken, T. (2011). A framework to utilize turbulent flux measurements for mesoscale
models and remote sensing applications. Hydrol. Earth Syst. Sci. Discuss., 8, 5165-5225, doi:10.5194/hessd-8-
5165-2011.
Caracciolo, C., Porcù, F. and F. Prodi. (2011). Drop Size Distribution over the Tibetan Plateau. Geophysical
Research Abstracts, Vol. 13, EGU2011-12732, 2011, EGU General Assembly 2011.
Chen, X. L., X. S. Shen and H. B. Chen. (2010). Analysis of the impact of land surface process on numerical
weather prediction of intensive summer rainfall over Huai-River in 2007, J. Tropical Meteorol. (in Chinese),
Vol.26, 667-679.
Chen, X., Y. Ma, H. Kelder, Z. Su, and K. Yang. (2011). On the behaviour of the tropopause folding events over the
Tibetan Plateau, Atmos. Chem. Phys., 11, 5113-5122, doi:10.5194/acp-11-5113-2011.
Colin, J., Faivre, R. (2010). Aerodynamic roughness length estimation from very high-resolution imaging LIDAR
observations over the Heihe basin in China. Hydrol. Earth Syst. Sci., 14, 2661-2669, doi:10.5194/hess-14-2661-
2010, 2010.
D'Urso G., Immerzeel W., De Michele C., Zheng H.X., Menenti M. (2010). Earth Observation integrated modeling
tool for the description of water balance and run-off production of Tibetan Plateau. IAHS Remote Sensing and
Hydrology 2010 Symposium, sept.2010, Jackson Hole, WY (USA), in press (Red Book Series)
Dente, L., Vekerdy, Z., Wen, J. Su,Z. (2011) Maqu network for validation of satellite-derived soil moisture
products. Int. J. Appl. Earth Observ. Geoinf., doi:10.1016/j.jag.2011.11.004.
Gain, A. K., W. W. Immerzeel, F. C. Sperna Weiland, and M. F. P. Bierkens. (2011). Impact of climate change on
the stream flow of the lower Brahmaputra: trends in high and low flows based on discharge-weighted ensemble
modelling, Hydrology and Earth System Sciences, 15(5), 1537-1545.
Gao T., S. Kang, Peter Krause, Lan Cuo, Santoch Nepal. (2012). A test of J2000 model in a glacierized catchment in
the centralTibetan Plateau. Environment Earth Sciences. Doi: 10.1007/s12665-011-1142-5.
HAN Ping, WANG Peng-xin, ZHANG Shu-yu, ZHU De-hai. (2010). Drought forecasting based on the remote
sensing data using ARIMA models. Mathematical and Computer Modelling, 2010, 51(11-12), 1398-1403.
He H. , Z. Hu, X. Xun et al. (2011). Study on potential evapotranspiration and wet-dry condition in the seasonal
frozen soil region of northern Tibetan Plateau. Sciences in Cold and Arid Regions, 3(2): 172-178.
He H., Z. Hu X. Xun et al. (2010). THE VARIATION CHARACTERISTICS OF RADIATION OF THE
WETLAND SURFACE IN THE NORTHERN TIBETAN PLATEAU. Acta Energiae Solaris Sinica (in
Chinese), 31(5):561-567
He H., Z. Hu, X. Xun et al. (2010). Analysis on Potential Evaptranspiration and Dry-wet Condition in The Seasonal
Frozen Soil Region of Northern Tibetan Plateau. Plateau Meteorology (in Chinese), ,29(1):10-16.
HOU Shan-shan, WANG Peng-xin, TIAN Miao. (2011). Application of phase space reconstruction and RBF neural
network model in drought forecasting (In Chinese). Agricultural Research in the Arid Areas, 29(1): 224-230.
CEOP AEGIS Final Report (FP7 n°212921)
58
Huang, G.H., Liu, S.M., Liang, S.L. (2012). Estimation of net surface shortwave radiation from MODIS data.
International Journal of Remote Sensing. 33(3), 804-825.
Immerzeel, W. W., L. P. H. Beek, M. Konz, A.B. Shrestha, and M. F. P. Bierkens. (2011). Hydrological response to
climate change in a glacierized catchment in the Himalayas, Climatic Change, doi:10.1007/s10584-011-0143-4.
JIA, L. and M. MENENTI. (2010). Thermal infrared observations of heterogeneous soil-vegetation systems, Chapter
10 in 'Remote Sensing Optical Observations of Vegetation Properties', Editors: Maselli, F., Menenti, M., and
Brivio, A., Research Signpost, Kerala, India, pp. 227 - 274
Jia, L., G. Xi, S. Liu, C. Huang, Y. Yan, G. Liu. (2009). Regional estimation of Daily to Annual Regional
Evapotranspiration with MODIS data in the Yellow River Delta wetland,Hydrology and Earth System Sciences,
13, 1775-1787
Jia, L., H. Shang, G. Hu, and M. Menenti. (2011). Phenological response of vegetation to upstream river flow in the
Heihe River basin by time series analysis of MODIS data,Hydrology and Earth System Sciences, 15, 1047-1064,
2011
Jianguang Wen ; Qiang Liu ; Qinhuo Liu ; Qing Xiao ; Xiaowen Li. (2009). Scale effect and scale correction of
land- surface albedo in rugged terrain. International Journal of Remote Sensing Vol. 30, No. 20: 5397-5420
Julien, Y. and Sobrino, J. A. (2010). Comparison of cloud-reconstruction methods for time series of composite
NDVI data, Remote Sensing of Environment, 114 (2010) 618-625.
Kang, S.C., Yang, Y.P., Zhu, L.P., Ma, Y.M. (2011). Modern environmental processes and changes in the Nam Co
Basin, Tibetan Plateau. Beijing: China Meteorological Press, 418 p.
Li Yuan, Sun Rui, Liu Shaomin, Xu Ziwei, BAI Jie. (2010). A preliminary study of the validation of land surface
models with large aperture scintillometer data. Advances in Earth Science, 25(11): 1237-1247.
Li, H., Wang, J. (2011). Simulation of snow distribution and melt under cloudy conditions in an Alpine watershed.
Hydrol. Earth Syst. Sci., 15, 2195-2203, 2011, www.hydrol-earth-syst-sci.net/15/2195/2011/ doi:10.5194/hess-
15-2195-2011.
Li, X., L. Zhang, L. Jiang, S. Zhao and T. Zhao. (2011). Measurement and simulation of Hill-slope effects on
passive microwave remote sensing. Remote Sensing Technology and Application, 26:1, 74-81.(in Chinese)
Li, X., L. Zhang, L. Jiang, S. Zhao and T. Zhao. (2011). Simulation and measurement of relief effects on passive
microwave radiation. Journal of Remote Sensing, 15:1, 100-104.
Liu Xinsheng, Sun Rui, Wu Fang, Hu Bo, Wang Wen. (2010). Land-cover classification for Henan Province with
time-series MODIS EVI data. Transactions of the Chinese Society of Agricultural Engineering, 26(s1): 213-219.
Liu, S.M., Bai, J., Jia, Z.Z., Jia, L., Zhou, H.Z., Lu, L. (2010). Estimation of evapotranspiration in the Mu Us
Sandland of China. Hydrology and Earth System Sciences, 14, 573-584.
MA Quan, WANG Peng-xin, ZHAO Dong-ling, TIAN Miao. (2011). Analysis of scale-effect based on the drought
monitoring results of vegetation temperature condition index(In Chinese). Geography and Geo-Information
Science, 27(Suppl.): 43-46.
Ma, W., Ma, Y. and Su, Z. (2011). Feasibility of retrieving land surface heat fluxes from ASTER data using SEBS :
a case study from the Namco area of the Tibetan plateau. In:Arctic, antarctic and alpine research, 43(2), pp. 239-
245
Ma, W., Ma, Y., Hu, Z., Su, Z., Wang, J., and Ishikawa, H. (2011). Estimating surface fluxes over middle and upper
streams of the Heihe River Basin with ASTER imagery,Hydrology and Earth System Sciences, 15, 1403-1413,
doi:10.5194/hess-15-1403-2011.
MA, Y. M., M. MENENTI, and R.A. FEDDES. (2010). Parameterization of Heat Fluxes at Heterogeneous Surfaces
by Integrating Satellite Measurements with Surface Layer and Atmospheric Boundary Layer Observations. Adv.
Atmos. Sci., 27(2), 328{336, doi: 10.1007/s00376-009-9024-4
Ma, Y., B.Wang, L.Zhong, W. Ma. (2011). The regional surface heating field over heterogeneous landscape of the
Tibetan Plateau by using the MODIS and in-situ data Advances in Atmospheric Sciences, 29(1):1-7.Doi:
10.1007/s00376-011-1008-5.
Ma, Y., L. Zhong, B. Wang, W. Ma, X. Chen, and M. Li. (2011). Determination of land surface heat fluxes over
heterogeneous landscape of the Tibetan Plateau by using the MODIS and in-situ data, Atmos. Chem. Phys., 11,
10461-10469, doi:10.5194/acp-11-10461-2011.
Ma, Y., M. Li, X. Chen, S. Wang, R.Wu, W. Ma, L. Zhong, B. Wang, C.Zhu, T. Yao. (2011). Third Pole
Environment (TPE) program: a new base for the study of atmosphere-land interaction over the heterogeneous
landscape of the Tibetan Plateau and surrounding areas, IAHS Publ. 343, 110-117.
Ma, Y., Y. Wang, L. Zhong, R.Wu, S.Wang, M.Li. (2011). The characteristics of atmospheric turbulence and
radiation energy transfer and the structure of atmospheric boundary layer over the northern slope area of
Himalaya, Journal of the Meteorological Society of Japan, 89A:345-353.

CEOP AEGIS Final Report (FP7 n°212921)
59
Ma, Y., Y. Wang, L. Zhong, R.Wu, S.Wang, M.Li. (2011). The characteristics of atmospheric turbulence and
radiation energy transfer and the structure of atmospheric boundary layer over the northern slope area of
Himalaya, Journal of the Meteorological Society of Japan, 89A:345-353.
Mattar, C., Sobrino, J. A., Julien, Y. & Morales, L. (2010). Trends in column integrated water vapor over Europe
from 1973 to 2003, International Journal of Climatology, n/a. doi: 10.1002/joc.2186.
MENENTI, M., L. JIA, S. AZZALI, G. ROERINK, M. GONZALEZ-LOYARTE, S. LEGUIZAMON and W.
VERHOEF. (2010). Chapter 6 in 'Remote Sensing Optical Observations of Vegetation Properties', Editors:
Maselli, F., Menenti, M., and Brivio, A., Research Signpost, Kerala, India, pp. 131-163.
Pfab, D. (2011). Wasserdampfkonzentrationsmessungen in großen Höhen und bei niedrigen Temperaturen.
Mikrometeorologie, Universität Bayreuth, 2011.
Phan Hien, R.Lindenbergh, and M.Menenti. (2011). ICESat derived elevation changes of Tibetan lakes between
2003 and 2009. Int. J. Applied Earth Observ. Geoinform., Vol 1(11).
Sobrino, J. A., Jiménez-Muñoz, J. C., Zarco-Tejada, P. J., Sepulcre-Cantó, G., de Miguel, E., Sòria, G., Romaguera,
M., Julien, Y., Cuenca, J., Hidalgo, V., Franch, B., Mattar, C., Morales, L., Gillespie, A., Sabol, D., Balick, L.,
Su, Z., Jia, L., Gieske, A., Timmermans, W., Olioso, A., Nerry, F., Guanter, L., Moreno, J., & Shen, Q. (2009).
Thermal remote sensing from Airborne Hyperspectral Scanner data in the framework of the SPARC and
SEN2FLEX projects: an overview, Hydrology and Earth System Sciences, 13, 2031-2037, 2009.
Song, M., Y. Ma, Y. Zhang, M. Li, W. Ma, F. Sun. (2011). Climate change features along the Brahmaputra Valley
in the past 26 years and possible causes, Climatic Change, 106:649-660. 10.1007/s10584-010-9950-2.
Su, Z. J. Wen, L. Dente, R. van der Velde1, L.Wang, Y. Ma, K. Yang, and Z. Hu. (2011). The Tibetan Plateau
observatory of plateau scale soil moisture and soil temperature (Tibet-Obs) for quantifying uncertainties in coarse
resolution satellite and model products. Hydrol. Earth Syst. Sci., 15, 2303-2316, 2011, www.hydrol-earth-syst-
sci.net/15/2303/2011/ doi:10.5194/hess-15-2303-2011
Sugimoto, S. and K. Ueno. (2010). Formation of mesoscale convective systems over the eastern Tibetan Plateau
affected by plateau scale heating contrasts, J. Geophys. Res., 115, D16105, doi:10.1029/2009JD013609.
Sun J., Z. Hu, X. Xun et al. (2011). Albedo Characteristics in Different Underlying Surface in Mid- and Upper-
reaches of HEIFE and Its Impact Factor. Plateau Meteorology (in Chinese), 30(3): 607-613.
Sun Liang, Sun Rui, Li Xiaowen, Chen Huailiang and Zhang Xuefen. (2011). Estimating evapotranspiration using
improved fractional vegetation cover and land surface temperature space. Journal of Resources and Ecology,
2011 2(3) 225-231.
TANG Yan, LIU Jun-ming, WANG Peng-xin, SU Tao. (2011). Algorithm for retrieving soil water change amount
based on remote sensing data (In Chinese). Journal of Computer Applications, 2011, 31(suppl. 1): 188-191.
Tian H., Wen, J., Jun, Shi, X. K., Wang, X., Liu, R., Zhang, J. H., Lv, S. N. (2011). Estimation of soilmoisture in
summer by activemicrowave remote sensing for the Maqu area at the upper reaches of the Yellow R
iver.22(1):59-66, ADVANCES IN WATER SCIENCE (in Chinese).
TIAN Miao, WANG Peng-xin, SUN Wei. (2010). A review of retrieving of land surface parameters using the land
surface temperature-vegetation index feature space (In Chinese).Advance in Earth Science, 2010, 25(7): 698-705.
Ueno, K., S. Sugimoto, T. Koike, H. Tsutsui and X. Xu. (2011). Generation processes of mesoscale convective
systems following midlatitude troughs around the Sichuan Basin, J. Geophys. Res., 116, D02104,
doi:10.1029/2009JD013780.
WANG Wei, LIU Xiang-ge, WANG Peng-xin, LIU Chun-hong. (2011). Application of 4DVAR and EnKF
approaches for assimilating vegetation temperature condition index (In Chinese).Transactions of the Chinese
Society of Agricultural Engineering, 2011, 27(12): 184-190.
WANG Yi-ting CHEN Xiu-wan BO Yan-chen. (2010). Monitoring Glacier Volume Change Based on Multi-Source
DEM and Multi-Temporal Remote Sensing Images--a Case Study in the Mount Naimona nyi Region on the
Tibetan Plateau. Journal of Glaciology and Geocryology, 32(1):126-132
Wang, J., Li, H., Hao, X. (2010). Responses of snowmelt runoff to climatic change in an inland river basin,
Northwestern China, over the past 50 years. Hydrol. Earth Syst. Sci., 14, 1979-1987, 2010, www.hydrol-earth-
syst-sci.net/14/1979/2010/ doi:10.5194/hess-14-1979-2010.
Wang, S. and Y. Ma. (2011). Characteristics of land-Atmosphere interaction parameters over the Tibetan Plateau.
Journal of Hydrometeorology, 12£®4£©: 702-708
Xiao Zhiqiang, Jindi Wang, Shunlin Liang, et al., Variational retrieval of leaf area index from MODIS time series
data: Examples from the Heihe River Basin, North-west China,International Journal of Remote Sensing, 33(3):
730-745, 2012.
Xiao Zhiqiang, Liang Shunlin, Wang Jindi, and Jiang Bo. (2011). Real-time inversion of leaf area index from
MODIS time series data, Remote Sensing of Environment, 115(1): 97-106, 2011.
CEOP AEGIS Final Report (FP7 n°212921)
60
Xu, T.R., Liu, S.M., Liang, S.L., Qin, J. (2011). Improving predictions of water and heat fluxes by assimilating
MODIS land surface temperature products into Common Land Model.Journal of Hydrometeorology, 12:227-
244.
Xue H., X. Shen and Y. Su. (2011). Parameterization of Turbulent Orographic Form Drag and Implementation in
GRAPES (in Chinese). Journal of Applied Meteorological Sciences, Vol.22, No.2, 169-181.
Xun X., Z. Hu, J. Sun et al. (2011). A comparative Analysis of Height Field Variations over the Tibetan Plateau
Using ECMW and NCEP Reanalysis Data. Journal of Glaciology and Geocryology (in Chinese), 33(1): 80-87.
Yang J. and X. Shen. (2011). The Construction of SCM in GRAPES and Its Applications in Two Field Experiment
Simulations. Advances in Atmospheric Sciences, VOL. 28, NO. 3, 2011, 534-550
Yang, K., J. Qin, X-F Guo, D-G Zhou, Y. Ma. (2009). Method development for estimating sensible heat flux over
the Tibetan Plateau from CMA data. Journal of Applied Meteorology and Climatology, 48(12), 2474-2486, DOI:
10.1175/2009JAMC2167.1.
Yang, K., T. Koike, I. Kaihotsu, J. Qin. (2009). Validation of a dual-pass microwave land data assimilation system
for estimating surface soil moisture in semi-arid regions, Journal of Hydrometeorology, 10(3), 780-794.
You Q., S. Kang, G. Ren, K. Fraedrich, N. Pepin, Y. Yan, L. Ma. (2011). Changes of snow depth and snow day in
the eastern and central Tibetan Plateau from observational data.Climate Research. 46: 171-183. Doi:
10.3354/cr00985.
You, Q., S. Kang, E. Aguilar, N. Pepin, W.Flügel, Y. Yan, Y. Xu, Y. Zhang, J. Huang. (2011). Changes in daily
climate extremes in China and its connection to the large scale atmospheric circulation during 1961-2003.
Climate Dynamics. 36(11):2399-2417. Doi: 10.1007/s00382-009-0735-0.
ZHANG Shu-yu, SUN Wei, WANG Peng-xin. (2010). Classification of drought grades based on vegetation
temperature condition index (In Chinese). Arid Zone Research, 2010, 27(4): 600-606.
Zhang, T., L. Zhang, L. Jiang, S. Zhao, T. Zhao and Y. Li. (2012). Effects of spatial distribution of soil parameters
on soil moisture retrieval from passive microwave remote sensing. China Earth Science. in press.
Zhao, T., L. Zhang, J. Shi and L. Jiang. (2011). A physically based statistical methodology for surface soil moisture
retrieval in the Tibet Plateau using microwave vegetation indices. Journal of Geophysical Research, 116,
D08116.
Zhong, L., Ma, Y., Salama, M.S. and Su, Z. (2010). Assessment of vegetation dynamics and their response to
variations in precipitation and temperature in the Tibetan Plateau. In: Climatic change, 103 (3-4): 519-535
Zhong, L., Ma, Y., Su, Z. and Salama, M.S. (2010). Estimation of land surface temperature over the Tibetan Plateau
using AVHRR and MODIS data. In: Advances in atmospheric sciences, 27(2010)5, pp. 1110-1118
Zhong, L., Zhongbo Su, Y. Ma, Mhd. Suhyb Salama, and José A. Sobrino. (2011). Accelerated Changes of
Environmental Conditions on the Tibetan Plateau Caused by Climate Change, Journal of Climate, 24(4): 6540-
6550.
Zhou, D., R.Eigenmann, W.Babel, T.Foken, Y. Ma. (2011). The study of near-ground free convection conditions at
Nam Co station on the Tibetan Plateau, Theoretical Applied Climatology,105:217-228,DOI 10.1007/s00704-
010-0393-5.