ceo forum presentation(eng)
TRANSCRIPT
2007CEO FORUM
2007.1.11
2
Agenda
2006 Operating Performance
2007 Business Plan2
1
Figures provided in this presentation are based on unaudited financial statements of the Company.Certain contents in this presentation are subject to change during the course of auditing process.
3
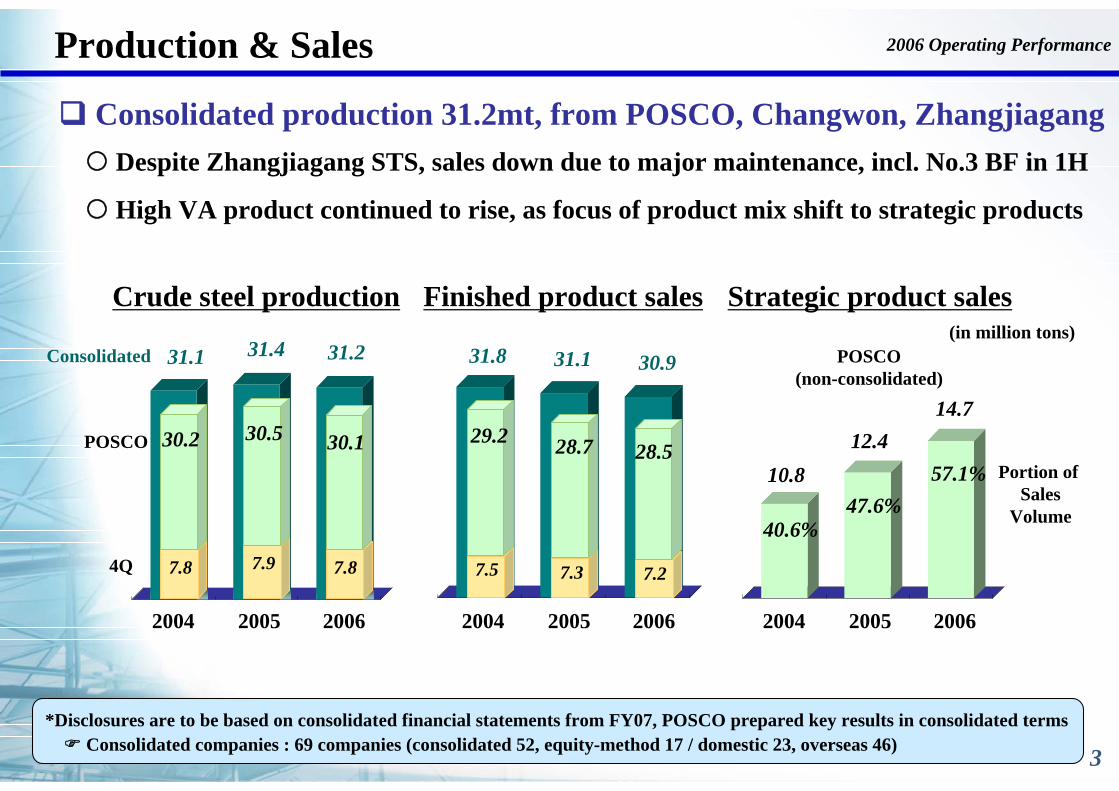
Production & Sales
(in million tons)Consolidated
Portion of Sales
Volume
Finished product sales Strategic product salesCrude steel production
POSCO(non-consolidated)
POSCO
Consolidated production 31.2mt, from POSCO, Changwon, ZhangjiagangDespite Zhangjiagang STS, sales down due to major maintenance, incl. No.3 BF in 1H
High VA product continued to rise, as focus of product mix shift to strategic products
2006 Operating Performance
*Disclosures are to be based on consolidated financial statements from FY07, POSCO prepared key results in consolidated termsConsolidated companies : 69 companies (consolidated 52, equity-method 17 / domestic 23, overseas 46)
2004 2005 2006 2004 2005 2006 2004 2005 2006
10.812.4
40.6%47.6%
31.8 31.131.1 31.4 31.2 30.9
14.7
57.1%
7.97.8 7.84Q
30.2 30.5 30.1
7.37.5 7.2
29.2 28.7 28.5
4
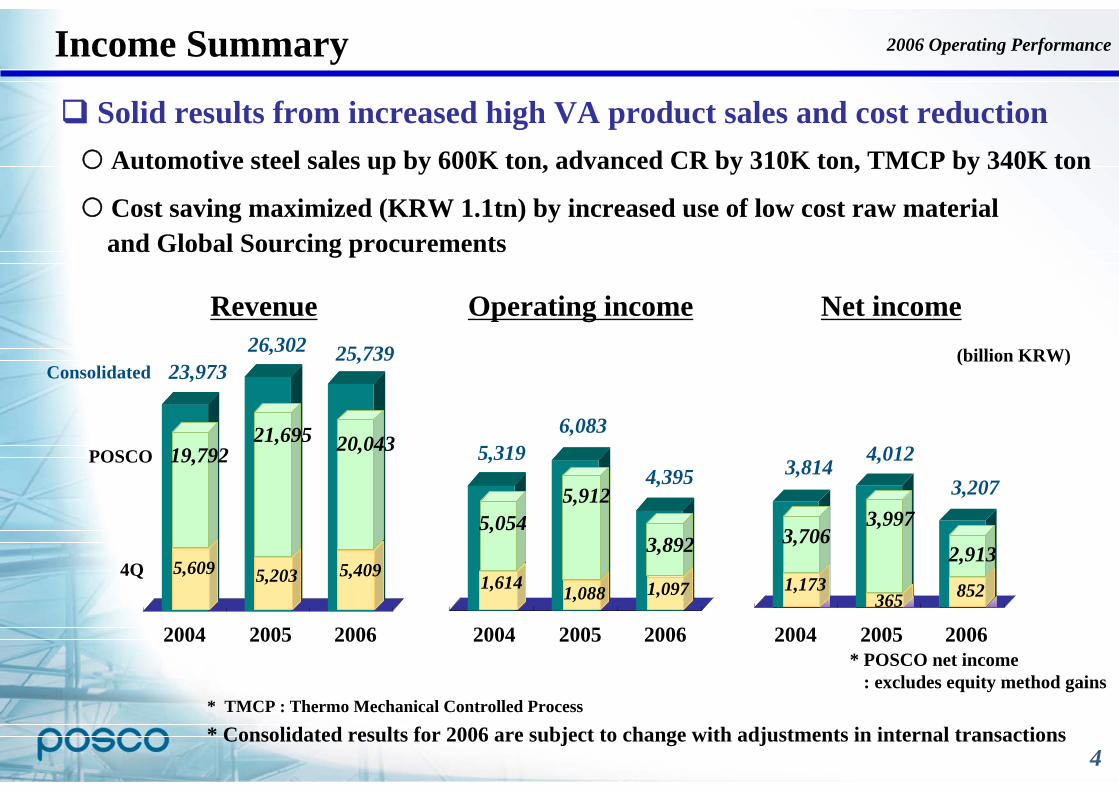
Income Summary
* Consolidated results for 2006 are subject to change with adjustments in internal transactions
(billion KRW)Consolidated
Revenue Operating income Net income
POSCO
* POSCO net income: excludes equity method gains
Solid results from increased high VA product sales and cost reductionAutomotive steel sales up by 600K ton, advanced CR by 310K ton, TMCP by 340K ton
Cost saving maximized (KRW 1.1tn) by increased use of low cost raw materialand Global Sourcing procurements
2006 Operating Performance
* TMCP : Thermo Mechanical Controlled Process
2004 2005 2006 2004 2005 2006 2004 2005 2006
23,97326,302
5,3196,083
4,395
25,739
3,814 4,0123,207
21,69519,792 20,043
5,2035,609 5,4094Q1,0881,614 1,097
5,0545,912
3,892
3651,173 852
3,7063,997
2,913
5
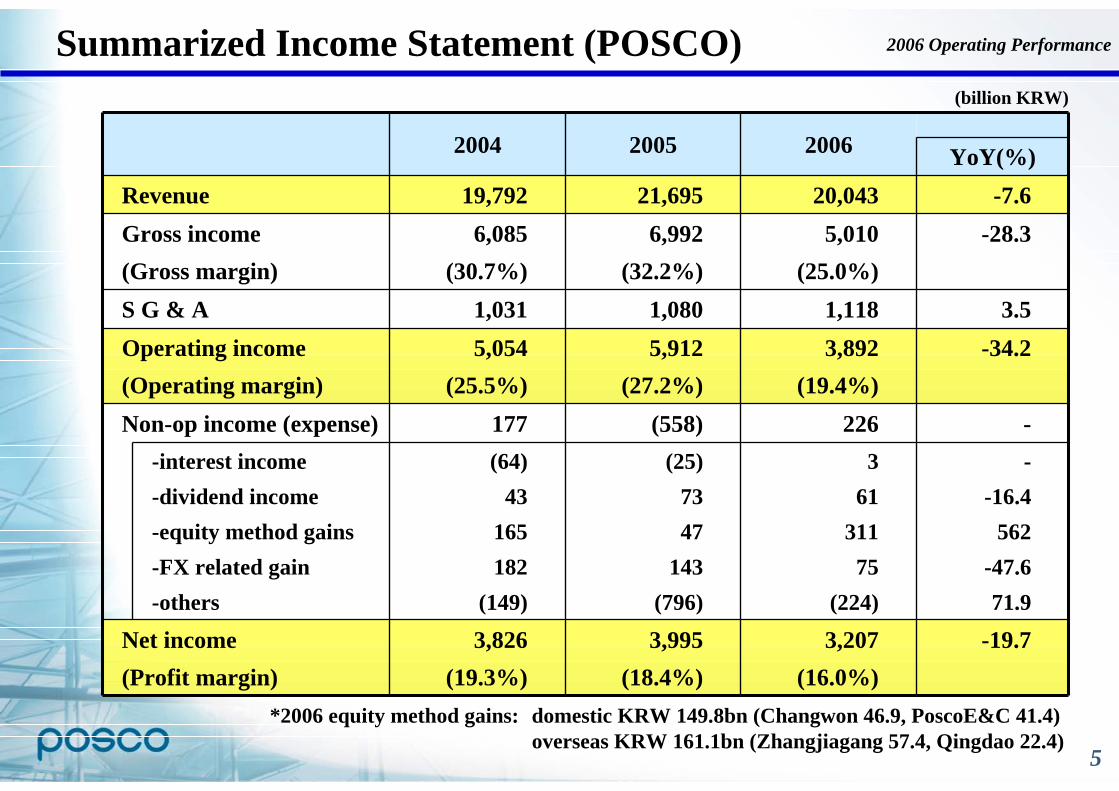
Summarized Income Statement (POSCO)
-interest income-dividend income-equity method gains-FX related gain-others
--16.4
562-47.671.9
361
31175
(224)
(25)7347
143(796)
(64)43
165182
(149)
YoY(%)
-19.7
-
-34.23.5
-28.3-7.6
Non-op income (expense)
S G & A
3,207(16.0%)
3,995(18.4%)
3,826(19.3%)
Net income(Profit margin)
226(558)177
3,892(19.4%)
5,912 (27.2%)
5,054 (25.5%)
Operating income(Operating margin)
1,1181,080 1,031
5,010(25.0%)
6,992 (32.2%)
6,085 (30.7%)
Gross income(Gross margin)
20,04321,695 19,792 Revenue
200620052004
(billion KRW)
*2006 equity method gains: domestic KRW 149.8bn (Changwon 46.9, PoscoE&C 41.4)overseas KRW 161.1bn (Zhangjiagang 57.4, Qingdao 22.4)
2006 Operating Performance
6
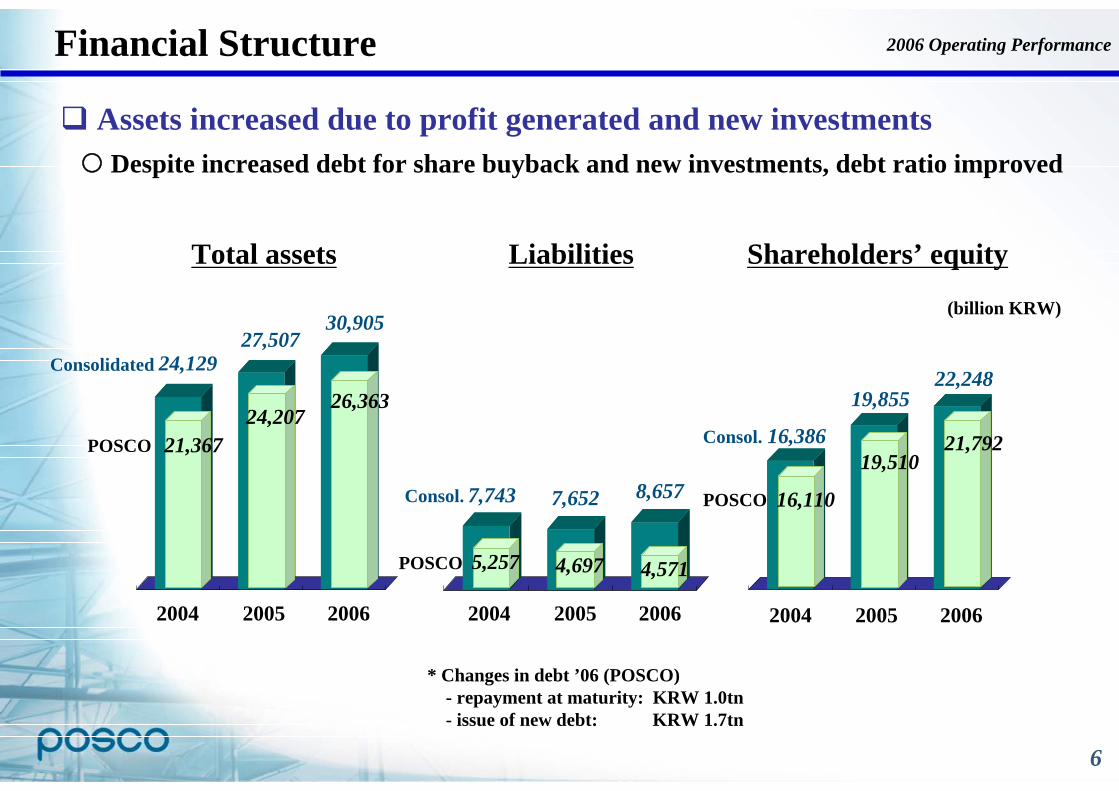
Financial Structure
Assets increased due to profit generated and new investmentsDespite increased debt for share buyback and new investments, debt ratio improved
(billion KRW)
2004 2005 2006
Consolidated
2004 2005 2006 2004 2005 2006
24,12927,507
7,743 7,652
16,386
19,855
Total assets Liabilities Shareholders’ equity
POSCO
Consol.
POSCO
30,905
8,657
22,248
POSCO 21,36724,207
Consol.
26,363
5,257 4,697 4,571
16,110
19,51021,792
* Changes in debt ’06 (POSCO)- repayment at maturity: KRW 1.0tn- issue of new debt: KRW 1.7tn
2006 Operating Performance
7
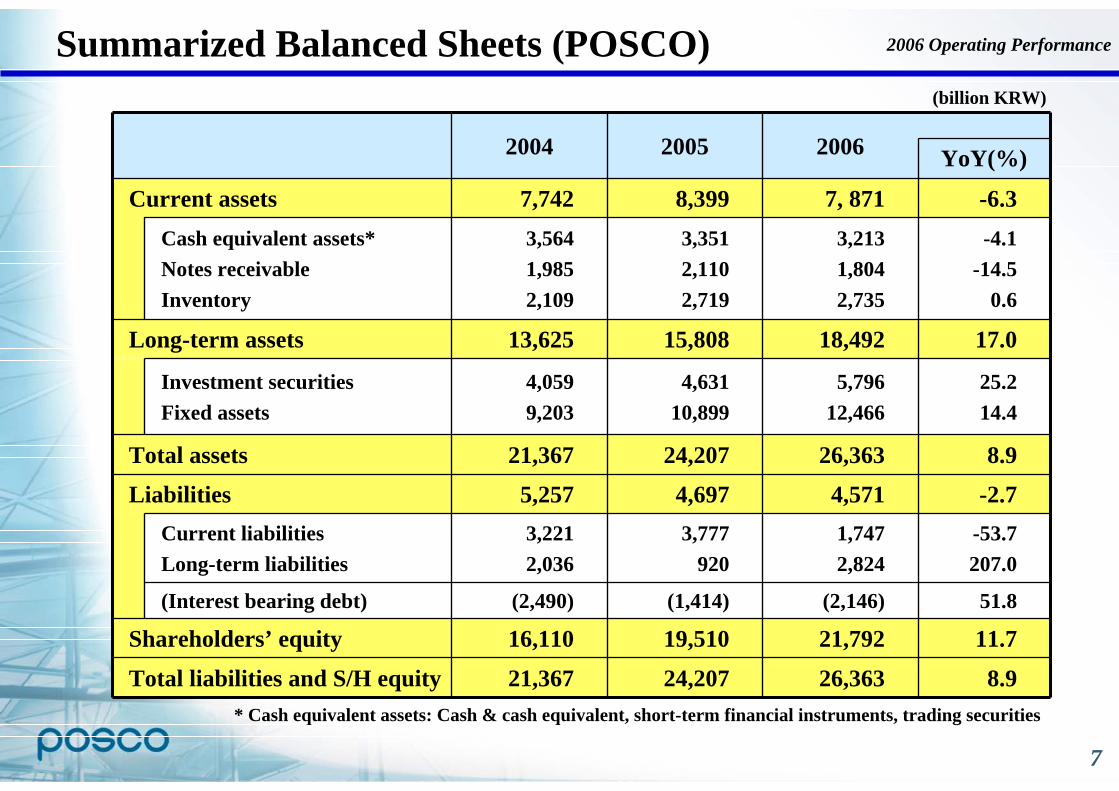
Summarized Balanced Sheets (POSCO)(billion KRW)
51.8(2,146)(1,414)(2,490)(Interest bearing debt)
8.926,36324,20721,367Total liabilities and S/H equity
11.721,79219,51016,110Shareholders’ equity
3,777920
3,2212,036
Current liabilitiesLong-term liabilities
-2.74,5714,6975,257Liabilities
8.926,36324,20721,367Total assets
Investment securitiesFixed assets
Cash equivalent assets*Notes receivableInventory
25.214.4
5,79612,466
4,63110,899
4,0599,203
YoY(%)
-53.7207.0
17.0
-4.1-14.5
0.6
-6.3
Long-term assets
1,7472,824
18,49215,80813,625
3,2131,8042,735
3,3512,1102,719
3,5641,9852,109
7, 8718,3997,742Current assets
2006 20052004
* Cash equivalent assets: Cash & cash equivalent, short-term financial instruments, trading securities
2006 Operating Performance
8
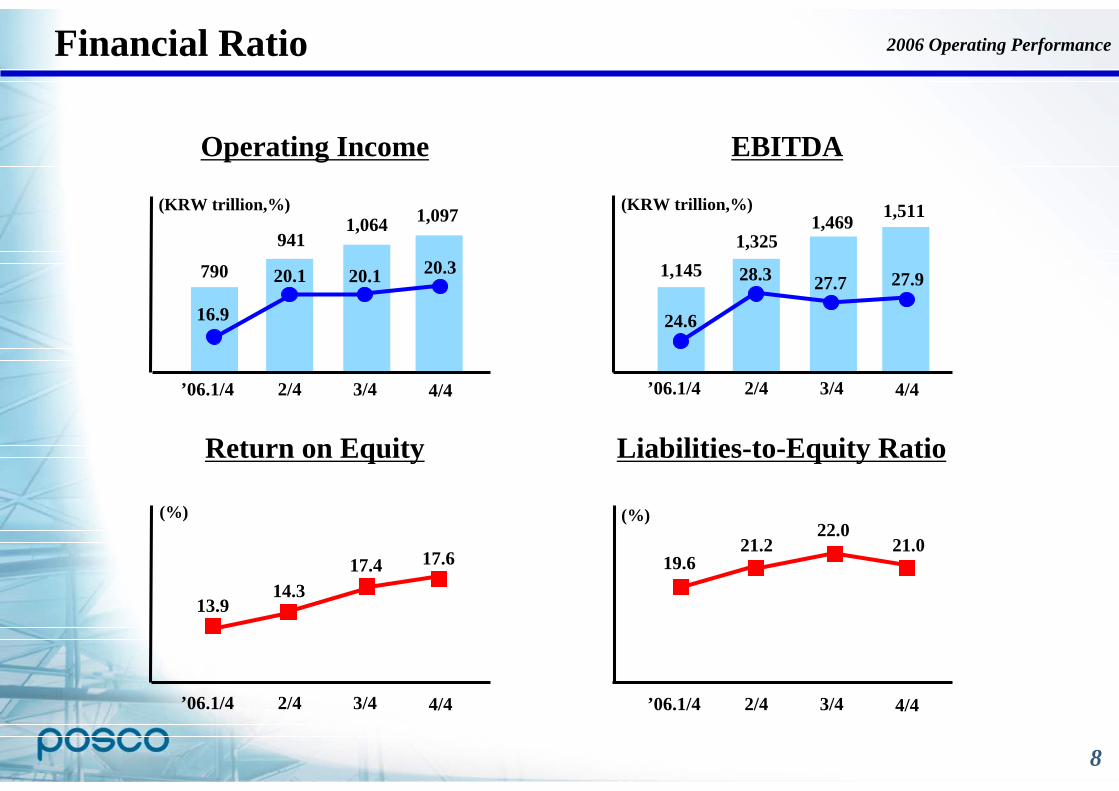
Financial Ratio
Operating Income EBITDA
Return on Equity Liabilities-to-Equity Ratio
2006 Operating Performance
1,1451,325
1,469 1,511
’06.1/4
16.9
20.1
(KRW trillion,%)
2/4 3/4
(%)
(KRW trillion,%)
(%)
20.1
4/4 ’06.1/4
24.6
28.3
2/4 3/4
27.7
4/4
’06.1/4
19.621.2
2/4 3/4
22.0
4/4’06.1/4
13.914.3
2/4 3/4
17.4
4/4
21.0
27.920.3
17.6
790
9411,064 1,097
9
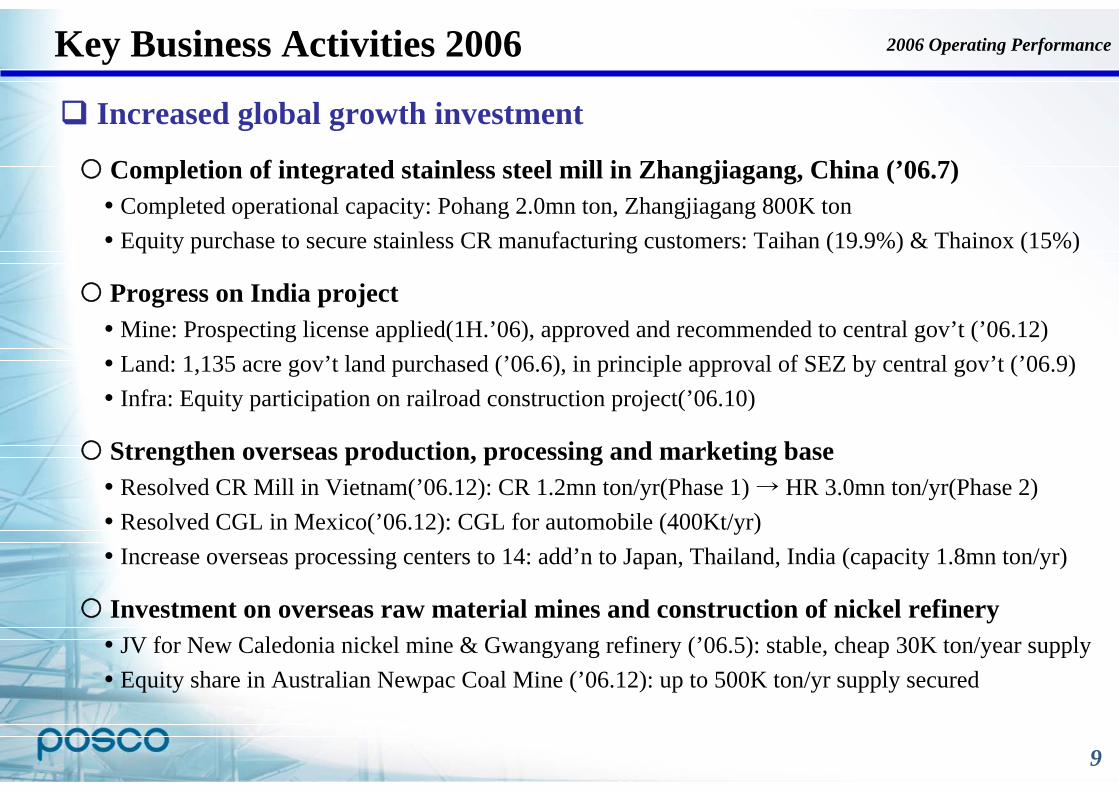
Increased global growth investment
Completion of integrated stainless steel mill in Zhangjiagang, China (’06.7)Completed operational capacity: Pohang 2.0mn ton, Zhangjiagang 800K tonEquity purchase to secure stainless CR manufacturing customers: Taihan (19.9%) & Thainox (15%)
Progress on India projectMine: Prospecting license applied(1H.’06), approved and recommended to central gov’t (’06.12)Land: 1,135 acre gov’t land purchased (’06.6), in principle approval of SEZ by central gov’t (’06.9)Infra: Equity participation on railroad construction project(’06.10)
Strengthen overseas production, processing and marketing baseResolved CR Mill in Vietnam(’06.12): CR 1.2mn ton/yr(Phase 1) → HR 3.0mn ton/yr(Phase 2)Resolved CGL in Mexico(’06.12): CGL for automobile (400Kt/yr)Increase overseas processing centers to 14: add’n to Japan, Thailand, India (capacity 1.8mn ton/yr)
Investment on overseas raw material mines and construction of nickel refineryJV for New Caledonia nickel mine & Gwangyang refinery (’06.5): stable, cheap 30K ton/year supplyEquity share in Australian Newpac Coal Mine (’06.12): up to 500K ton/yr supply secured
Key Business Activities 2006 2006 Operating Performance
10
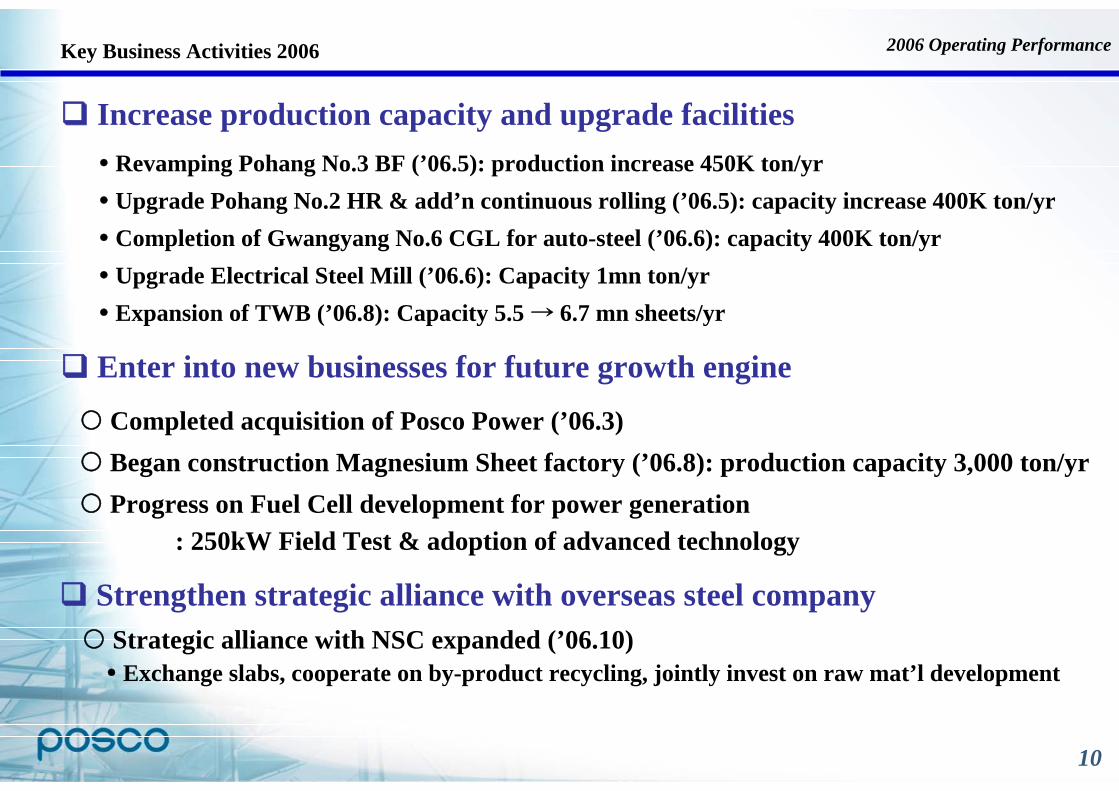
Revamping Pohang No.3 BF (’06.5): production increase 450K ton/yrUpgrade Pohang No.2 HR & add’n continuous rolling (’06.5): capacity increase 400K ton/yrCompletion of Gwangyang No.6 CGL for auto-steel (’06.6): capacity 400K ton/yrUpgrade Electrical Steel Mill (’06.6): Capacity 1mn ton/yrExpansion of TWB (’06.8): Capacity 5.5 → 6.7 mn sheets/yr
Increase production capacity and upgrade facilities
Completed acquisition of Posco Power (’06.3) Began construction Magnesium Sheet factory (’06.8): production capacity 3,000 ton/yrProgress on Fuel Cell development for power generation
: 250kW Field Test & adoption of advanced technology
Enter into new businesses for future growth engine
Key Business Activities 2006 2006 Operating Performance
Strengthen strategic alliance with overseas steel companyStrategic alliance with NSC expanded (’06.10)Exchange slabs, cooperate on by-product recycling, jointly invest on raw mat’l development
11
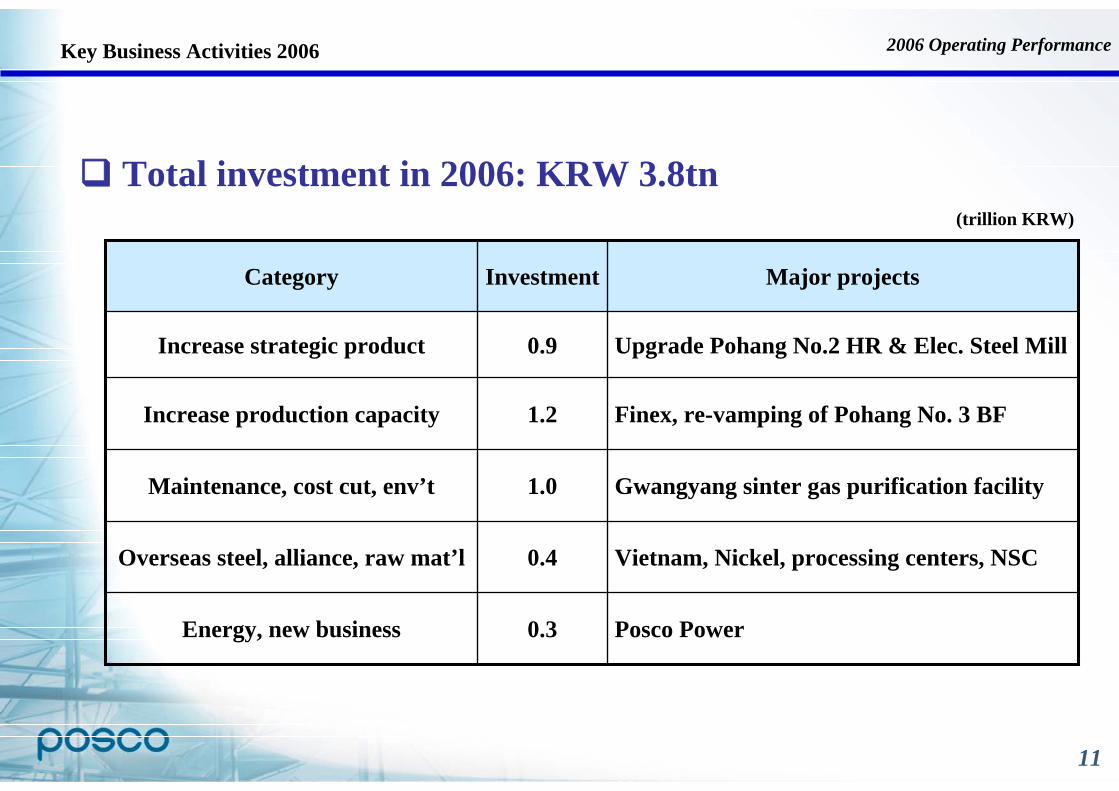
Posco Power0.3Energy, new business
Vietnam, Nickel, processing centers, NSC0.4Overseas steel, alliance, raw mat’l
Gwangyang sinter gas purification facility1.0Maintenance, cost cut, env’t
Finex, re-vamping of Pohang No. 3 BF1.2Increase production capacity
Upgrade Pohang No.2 HR & Elec. Steel Mill0.9Increase strategic product
Major projectsInvestmentCategory
Total investment in 2006: KRW 3.8tn(trillion KRW)
Key Business Activities 2006 2006 Operating Performance
12
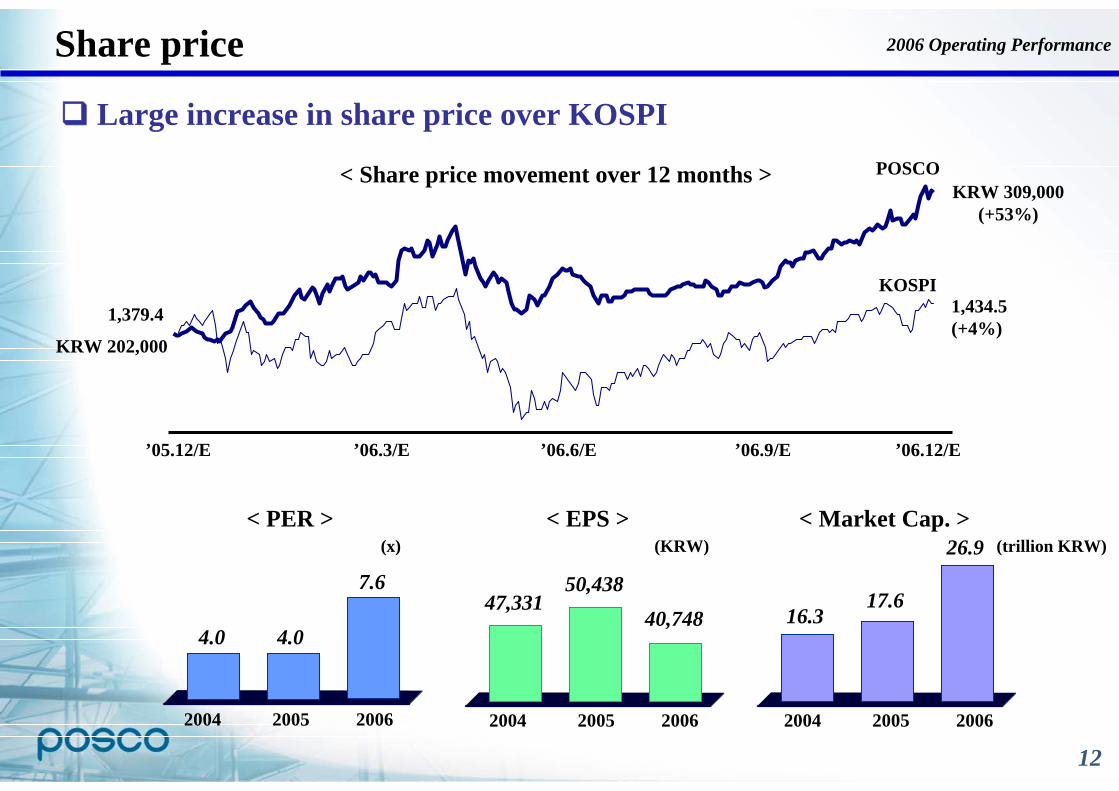
Share price
Large increase in share price over KOSPI
’05.12/E ’06.3/E ’06.6/E ’06.9/E ’06.12/E
KOSPI
POSCO
KRW 202,000
1,379.4
KRW 309,000(+53%)
1,434.5(+4%)
< Share price movement over 12 months >
2004 2005 2006 2004 2005 2006
< PER >
2004 2005 2006
< EPS > < Market Cap. >
4.04.0
7.6 50,43847,331
40,74817.6
16.3
26.9(x) (KRW) (trillion KRW)
2006 Operating Performance
13
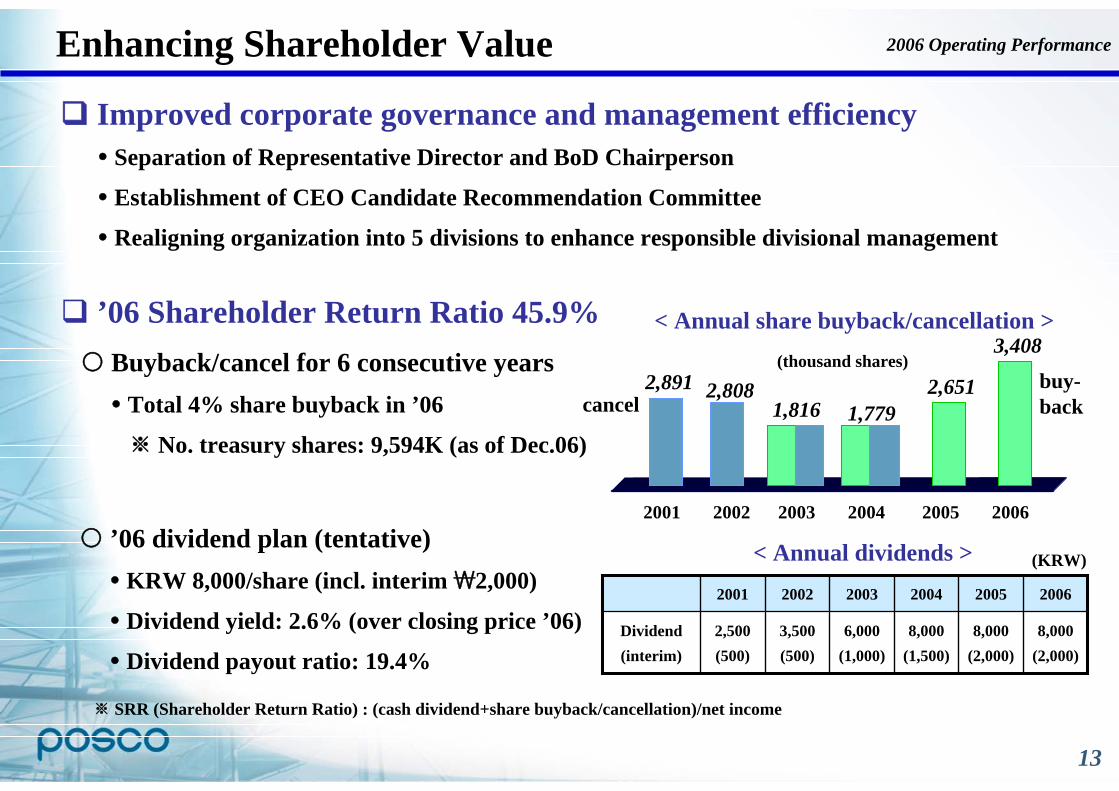
Enhancing Shareholder Value
Buyback/cancel for 6 consecutive yearsTotal 4% share buyback in ’06
※ No. treasury shares: 9,594K (as of Dec.06)
’06 dividend plan (tentative)KRW 8,000/share (incl. interim₩2,000)
Dividend yield: 2.6% (over closing price ’06)
Dividend payout ratio: 19.4% 8,000
(2,000)8,000
(2,000)8,000
(1,500)6,000
(1,000)3,500(500)
2,500(500)
Dividend(interim)
20042003 2006200520022001
< Annual dividends > (KRW)
(thousand shares)
< Annual share buyback/cancellation >
2001 2002 2003 2004 2005 2006
2,891 2,8081,816 1,779
2,651
3,408
cancel buy-back
’06 Shareholder Return Ratio 45.9%
※ SRR (Shareholder Return Ratio) : (cash dividend+share buyback/cancellation)/net income
Improved corporate governance and management efficiencySeparation of Representative Director and BoD Chairperson
Establishment of CEO Candidate Recommendation Committee
Realigning organization into 5 divisions to enhance responsible divisional management
2006 Operating Performance
14
Agenda
2
1 2006 Operating Performance
2007 Business Plan
15
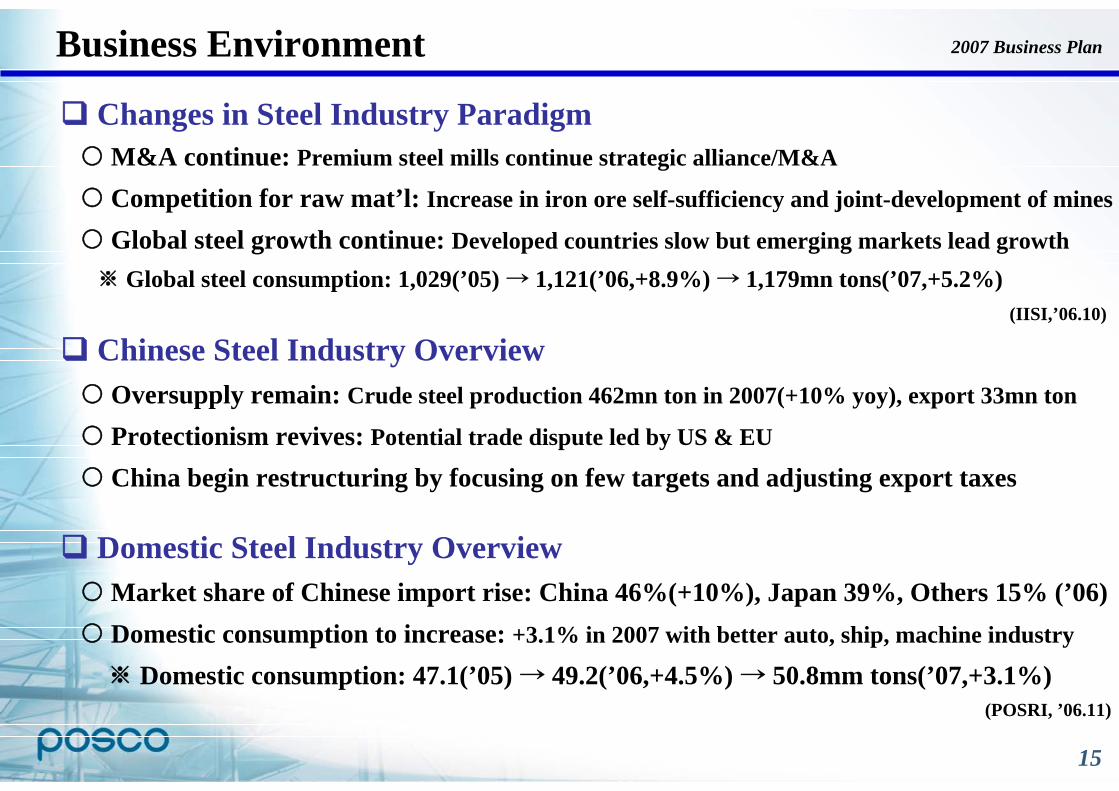
Business Environment 2007 Business Plan
Changes in Steel Industry ParadigmM&A continue: Premium steel mills continue strategic alliance/M&A
Competition for raw mat’l: Increase in iron ore self-sufficiency and joint-development of mines
Global steel growth continue: Developed countries slow but emerging markets lead growth※Global steel consumption: 1,029(’05) → 1,121(’06,+8.9%) → 1,179mn tons(’07,+5.2%)
Chinese Steel Industry OverviewOversupply remain: Crude steel production 462mn ton in 2007(+10% yoy), export 33mn ton
Protectionism revives: Potential trade dispute led by US & EU
China begin restructuring by focusing on few targets and adjusting export taxes
Domestic Steel Industry OverviewMarket share of Chinese import rise: China 46%(+10%), Japan 39%, Others 15% (’06)Domestic consumption to increase: +3.1% in 2007 with better auto, ship, machine industry
※ Domestic consumption: 47.1(’05) → 49.2(’06,+4.5%) → 50.8mm tons(’07,+3.1%)
(IISI,’06.10)
(POSRI, ’06.11)
16
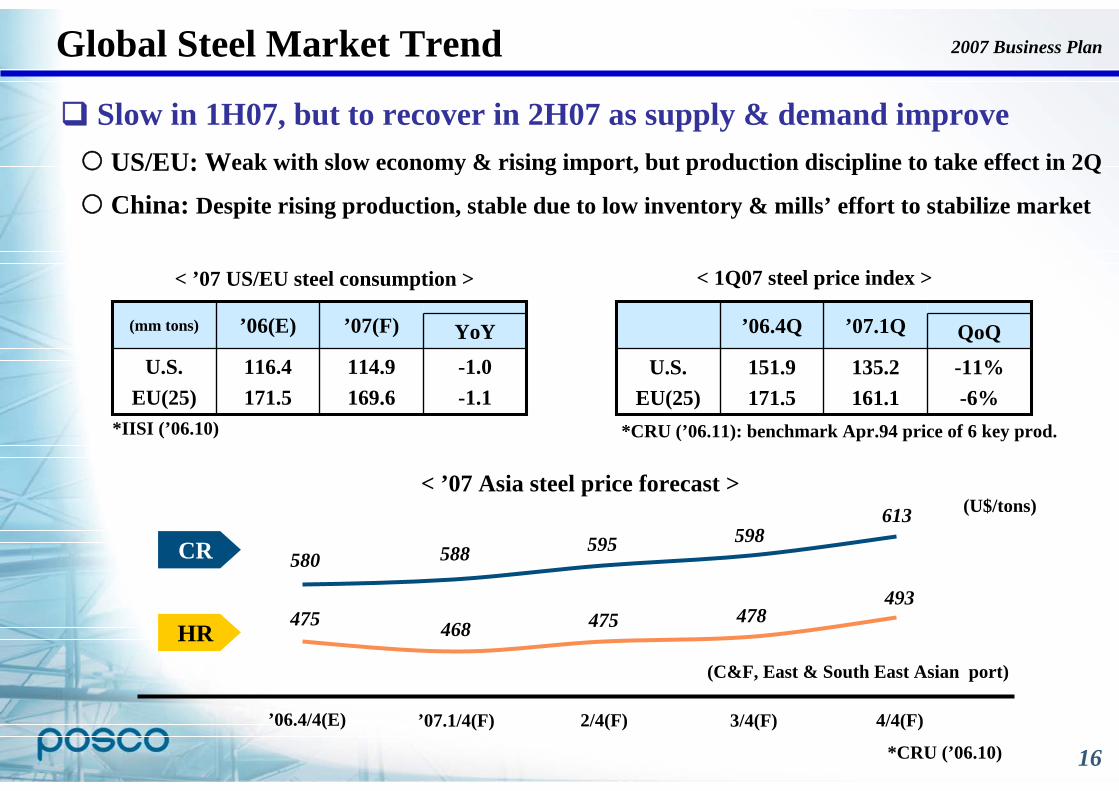
Global Steel Market Trend
Slow in 1H07, but to recover in 2H07 as supply & demand improveUS/EU: Weak with slow economy & rising import, but production discipline to take effect in 2Q
China: Despite rising production, stable due to low inventory & mills’ effort to stabilize market
YoY
114.9169.6
’07(F)
-1.0-1.1
116.4171.5
U.S.EU(25)
’06(E)(mm tons)
< ’07 US/EU steel consumption >
*IISI (’06.10)
QoQ
135.2161.1
’07.1Q
-11%-6%
151.9171.5
U.S.EU(25)
’06.4Q
< 1Q07 steel price index >
*CRU (’06.11): benchmark Apr.94 price of 6 key prod.
*CRU (’06.10)
< ’07 Asia steel price forecast >
475 468 475 478493
580 588 595 598613
CR
HR(C&F, East & South East Asian port)
’06.4/4(E) ’07.1/4(F) 2/4(F) 3/4(F) 4/4(F)
(U$/tons)
2007 Business Plan
17
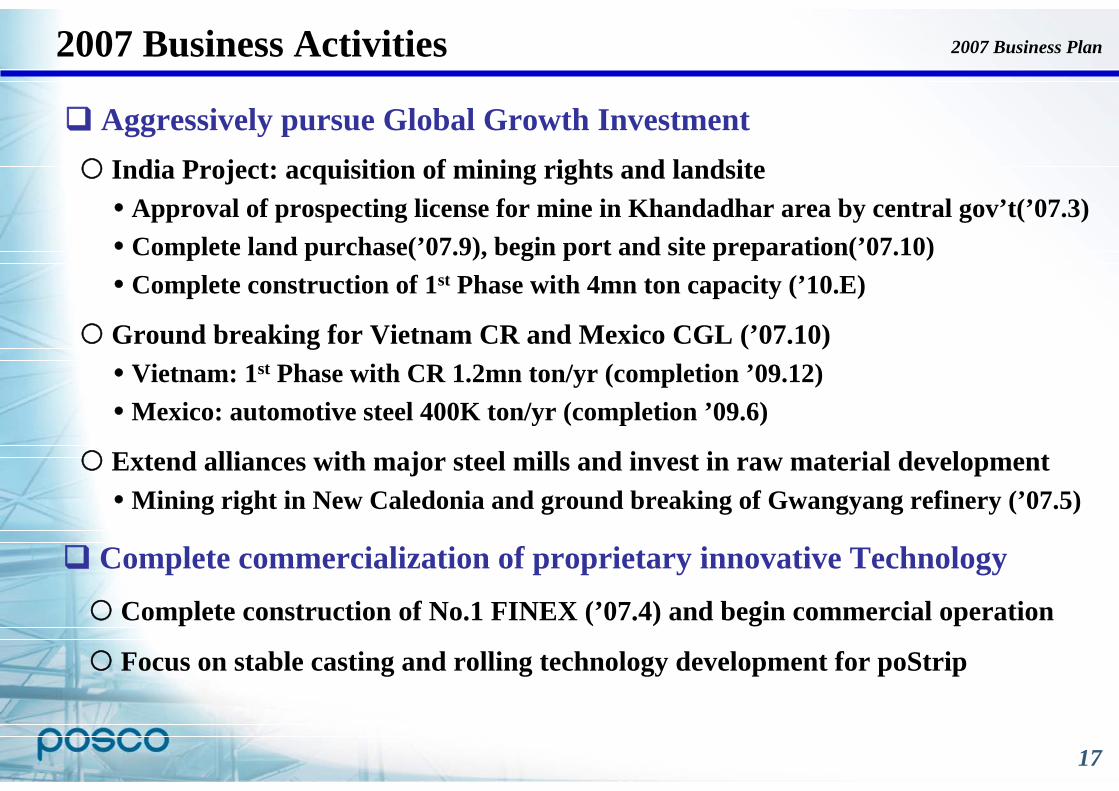
Aggressively pursue Global Growth InvestmentIndia Project: acquisition of mining rights and landsite
Approval of prospecting license for mine in Khandadhar area by central gov’t(’07.3) Complete land purchase(’07.9), begin port and site preparation(’07.10) Complete construction of 1st Phase with 4mn ton capacity (’10.E)
Ground breaking for Vietnam CR and Mexico CGL (’07.10)Vietnam: 1st Phase with CR 1.2mn ton/yr (completion ’09.12)Mexico: automotive steel 400K ton/yr (completion ’09.6)
Extend alliances with major steel mills and invest in raw material developmentMining right in New Caledonia and ground breaking of Gwangyang refinery (’07.5)
Complete commercialization of proprietary innovative Technology Complete construction of No.1 FINEX (’07.4) and begin commercial operation
Focus on stable casting and rolling technology development for poStrip
2007 Business Activities 2007 Business Plan
18
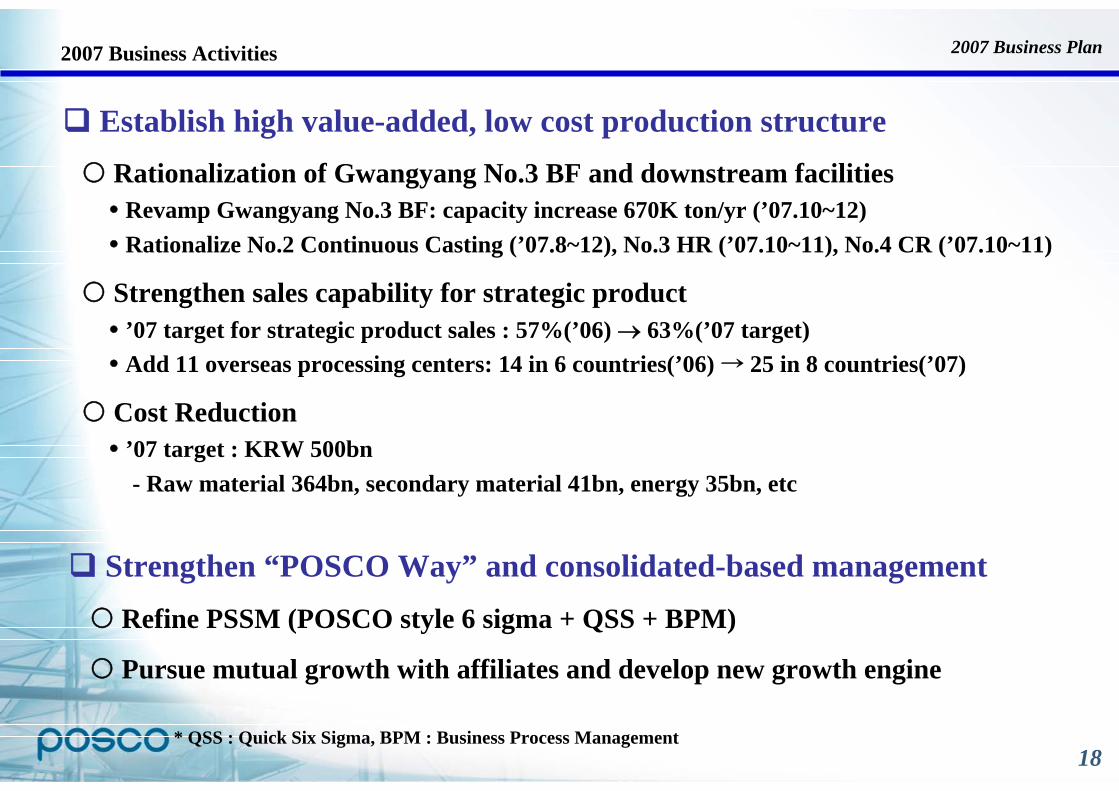
Establish high value-added, low cost production structureRationalization of Gwangyang No.3 BF and downstream facilitiesRevamp Gwangyang No.3 BF: capacity increase 670K ton/yr (’07.10~12)Rationalize No.2 Continuous Casting (’07.8~12), No.3 HR (’07.10~11), No.4 CR (’07.10~11)
Strengthen sales capability for strategic product’07 target for strategic product sales : 57%(’06) → 63%(’07 target) Add 11 overseas processing centers: 14 in 6 countries(’06) → 25 in 8 countries(’07)
Cost Reduction ’07 target : KRW 500bn- Raw material 364bn, secondary material 41bn, energy 35bn, etc
2007 Business Activities
Strengthen “POSCO Way” and consolidated-based managementRefine PSSM (POSCO style 6 sigma + QSS + BPM)
Pursue mutual growth with affiliates and develop new growth engine
* QSS : Quick Six Sigma, BPM : Business Process Management
2007 Business Plan
19
(KRW trillion)
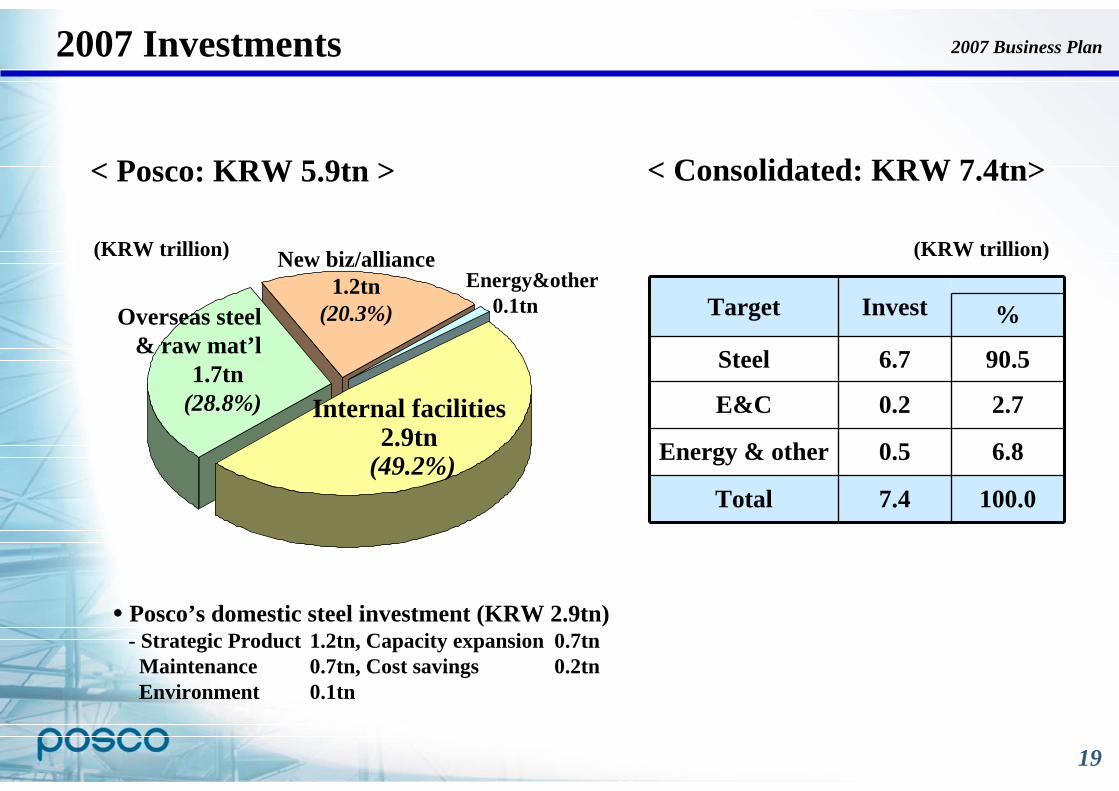
Posco’s domestic steel investment (KRW 2.9tn)- Strategic Product 1.2tn, Capacity expansion 0.7tnMaintenance 0.7tn, Cost savings 0.2tnEnvironment 0.1tn
Internal facilities2.9tn
(49.2%)
Energy&other0.1tnOverseas steel
& raw mat’l1.7tn
(28.8%)
< Consolidated: KRW 7.4tn>
%
100.07.4Total
2.70.2E&C
6.80.5Energy & other
90.56.7Steel
InvestTarget
New biz/alliance1.2tn
(20.3%)
< Posco: KRW 5.9tn >
2007 Investments 2007 Business Plan
(KRW trillion)
20
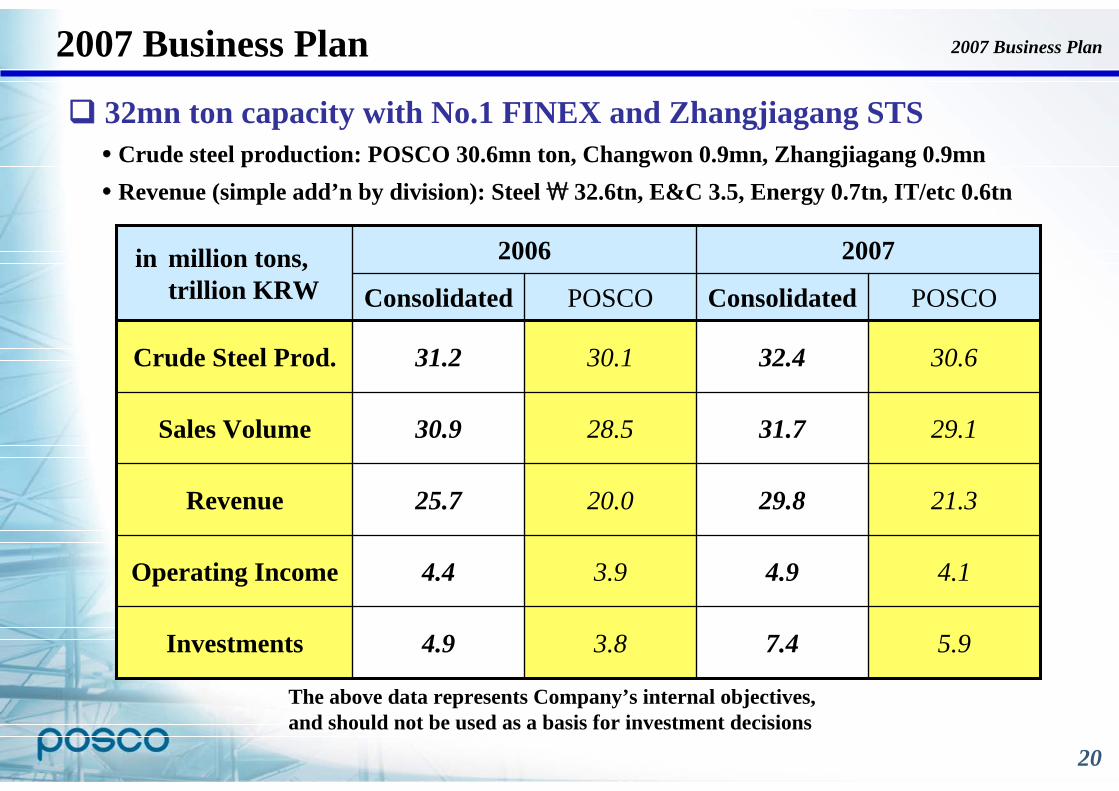
The above data represents Company’s internal objectives,and should not be used as a basis for investment decisions
2007 Business Plan
POSCOConsolidatedPOSCOConsolidated
5.9
4.1
21.3
29.1
30.6
3.8
3.9
20.0
28.5
30.1
Operating Income 4.94.4
7.44.9Investments
29.825.7Revenue
31.7
32.4
2007
Sales Volume
Crude Steel Prod.
30.9
31.2
2006in million tons,trillion KRW
32mn ton capacity with No.1 FINEX and Zhangjiagang STS Crude steel production: POSCO 30.6mn ton, Changwon 0.9mn, Zhangjiagang 0.9mnRevenue (simple add’n by division): Steel₩ 32.6tn, E&C 3.5, Energy 0.7tn, IT/etc 0.6tn
2007 Business Plan

2007CEO FORUM
2007.1.11