central visayas region physical framework plan 47 · central visayas region physical framework plan...
TRANSCRIPT

47 Central Visayas Region Physical Framework Plan
Infrastructure forms the backbone of the
economy and society. They are the basic facilities, equipment and installations that produce the utility products and services crucial for economic and social development. Infrastructure also provides the physical connection among the production and settlement areas.
The infrastructure sector covers the following subsectors: transportation, energy, communications, water supply / irrigation, and social infrastructure.
Transportation
Transportation impacts every economic
and social activity. The transportation subsector provides the physical link among people, products and services. The principal modes of transportation in Central Visayas are roads, water and air.
Roads
Due to its island configuration, the region's
road network almost invariably follows the pattern of the coastline, which is circumferential with cross-country roads that usually end up at a seaport. (see Map 21)
Between 1990 and 2000, the road network in Central Visayas increased by 4,955.9 km., bringing to 15,587 km. the total road length. Almost 90 percent of the total road length is classified as local roads, i.e., constructed and/or maintained by the local government units.
Although Oriental Negros has the biggest land area (5,402.3 sq. km.) it ranked third only among the region's four provinces in terms of total road length in 2000. Cebu had the longest road network covering 5,461.32 kms.
Almost half of the region�s national road is accounted by Cebu. This indicates that a sizable chunk of the national government's investments on road in Central Visayas over the years went to Cebu. However, during the ten-year period, Oriental Negros showed the biggest increase in road length among the four provinces as more and more local roads were opened up in the province by the local government with very little assistance from the national government.
In general, the road network in the region is adequate. On account of the 4,955.9 km. increase in road length, the road density improved from 0.71 km. of road per sq. km. of land area in 1990 to 1.04 in 2000. These road densities were much better than the national figures of 0.54 and 0.67 during the same years. Among the provinces, Bohol boasts of the highest road density of 1.32 while Oriental Negros has the lowest at 0.79.
The quality of roads in the region, however, remains poor. The paved road ratio in 2000 was only 0.19. This is slightly lower than the national figure of 0.21. This indicates that most of the roads in the region need upgrading or improvement. Among the provinces, Siquijor has the highest paved road ratio of 0.36 while Bohol has the lowest at 0.14. (see Map 22)
Urban Roads. Throughout the 1990s, Metro Cebu had its road network improved and upgraded through the Metro Cebu Development Project (MCDP), a foreign assisted project funded by the then Overseas Economic Cooperation Fund (OECF). The main objective of MCDP was to assist local governments in Metro Cebu cope with rapid urban population growth and the increased demand for travel on the arterial roadway system.
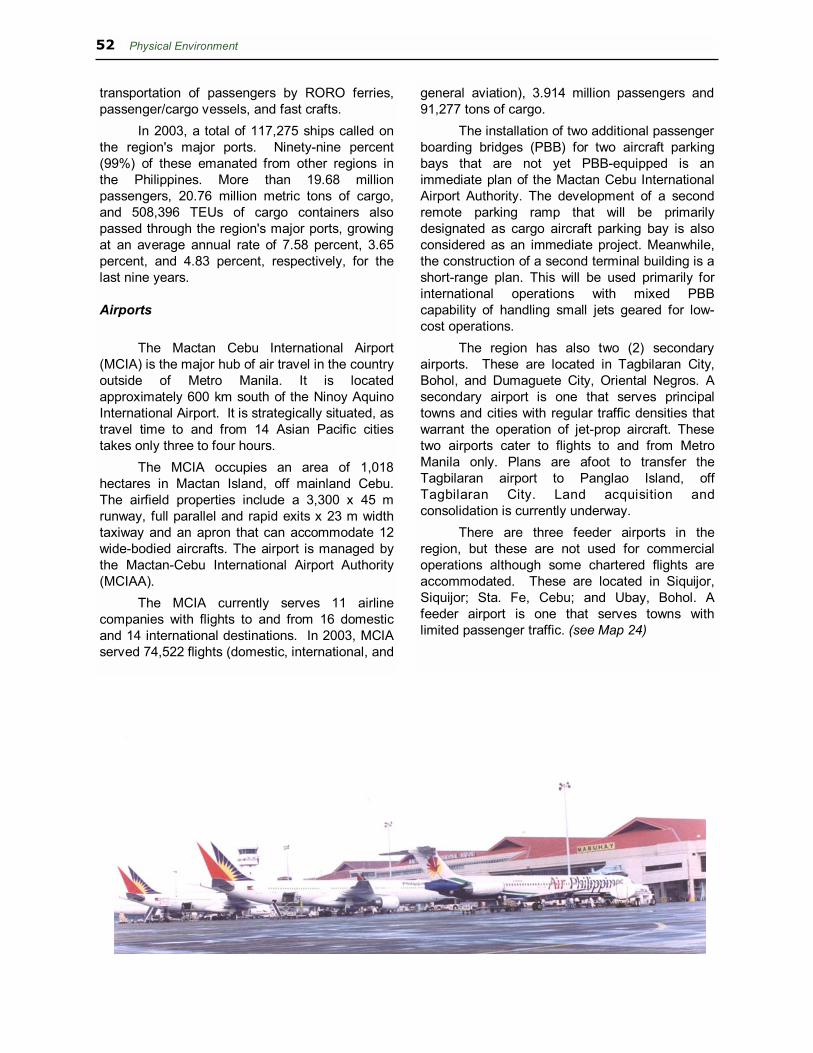
A total of 71.35 kms of arterial roads were constructed/improved in Cebu City, Mandaue City and Mactan Island under MCDP. All primary arterial roads were expanded to four to six lanes
The Cebu South Coastal Road project located in Cebu City is one of the components of MCDP III. (MCDP III PMO)
INFRASTRUCTURE AND UTILITIES

Physical Environment 48
Map 21. Major Road Network

49 Central Visayas Region Physical Framework Plan
Map 22. Paved and Unpaved National Roads

Physical Environment 50
complete with curb, gutter and sidewalks. New road openings were paved with asphalt concrete while old alignments were paved with Portland cement concrete. Traffic signals were also procured and installed in 15 intersections in the cities of Cebu, Mandaue and Lapu-Lapu.
Ongoing road projects in Metro Cebu aim to upgrade the road link leading into and out of Metro Cebu.
Ports
Being a region composed of island
provinces, sea transport is one of the primary modes of transportation in the region. It is the cheapest means of reaching other provinces in and outside the region. As of 2002, there were about 139 ports in the region, both public and private. More than one fourth of the country's ports are thus located in Region VII.
The ports in the region operate under two port systems. Ports located in Bohol, Oriental Negros and Siquijor are under the Philippine Ports Authority (PPA) port system. Ports in Cebu are under the jurisdiction of the Cebu Port Authority (CPA) which was created in 1991 through Republic Act No. 7621.
There are two Port Management Offices (PMO) under the PPA Port System: PMO Tagbilaran and PMO Dumaguete.
PMO Tagbilaran's base port is the Port of Tagbilaran in Bohol. This port has a total berth
length of 265.80 meters and an operational area of 29,252 sq.m. PMO Tagbilaran has four terminal (or secondary) ports, namely: Port of Jagna, Port of Ubay, Port of Talibon and Port of Tubigon. All these ports have RORO facilities. All in all, PMO Tagbilaran has 17 government and private ports under its jurisdiction.
PMO Dumaguete's base port is the Port of Dumaguete in Oriental Negros. This port has a total berth length of 579 meters and an operational area of 26,409 sq.m. PMO Dumaguete has three (3) Terminal Management Offices (TMO) located in the Port of Larena, Siquijor; Port of Tandayag (Amlan), Oriental Negros; and Port of Guihulngan, Oriental Negros. All these ports have RORO facilities. All in all, there are 23 government and private ports under the jurisdiction of PMO Dumaguete.
The Cebu Base port, which occupies an area of 40 hectares in Cebu City's waterfront, is the largest port in Cebu province and the second largest in the country, next to the Port of Manila. It includes the Cebu International Port. The Cebu Base port handles about 87 percent of the total Cebu passenger traffic.
Under the Cebu Base port are five Management Offices, namely: Danao Management Office, Sta. Fe Management Office, Toledo Management Office, Argao Management Office and Mandaue Management Office. These five Management Offices have jurisdiction over 16 major ports throughout the province. Overall, Cebu has 44 government ports and 55 private ports. (see Map 23)
The 2002 Study on the Cebu Integrated Port Development Plan funded by the Japan International Cooperation Agency (JICA) enumerated the following conditions that limit the capacity and efficiency of the Cebu Base port: 1) limitation of maximum draft; 2) lack of space for land area expansion; 3) limitation of waterfront expansion; 4) limitation of offshore expansion; 5) deterioration of facilities; 6) low productivity of cargo handling; and 7) lack of passenger facilities.
The Study pointed out the need to establish another port outside of the Cebu Base Port. This new port would serve as international container terminal and foreign cargo terminal and would also handle feeder domestic container vessels. The existing Cebu Base port in Cebu City would then be primarily used for the
0
5
10
15
2 0
2 5
'9 4 '9 5 ' 9 6 '9 7 ' 9 8 '9 9 ' 0 0 ' 0 1 '0 2 ' 0 3
P assenger T raff ic C argo T raf fic
Figure 2. Passenger and Cargo Traffic in Major Ports in Central Visayas, 1994-2003
Source: PPA and CPA

51 Central Visayas Region Physical Framework Plan
Map 23. Major Seaports
Physical Environment 52
transportation of passengers by RORO ferries, passenger/cargo vessels, and fast crafts.
In 2003, a total of 117,275 ships called on the region's major ports. Ninety-nine percent (99%) of these emanated from other regions in the Philippines. More than 19.68 million passengers, 20.76 million metric tons of cargo, and 508,396 TEUs of cargo containers also passed through the region's major ports, growing at an average annual rate of 7.58 percent, 3.65 percent, and 4.83 percent, respectively, for the last nine years.
Airports
The Mactan Cebu International Airport
(MCIA) is the major hub of air travel in the country outside of Metro Manila. It is located approximately 600 km south of the Ninoy Aquino International Airport. It is strategically situated, as travel time to and from 14 Asian Pacific cities takes only three to four hours.
The MCIA occupies an area of 1,018 hectares in Mactan Island, off mainland Cebu. The airfield properties include a 3,300 x 45 m runway, full parallel and rapid exits x 23 m width taxiway and an apron that can accommodate 12 wide-bodied aircrafts. The airport is managed by the Mactan-Cebu International Airport Authority (MCIAA).
The MCIA currently serves 11 airline companies with flights to and from 16 domestic and 14 international destinations. In 2003, MCIA served 74,522 flights (domestic, international, and
general aviation), 3.914 million passengers and 91,277 tons of cargo.
The installation of two additional passenger boarding bridges (PBB) for two aircraft parking bays that are not yet PBB-equipped is an immediate plan of the Mactan Cebu International Airport Authority. The development of a second remote parking ramp that will be primarily designated as cargo aircraft parking bay is also considered as an immediate project. Meanwhile, the construction of a second terminal building is a short-range plan. This will be used primarily for international operations with mixed PBB capability of handling small jets geared for low-cost operations.
The region has also two (2) secondary airports. These are located in Tagbilaran City, Bohol, and Dumaguete City, Oriental Negros. A secondary airport is one that serves principal towns and cities with regular traffic densities that warrant the operation of jet-prop aircraft. These two airports cater to flights to and from Metro Manila only. Plans are afoot to transfer the Tagbilaran airport to Panglao Island, off Tagbilaran City. Land acquisition and consolidation is currently underway.
There are three feeder airports in the region, but these are not used for commercial operations although some chartered flights are accommodated. These are located in Siquijor, Siquijor; Sta. Fe, Cebu; and Ubay, Bohol. A feeder airport is one that serves towns with limited passenger traffic. (see Map 24)

53 Central Visayas Region Physical Framework Plan
Map 24. Airports

Physical Environment 54
Energy The energy sector covers energy resource
development, installation of power generating facilities, and electrification.
Power Generation and Transmission
The power industry is divided into three
major sectors: generation, transmission, and distribution. Under the present set-up, the National Power Corporation (NPC) generates its own electricity and buys electricity from independent power producers (IPPs).
Generation was a monopoly of NPC until the issuance of Executive Order No. 215, �Amending Presidential Decree No. 40 and Allowing Private Sector Participation to Generate Electricity.� The private sector was invited to invest in power generation to accelerate capacity expansion. This policy reform was instituted to address the crippling power crisis that hit the country in the early 1990's.
Central Visayas is host to 16 power plants with aggregate installed capacity of 632.15 MW. Figure 3 shows the break down of the region�s energy sources: 323.35 MW oil-based (51.2%), 192.5 MW geothermal (30.4%), 109.3 MW coal (17.3%), and 7 MW hydropower (1.1%). There are four IPPs in Central Visayas that generate and sell electricity to NPC and other customers, bringing stability in power supply to the region. These IPPs are Toledo Power Corporation, East Asia Utilities Corporation, Cebu Private Power Corporation, all located in Cebu, and the Janopol Hydroelectric Power Plant in Bohol. The combined installed capacity of the generating
facilities of these four IPPs is 155.35 MW. The three NPC power plants in Naga, Cebu are now managed by IPP Salcon Power Corporation. These power plants have a combined installed capacity of 125 MW. (see Map 25) Meanwhile, the small island grids in the region have a combined installed capacity of 27.22 MW.
Power distribution in the region is done through 138 kV overhead lines, except in Bohol where the transmission network is 69 kV. Electricity distribution is carried out by ten electric cooperatives and three private investor-owned utilities.
The Department of Energy (DOE) projects a 6.9 percent annual growth in demand for electricity in the region from 2005 to 2014. In order to meet the expected increase in demand, 425 MW of additional power will be added. In the small island grids, the demand for electricity is forecasted to grow at an average annual rate of 14 percent. Additional capacity of some 28 MW is expected to be installed by 2014 to meet the demand.
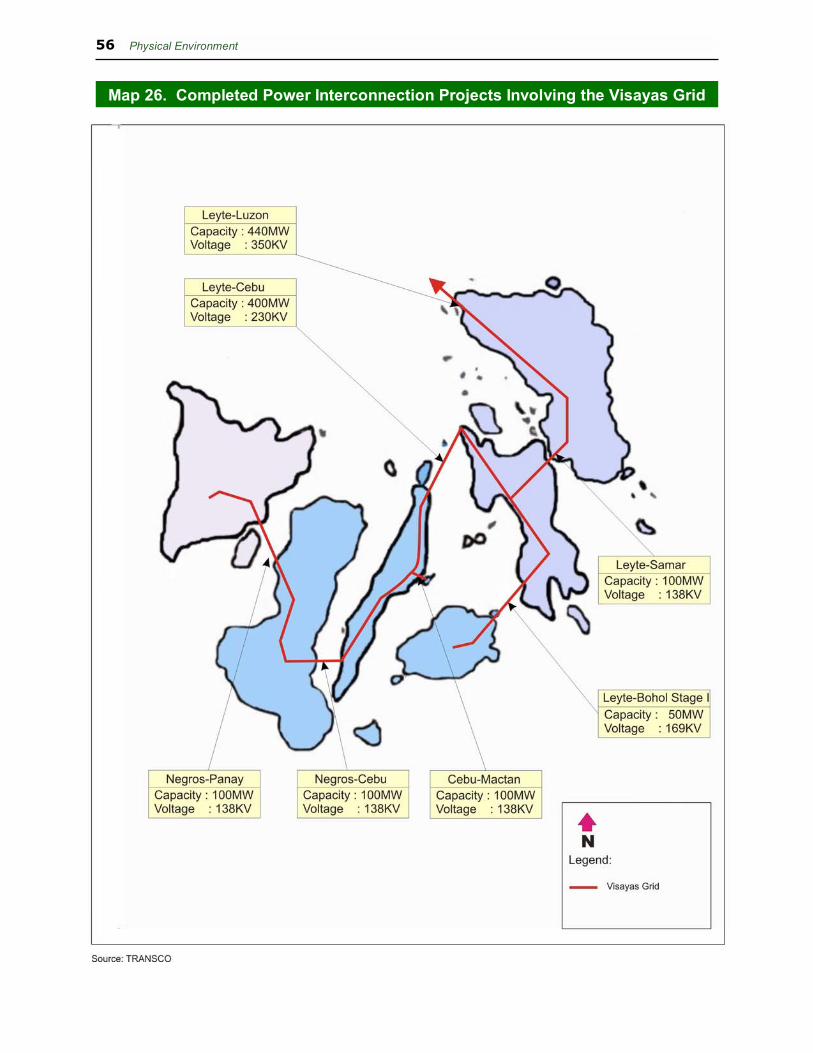
Unlike the Luzon and Mindanao grids, the Visayas grid is formed by interconnecting the island grids of Cebu, Negros, Panay, Leyte, Samar and Bohol. During the 1990-2005 period, transmission development focused on attaining a unified grid for the Visayas through interconnection via 230 kV and 138 kV submarine cables that serve as backbone transmission system for the region. The interconnection projects carried out during the period were the Leyte-Cebu Interconnection Project, Leyte-Samar Reinforcement Project, Leyte-Bohol Interconnection Project Stage 1, Negros-Cebu Interconnection Project, Negros-Panay Interconnection Project, Leyte-Cebu Uprating Project and the Cebu-Mactan Interconnection Project. (see Map 26)
Electrification
Cognizant of the need to accelerate the
development of the rural areas, the energization of barangays was given priority in recent years. This was carried out by electric cooperatives and privately owned utilities.
As of August 2004, 97 percent or 2,918 out of the 3,003 barangays throughout Central Visayas have been energized. This accomplishment was better than the national
Source: NPC
30%
1%
52%
17% Geothermal
Oil-based
Coal Hydropower
Figure 3. Energy Sources in Central Visayas, 2003

55 Central Visayas Region Physical Framework Plan
Map 25. Power Plants and Substations
Physical Environment 56
Map 26. Completed Power Interconnection Projects Involving the Visayas Grid

57 Central Visayas Region Physical Framework Plan
energization level of 91.4 percent during the same period. The remaining 85 unenergized barangays are scheduled for energization in the remaining months of 2004 and during the 2005-2006 period under the Expanded Rural Electrification Program, thus, attaining 100 percent barangay energization level by 2006. Communications
Effective and efficient communications
integrates settlements and production areas, no matter how physically far apart they may be. Communications can transcend geographical boundaries and provide limitless economic and social opportunities to everyone.
The communications sector includes the subsectors of telecommunications and postal services.
Telecommunications
Government's policy aimed at market
reform ushered in a significant improvement in the telecommunications industry during the 1990's. As a result of liberalization, more players gained access to the telecommunications industry especially in the area of local exchange carrier service, which is fundamental to the government's goal of universal access to basic telecommunications service.
The region's telecommunications industry is comprised of 28 providers offering the following services: basic telephone or local exchange carrier, cellular mobile telephone, domestic and international record carrier, Very Small Apperture Terminal, paging, satellite, public trunk repeater, and international gateway facility.
As of end of 1995, there were only 86,704 telephone lines in Central Visayas. The region's telephone density of 1.73 land lines per 100 population was much lower than the country's density of 2.01 during the same year.
By 2000, there were already 529,576 telephone lines throughout the region. This lifted the telephone density to 9.28, overtaking the country's 9.05 during the same year. (see Fig. 4)
The upsurge in the number of installed telephone lines was an offshoot of two critical Executive Orders signed by President Fidel V. Ramos in 1993. Executive Order No. 59 mandated the compulsory interconnection of
authorized public telecommunications carriers to effect a universally accessible nationwide telecommunications network. Executive Order No. 109 for its part compelled operators of the lucrative cellular mobile telephone system (CMTS) and international gateway facility (IGF) services to cross subsidize and carry out a local exchange carrier service program in service areas assigned to them. Specifically, CMTS and IGF operators were required to install 400,000 and 300,000 telephone lines, respectively, in the areas assigned to them. Central Visayas Region, along with Eastern Visayas and Western Visayas, was assigned to Islacom (now Innove).
Towards the latter part of the 1990's, the use of cellular mobile telephone service became very popular throughout the regions. This phenomenon could be attributed to the short messaging service feature of CMTS. The use of CMTS also compensated for the absence of land lines in certain areas of the region.
Meanwhile, areas still unserved and underserved by telephone service rely on the services being provided by the government's Telecommunications Office (Telof). Telof operates wired telegraph or radio stations that provide telegram service, among others.
While the installed telephone density in the region increased considerably, the actual use of basic telephone serv ice remains poor, as there is a broad gap between the installed telephone density and the subscribed telephone density. A more important indicator of greater basic telephone penetration is the subscribed
Data Source: Telof 7
0
50100150
200250300350
400450500
550
Region 7 Bohol Cebu Neg. Or. Siquijor
1995 2000
Figure 4. Telephone lines by province, 1995-2000

Physical Environment 58
telephone density. In 2000, the subscribed telephone density in the region was placed at less than half of the installed telephone density. Increasing the subscribed telephone density, which requires making the service more affordable, should be a more important area for attention in the immediate future than merely expanding the number of telephone lines.
Another aspect of local exchange carrier service that needs to be addressed is the wide disparity among provinces in terms of access to basic telephone service. Among the provinces, Cebu accounted for a hefty 85 percent of total telephone lines in the region in 2000. This explains why Cebu has also the highest telephone density among the region's provinces, placed at 13.44 in 2000. Cebu's telephone density was also higher than the region's 9.28 and the country's 9.05 during the same year. In contrast, Bohol, Oriental Negros and Siquijor had telephone densities of only 2.75, 3.75 and 6.00, respectively.
Moreover, despite the rapid expansion in the coverage of basic telephone service, some municipalities in the region still do not have access to basic telephone service. These are Balilihan, Catigbian, and Sevilla in Bohol; Tudela in Cebu; Basay and Mabinay in Oriental Negros; and E. Villanueva and Maria in Siquijor.
Postal Communications
The region's postal network is composed of
136 regular post offices, 16 extension post offices, 20 barangay post offices and 26 postal stations. Cebu accounts for almost half of the
post offices and postal stations in the region. In recent years, the government-owned
Philippine Postal Corporation (PPC) has focused its activities on two areas: improving access of far-flung barangays to postal services, and enhancing service delivery. While no additional post office was opened during the last few years, barangay post offices were established in remote barangays that have sufficient demand for postal service. Barangay officials manage the barangay post offices. To further serve outlying areas, PPC maintains the services of mail contractors. In 2004 there were 13 mail contractors throughout the region.
Despite the intensified efforts to promote the various postal products and improve postal delivery, transactions at the post offices have slowed as a result of the stiff competition provided by electronic mail and private mail couriers. Private mail couriers are widely perceived by the public to be more efficient, reliable, fast and safe compared to the public post offices. The volumes of domestic and international mails posted and delivered have also been decreasing during the last five years.
Water
The infrastructure aspect of water resource
development includes facilities for water supply and irrigation.
Water Supply
In general, the number of the regional
population served with safe drinking water
Table 8. Water Supply Service Coverage by Province, 2003
Area Total Population
Population Served by Safe Sources
Population Underserved/Unserved
No. % to Total Population No.
% to Total Population
Bohol 1,239,829 732,219 59.0 507,610 41.0
Cebu * 2,921,305 1,225,933 42.0 1,695,372 58.0
Oriental Negros 1,200,315 691,757 58.0 508,558 42.0
Siquijor 87,079 55,883 64.0 31,196 36.0
Central Visayas 5,448,528 2,705,792 50.0 2,742,736 50.0
Source: Provincial Water Supply, Sewerage and Sanitation Sector Plans, 2003
Note: * Excluding Cebu City

59 Central Visayas Region Physical Framework Plan
increased in the last decade. Still, there remain a large number of people without access to safe water.
Based on the latest Provincial Water Supply, Sewerage and Sanitation Sector Plans, only about half or 50 percent (2.7 million) of the total regional population (excluding Cebu City) had access to potable water supply in 2003. This implies that approximately an equivalent number (50%) had no access to adequate and safe water supply services. The regional coverage rate was way below the national figure of 79 percent. (see Table 8)
By province, Siquijor had the highest percentage of population served by safe water sources (64%) while Cebu had the lowest (42%). Cebu's low coverage might be due to the large number of people in Cebu that had to be provided with water. Also the rate at which the population in Cebu is growing (Cebu has the highest population growth rate in the region) is hindering efforts at attaining a higher coverage rate for water.
There are three types of water supply systems in the region: Level I or point source facility, Level II or communal faucet system, and Level III or individual house connection.
Level I water sources are deep wells, shallow wells, covered/improved dug wells, open dug wells, rainwater collectors and developed springs. Level I facilities are common in rural barangays, majority of which are publicly-owned. In 2003, about 46 percent of the served population (1.2 million people or 248 thousand households) depended on Level I water supply facilities regionwide. Of the household total, 54 percent were in Cebu.
Most of the Level II (communal faucet) water system sources in the region are springs and dug wells. The water supply facilities themselves were put up by DPWH, LWUA, DILG or the l oca l gov ernm ent un i t s. Regionwide, there are 270 operating bodies providing Level II water systems. Only about 5 percent of the served population (136,783 people or 26,808 households) though were dependent on Level II facilities for their water needs in 2003.
Half of the households dependent on this water system were in Oriental Negros.
Level III (individual household connection) systems are usually established by LWUA-assisted water districts and local government units. Presently, there are 227 service providers of Level III water systems in the region. In 2003, about 45 percent (1.2 million) of the population with access to safe water got their water from Level III facilities.
There are 16 water districts in the region: two in Bohol, seven in Cebu, six in Oriental Negros and one in Siquijor. (see Map 27) Among these water districts, the Metro Cebu Water District (MCWD) is the largest.
In the franchise area of MCWD, supply of water is low as the water district is only able to meet less than half of the demand. Demand for water for domestic and industrial/commercial use is expected to increase at an average annual rate of 3.30 and 2.50 percent, respectively, from 2004 to 2020. Meanwhile, with the implemen-tation of a number of water projects, water supply is expected to increase at an average annual rate of 6.80 percent during the same period.
Irrigation
As of 1999, 26,889 hectares in the region
representing 39 percent of potential irrigable area have been irrigated. This accomplishment is lower than the national accomplishment of 43 percent during the same period. However, the region's performance was a big improvement from the 1990 level of 22.30 percent. This could
Irrigation project in Carcar, Cebu

Physical Environment 60
Map 27. Cities/Municipalities with Water Districts

61 Central Visayas Region Physical Framework Plan
be attributed to the implementation of a number of projects during the 1990's, among which were: Bohol Irrigation Project Stage 1, Visayas Communal Irrigation and Participatory Project, Second Communal Irrigation Project, Agrarian Reform Infrastructure Support Project, and various government-funded communal irrigation, small reservoir impounding and pump irrigation projects.
Among the four provinces, Bohol has the largest area of agricultural land under irrigation (14,959 hectares). (see Table 9) In terms of the proportion of irrigated area to total potential irrigable area, however, Siquijor ranks first with 61 percent of its potential irrigable area irrigated. Social Infrastructure Higher Education Institutions
Because of its strategic location and accessibility, Central Visayas is considered the center for education in the Visayas and Mindanao. It is home to seven state colleges and universities and their satellite campuses as well as several private colleges and universities. The satellite campuses of U.P. Visayas and the College of Aeronautics are located in the region.
The region boasts of a number of institutions offering quality programs in specific fields. Three (3) universities are identified as Centers of Excellence in Teacher Education. These are Silliman University in Dumaguete City and the Universities of San Carlos and San Jose Recoletos in Cebu City. Silliman University is also a Center of Excellence in Nursing. In addition, the region has four higher education institutions identified as Centers of Development for various disciplines.
From 1999 to 2003, the number of higher education institutions in the region increased with the privately owned and managed institutions outnumbering the public or government institutions. As of 2003, the region has a total of 119 higher education institutions (HEIs) providing tertiary education. About 80 percent of the HEIs are privately owned while the other 20 percent are state universities and colleges and their satellite campuses. Of the private HEIs, 71 percent are non-sectarian while 28 percent are sectarian, i.e. run by religious organizations. (see Map 28)
Cebu province is home to 64 percent of HEIs in the region. Eighteen percent (18%) of the total HEIs are located in Oriental Negros, while the remaining 15 percent and 3 percent are in Bohol and Siquijor, respectively.
Majority of the said institutions are located in the urban centers. Cebu City alone accounts for 31 percent or 37 of the total HEIs. Two of the most prestigious universities, the University of San Carlos and the University of the Philippines, are in Cebu City. Mandaue City, which is part of Metro Cebu, is host to nine institutions, eight of which are privately owned/managed. Dumaguete City has seven HEIs, six of which are private. Tagbilaran City has six HEIs, five of which are private.
The presence of a good number of reputable HEIs in the region has attracted many students from Eastern and Western Visayas and as far as Mindanao for their tertiary education, resulting in a continued upward trend in tertiary education enrollment. In school year 2002-2003, there were 191,975 enrollees in HEIs, with more females pursuing tertiary education than males. Cebu City in particular had an inflow of students not only from outside of Central Visayas but also from the other provinces and municipalities in the region. Because of the city's strategic location, it is easier for students from other regions in the Visayas and even in Mindanao to pursue their studies in Cebu than in Manila.
Tertiary schools are faced with the challenge of improving their quality of education and upgrading and modernizing their respective facilities in order to remain competitive.
Table 9. Potential Irrigable and Irrigated Areas, 1990 and 1999
Area
Potential Irrigable
Area (hectares)
1990 1999
Irrigated (ha.)
Percent Irrigate
Irrigated (ha.)
Percent Irrigate
Bohol 40,800 7,780 19.07 14,959 36.66
Cebu 10,064 2,590 25.74 3,896 38.71
Oriental Negros 17,028 5,162 30.31 7,605 44.66
Siquijor 699 211 30.19 429 61.37
Central Visayas 68,591 15,743 22.30 26,889 39.20
Philippines 3,169,594 1,566,008 49.40 1,350,368 43.19
Source: NIA 7

Physical Environment 62
Map 28. Universities and Colleges

63 Central Visayas Region Physical Framework Plan
Tertiary Health Facilities Central Visayas has a total of 105
hospitals. Half or 54 of the total number of hospitals in the region are found in Cebu. As of 2003, the region has a total of 5,686 hospital beds, up from 5,421 in 2000. This has resulted in a slight improvement in the hospital bed to population ratio (1:1,047) though still very much below the standard of 1:500.
There are 19 hospitals providing tertiary services not only to patients from the region but also from other provinces in Visayas and Mindanao. Of the 19 tertiary hospitals, 15 are private and 4 are government. Cebu City is home to 11 or 58 percent of the total number of tertiary hospitals in the region. (see Map 29)
Among the privately owned hospitals, most, if not all, have upgraded their equipment and facilities to be able to offer the latest medical technology and services to the general public. Modern diagnostic services, delicate surgery and other non-invasive alternatives to surgery are now being provided in these facilities. At least three major hospitals in Cebu City have acquired the reputation for excellent health service, attracting patients from as far as Mindanao.
However, the region's hospitals have not matched the excellent reputation of the best hospitals in Metro Manila. Affluent and critically ill patients are still brought to Manila or abroad for heart bypass, organ transplant, diagnosis and treatment of cancer diseases and others.
The two government-run tertiary hospitals in Cebu City, the Vicente Sotto Memorial Medical Center and the Cebu City Medical Center, have experienced marked increases in admissions of all types and cases. Although intended primarily to provide tertiary level of medical services, these hospitals are forced to accommodate all types of patients, many with relatively minor health problems, from nearby municipalities, provinces and even from other regions due to lack of facilities in the community hospitals in the municipalities. Consequently, these two hospitals are plagued with problems of congestion, shortage of medicines and medical supplies and shortage of medical staff. Despite the inconvenience, people in the lower and middle- income brackets continue to seek medical attention from these hospitals than from private medical facilities because of the relatively lower cost of public health care services.

Physical Environment 64
Map 29. Tertiary Hospitals