center pivot irrigation system losses and efficiencycenter pivot irrigation systems have been...
TRANSCRIPT

Proceedings of the 29th Annual Central Plains Irrigation Conference, Burlington, Colorado, Feb. 21-22, 2017
Available from CPIA, 760 N. Thompson, Colby, Kansas
19
CENTER PIVOT IRRIGATION SYSTEM LOSSES AND EFFICIENCY
Danny H. Rogers Jonathan Aguilar Extension Agricultural Engineer Extension Irrigation Specialist
Biological and Agricultural Engineering Southwest Research-Extension Center Manhattan, Kansas Garden City, Kansas
Voice: 785-532-2933 Voice: 620-275-9164 Email: [email protected] Email: [email protected]
Isaya Kisekka Freddie R. Lamm Research Agricultural Engineer Research Agricultural Engineer
Southwest Research-Extension Center Northwest Research-Extension Center Garden City, Kansas State University Colby, Kansas
Voice: 620-275-9164 Voice: 785-462-6181 Email: [email protected] Email: [email protected]
Kansas State Research and Extension
INTRODUCTION
Nearly 85 percent of the irrigated area in the three states of Colorado, Kansas and Nebraska are watered using center pivot sprinkler irrigation systems (NASS, 2013). Center pivot irrigation systems have been adopted because of their ruggedness and versatility. Center pivot systems reduced the amount of labor associated with irrigation as compared to surface irrigation systems and usually apply water to a crop more efficiently and uniformly. Declining well capacities in many irrigation areas and producer desire to reduce pressure requirements to minimize irrigation pumping costs have prompted development of different water delivery package options for center pivot systems while maintaining the ability to efficiently and to uniformly distribute a limited water supply over a large area. It is important, when designing a water delivery package for a new system or replacing a water delivery package on an older system, to keep in mind the general performance requirements of the various devices used to distribute water throughout the irrigated field. If these general requirements are not followed closely, a reduction in the system efficiency could occur which could be due to increased runoff and reduced yields from under-watering due to poor uniformity. The following will discuss the various options available for use with center pivot irrigation systems and their general performance requirements. To provide a better understanding of conditions which reduce efficiency, the discussion will cover water losses associated with the various attachment options and configurations.
APPLICATION DEVICES: CHARACTERISTICS AND DESIGN CRITERA The water emitting devices that allow the distribution of water to a field from the center pivot system are often called the sprinkler package, even though the water distribution devices may not resemble a traditional sprinkler device. Sprinkler or water delivery packages can be composed of a range of devices including impact sprinklers, fixed plate spray nozzles and moving plate spray nozzles or other water emission devices such as drag hose and/or drip tube. The latter application

20
devices apply water directly to the soil surface and can be either drag socks or bubble mode spray devices usually associated with Low Energy Precision Application (LEPA) application packages or Mobile Drip Irrigation (MDI) packages that utilize driplines equipped with low flow emitters spaced closely together. Impact sprinklers were used extensively on early water-drive center pivot irrigation systems. However, modern impact sprinkler designs now utilize lower pressures and lower angles of water stream trajectories. Impact sprinklers can have single or double nozzle configurations and have a large wetted diameter. When properly overlapped, they can provide very uniform application patterns at relatively low water application rates. The large wetted diameter and low water application rate may be important for tight soils or fields with large slopes to prevent irrigation water runoff. Fixed plate sprinklers or nozzles spread the water stream emitted from the nozzle orifices by directing the flow against stationary splash pads. The splash pads deflect the stream of water into the characteristic flow pattern that look like wagon wheel spokes creating usually a doughnut-like wetted pattern on the ground. The splash pads can be flat, convex or concave, and grooved or non-grooved. Grooved plates can have coarse to fine grooves. These various splash plate configurations affect the stream pattern and droplet size. Moving plate sprinklers or nozzles spread the water stream emitted from the nozzle orifices by directing the flow against splash pads that move. Some rotate slowly; others spin rapidly; others wobble. Depending on the speed of the movement, some water patterns develop that look like slowly rotating spokes of water, while others breakup the water streaming into a blur of water droplets. In addition to the speed of rotation, these devices can also have various grooves and slot configurations to produce various droplet sizes. The performance of each type of sprinkler nozzle is predictable as flow through the discharge opening or orifice is based on the opening size and the operating pressure. For a round orifice, the nozzle discharge (Scherer et al., 1999) can be calculated by:
q = Cd (29.83)d2 p0.5 (eq. 1) Where: q = nozzle discharge is gpm Cd = discharge coefficient (often between 0.95 and 1.00) d = nozzle diameter in inches p = pressure in psi. Since flow varies by the square of diameter, doubling the diameter quadruples the flow whereas doubling pressure would increase flow by about 40 percent as the flow changes by the square root of the pressure. However, pressure can greatly affect droplet size distribution and wetted diameter. All nozzles should be operated within the manufacturer's recommended pressure range. Excessive pressure will result in an increase of small droplet sizes that are more susceptible to wind drift and evaporation losses while under-pressuring will increase the drop size. Larger droplet sizes may have adverse effects on the soil surface due to higher impact energy or may affect coverage when the sprinkler package is used for chemigation or may affect the uniformity of application when designed with overlap. Operation outside the recommended pressure range, either high or low, usually decreases the effective wetted diameter. The wetted diameter of a nozzle refers to

21
area of coverage of the nozzle. There are many sprinkler or water delivery package design considerations, but the following are essential in determining adequate system performance: (1) application rate, (2) depth of application, (3) system irrigation capacity, and (4) uniformity of application.
APPLICATION RATE. Application rate is volume of water applied to a location during a specified period of time. Ideally, the irrigation application rate would be matched to the steady state soil infiltration rate. Assuming dry soil, the infiltration rate for soil is high at the initiation of water application and decreases as infiltration continues until it reaches a stable (steady state) rate. If the water application rate is less than the soil steady state infiltration rate, the irrigation water should be able to be infiltrated into the soil root zone (See Rogers et al., 2015). However, this design criterion was developed when the sprinkler packages were primarily high pressure, large wetted diameter impact sprinklers. The term application rate can also refer to several different measurements. The instantaneous application rate refers to the rate of water application at any given time. This value will vary from zero to the peak instantaneous application rate as the water delivery package crosses over a given point. The peak application rate generally refers to the maximum application rate for a system. The mean application rate would be volume of water delivered at a given point during the total time of wetting and would be smaller value than the peak application rate. The application rate for various nozzles must increase with distance from the pivot point as more area is covered by the nozzle with distance. This is why run off problems are generally associated with the outer edges of a center pivot unless soil or slope conditions are more limiting in an inner portion of the center pivot. The introduction of fixed plate and moving plate sprinkler nozzle options meant more center pivot sprinkler packages used devices with smaller wetted diameters. The common use of drop tubes lower the nozzle position closer to the ground surface which also decreases wetted diameter. These factors mean the system water delivery package design needs to consider the amount of soil surface water storage that is available during the irrigation event to prevent runoff. The USDA Natural Resources Conservation Service (NRCS) has determined infiltration rates for most irrigated soils. Soils with similar infiltration rates were grouped into Intake Families. Each of these soil intake families has a specific soil intake curve as shown in Figure 1. The soil type(s) for any field of interest can be determined by referring to soil maps which are available at county extension or NRCS offices and most are now web accessible. Soil intake curves are a good place to start when determining the maximum application rate. Average application rates produced by different sprinkler packages, shown in Figure 2, illustrate that sprinkler packages with smaller wetted diameters have higher average application rates and vice versa. When trying to match the application rate of a system to the intake rate of the soil, it is helpful to put the intake rate curve and the application rate curve on the same figure. This is shown in Figure 3 with the intake rate curve for the 0.5 NRCS Soil Intake Family and application rate curves for three different wetted radii (water delivery packages). The areas in Figure 3 where the application rate curves extend above the intake rate curve represent water that must be standing on the surface until infiltrated. Until it is infiltrated, it has a potential to run off or have surface water redistribution. If this standing surface water does run off, there is a reduction in system efficiency. Sprinkler packages with a higher wetted radius have a lower application rate and therefore are less likely to produce runoff. The prevention of runoff should be a major design consideration.

22
Figure 1. Infiltration rate curves from the USDA Natural Resources Conservation Service for
various soil intake families (USDA NRCS, 1997).
Figure 2. Water application patterns for different sprinkler types, (Howell, T.A., 2003). LESA is
nomenclature for Low Elevation Spray Application; LPIC for Low Pressure In-Canopy; LESA for Low Elevation Spray Application; LEPA for Low Energy Precision Application. The LEPA application rate greatly exceeds the scale of the graph.

23
Figure 3. Potential runoff for a silt loam soil receiving a 1.1-inch water application without surface
storage (Adapted from Scherer et al., 1999). DEPTH OF APPLICATION. The amount of water applied during an irrigation event should not exceed the volume of water that the root zone can hold. If excess water is applied, water will be lost to deep percolation, thus reducing the overall irrigation efficiency. Different types of soils have different soil water holding capacities. For optimal crop growth results, it is best to keep the soil water level between field capacity and about 50 percent of the available water in the crop root zone for the type of soil being irrigated. These levels are based on the tension required to extract water from the soil. Field capacity is often defined as the level of water remaining in the soil root zone approximately 3 days after a large irrigation or precipitation event. Permanent wilting point is defined as the level of soil water at which a plant can no longer extract water from the soil, and thus, the plant can no longer survive. The soil water between field capacity and the permanent wilting point is the amount of water that is available for plant use. Application of water above field capacity results in runoff and the soil becomes saturated. The water that infiltrated will be more likely to be lost to deep percolation. Applying too little water will result in plant stress. Irrigation scheduling management procedures can be used to monitor soil water levels. Table 1 gives typical soil water levels for four soil textures. The root zone of the crop to be irrigated, along with the available water holding capacity for the soil being irrigated, determines the maximum application amount subject to water supply constraints. Table 2 summarizes crop water use characteristics for many irrigated crops and includes the root zone for several crops common to the Central Plains region. Multiplication of the managed root zone depth of the crop by the available water-holding capacity of the soil being irrigated determines the total available water-holding capacity in the root zone. This is the most water that can be stored without water lost to deep percolation. The maximum amount that can be applied is less than this since the general irrigation management guideline is to prevent more than 50 percent soil water depletion. Roots are concentrated in the upper part of the active root zone, so the managed zone is normally limited to no more than 4 feet.

24
Table 1. Water-Holding Capacities of Soils (See Rogers et al., 2015 for more soils information).
Table 2. Seasonal Crop Water Use (ET), Typical Average and Daily Peak Water Use Rate, Critical
Growth Stages, Typical Root Depth, and Typical Managed Root Depth for Various Crops Common to the Central Plains Region. (See Rogers et al., 2015 or KSRE crop production handbooks (Alfalfa C683, Corn C560, Sorghum C687, Soybean C449, Sunflower (High Plains) MF2384, or Wheat C529; for more specific crop information)
Crop Seasonal Crop Water Use (ET)
Average Peak Daily Water Use
Rate
Generalized Single-day
Peak Water Use Rate
Critical growth stages
Un-restricted root depth
Typical managed root zone
depth
(inches) ---(inches per day)--- ------(feet)------
Alfalfa 31.5 – 63.0* 0.40 0.55 after cutting 6 -10 3 - 4
Corn 15.6 - 31.6 0.35 0.50 tasseling, silking 4 - 6 3 - 4
Sorghum 16.0 – 30.6 0.35 0.40 boot-heading 4 - 6 3 - 4
Soybean 17.4 - 27.6 0.35 0.40 germination
bloom podding 4 - 6 3 - 4
Sunflowers 16.0 – 39.4 0.40 0.50 flowering maturity
4 - 6 3 - 4
Wheat 15.4 – 25.6 0.30 0.40 boot-heading 4 - 6 3 - 4
*Forage crops such as alfalfa can have use large amounts of water if growing seasons are long. SYSTEM IRRIGATION CAPACITY. System irrigation capacity is the average depth of water applied to the entire field if it was watered in one day. For example, a center pivot may be set to apply a one-inch application as it rotates around a field. However, it may require four days to complete an irrigation cycle. The system irrigation capacity is then 1 inch per four days or 0.25 inches/day. The system capacity can be calculated using the following equation: System Irrigation Capacity: IC = (Q * T) /(450 * A) (eq. 2) where: IC = Irrigation Capacity in inches per day 450 is a conversion factor; 450 gpm ≈ 1 ac-in/hr
25
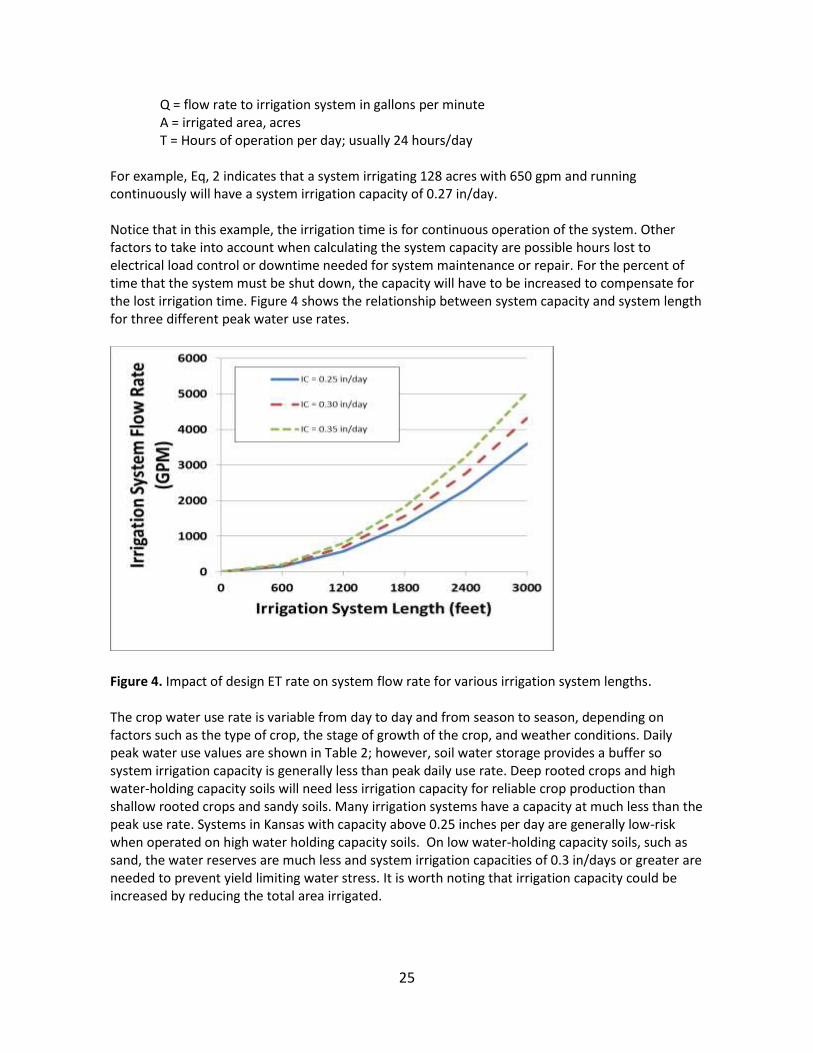
Q = flow rate to irrigation system in gallons per minute A = irrigated area, acres T = Hours of operation per day; usually 24 hours/day For example, Eq, 2 indicates that a system irrigating 128 acres with 650 gpm and running continuously will have a system irrigation capacity of 0.27 in/day. Notice that in this example, the irrigation time is for continuous operation of the system. Other factors to take into account when calculating the system capacity are possible hours lost to electrical load control or downtime needed for system maintenance or repair. For the percent of time that the system must be shut down, the capacity will have to be increased to compensate for the lost irrigation time. Figure 4 shows the relationship between system capacity and system length for three different peak water use rates.
Figure 4. Impact of design ET rate on system flow rate for various irrigation system lengths. The crop water use rate is variable from day to day and from season to season, depending on factors such as the type of crop, the stage of growth of the crop, and weather conditions. Daily peak water use values are shown in Table 2; however, soil water storage provides a buffer so system irrigation capacity is generally less than peak daily use rate. Deep rooted crops and high water-holding capacity soils will need less irrigation capacity for reliable crop production than shallow rooted crops and sandy soils. Many irrigation systems have a capacity at much less than the peak use rate. Systems in Kansas with capacity above 0.25 inches per day are generally low-risk when operated on high water holding capacity soils. On low water-holding capacity soils, such as sand, the water reserves are much less and system irrigation capacities of 0.3 in/days or greater are needed to prevent yield limiting water stress. It is worth noting that irrigation capacity could be increased by reducing the total area irrigated.

26
UNIFORMITY OF APPLICATION. When designing sprinkler irrigation systems, it is important to provide as uniform application as possible. A non-uniform application will result in areas of under-watering as well as areas of over-watering. Either area could result in reduced yield and lead to decreased system efficiency. The uniformity of the sprinkler or water delivery package design is determined by system package design. It is affected by the operating conditions and environmental factors, especially wind. Figure 5 shows the results of a center pivot uniformity test. Section A of the pivot illustrates a portion of the sprinkler package that was performing well. This area of the pivot has a coefficient of uniformity of approximately 90 percent. In section B, a leaky boot connection between two spans was caught in one container. Section C represents the area covered by the outer two spans of the system that shows an area of over watering and under watering. This is better illustrated in Figure 6, which shows the test results of this area with the end gun off. The difference in depth was the result of the nozzles for the two spans being switched at installation. Section D of Figure 5 demonstrates the effect of an improperly operating end gun. In this case, the end gun operation angle was improperly set and it was over spraying the nozzles for about one third of the last span and for the overhang of the center pivot. In this example, all of the causes of the poor uniformity were easily and inexpensively corrected.
Figure 5. Mobile Irrigation Lab uniformity analysis of a center pivot sprinkler package

27
Figure 6. Depth of application catch for 2 spans of a center pivot with a reversal of the nozzles
between the inner and outer span as indicated by the decreased application depth. Uniformity is decreased if system pressure is not kept at the design pressure. Wear of nozzles and incrustation build up can also negatively affect the pattern. Canopy interference also decreases distribution uniformity.
TYPES OF WATER LOSSES
From a practical standpoint, water that does not reach or remain in the root zone until it is used by the crop is not available to the plant and is therefore considered lost. Although an exception may be required if the irrigation water has high salinity or other poor water quality conditions. Excess water application may be needed to provide a leaching requirement to remove salts from the root zone which is considered a beneficial use. The reduction in water made available to the plant reduces the water application efficiency of the entire system. Water losses occur in four areas: (1) air loss, (2) foliage loss, (3) ground loss and (4) deep percolation, which are illustrated in Figure 7 for several water delivery package configurations.

28
Figure 7. Illustration of different types of water losses associated with sprinkler systems. (Adapted from Rogers et al., 1997)
AIR LOSS. The two components of air water loss are drift and droplet evaporation. Droplet evaporation is the water from droplets that evaporates while in flight before reaching the crop canopy or the soil surface. Drift is the water droplets that move off the field or onto a non-targeted area of the field, usually by wind. This causes non-uniformity in the water application, and crops located in areas not receiving the proper amount of water may become stressed. These types of losses can be reduced by selecting nozzles that produce large droplets and moving the discharge point closer to the crop canopy or soil surface. Irrigation farmers are often very concerned about air losses, referring to the combination of droplet evaporation and drift as simply evaporation. However, the losses associated with air losses for properly designed and operated nozzles of any type are small as compared to other potential water losses. Various studies may have contributed to this perception of large air losses associated with sprinkler systems, (King et al., 2012). However, recent studies using either improved collection technology or analytical techniques indicated that air losses for properly operated nozzles devices are small. For example, Thompson et al. (1993) noted that direct evaporation of water droplets was less than1 % of the discharged water. Minimal direct water droplet evaporation and drift loss is consistent for all types of sprinkler nozzles as long as the droplet sizes produced by the devices are within normal droplet size range. The number of small droplets can be increased by various design and operational conditions, most commonly by excess operational pressure. Extremely small droplets can evaporate at a very high rate during flight but only constitute a small portion of the flow volume under normal conditions. While air losses are relatively unaffected by nozzle type and location, these factors have important impacts on the next category of irrigation water loss-foliage losses. FOLIAGE LOSS. Upon entering the canopy of the crop, water can be lost to plant interception or to evaporation. Interception is water that is “caught” and held on the plant material surfaces, and overtime evaporates into the atmosphere. Foliage evaporation losses refer to water evaporating from the foliage surface during the time that field location is being irrigated. To reduce water losses in the canopy, discharge points have been moved closer to the ground to limit the extent of the surface wetting of crop canopy and reduce the total time of irrigation at a given field location.

29
Interception losses for impact sprinklers and other above canopy nozzles would be consistent and probably not greatly reduced even for in-canopy nozzles, since the nozzles do not stay perfectly horizontal to the ground surface while moving through the crop rows. However the amount of water lost to canopy evaporation would be related to the time of wetting due to irrigation. As illustrated previously in figure 2, a low pressure impact sprinkler (2) might have a wetted radius of 80 feet as compared to a wetted radius of 60 feet for a rotator nozzle (3); this would represent a 25% reduction in the time that canopy wetting occurs, therefore a 25% potential reduction in this individual loss component, would represent a positive impact on the overall irrigation efficiency by only a few percent. Canopy evaporation continues to decrease and can be eliminated with application systems like LEPA and MDI which deliver irrigation water directly to the ground. LEPA and MDI may have irrigation capacity limitations and require other management techniques, such as circular row planting and in some cases special off-season protection that limit their use. Reducing canopy evaporation should not be at the expense of creating runoff. Evaporation from the canopy does suppress crop transpiration while evaporation is occurring as illustrated in Figure 8. However evaporation occurs more rapidly than transpiration, therefore making evaporation less beneficial than transpiration, and representing a loss of irrigation efficiency.
Figure 8: Water use components for a rotator sprinkler places on top of the pivot lateral. (Adapted
from Martin et al., 2010). GROUND LOSS. Once the water reaches the ground, it can be lost in several ways. If water application rates are higher than the soil intake rate, water can either be held in surface storage or it can start to move along the soil surface and become runoff. Runoff water can either leave the field or just move to a different location within the field. Within field water movement causes non-uniformity in the application, and reduces the efficiency of the application if the soil receiving the runoff as infiltration is over-watered, losing excess water to deep percolation In addition, these areas may also have production decreased due to lack of soil aeration from the ponded water and leaching of nutrients with the deep percolation. The portion of the field losing water will have less water available to meet crop needs. Runoff water that leaves the field is a direct irrigation efficiency loss.

30
Water being held in surface storage will either infiltrate or evaporate. The stored water lost to evaporation reduces the irrigation amount, and thus the application efficiency. If the depth of application exceeds the soil water storage capacity within the root zone, water will be lost to deep percolation. This is when water infiltrates below the crop root zone. Ground level losses of water can be reduced by using different tillage techniques and reducing the application depth of each irrigation event. However decreasing the application depth per irrigation event increases the number of events needed to apply the seasonal water needs and subjects the water application to additional foliage water losses. Soil water evaporation losses are greater during off-season and early season irrigation events when the crop canopy is absent or reduced. Soil residue also plays a role in the amount of soil evaporation that can occur. Application packages such as LEPA and MDI that reduce the total wetted surface also have potential to reduce soil water evaporation (Kisekka et al. 2016). DEEP PERCOLATION LOSS: Deep percolation loss would be water that enters the soil profile that is in excess of the available water storage capacity of the zoot zone, more specifically the managed root zone depth. Deep percolation losses should be managed by using an appropriate irrigation scheduling method, such as climatic (ET) - based irrigation scheduling or soil-based irrigation scheduling. A combination of these two scheduling methods allows two independent evaluation of the irrigation schedule.
WATER DELIVERY PACKAGE OPTIONS
There are many different types of nozzles available for selection, each of which can be operated at various pressures, mounted at various heights, equipped with different orifice sizes and spaced at various widths from other nozzles, making hundreds of possible choices among water delivery packages. If the nozzles are not used within the given specifications, they will not perform as designed, and may reduce application efficiencies significantly. Table 3 shows the relationships between the nozzle types and their design pressure range. As might be expected, different nozzles provide different output and application characteristics. Table 4 gives the rating of output characteristics for Sprinklers 2 through 7 from Table 3. These characteristics determine the types of water losses to which each nozzle is susceptible. AVERAGE APPLICATION RATE. The average application rate is calculated by dividing the application amount by the time of application. Nozzles operating at different pressures provide a different wetted radius. It has already been noted that smaller wetted radii (lower operating pressures) provide a higher average application rate. Table 4 shows that Nozzle 2, with the lowest operating pressure, has the highest average application rate. If the average application rate for a nozzle of interest is significantly higher than the intake rate of the soil to be irrigated, the potential for runoff is high.

31
Table 3. Minimum end pressures on center pivots and linear move systems for various sprinkler
devices. (Kranz et al., Central Plains Proceedings, 1990).
PEAK APPLICATION RATE. The peak application rate is the maximum rate at which water is supplied to the soil at a given point in time and at a specified location. Selecting a sprinkler package with a peak application rate that is too great could cause runoff to develop. The key is to match the peak application rate to the soil infiltration rate and soil surface water storage capacity. Three factors that affect the peak application rate are (1) system length, (2) system flowrate, and (3) nozzle wetted radius. The following equation can be used to calculate the peak application rate:
)(
)(
sps
p
pRR
QKI
(eq. 3)
where:
Ip = peak water application rate, in/hr K = constant, 122.5 Qp = irrigation system capacity, gpm Rs = system length, ft. Rsp = wetted radius of outer nozzle, ft.
This equation indicates that as the system length increases the peak application rate increases. Figure 9 provides a visual representation of how wetted radius impacts the peak application rate as system length increases.

32
Figure 9. Impact of sprinkler wetted radius on peak water application rate when designed for 0.35
inch per day ETp . WETTED RADIUS. The wetted radius of a sprinkler is the distance water will travel from the nozzle before striking the ground. Nozzles that have a large wetted radius also tend to have a large droplet size and operate at higher pressures as indicated in Table 4. Wetted radius is also an indication of the average application rate. A larger wetted radius will have a lower average application rate, and thus the potential for runoff will be lower. WATER DROPLET SIZE. The water droplet size is determined by such things as operating pressure, size and shape of the opening on the nozzle, and what type of pad or arm the nozzle is equipped with. The important properties of water droplet size to remember are: (1) large droplets have a high instantaneous application rate that can cause crusting on unprotected soil, which can increase the potential for runoff; and (2) small droplets are more susceptible to drift and evaporation losses. Table 4 gives water droplet size comparisons. Table 4. Rating of output characteristics of sprinklers 2 through 7 from Table 3. (Kranz, et al.,
Central Plains Proceedings, 1990).
A trend in recent years has been to use lower pressure nozzles which reduces the overall pressure required for the system and lowers pumping costs. Since lower pressure nozzles have a smaller droplet size, they have been moved closer to the ground to reduce evaporation and drift losses.

33
Lower pressure nozzles also increase the average application rate, requiring that special attention being given to reducing the potential for runoff. LEPA and MDI. The LEPA nozzle was not included in the above comparisons. The operating pressure and the position of the nozzle that is close to the ground means the wetted radius for LEPA nozzles are very small. This also means that the average application rate is very high. LEPA has been described by some as a traveling flood irrigation system, and because of its characteristics, must be used in conjunction with special management practices. LEPA packages were developed to serve low irrigation capacity systems on level fields. LEPA nozzle spacing is usually twice the row spacing (5ft. for 30-inch rows) and the rows must be planted in a circle. In addition, special tillage practices, such as dammer-diking, must be used to control runoff. MDI uses microirrigation driplines that are attached to the center pivot via drop tubes. The driplines are designed for this application and feature closely-spaced pressure compensating emitters. The length of the driplines increase with the distance from the pivot point so that flow rate can be matched to the area of coverage. These systems were also originally designed for low capacity systems but some have been installed on high capacity systems. The concept of delivering water directly to the ground would eliminate air and canopy losses and minimize ground losses. To optimize the benefits of this concept, circular planting is recommended particularly for tall row crops. Irrigation scheduling is still needed to prevent deep percolation losses.
SUMMARY
Center pivot systems are popular because of the ability to provide efficient and uniform application of irrigation water for a wide variety of crops and field conditions when equipped with a properly designed and operated water delivery package. Center pivot labor requirements also tend to be low as compared to surface irrigation system requirements. There are many different water delivery package options associated with center pivot irrigation systems, and consideration must be given to the overall system rather than to “fixing” one problem. A trend in recent years has been to use low pressure nozzles which reduces the overall pressure required for the system, to help reduce operating costs. Since lower pressure nozzles have a smaller droplet size, they are more susceptible to drift and evaporation losses. Lower pressure nozzles also increase the average application rate, increasing the potential for runoff. The capacity needed to effectively water a given field may not be met by a system whose pressure has been reduced solely for the purpose of reducing pumping costs. This is a good example of how focusing on one aspect of the system can lead to other problems elsewhere on the system. When designing a new system or converting an older system, consideration should be given to the general nozzle performance requirements as well as to cost reduction and water loss reduction.
REFERENCES
Howell, T.A. 2003. Water Loss Comparison of Sprinkler Packages. In proceedings of the 2003 Central Plains Irrigation Conference. Colby, KS. February 4-5, 2003. Available from CPIA. 760 N. Thompson, Colby, KS. Pp 54-69.
King, B., R. Dugan, and D. Bjorneberg. 2012. Evaluation of Center Pivot Sprinkler Wind Drift and Evaporation Loss. ASABE Paper Num. 12-1336891. Presented as the 2012 ASABE AIM, Dallas, TX. July 29 - Aug. 1, 2012. 11pgs.
34
Kisekka, I., G. Nguyen, J. Aguilar and Danny Rogers. 2016. Mobile Drip Irrigation Evaluation in Corn. Kansas Agricultural Experiment Station Research Reports: Vol. 2: Iss. 7. http://dx.doi.org/10.4148/2378-5977.1253
Martin, D.L., W.L. Kranz, A.L. Thompson and H. Liang. 2010. Selecting sprinkler packages for center pivots. In: Proceedings of the ASABE 5th National Decennial Irrigation Conference. Phoenix, AZ. Dec. 5-8, 2010. Paper Number: IRR10-9298.
Rogers, D.H., J.P. Aguilar, I. Kisekka, P.L. Barnes, and F.R. Lamm. 2015. Important Agricultural Soil Properties. Kansas State Research and Extension L935. 8 pgs
Rogers, D.H., F.R. Lamm, M. Alam, T.P. Trooien, G.A. Clark, P.L. Barnes, and K.L. Mankin. 1997. Efficiencies and water losses of irrigation systems. Kansas State University Research and Extension. Irrigation Management Series. MF-2243.
Scherer, T.F., W. Kranz, D. Pfost, H. Werner, J. Wright, and C.D. Yonts. 1999. Sprinkler Irrigation Systems. MWPS-30. First Edition. Chapter 5 Sprinkler Characteristics. 250 pps.
Thompson, A.L., J.R. Gilley, and J.M. Norman. 1993. A Sprinkler Water Droplet Evaporation and Plant Canopy Model: II. Model Application. Trans. of ASAE. Vol. 36(3): 743-750.
USDA NRSC. 1997. National Engineering Handbook: Irrigation Guide, part 652. U.S. Department of Agriculture, Washington, DC. Pp. 852.