center of ocean-land- atmosphere studies overview jagadish shukla lecture25: nov 25, 2008 clim 101:...
TRANSCRIPT

Center of Ocean-Land-Atmosphere studies
OverviewOverview
Jagadish ShuklaJagadish Shukla
Lecture25: Nov 25, 2008
CLIM 101: Weather, Climate and Global Society
Are we doing something Are we doing something wrong?wrong?
Over the past 20 years:
• Adopted a treaty for climate change
• Pledge to protect biodiversity
• Committed globally to fighting the encroachment of deserts
• Adopted the Millennium Development Goals

Do we need a new Industrial Do we need a new Industrial Revolution?Revolution?
• Where flows of material are closed with product designs intended for full recycling and clean decomposition back to the environment.
• Driven by a new energy system striking for conservation and no net greenhouse gas emissions.
• Production models that empower developing regions towards sustainable pathways of growth.

Do we need a new economic system?
• How do we shift from conventional economics that don’t include “environmental externalities” to sustainable economics?
• How do we move from “economic growth” to “development for the wellbeing of society”?
• What are human aspirations after poverty and how do we measure progress of it?
Special Issue on
Advice for a Happy LifeVolume 9, Number 3 / September, 2008 Humanities and Social Sciences
Planet Happy Index

The way forwardThe way forwardCan our biggest challenges be also our biggest
opportunities?
…….by taking advantage of:
– How interconnected the world is with the possibility for rapid diffusion of knowledge and technology.
– The improved knowledge on the capacity and limits of our planetary environment.
– The large awareness on environmental problems and refocus on development for the wellbeing of society
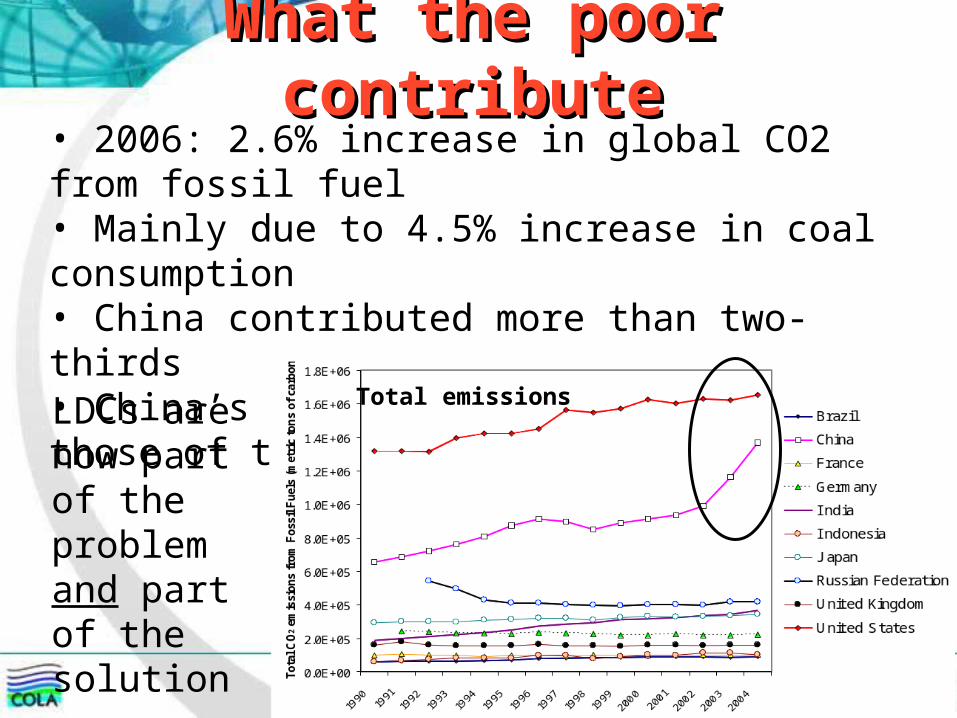
What the poor What the poor contributecontribute
• 2006: 2.6% increase in global CO2 from fossil fuel• Mainly due to 4.5% increase in coal consumption• China contributed more than two-thirds• China’s CO2 emissions surpassed those of the USA by 8%
LDCs are now part of the problem and part of the solution
Total emissions

Adaptation burden on the Adaptation burden on the poorpoor
• Adaptation will cost LDCs $10 bns anually• Even more for the necessary infrastructure

What the poor What the poor contributecontribute
But LDCs: small contribution to climate change, at least in per capita terms
0.0
1.0
2.0
3.0
4.0
5.0
6.0
7.0
CO
2 e
mis
sio
ns
pe
r c
ap
ita
(m
etr
ic t
on
s o
f c
arb
on
)
Brazil
China
France
Germany
I ndia
I ndonesia
J apan
Russian Federation
United Kingdom
United States
Per capita emissions
US
China
Remember 1992 UNFCCC: Common but differentiated responsibilities

0.0
1.0
2.0
3.0
4.0
5.0
6.0
1990
1991
1992
1993
1994
1995
1996
1997
1998
1999
2000
2001
2002
2003
me
tric
to
ns
of
ca
rbo
n p
er
ca
pit
a
Brazil
China
France
Germany
India
Indonesia
Japan
Russian Federation
United Kingdom
United States
CDIAC, 2006
Average per capita
Global CO2 emissions:
1980 0.93 t C
1999 1.04 t C
2005 1.21 tC
Per Capita Carbon Dioxide Emissions (1990-Per Capita Carbon Dioxide Emissions (1990-2003)2003)

Houghton, unpublished
Carbon Emissions from Tropical DeforestationP
g C
yr-1
0.00
0.20
0.40
0.60
0.80
1.00
1.20
1.40
1.60
1.8018
50
1860
1870
1880
1890
1900
1910
1920
1930
1940
1950
1960
1970
1980
1990
2000
Africa
Latin America
S. & SE Asia
Anthropogenic C Emissions: Land Use Anthropogenic C Emissions: Land Use ChangeChange
SUM
2000-2006
1.5 Pg C y-1
(16% total emissions)

FAO-Global Resources Assessment 2005; Canadell et al. 2007, PNAS
Tropical Americas 0.6 Pg C y-1
Tropical Asia 0.6 Pg C y-1
Tropical Africa 0.3 Pg C y-1
2000-2005
Tropical deforestation
13 Million hectares each year
Anthropogenic C Emissions: Land Use Anthropogenic C Emissions: Land Use ChangeChange
1.5 Pg C y-1
Born
eo, C
ourte
sy: V
iktor
Boe
hm

65% - Increased activity of the global economy
Canadell et al. 2007, PNAS
17% - Deterioration of the carbon intensity of the global economy
18% - Decreased efficiency of natural sinks
2000 - 2006: 1.9 ppm y-1
1970 – 1979: 1.3 ppm y-1
1980 – 1989: 1.6 ppm y1
1990 – 1999: 1.5 ppm y-1
Attribution of Recent Acceleration of Attribution of Recent Acceleration of Atmospheric COAtmospheric CO22
To:• Economic growth• Carbon intensity• Efficiency of natural sinks

Species Extinction is unovaidable any Species Extinction is unovaidable any longerlonger
Slide courtesy: Martin Parry , based on IPCC WGII 2007
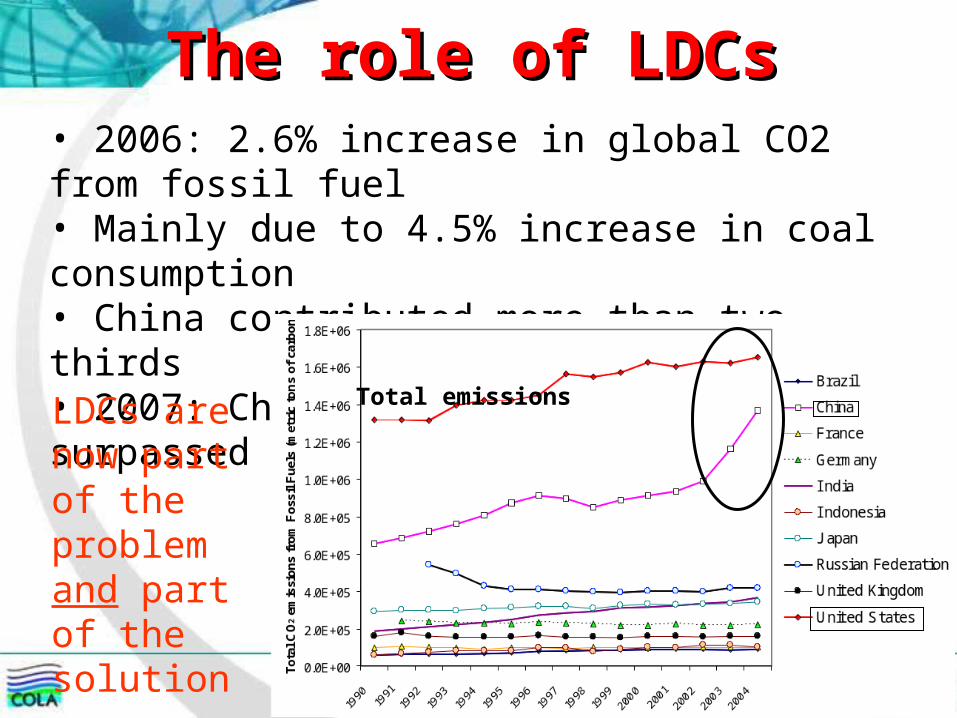
The role of LDCsThe role of LDCs• 2006: 2.6% increase in global CO2 from fossil fuel• Mainly due to 4.5% increase in coal consumption• China contributed more than two-thirds• 2007: China’s CO2 emissions surpassed the USA by 8%
LDCs are now part of the problem and part of the solution
Total emissions

Main threat to a sustainable Main threat to a sustainable worldworld
• Arctic summer sea ice likely to disappear in second half of century
• Very likely increase in heatwaves • Likely increase in intensity of tropical storms
SST
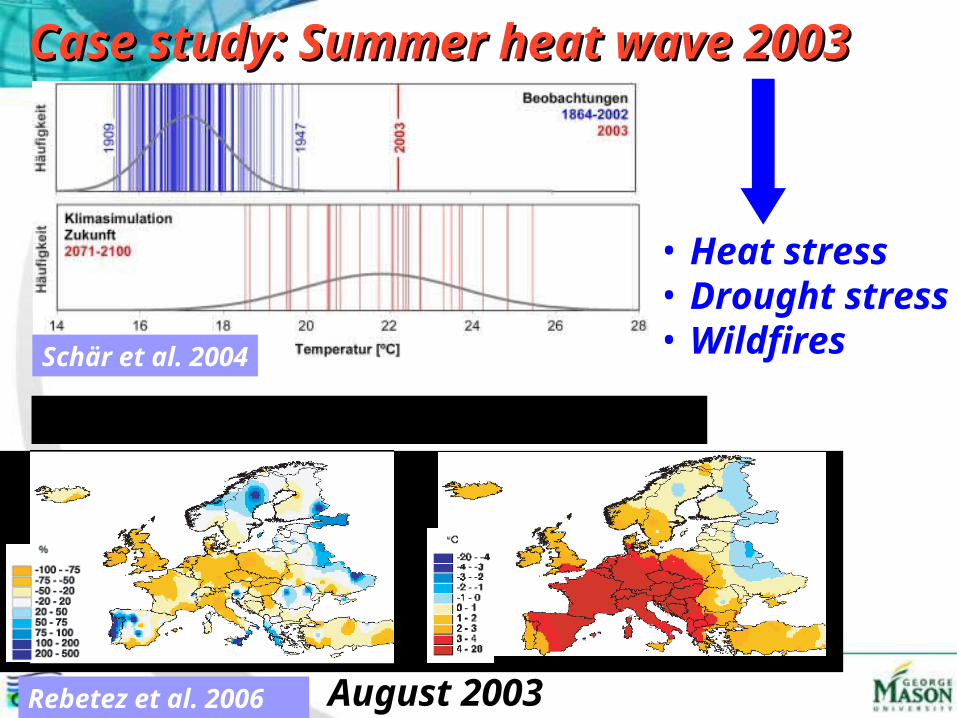
Case study: Summer heat wave Case study: Summer heat wave 20032003
Schär et al. 2004
Rebetez et al. 2006 August 2003
Precipitation Max. temperature
• Heat stress• Drought stress• Wildfires

10km
Glacier melt in the HimalayasGlacier melt in the Himalayas
1989
2000
1978
1996

Future climate change will affect water availability, increasing water stress in already stressed regions...
ImpactsImpacts


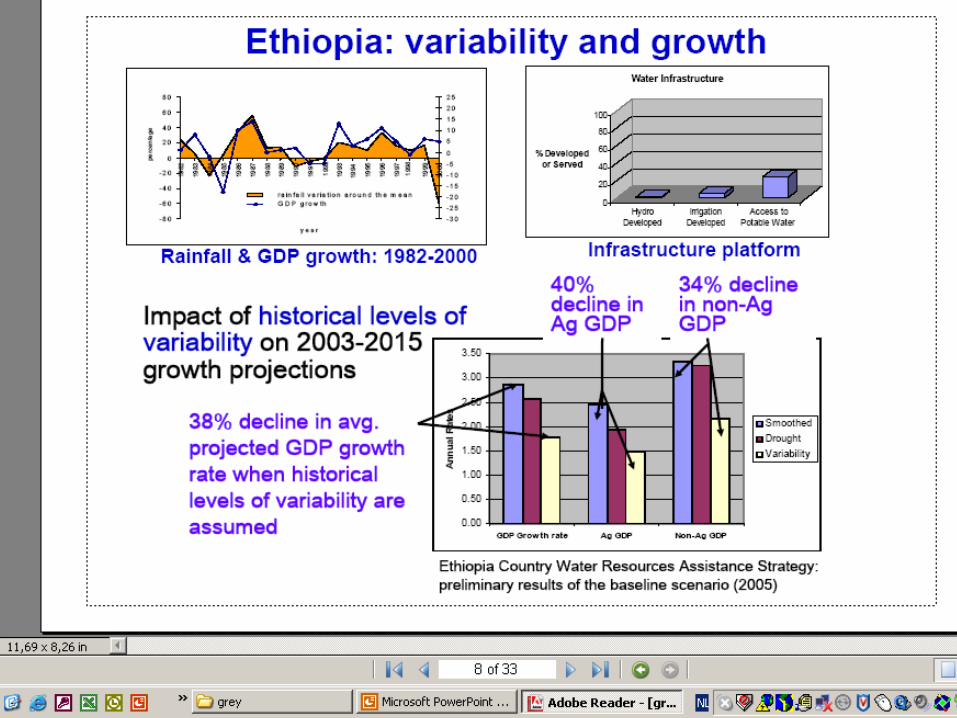
Extreme rainfall variability: the case Extreme rainfall variability: the case of Kenyaof Kenya
Kenya: extreme rainfall variability around mean
60%
80%
100%
120%
140%
160%
1956
1958
1960
1962
1964
1966
1968
1970
1972
1974
1976
1978
1980

Kenya’sKenya’s 97-98 flood & 1998-2000 drought97-98 flood & 1998-2000 drought
Hirji et al, World Bank (2003)
10/97-02/98 flood infrastructure damage $ 2.39 b
10/98-05/00 drought crop loss $ 0.24 b
livestock loss $ 0.14 b
reduc. HP production $ 0.64 b
reduc. industr. production $ 1.39 b
total $ 2.41 b
10/97-05/00 cost of climate variability $ 4.8 b
approx (annual) GDP ($9b/yr) $ 22 b
impact as % GDP/annum 22%

Mozambique’sMozambique’s 2000 floods2000 floods
Real GDP - 23%

-10.0
-5.0
0.0
5.0
10.0
15.0
1979
1980
1981
1982
1983
1984
1985
1986
1987
1988
1989
1990
1991
1992
1993
Years
Real
GDP
gro
wth
(%)
-4.0
-3.0
-2.0
-1.0
0.0
1.0
2.0
3.0
Varia
bilit
y in
Rai
nfal
l (M
eter
)
Real GDP grow th (%)
Variability in Rainfall (Meter)
Correlation between GDP and Rainfall in Zimbabwe
Rainfall affects growth…. Rainfall affects growth…. the case of Zimbabwethe case of Zimbabwe

Main threat to a sustainable Main threat to a sustainable EarthEarth

Global dust deposition Global dust deposition
Jickells et al. (2005)
GEC goes beyond climate change

PROJECTED SCENARIOS OF DEFORESTATION ...PROJECTED SCENARIOS OF DEFORESTATION ...Control 20% 40% 50%
60% 80% 100%
or Soybean
Source: Soares-Filho et al., 2006 and Amazon Scenarios Project, LBA Sampaio et al., 2007
Vegetation classification
Dorman and Sellers (1989)
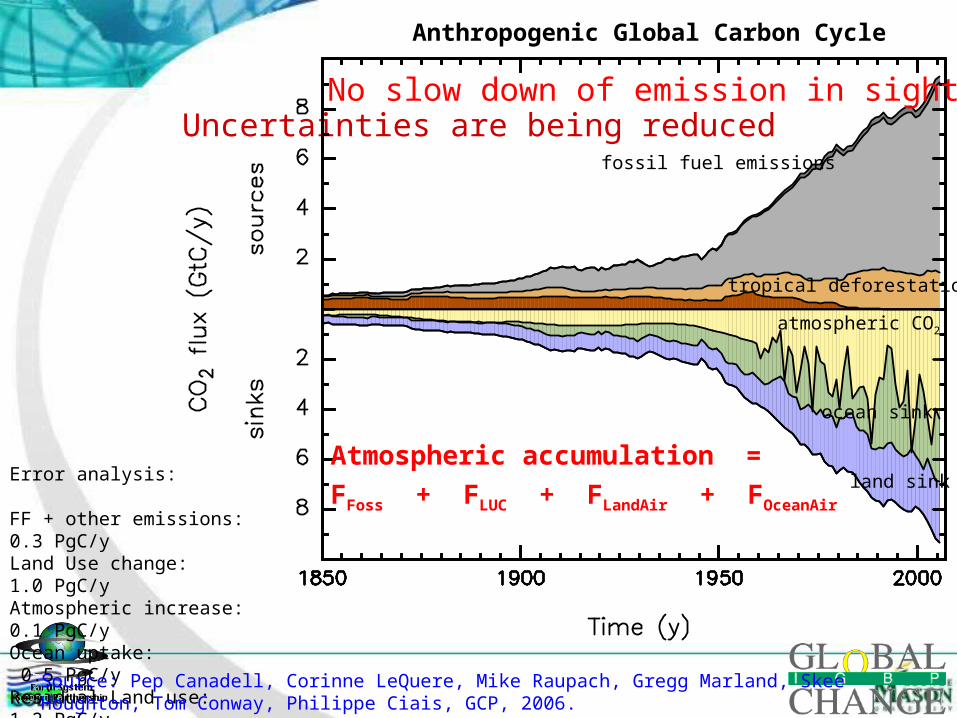
Uncertainties are being reduced
Error analysis:
FF + other emissions: 0.3 PgC/yLand Use change: 1.0 PgC/yAtmospheric increase: 0.1 PgC/yOcean uptake: 0.5 PgC/yResidual Land use: 1.2 PgC/y
fossil fuel emissions
tropical deforestation
atmospheric CO2
ocean sink
land sink
Anthropogenic Global Carbon Cycle
No slow down of emission in sight!
Atmospheric accumulation =
FFoss + FLUC + FLandAir + FOceanAir
Source: Pep Canadell, Corinne LeQuere, Mike Raupach, Gregg Marland, Skee Houghton, Tom Conway, Philippe Ciais, GCP, 2006.

• 2003
• Heat wave hits
Europe
• 30,000 people die
in Western EuropeobservationsHadCM3 Medium-High (SRES A2)
2003
2040s
2060sT
emp
erat
ure
an
om
aly
(wrt
196
1-90
) °
C
GEC is more acute than everGEC is more acute than ever

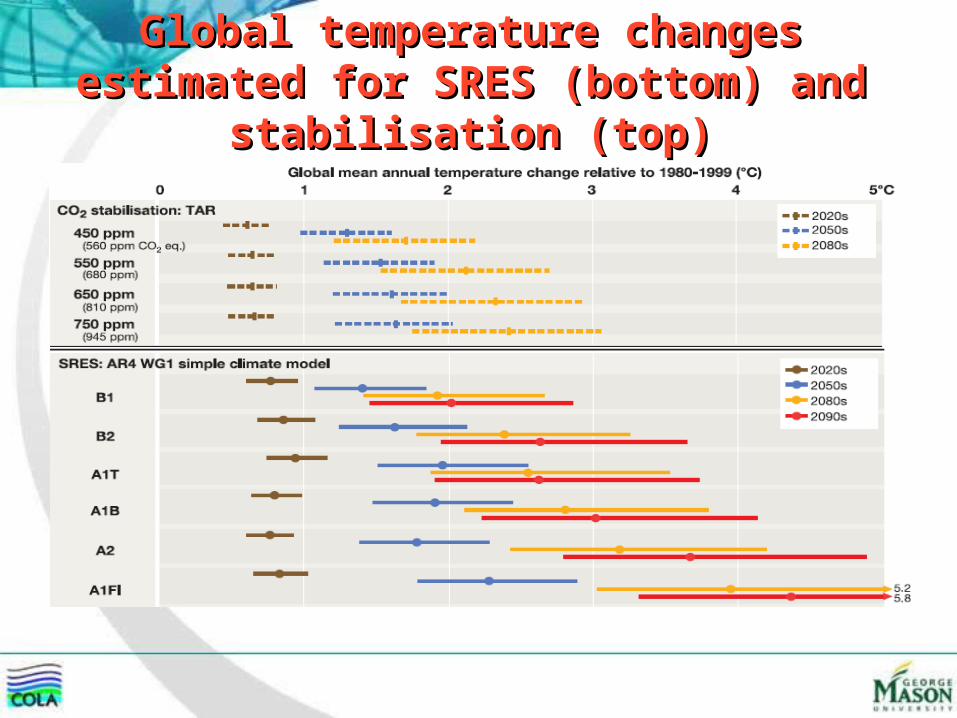
Global temperature changes Global temperature changes estimated for SRES (bottom) estimated for SRES (bottom)
and stabilisation (top)and stabilisation (top)
The ethical dimensions of The ethical dimensions of Global Environmental ChangeGlobal Environmental Change
There is an issue of ethics and justice: the people most likely to bear the brunt of Global Environmental Change are those who have contributed least to it

The Renaissance visionThe Renaissance vision
Sir Isaac Newton
Principia
Slide courtesy: adapted from G. Camara
Mathematical principles are the alphabet in which God wrote the world Galileo Galilei

The Renaissance visionThe Renaissance vision
Your picture here
Sir Isaac Newton
????
Principia
Terrestris Rationis Principia The Anthropocene visionThe Anthropocene vision
Slide courtesy: adapted from G. Camara

All of us and many others
Nascetur Homo planetaris The Anthropocene The Anthropocene must give rise tomust give rise to
Humankind

Great Challenges for Humankind in 21Great Challenges for Humankind in 21stst Century Century
GLOBAL CLIMATE CHANGE
WATER
HUNGER
ENERGY
ILLNESS
SPECIES EXTINCTION
SECURITY
WARS
DEMOCRACY
EDUCATION
POVERTY
ETHICS AND JUSTICE

Main ConclusionsMain Conclusions1. Global Climate Change is real, uniquivocal and is
accelerating
2. Global Climate Change impacts regions, but are all interconnected and there are serious systemic risks
3. Global Climate Change is irreversible and the challenge of mitigation is gargantuan
4. The effects of Global Climate Change are unequal and unfair
5. The challenge of Global Climate Change is not only scientific and political, but it is also ethical and phylosophical

Brief history of climate change Brief history of climate change sciencescience 1827, Fourier:
First recognises the warming effect of greenhouse gases in the atmosphere incoming solar radiation goes through the atmosphere and outgoing Earth's radiation is trappedsimilarity with a greenhouse.
1860, Tyndall:Builds the first infra-red spectrometer and measured the absorption, transmission and radiation of heat by different gases oxygen and nitrogen almost completely transparent to heat, carbon dioxide and mainly water vapour most powerful absorbers.
1896, Arrhenius:Calculates the effect of an increasing concentration of greenhouse gases
estimates that doubling the concentration of CO2 would increase the global average temperature by 5 to 6ºC (not too far from the present understanding).

THE LONDON, EDINBURGH AND DUBLIN
PHILOSOPHICAL MAGAZINEAND JOURNAL OF SCIENCE
[FIFTH SERIES APRIL 1896]
XXXI. On the Influence of Carbonic Acid in the Air upon the Temperatureof the Ground. By Prof. SVANTE ARRHENIUS*.
1. Introduction: Observations of Langley on Atmospherical Absorption.
A GREAT deal has been written on the influence of the absorption of the atmosphere upon the climate. Tyndall † in particular has pointed out the enormous importance of this
question. To him it was chiefly the diurnal and annual variations of temperature that were lessened by this circumstance. Another side of the question, that has long attracted the
attention of physicists, is this: Is the mean temperature of the ground in any way influenced by the presence of heat-absorbing gases in the atmosphere? Fourier ‡
maintained that the atmosphere acts like the glass in a hot house, because it lets through the light rays of the sun but retains the dark rays from the ground. This idea was
elaborated by Pouillet §; and Langley was by some of his researches led to the view, that ‘the temperature of the earth under direct sunshine, even though our atmosphere were present as now, would probably fall to – 200 °C., if that atmosphere did not possess the
* Extract from a paper presented to the Royal Swedish Academy of Sciences, 11th December 1895. Communicated by the Author.
† “Heat a mode of motion,” 2nd ed. p.405 (Lond.,1865).‡ Mem. de l’Ac. R. d. Sci. de l’Inst. de France, t. vii. 1827.
§ Compress rendus, t. vii. p41 (1838).
Phil. Mag. S. 5. Vol. 41. No. 251. April 1896 S
Global Warming is not a new idea!!Global Warming is not a new idea!!

Svante Arrhenius: Svante Arrhenius: The first climate The first climate
predictionprediction• Arrhenius quantified in
1896 the temperature change (approx. 5 C) which should be expected by doubling atmospheric CO2, based on the concept of the ”glass bowl” concept introduced in 1827 by Joseph Fourier

1938, Callendar:First to calculate the warming due to increasing carbon dioxide from the burning of fossil fuels.
1957, Revelle & Suess:Publish ‘Carbon dioxide exchange between the atmosphere and ocean and the question of an increase of atmospheric CO2 during the past decades´ excess carbon dioxide produced by human activities is not quickly absorbed by the oceans (as believed at the time).
1958, Keeling: Begins measurements of atmospheric CO2 at Mauna Loa, Hawaii classic record of atmospheric CO2 concentration which shows an upward trend from 315 parts per million (ppm) in 1958 to 381 ppm in 2005.
Brief history of climate change Brief history of climate change sciencescience

Charles David KeelingCharles David Keeling
20 April 1928 – 20 June 2005
Keeling’s Curve of Atmospheric CO2
from Mauna Loa, Hawaii

Brief history of climate change Brief history of climate change sciencescience
E.g. Manabe & Wetherald (1967):
employed a simple one-dimensional model to calculate the effect of CO2 increases. For a CO2 doubling, they found an increase of approximately 2.3ºC in the temperature of the model troposphere and a cooling of several degrees in the middle stratosphere.
Vertical distribution of the equilibrium temperature of the model atmosphere temperature with the normal (300 ppm), half the normal (150 ppm) and twice the normal (600 ppm) concentration of carbon dioxide (From Manabe and Wetherald, J. Atmos. Sci., 1967).
1960s: First studies with simple climate models.

Brief history of climate change Brief history of climate change sciencescience
1979: First World Climate Conference organized by the World Meteorological Organization (WMO) and other UN agencies.
1980s:First detection and attribution studies and general circulation model runs.
1988:U.N. launches a scientific authority: the Intergovernmental Panel on Climate Change (IPCC).
1990:First IPCC assessment report says levels of man-made greenhouse gases are increasing in the atmosphere and are likely to cause to cause global warming.

Brief history of climate change Brief history of climate change sciencescience
1992:UN Framework Convention on Climate Change (UNFCCC) at the Rio Summit, which calls for voluntary cuts in greenhouse gas emissions. George Bush Senior signed treaty. 186 countries also signed by 2000.
1996:IPCC Second assessment report (SAR). "There is evidence of a discernible human impact on climate ".
1997:Kyoto Protocol. Developed countries are required to reduce emissions of key greenhouse gases by at least 5 per cent below 1990 levels in the commitment period 2008 to 2012. 55 countries, accounting for 55% or more of 1990 emissions, must ratify for it to come into effect.
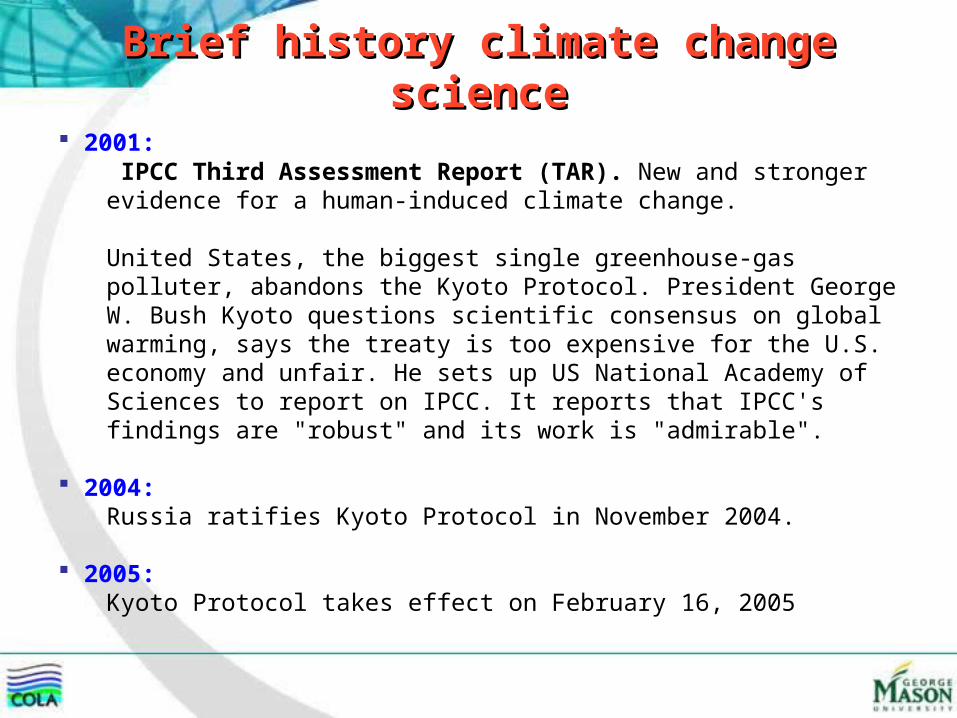
Brief history climate change Brief history climate change sciencescience
2001: IPCC Third Assessment Report (TAR). New and stronger evidence for a human-induced climate change.
United States, the biggest single greenhouse-gas polluter, abandons the Kyoto Protocol. President George W. Bush Kyoto questions scientific consensus on global warming, says the treaty is too expensive for the U.S. economy and unfair. He sets up US National Academy of Sciences to report on IPCC. It reports that IPCC's findings are "robust" and its work is "admirable".
2004:Russia ratifies Kyoto Protocol in November 2004.
2005:Kyoto Protocol takes effect on February 16, 2005

Brief history of climate change Brief history of climate change sciencescience
2007:IPCC Fourth Assessment Report (AR4). "Most of the observed increase in global average temperatures since the mid-20th century is very likely due to the observed increase in anthropogenic greenhouse gas concentrations. (…) Continuedgreenhouse gas emissions at or above current rates would cause further warming and induce many changes in the global climate system during the 21st century that would very likely be larger than those observed during the 20th century."
IPCC and Al Gore share the Nobel peace prize in December. Conference of the Parties in Bali agrees a roadmap to negotiate the successor to Kyoto.

Kyoto
IPCC éformado
Convenção C
limática

The Global Carbon The Global Carbon CycleCycle
IPCC 2007 WGI

New satellite observations are quantifying the sea level rise of the past decade
[Figures from Cazenave and Nerem, 2003]

What is in the store fore the future and What is in the store fore the future and
what has already been committedwhat has already been committedGlobal Warming will increase if GHGs concentration increase. Even if GHGs are kept constant at current levels, a commitment of 0.6°C of additional warming would happen until 2100.
1.8oC = 3.2oF
2.8oC = 5.0oF
3.4oC = 6.1oF
CO2 Eq
850
600
4000.6oC = 1.0oF
IPCC 2007 WGI
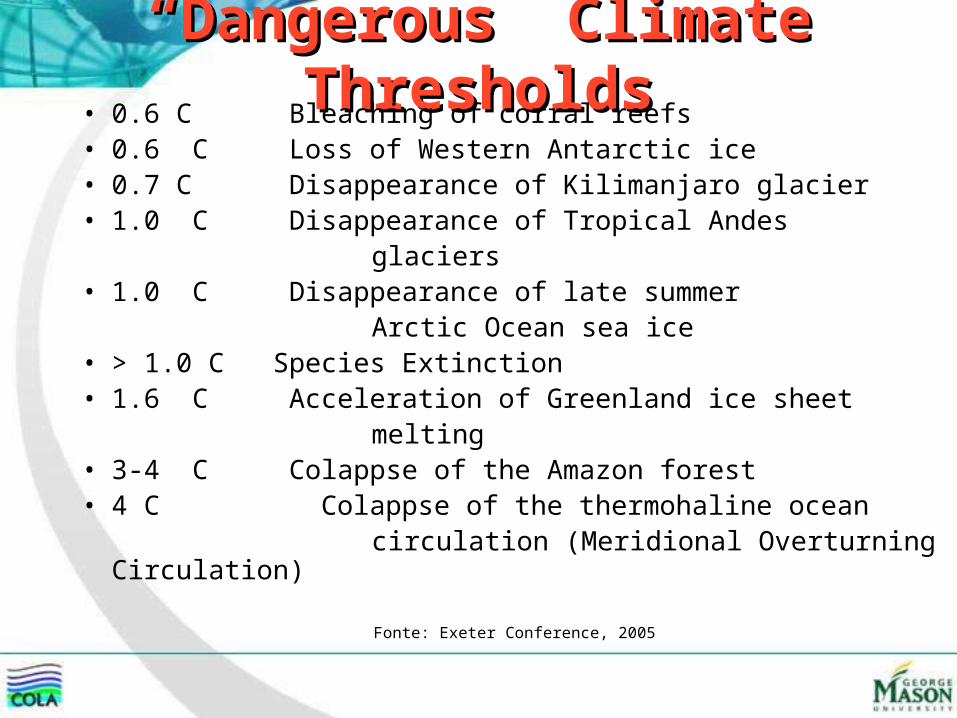
““Dangerous” Climate Dangerous” Climate ThresholdsThresholds• 0.6 C Bleaching of corral reefs
• 0.6 C Loss of Western Antarctic ice• 0.7 C Disappearance of Kilimanjaro glacier• 1.0 C Disappearance of Tropical Andes glaciers• 1.0 C Disappearance of late summer Arctic Ocean sea ice • > 1.0 C Species Extinction• 1.6 C Acceleration of Greenland ice sheet melting• 3-4 C Colappse of the Amazon forest• 4 C Colappse of the thermohaline ocean circulation (Meridional Overturning Circulation)
Fonte: Exeter Conference, 2005

Fig. TS-10: Changes in the Mt Kilimanjaro ice cap and snow cover over time. [F9.2].

Destruction power of hurricanes have been Destruction power of hurricanes have been in the increase in the last 30 years in the increase in the last 30 years
(Emanuel, 2005)(Emanuel, 2005)
Increase power of hurricanes is associated with warming of tropical oceans !

30-yearevent
12-yearevent
4-yearevent
30-yearevent
12-yearevent
4-yearevent
Regionally predictions generally Regionally predictions generally suggestsuggest
an increase in extreme rainfallan increase in extreme rainfall

Modelling JJA temperature anomalies Modelling JJA temperature anomalies in Southern European regionin Southern European region
ObservationsModel including anthropogenic and natural forcings Model prediction under SRES A2scenario Model without anthropogenic forcings.

THANK YOU!
ANY QUESTIONS?
Center of Ocean-Land-Atmosphere studies