center for demography and ecology - sscc · monoracial births (root 1996). the 2000 census has...
TRANSCRIPT

Center for Demography and EcologyUniversity of Wisconsin-Madison
The “One-Drop Rule”: How Salient is Hypodescentfor Multiracial Americans with African American Ancestry?
Mary E. Campbell
CDE Working Paper No. 2003-11
The “One-Drop Rule”:
How Salient is Hypodescent for Multiracial Americans with African American Ancestry?1
WORD COUNT (including footnotes and references): 8,000
Mary E. Campbell Sociology Department
University of Wisconsin-Madison
July 2003
1 Please direct all correspondence to Mary E. Campbell, 4400 Susan Drive #105, San Bruno, CA 94066 or by email at [email protected]. I would like to thank Richard Alba, Jennifer Eggerling-Boeck, Aaron Gullickson, Ann Morning, Samuel Myers and Gary Sandefur for their helpful comments. Earlier versions of this paper were presented at the annual meeting of the American Sociological Association in 2002 and the annual meeting of the Population Association of America in 2003.

2
The “One-Drop Rule:”
How Salient is Hypodescent for Multiracial Americans with African American Ancestry?
ABSTRACT
The “one-drop rule” has historically been used to classify individuals with any African American
ancestry as black. There is reason to think, however, that this “rule” might be weakening. Using
the May 1995 Current Population Survey’s Race and Ethnicity Supplement, I investigate the
salience of the “one-drop rule” for multiracial Americans with some African American ancestry
who are forced to choose a single race on a survey. I find that the power of the “one-drop rule”
varies significantly by the reason the respondent identified as multiracial, the racial context of
the region, and the home context. Its salience varies most, however, across different ancestry
groups, with those who choose a “black-American Indian” identity most likely to select a black
monoracial identity, while other groups are significantly less likely to choose a black identity.
3
The “black” category has historically been the most rigidly defined racial category in the
United States, with strictly maintained boundaries. The “one-drop rule,” or hypodescent, made
this rigidity possible. Everyone with “one drop of black blood” (in other words, one African
American ancestor) was considered black. Because this rule was strictly enforced in both legal
and popular settings by those outside and inside the black community, researchers and the public
alike have often assumed that multiracial Americans with some African American ancestry have
unproblematic, unambiguous black identities.
New developments in research on multiracial identity have made it clear that it may be
unwise to assume that the “one-drop rule” is still rigidly enforced, or that identity choices are
unproblematic for multiracial Americans with African American ancestry. The fluidity of racial
identity, especially for individuals who identify as multiracial at least some of the time, is
becoming clear (see for example Harris and Sim 2002). As Brunsma and Rockquemore (2002)
point out, this fluidity is changing our idea of what the category “black” means. Research into
the construction of “black” identity is also meaningful for those who wish to understand racial
identity more generally, since this category has been the most inflexibly defined of any
American racial category. Changes in the boundaries of the black racial category might well
herald changes in the overall structure of racial categories and their boundaries.
Much of the research that has been done in the past on similar topics has focused on the
children of mixed-race couples, examining the race asserted by or assigned to the child. This
study takes a different approach; instead, it begins with a sample of individuals who have chosen
to self-identify as multiracial. Using the Current Population Survey’s Race and Ethnicity
Supplement from May 1995, this paper will test the salience of the “one-drop rule” by
considering the racial identification of individuals on both a survey question that allows
4
multiracial identification, and a forced-choice question that limits each respondent to a single
race selection. For those 1,165 respondents who self-identify as multiracial and part-African
American, I will compare their multiracial identity to their single race identity, to explore
whether most multiracial Americans with African American ancestry feel obliged to choose a
singular black identity on the forced-choice race question. I will then consider individual and
social factors that might be related to the selection of a racial identity.
Literature Review
Although African Americans are the least likely of any American minority group to
intermarry, rates of intermarriage for all racial and ethnic groups have been increasing steadily
since 1960. In 1994, 3.2 percent of all African American wives and 6.6 percent of all African
American husbands were married to a spouse of another race (Sandefur et al 2001), and the
numbers are even higher for young couples (Qian 1997) and those with high levels of education
(Farley 1999). The growing population of intermarried couples has led to a “biracial baby
boom,” with the numbers of biracial births increasing at a faster rate than the number of
monoracial births (Root 1996). The 2000 Census has focused a great deal of attention on this
growing population, since it is the first recent Census allowing self-identification with multiple
races. The Census data shows that the multiracial population is indeed a sizable one, with 6.8
million people listing 2 or more races (Jones and Smith 2001).2 Of this multiracial population,
25.8 percent name African American as one of their races (approximately 1.75 million people).
Davis (1991) argues that the number of individuals who could claim a mixed racial heritage is
really much higher. He reasons that, of people who generally identify as African American, at
2 The most common racial combinations found were “white and some other race,” “white and American Indian,” “white and Asian,” and “white and black.”

5
least three-fourths have some white ancestry, and as many as one-fourth have some American
Indian ancestry. Most of these people do not identify as multiracial, he argues, because they are
following the “one-drop rule.”
There is a long history in the United States of the “one-drop rule,” or hypodescent, which
asserts that anyone with any African American ancestry is African American. Davis (1991)
demonstrates that the “one-drop rule” has been used as the popular standard, as well as the legal
one, for many years, and was initially used to define all mixed-race children as black in order to
maintain the color line of slavery. Children of slaves, therefore, were always considered black,
even if the majority of the child’s ancestors were white (see also Perlmann and Waters 2002).
Hypodescent has historically been used both by outsiders to assign individuals to the
African American racial group and by insiders to assert an African American identity. Davis
explains that the African American community fully adopted the “one-drop rule” after
Reconstruction, embracing the idea that all individuals with some “black blood” were part of the
African American community, and rejecting the earlier divisions between “mulattoes” and “pure
blacks” (see also Rockquemore and Brunsma 2002 and Williamson 1980). Although light-
skinned blacks often had an intermediate status between blacks and whites before
Reconstruction, the widespread racism and discrimination faced by all nonwhites after
Reconstruction led to a strengthening group identity and an emphasis on black solidarity.
There is substantial evidence that Davis was right about the power of the “one-drop rule”
inside and outside the black community. By 1945, for example, when Drake and Cayton wrote
their famous piece on Chicago, Black Metropolis, the authors considered it an accepted fact that
multiracial children with one black parent were “of course” considered black. Davis’ argument
is also supported by the fact that the change from interviewer-assigned race to self-identification

6
in the 1960 Census had little effect on the size of the black population. Blacks were apparently
using the same “one-drop rule” for self-identification that interviewers had been instructed to use
in earlier Censuses.
More recent history has, in some ways, reinforced the strength of the “one-drop rule.”
The Black Power movement, for example, emphasized the positive aspects of black identity, and
placed a great deal of pressure on multiracial individuals to fully embrace a black identity (and
consequently distance themselves from other possible identities) (Brown 2001; Williamson
1980). DeBose and Winters (2003) note that today, some members of the African American
community consider it a betrayal for a biracial person with African American descent to claim a
biracial identity, since they believe it “amounts … to removing themselves from a perceived
inferior race to reap societal benefits” (p. 129).
On the other hand, there is good reason to think that the “one-drop rule” might be less
powerful today than it was in the past. Several studies have found that biracial respondents,
especially young people, prefer a biracial identity to the single-race identity that the “one-drop
rule” enforces. Korgen (1998), for example, found in her interviews with 64 black-white biracial
individuals that those born before the civil rights movement generally asserted a monoracial
African American identity, in keeping with Davis’ argument. She also found, however, that the
members of the younger generation of biracial individuals she interviewed were more likely to
assert a biracial identity, or both a black and biracial identity. The majority of the younger
respondents valued their biracial identity and believed that the benefits of a biracial identity
outweighed the costs. Although they did admit to having trouble “fitting in,” consistent with the
marginal man description of multiracial identity crisis outlined by Park (1928), Korgen’s
respondents also felt that their biracial identity gave them a broader perspective (as Park also

7
suggested). They were unwilling to give up their biracial identity in order to gain the advantage
of “fitting in” with one group.
Rockquemore and Brunsma’s (2002) study supports the idea that many young people
value their biracial identity. They interviewed college students with one black and one white
parent, and more than half of them identified as “biracial.” Rockquemore and Brunsma
described their identity as a “border identity,” one which “highlights an individual’s existence
between two socially distinct races” (42). Almost 20 percent of their sample did, however,
choose just one race (a “singular” identity), with most of those individuals choosing to identify
as African American, and a few identifying as white.3 Others in their sample either had a
“protean” identity, one which shifts according to situational factors, or a “transcendent” identity,
in which respondents refused to categorize themselves racially, rejecting racial distinctions as
false categories. The authors found that the racial identity of biracial white/black college
students is related to the composition of their social networks and the interactions that students
had with others (for example, whether or not their chosen identity was validated). Based on their
surveys and interviews, the authors concluded that the “one-drop rule” is “headed for a slow and
painful death” (117) as more young people choose identities freely rather than feeling
constrained by a singular identity.
Other authors, such as Spickard (1992), have agreed that there is growing acceptance for
multiracial identities, and this should make it easier for all multiracial Americans to maintain a
“border” identity and reject the “one-drop rule.” Less research has been done, however, on these
trends for multiracial Americans with one black parent and another non-white, non-black parent.
One of the few studies that compared biracial individuals with one black parent and one parent of
3 We would expect few people from this sample to identify as white, however, since the sample was drawn only from individuals who had marked “black,” “other race,” or no race on another survey.

8
other races is DeBose and Winters (2003). They found that there are some interesting
differences between biracial black-white and biracial black-nonwhite respondents. In their
Southern California sample of 15 biracial individuals with one African American parent, they
found that black-white respondents were more likely to emphasize their black identity and its
value than black-nonwhite respondents (although both groups generally expressed an identity
that included both parents’ heritage).
When forced to choose a single race, black-Asian individuals often choose “black” as
their single-race identity (Hall 1992). However, this pattern depends on age, level of exposure to
black culture, and other contextual factors (Hall 1992, Xie and Goyette 1997). Williams and
Thornton (1998) found that, although their black-Asian respondents felt that the “one-drop rule”
created pressure to be especially aware of their black heritage, at the same time, their
respondents asserted multiracial identities, resisting the assignment of a single racial identity.
Williams-León (2003) found several authors who advocated the use of the “one-drop rule” by
black-Asian individuals, since they are perceived as less “accepted” than their Asian-white
counterparts, and could therefore benefit from unity with the black community.
The identity choices of black-American Indian individuals have also received less
attention than black-white individuals. Although there is good historical evidence that black-
American Indian intermarriage was fairly common at some times and places (see, for example,
Perdue 1979 and Mandell 1998), less is known about how the children of those unions self-
identified. Interviews such as those found in Brooks (1998) make it clear that the history of
black and American Indian relations has not been smooth, but has instead been a contradictory
mix of competition, racism, and acceptance. Although he finds evidence that blacks (especially
in the Jim Crow era) might have emphasized their American Indian heritage in order to refute
9
common stereotypes and associate themselves with another, less persecuted group, he also finds
respondents who emphasize the great distance between the two groups and the unwillingness of
some American Indian communities to accept those with visible black heritage. As Baird-Olson
(2003) points out, these identity issues are further complicated by the many different ways that
American Indian identity can be defined (including, for example, tribal membership, “blood
quantum” or number of American Indian ancestors, and residence in an urban or reservation
setting). Eschbach (1995) used the 1990 Census to show that children with one American Indian
parent were racially identified as American Indian in less than half the cases, although he found
higher rates of American Indian identification in a few places where intermarriage rates were
low. This suggests that racial context might have an effect on the identification of black-
American Indian individuals, although that group is not separated out by Eschbach.
Black-Hispanic individuals have been the subject of very little research on racial identity
choices, due to the nature of the race and ethnicity questions on most surveys. Since Hispanic
identity and racial identity are usually included in different questions, those who choose a
Hispanic identity and a black identity are generally not considered “multiracial.” Those studies
that have been done have shown that those who identify as black and Hispanic often have lower
socioeconomic status and high levels of segregation compared to those who identify as white and
Hispanic (Murguia and Telles 1996; Denton and Massey 1989), but issues of identity are less
clear. Rodriguez (2000) points out that Hispanic identity and racial identity overlap for many
Hispanic Americans, and that many Hispanics choose “other race” on surveys because their
identities are not well represented by the current racial and ethnic identity questions. Recent
research, such as Harris and Sim (2002) has pointed out the need for a single ethnicity/race
question to consider this identity issue. I will address this question in more detail below.
10
These studies suggest that the “one-drop rule” might be losing its position as the standard
for the racial identity of those with some African American heritage, and that the effects of
contextual factors might be growing (Brunsma and Rockquemore 2002). As Davis (1991) points
out, there are many other ways that the United States could view the identity of mixed-race
individuals.4 In fact, he points out that the “one-drop rule” is used only in the United States;
other countries present alternatives for classifying mixed race individuals. Racially mixed
individuals in different parts of the world have been often been treated as a group separate from
either parent group, with a different social status than either group. Clearly, in many other
settings, mixed-race identities are validated, and individuals are not asked to select one
“singular” racial identity (see, for example, Nobles 2002 and Daniel 2003).
Recent research on the “one-drop rule” in the United States has been limited by the
difficulty of locating a large sample of the multiracial population. Most studies of biracial or
multiracial individuals are based on small, local samples, or samples that include only those who
have strong feelings about their biracial identity (and are therefore willing to answer an
advertisement for biracial interview respondents, for example). It is therefore difficult to tell if
the conclusions of the research would be robust in large, nationally representative samples. It is
possible to test this question with the 1995 Current Population Survey Race and Ethnicity
Supplement. With this data, we are able to see how individuals identify when they are forced to
choose one racial identity, and how they identify when allowed to select more than one race.
Since we can compare the responses of each individual, we can test the “one-drop rule”
4 Indeed, Davis notes that the United States was not always united behind the idea of hypodescent. Parts of the U.S., especially Louisiana, were very reluctant to adopt a “one-drop rule,” since they had a long history of considering mixed-race individuals as an intermediate category between whites and African Americans.

11
hypothesis: do multiracial Americans with some African American ancestry consistently choose
“black” as their single race identity?5
Data
The Current Population Survey’s May 1995 Race and Ethnicity Supplement is a large,
nationally representative sample of households (N=124,534). Before the Supplement was
administered (in some cases, months before) each respondent was asked in their initial CPS
survey to indicate whether or not he or she was Hispanic and identify with a single race. The
May 1995 CPS Supplement was designed to test several questions. The first was whether
Hispanic identity should be determined in a separate ethnicity question, as it was on the 1990 and
2000 Censuses, or whether “Hispanic” should be included in the list of possible races in the race
question. Half the households were therefore given a racial identity question that included
Hispanic in the list of races, while the other half were given a separate Hispanic identity
question. The second issue being tested was whether people should be allowed to identify as
multiracial. Thus for half of the households in the May 1995 CPS, the list of races included an
option called “Multiracial.” If this was selected, the respondents were asked in a follow-up
question to select the specific races with which they identified, and to explain why they
identified as multiracial. These two questions were tested in all combinations, resulting in 4
panels of about 15,000 households each for the May 1995 CPS Supplement:
5 Of course, there is an equally important portion of the “one-drop rule” hypothesis that cannot be tested with this data (or, indeed, most survey data). I cannot answer the question: “do outside observers assign multiracial Americans with some African American ancestry to a monoracial “black” identity?” See Harris’ (2002) study on the relationships between observer characteristics and the races that they assign to others for one of the few available studies of observed race.

12
Panel 1: separate Hispanic question, no Multiracial category, Panel 2: separate Hispanic question, Multiracial category, Panel 3: no separate Hispanic question, no Multiracial category, Panel 4: no separate Hispanic question, Multiracial category. Even the individuals who were not given a multiracial option, however, were later asked if they
would have liked a multiracial option to better describe their racial background.6 Those who said
that they would have chosen a multiracial option were then asked to identify the other races with
which they identified. Therefore, we can identify multiracial respondents for the whole dataset.7
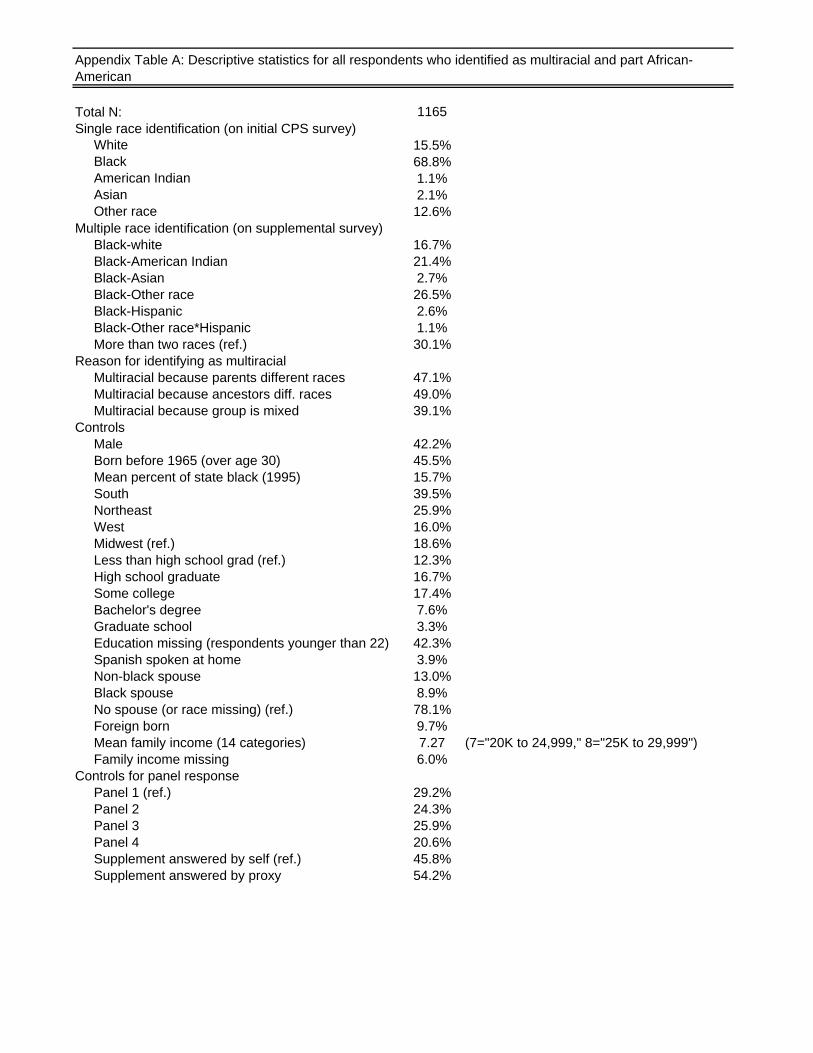
The dataset includes more than 6,500 multiracial respondents, 1,165 of whom identified as
multiracial with some African American heritage. For complete descriptive statistics on the
variables used in this analysis, see Appendix A.
Using this data, I first show descriptive statistics for how multiracial individuals with
some African American heritage identified when forced to select one race. I then use logistic
regression to investigate some of the factors that may be related to the selection of a black racial
identity versus any other single race. To help elaborate on these findings, I conclude with a
multinomial logit model. Multinomial logit models are appropriate for nominal outcomes, such
as the selection of a single race from a list. The effects of the independent variables are allowed
to differ for each outcome with this model, which makes it ideal for understanding how
individual and contextual factors are related to the selection of any given racial category.
Predicted probabilities are presented in order to facilitate comparisons across outcomes. For a
more detailed description of multinomial logit models, including the calculation of predicted
probabilities, see Long (1997).
6 The exact question was: “In addition to [the race the respondent named] would you like to have had a “Multiracial” category on the list I read earlier to better describe yourself?” 7 For more information on the May 1995 CPS Race and Ethnicity Supplement, see Tucker et al (1996).
13
Results
Descriptives
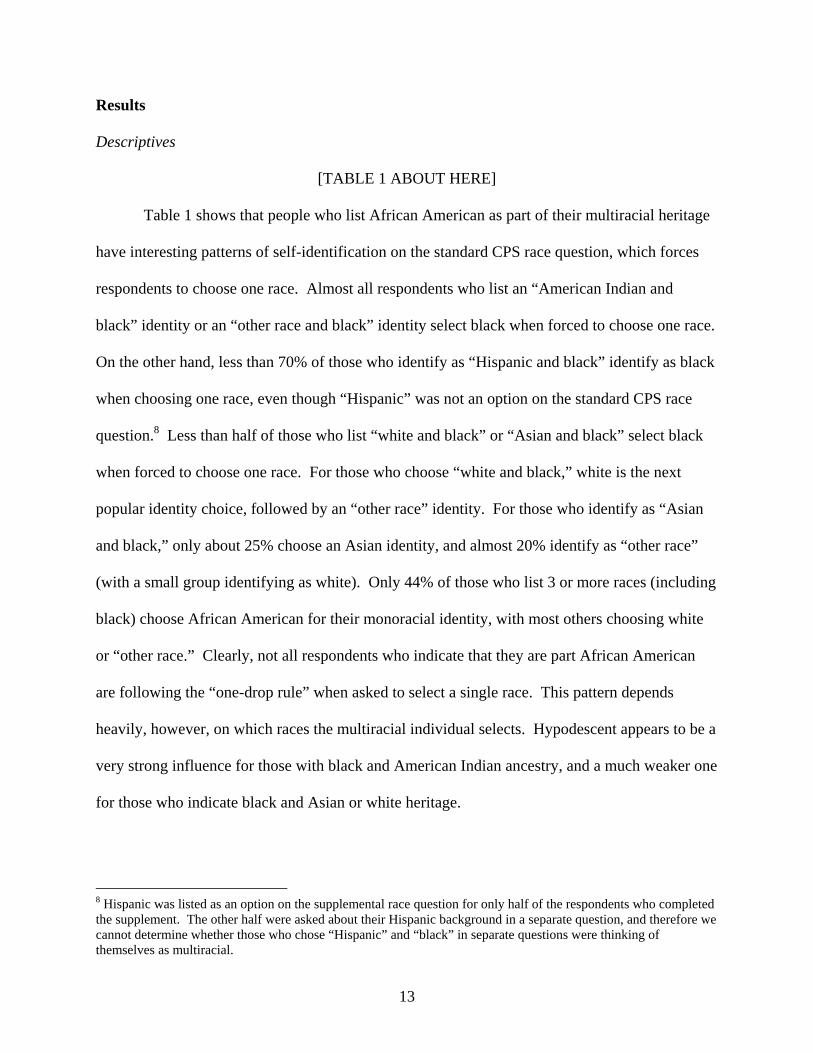
[TABLE 1 ABOUT HERE] Table 1 shows that people who list African American as part of their multiracial heritage
have interesting patterns of self-identification on the standard CPS race question, which forces
respondents to choose one race. Almost all respondents who list an “American Indian and
black” identity or an “other race and black” identity select black when forced to choose one race.
On the other hand, less than 70% of those who identify as “Hispanic and black” identify as black
when choosing one race, even though “Hispanic” was not an option on the standard CPS race
question.8 Less than half of those who list “white and black” or “Asian and black” select black
when forced to choose one race. For those who choose “white and black,” white is the next
popular identity choice, followed by an “other race” identity. For those who identify as “Asian
and black,” only about 25% choose an Asian identity, and almost 20% identify as “other race”
(with a small group identifying as white). Only 44% of those who list 3 or more races (including
black) choose African American for their monoracial identity, with most others choosing white
or “other race.” Clearly, not all respondents who indicate that they are part African American
are following the “one-drop rule” when asked to select a single race. This pattern depends
heavily, however, on which races the multiracial individual selects. Hypodescent appears to be a
very strong influence for those with black and American Indian ancestry, and a much weaker one
for those who indicate black and Asian or white heritage.
8 Hispanic was listed as an option on the supplemental race question for only half of the respondents who completed the supplement. The other half were asked about their Hispanic background in a separate question, and therefore we cannot determine whether those who chose “Hispanic” and “black” in separate questions were thinking of themselves as multiracial.

14
This pattern varies by age, as we would expect from previous research, which has
suggested that the “one-drop rule” had a more powerful influence before the civil rights
movement. First, as we see in Table 1a, there are fewer individuals in the group born before
1965 who assert any multiracial heritage, even though there are more people in the sample born
before 1965 (0.77 percent of the individuals born before 1965 in the total sample list more than
one race including African American, and 1.14 percent of individuals born after 1965 do). There
are two explanations for this higher rate of multiracial identification: either there has been a
significant increase in the number of multiracial individuals born in the last 30 years (and there
has certainly been some increase), or there are more individuals in the older generation than in
the younger generation who could identify as multiracial, but choose not to. It is likely that both
of these mechanisms are at work.
[TABLE 1A ABOUT HERE]
Second, for all multiracial categories, individuals born before 1965 are more likely to
select black as their monoracial identity than those born after 1965. Although some of these
results have to be viewed with caution due to the small sample sizes involved, purely descriptive
evidence does support the hypothesis that the “one-drop rule” is less powerful in the
determination of racial identity for multiracial individuals in younger generations.
Differences in the power of the “one-drop rule” might be strongly related to the reasons
that respondents give for identifying as multiracial. For example, individuals with parents of two
different races might be less likely to voluntarily exclude part of their heritage on forced-choice
questions, and so might resist giving a standard response to race questions (instead choosing an
option like “other race”). Individuals who are identifying as multiracial only for the more
generationally distant reason of having multiracial ancestry might be more influenced by the
15
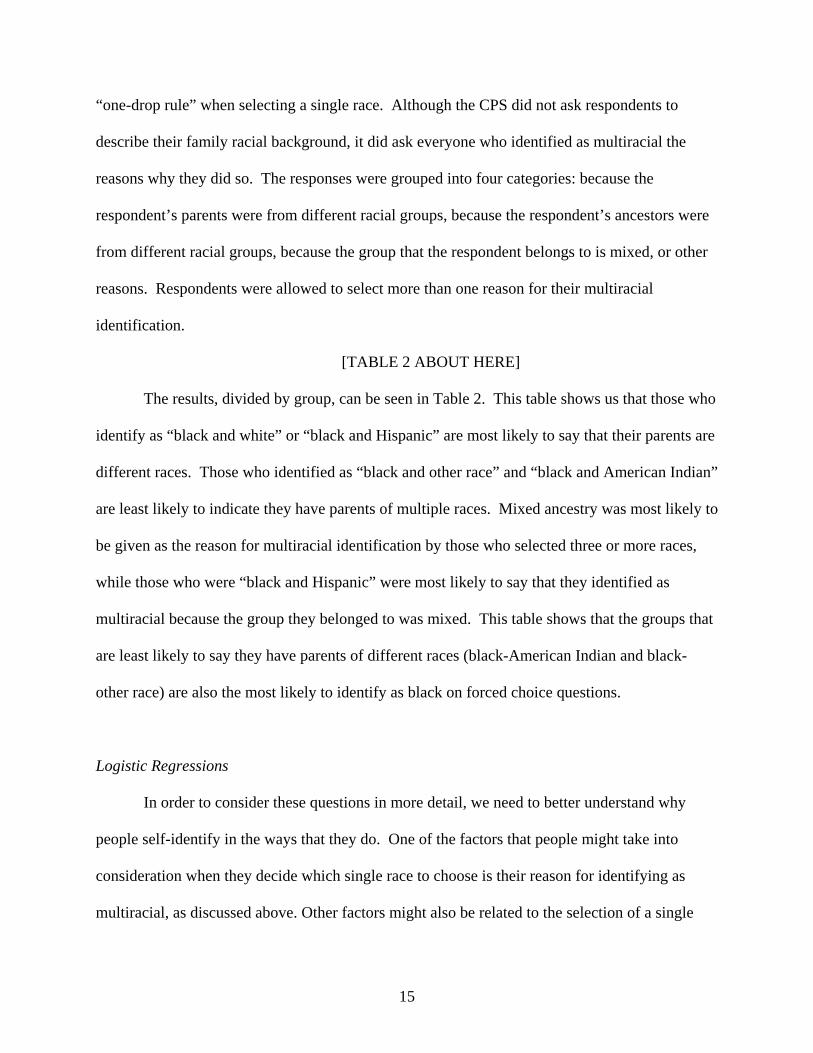
“one-drop rule” when selecting a single race. Although the CPS did not ask respondents to
describe their family racial background, it did ask everyone who identified as multiracial the
reasons why they did so. The responses were grouped into four categories: because the
respondent’s parents were from different racial groups, because the respondent’s ancestors were
from different racial groups, because the group that the respondent belongs to is mixed, or other
reasons. Respondents were allowed to select more than one reason for their multiracial
identification.
[TABLE 2 ABOUT HERE]
The results, divided by group, can be seen in Table 2. This table shows us that those who
identify as “black and white” or “black and Hispanic” are most likely to say that their parents are
different races. Those who identified as “black and other race” and “black and American Indian”
are least likely to indicate they have parents of multiple races. Mixed ancestry was most likely to
be given as the reason for multiracial identification by those who selected three or more races,
while those who were “black and Hispanic” were most likely to say that they identified as
multiracial because the group they belonged to was mixed. This table shows that the groups that
are least likely to say they have parents of different races (black-American Indian and black-
other race) are also the most likely to identify as black on forced choice questions.
Logistic Regressions
In order to consider these questions in more detail, we need to better understand why
people self-identify in the ways that they do. One of the factors that people might take into
consideration when they decide which single race to choose is their reason for identifying as
multiracial, as discussed above. Other factors might also be related to the selection of a single
16
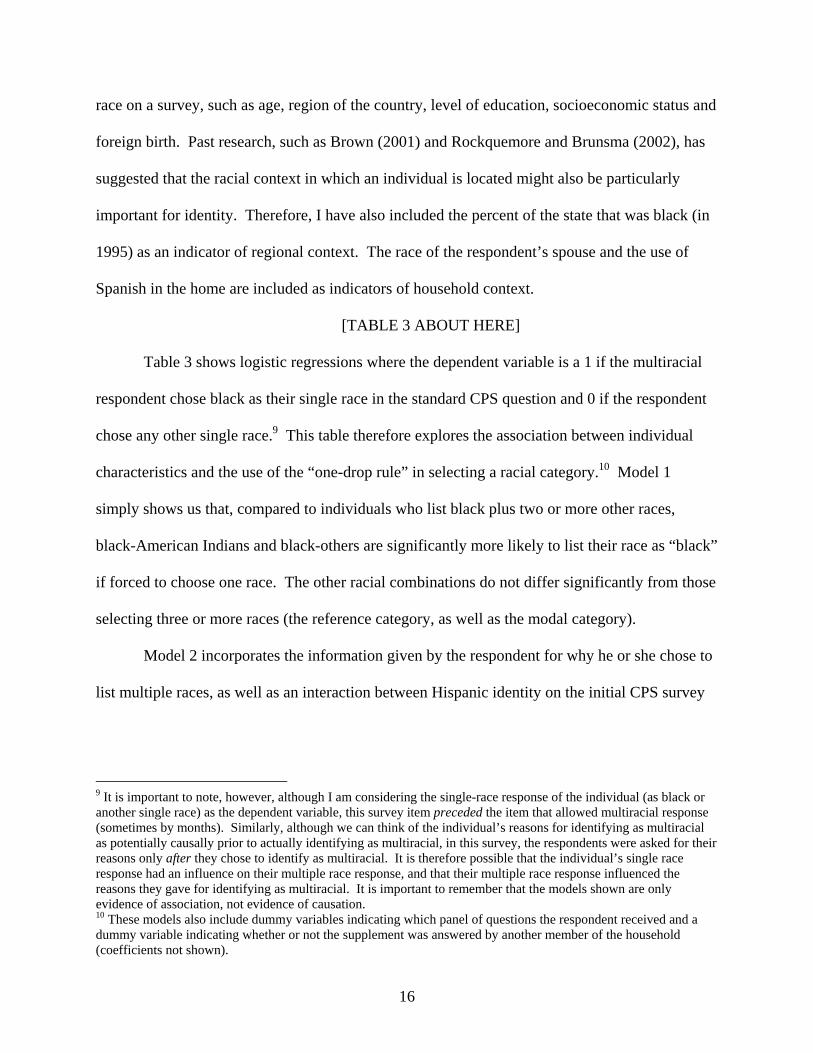
race on a survey, such as age, region of the country, level of education, socioeconomic status and
foreign birth. Past research, such as Brown (2001) and Rockquemore and Brunsma (2002), has
suggested that the racial context in which an individual is located might also be particularly
important for identity. Therefore, I have also included the percent of the state that was black (in
1995) as an indicator of regional context. The race of the respondent’s spouse and the use of
Spanish in the home are included as indicators of household context.
[TABLE 3 ABOUT HERE]
Table 3 shows logistic regressions where the dependent variable is a 1 if the multiracial
respondent chose black as their single race in the standard CPS question and 0 if the respondent
chose any other single race.9 This table therefore explores the association between individual
characteristics and the use of the “one-drop rule” in selecting a racial category.10 Model 1
simply shows us that, compared to individuals who list black plus two or more other races,
black-American Indians and black-others are significantly more likely to list their race as “black”
if forced to choose one race. The other racial combinations do not differ significantly from those
selecting three or more races (the reference category, as well as the modal category).
Model 2 incorporates the information given by the respondent for why he or she chose to
list multiple races, as well as an interaction between Hispanic identity on the initial CPS survey
9 It is important to note, however, although I am considering the single-race response of the individual (as black or another single race) as the dependent variable, this survey item preceded the item that allowed multiracial response (sometimes by months). Similarly, although we can think of the individual’s reasons for identifying as multiracial as potentially causally prior to actually identifying as multiracial, in this survey, the respondents were asked for their reasons only after they chose to identify as multiracial. It is therefore possible that the individual’s single race response had an influence on their multiple race response, and that their multiple race response influenced the reasons they gave for identifying as multiracial. It is important to remember that the models shown are only evidence of association, not evidence of causation. 10 These models also include dummy variables indicating which panel of questions the respondent received and a dummy variable indicating whether or not the supplement was answered by another member of the household (coefficients not shown).
17
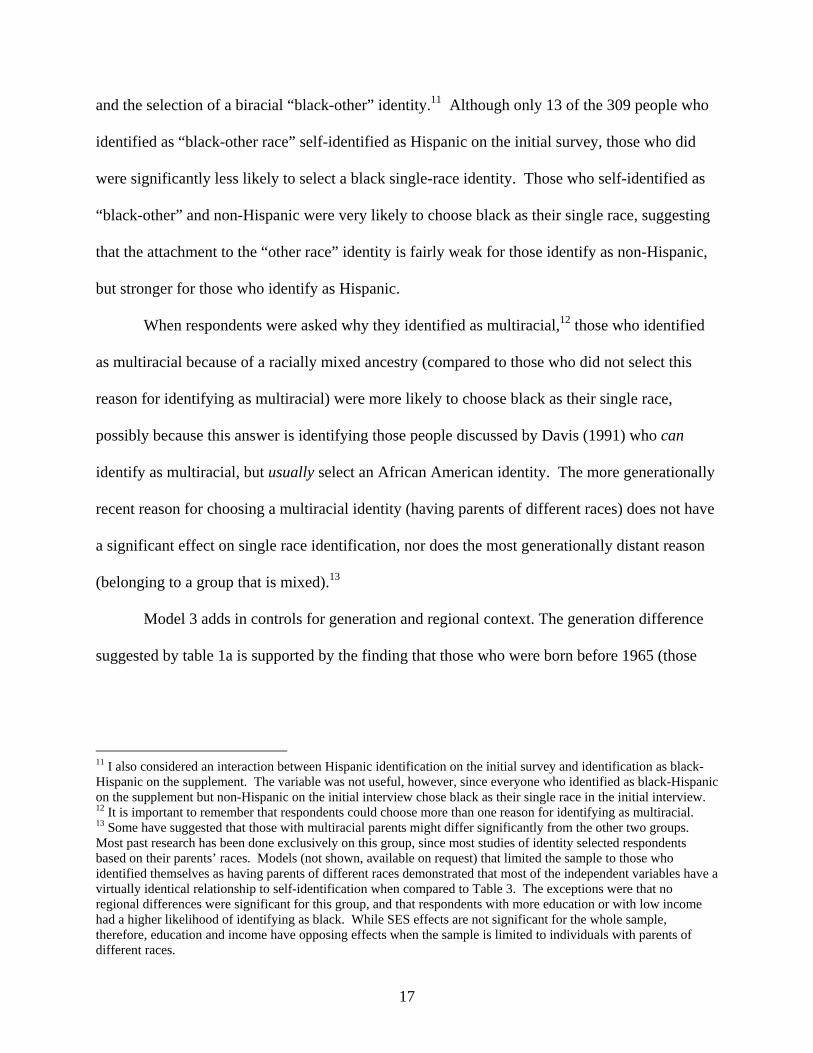
and the selection of a biracial “black-other” identity.11 Although only 13 of the 309 people who
identified as “black-other race” self-identified as Hispanic on the initial survey, those who did
were significantly less likely to select a black single-race identity. Those who self-identified as
“black-other” and non-Hispanic were very likely to choose black as their single race, suggesting
that the attachment to the “other race” identity is fairly weak for those identify as non-Hispanic,
but stronger for those who identify as Hispanic.
When respondents were asked why they identified as multiracial,12 those who identified
as multiracial because of a racially mixed ancestry (compared to those who did not select this
reason for identifying as multiracial) were more likely to choose black as their single race,
possibly because this answer is identifying those people discussed by Davis (1991) who can
identify as multiracial, but usually select an African American identity. The more generationally
recent reason for choosing a multiracial identity (having parents of different races) does not have
a significant effect on single race identification, nor does the most generationally distant reason
(belonging to a group that is mixed).13
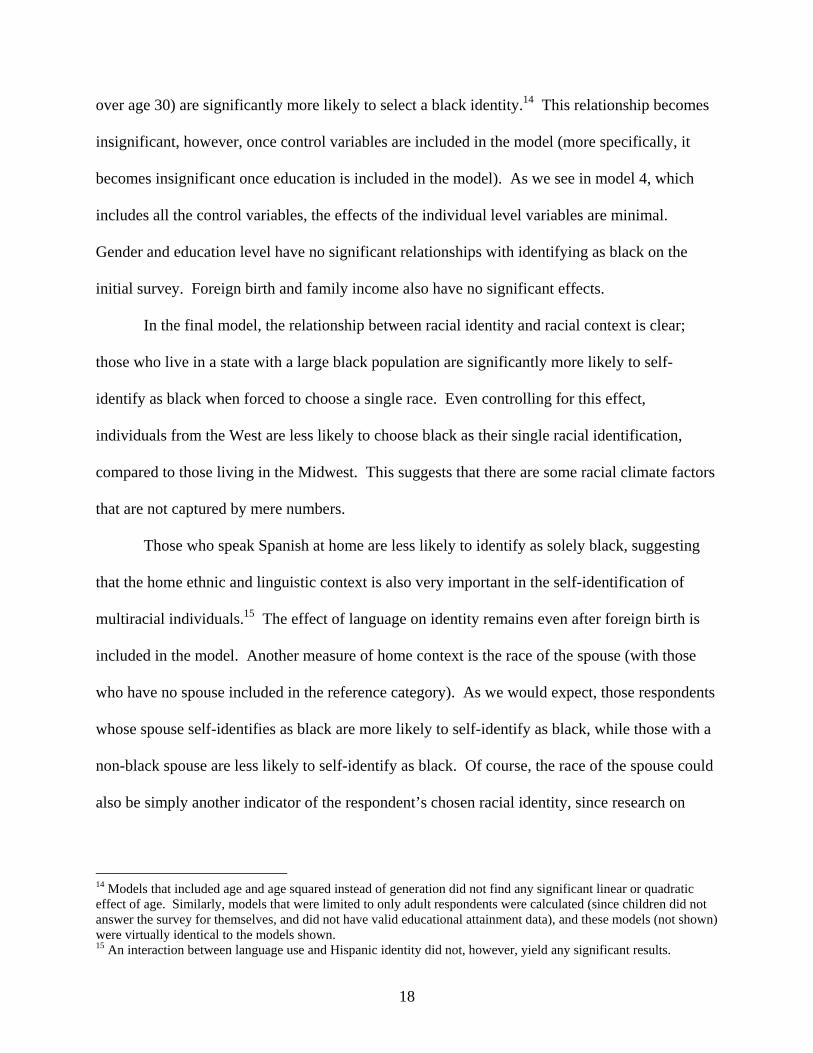
Model 3 adds in controls for generation and regional context. The generation difference
suggested by table 1a is supported by the finding that those who were born before 1965 (those
11 I also considered an interaction between Hispanic identification on the initial survey and identification as black-Hispanic on the supplement. The variable was not useful, however, since everyone who identified as black-Hispanic on the supplement but non-Hispanic on the initial interview chose black as their single race in the initial interview. 12 It is important to remember that respondents could choose more than one reason for identifying as multiracial. 13 Some have suggested that those with multiracial parents might differ significantly from the other two groups. Most past research has been done exclusively on this group, since most studies of identity selected respondents based on their parents’ races. Models (not shown, available on request) that limited the sample to those who identified themselves as having parents of different races demonstrated that most of the independent variables have a virtually identical relationship to self-identification when compared to Table 3. The exceptions were that no regional differences were significant for this group, and that respondents with more education or with low income had a higher likelihood of identifying as black. While SES effects are not significant for the whole sample, therefore, education and income have opposing effects when the sample is limited to individuals with parents of different races.
18
over age 30) are significantly more likely to select a black identity.14 This relationship becomes
insignificant, however, once control variables are included in the model (more specifically, it
becomes insignificant once education is included in the model). As we see in model 4, which
includes all the control variables, the effects of the individual level variables are minimal.
Gender and education level have no significant relationships with identifying as black on the
initial survey. Foreign birth and family income also have no significant effects.
In the final model, the relationship between racial identity and racial context is clear;
those who live in a state with a large black population are significantly more likely to self-
identify as black when forced to choose a single race. Even controlling for this effect,
individuals from the West are less likely to choose black as their single racial identification,
compared to those living in the Midwest. This suggests that there are some racial climate factors
that are not captured by mere numbers.
Those who speak Spanish at home are less likely to identify as solely black, suggesting
that the home ethnic and linguistic context is also very important in the self-identification of
multiracial individuals.15 The effect of language on identity remains even after foreign birth is
included in the model. Another measure of home context is the race of the spouse (with those
who have no spouse included in the reference category). As we would expect, those respondents
whose spouse self-identifies as black are more likely to self-identify as black, while those with a
non-black spouse are less likely to self-identify as black. Of course, the race of the spouse could
also be simply another indicator of the respondent’s chosen racial identity, since research on
14 Models that included age and age squared instead of generation did not find any significant linear or quadratic effect of age. Similarly, models that were limited to only adult respondents were calculated (since children did not answer the survey for themselves, and did not have valid educational attainment data), and these models (not shown) were virtually identical to the models shown. 15 An interaction between language use and Hispanic identity did not, however, yield any significant results.
19
adolescent multiracial Americans has found that youth feel pressure to develop peer and dating
networks that reflect their own racial identification (Twine 1996; Korgen 1998).
Multinomial logit model
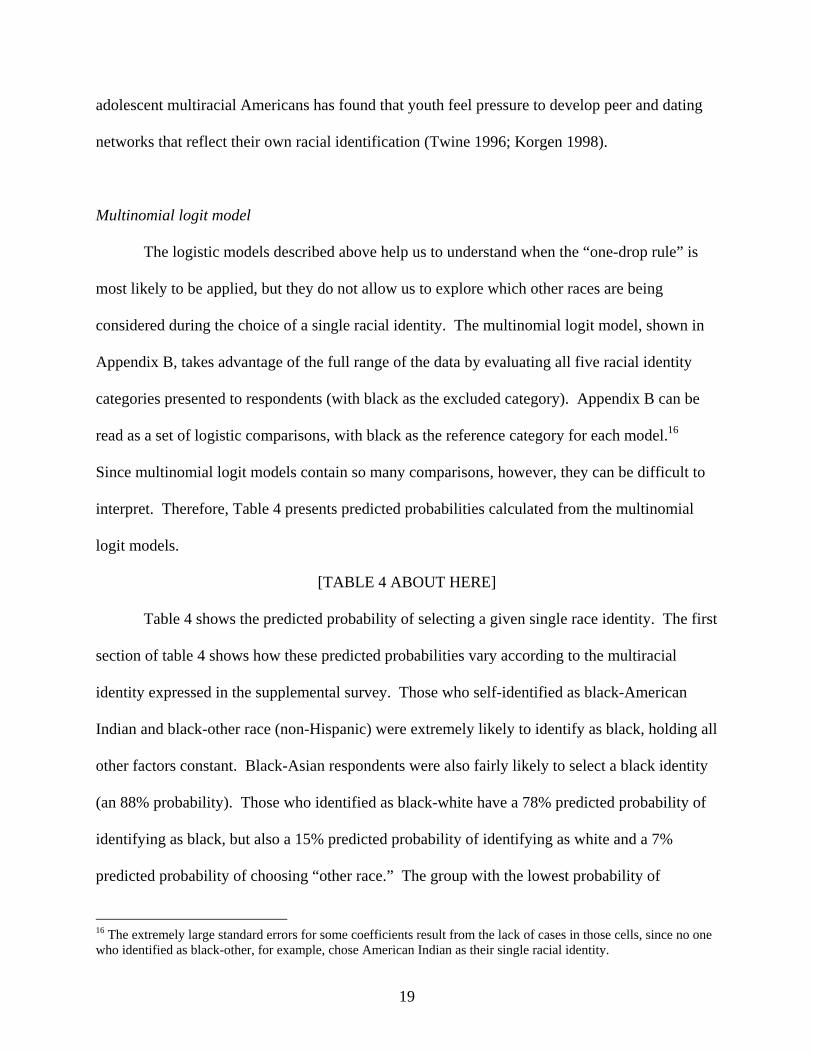
The logistic models described above help us to understand when the “one-drop rule” is
most likely to be applied, but they do not allow us to explore which other races are being
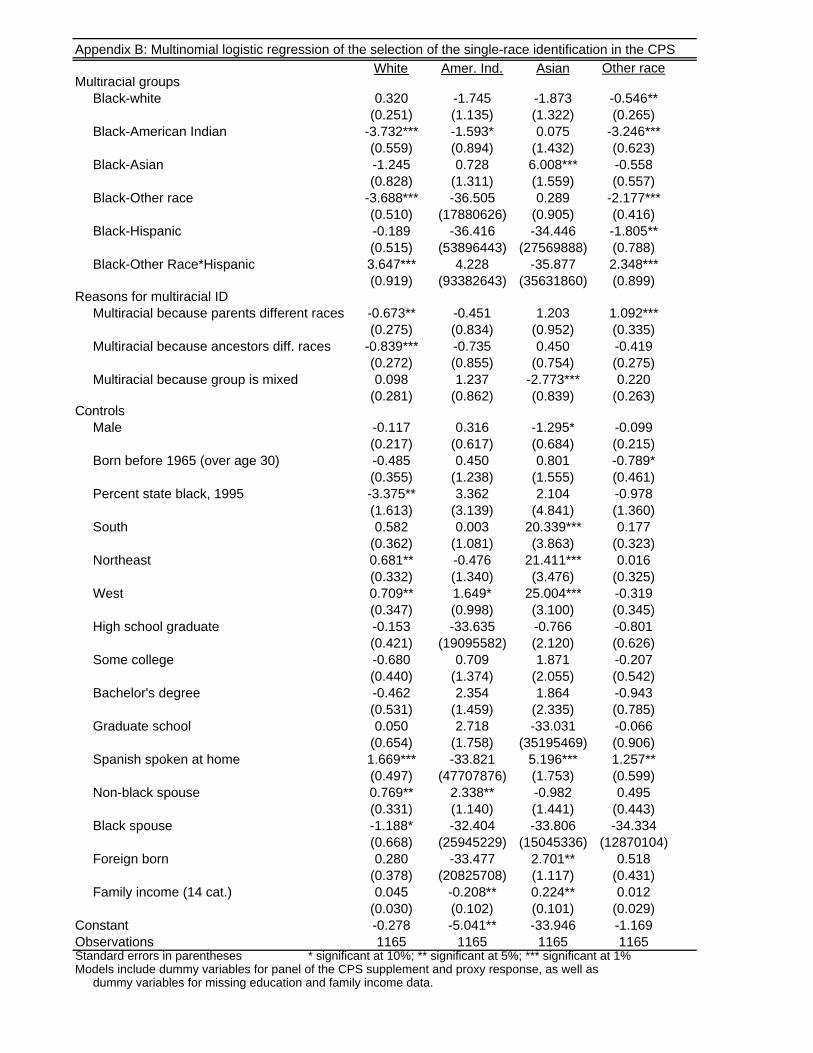
considered during the choice of a single racial identity. The multinomial logit model, shown in
Appendix B, takes advantage of the full range of the data by evaluating all five racial identity
categories presented to respondents (with black as the excluded category). Appendix B can be
read as a set of logistic comparisons, with black as the reference category for each model.16
Since multinomial logit models contain so many comparisons, however, they can be difficult to
interpret. Therefore, Table 4 presents predicted probabilities calculated from the multinomial
logit models.
[TABLE 4 ABOUT HERE]
Table 4 shows the predicted probability of selecting a given single race identity. The first
section of table 4 shows how these predicted probabilities vary according to the multiracial
identity expressed in the supplemental survey. Those who self-identified as black-American
Indian and black-other race (non-Hispanic) were extremely likely to identify as black, holding all
other factors constant. Black-Asian respondents were also fairly likely to select a black identity
(an 88% probability). Those who identified as black-white have a 78% predicted probability of
identifying as black, but also a 15% predicted probability of identifying as white and a 7%
predicted probability of choosing “other race.” The group with the lowest probability of
16 The extremely large standard errors for some coefficients result from the lack of cases in those cells, since no one who identified as black-other, for example, chose American Indian as their single racial identity.

20
selecting a black identity, black-other race (Hispanic) respondents, were quite likely to choose a
white (10%) or “other race” (14%) identity. A similar pattern emerges for respondents who
chose more than two races. Surprisingly, those who identified as black-Hispanic have a greater
probability of identifying as white (10%) than “other race” (2%).
The first panel shows, therefore, that while predicted probabilities of choosing a black
single race identity remain high for all categories, several categories also show significant
probabilities for white and “other race” identification, especially for those who identify as black-
white, black-other (Hispanic), and more than two races.
The second panel of Table 4 shows how the reasons for identifying as multiracial are
associated with the single race chosen in the initial survey. Those who identified as multiracial
solely because their parents were different races were quite likely (38% predicted probability) to
identify as “other race,” rejecting the standard U.S. racial categories. Those who identified as
multiracial solely because their ancestors were different races had a sizable probability of
identifying as white or “other race” (more than 10% for each), but also had a higher probability
of identifying as black than those who identified as multiracial because of parents of different
races. The final reason, identifying as multiracial because the group is mixed, was associated
with a fairly high probability of identifying as white (21%), and an intermediate level of
identification with black (60%) and “other race” (18%).
Discussion
These results show mixed support for the hypothesis that the “one-drop rule” is no longer
the dominant self-identification paradigm used by multiracial people with some African
American heritage. When respondents are forced to choose a single race, black remains the

21
modal choice for all the multiracial groups. Tables 1, 3 and 4 show that some groups, such as
black-American Indians, do tend to overwhelmingly identify as black in monoracial questions,
suggesting that the “one-drop rule” still has the power to affect racial identities. Other groups do
not follow the same pattern, however, and regional and home contextual factors have significant
effects, so it is possible that hypodescent is influential only in certain situations. Table 2
suggests these patterns might be related to reasons for claiming a multiracial identity; the two
groups most likely to identify as black (black-American Indians and black-Others) are also the
two groups least likely to say they have parents of different races. The groups least likely to
identify as black (black-Asians and black-whites) are much more likely to indicate they have
parents of different races.
Table 3 tests the question of what individual factors are related to a multiracial
individual’s choice of black as a monoracial identity, and they demonstrate that indeed the
pattern varies significantly by multiracial groups. These findings suggest that hypodescent is no
longer the nationwide standard, but instead has more power for some groups than others. Of
course, with cross-sectional data it is impossible to tell whether these individual factors are
causing racial identification, or whether the racial identification is causing these individual
factors (for example, it is possible that multiracial people who do not want to be identified solely
as black move to the West, and it is possible that living in the West has an effect on people’s
ideas about racial identification).
The multinomial logit model in Appendix B and the predicted probabilities shown in
table 4 make it clear that these patterns also vary across the possible racial identities. An
unexpected finding in table 3, the lack of a significant relationship between having parents of
different races and the choice of a black identity, is clarified in table 4, which shows that those

22
who have parents of different races are relatively unlikely to choose a white, American Indian, or
Asian identity, but are quite likely to choose an “other race” identity, rejecting the standard racial
options on surveys.
The controls I introduced to help understand the use of the “one-drop rule” did not,
however, “explain away” the multiracial group differences in African American identity choices.
Respondents who identify as “black and American Indian” continue to be the most likely to
select black as their single racial identification even after controls for education, regional
context, home context, age, and reason for multiracial identification. It seems most likely,
therefore, that these group differences are created not by differences in average individual
characteristics, but instead by the very different histories of these groups. Blacks and American
Indians have a long history of intermarriage in the United States, so we may be seeing patterns of
identification that have had a very long history in families (or we may be seeing more
identification with ancestors who are quite far in the past, possibly due to more positive feelings
about American Indian ancestors). Black and white intermarriage, on the other hand, has had a
very different and more contentious history, so we would expect different forces to be at work
for identity choices. The link between the history of intermarriage and racial identity is not
direct, but it is meaningful, as is frequently reflected in the responses of interviewees. Williams
and Thornton (1998) noted that their respondents were very aware of the histories of racial
groups, and discussed the history of oppression for different groups when they explained their
racial identity.
This research confirms, therefore, that there are some groups who seem to feel little
obligation to follow the “one-drop rule” when identifying with a single race. While the “rule”
appears to be weakening, however, there may be other factors at work that help to maintain its

23
power, such as the emphasis on solidarity within the black community, and historical differences
in patterns of oppression and intermarriage. It is also important to remember that this is a
conservative test of the strength of the “one-drop rule,” because if it is truly dominating our
society today, many people who could claim a multiracial identity will instead simply identify as
black, and will therefore not be included in survey data on multiracial Americans.
Conclusion
Black identity is more nuanced and complex than researchers have generally
acknowledged. The assumption that black identity is a straightforward, unambiguous construct is
clearly out of date; the “rule” that was once seen as a rigid boundary defining black identities has
become increasingly flexible and fluid over time. Multiracial respondents with some African
American ancestry help to illustrate this point; their identity choices range across all of the
possibilities, and cannot easily be described by an identity “rule” such as the “one-drop rule.”
Future work, then, needs to continue to consider how multiracial Americans fit into the
current racial identity constructs. Future surveys should learn from the May 1995 CPS
Supplement and construct their questions regarding race with care. The CPS experiment teaches
us that questions about racial identification must be carefully written and that, if researchers need
multiple kinds of race data (such as multiracial information and a single racial identity for each
respondent) it is far better to ask multiple race questions than to recode people into the necessary
racial categories by some arbitrary algorithm.
Some of the questions this work raises can, of course, only be investigated using more in-
depth interview studies. In order to better understand the meaning of the patterns seen here, we
need more studies that compare the single and multiple race responses of individuals, and ask

24
respondents why they chose to identify as they did in each question. We also need to discover
how the expressed race of survey respondents intersects with other meaningful aspects of race,
such as the ways they are identified by others, in order to more fully understand what surveys are
(and are not) capable of teaching us about racial identities.

25
WORKS CITED
Baird-Olson, Karren. 2003. “Colonization, Cultural Imperialism, and the Social Construction of American Indian Mixed-Blood Identity.” Pp. 194-221 in Winters, Loretta I. and Herman L. DeBose, eds. New Faces in a Changing America. Thousand Oaks, CA: Sage Publications.
Brooks, James F. 1998. “Confounding the Color Line: Indian-Black Relations in Historical and Anthropological Perspective.” American Indian Quarterly 22: 125-34.
Brown, Ursula M. 2001. The Interracial Experience: Growing Up Black/White Racially Mixed in the United States. Westport, CT: Praeger Publishers.
Brunsma, David L. and Kerry Ann Rockquemore. 2002. “What Does ‘Black’ Mean? Exploring the Epistemological Stranglehold of Racial Categorization.” Critical Sociology 28: 101-21.
Daniel, G. Reginald. 2003. “Multiracial Identity in Global Perspective: The United States, Brazil,
and South Africa.” Pp. 247-286 in Winters, Loretta I. and Herman L. DeBose, eds. New Faces in a Changing America. Thousand Oaks, CA: Sage Publications.
Davis, F. James. 1991. Who is Black? One Nation’s Definition. University Park: Pennsylvania
State University Press. DeBose, Herman L. and Loretta I. Winters. 2003. “The Dilemma of Biracial People of African
American Descent.” Pp. 127-57 in Winters, Loretta I. and Herman L. DeBose, eds. New Faces in a Changing America. Thousand Oaks, CA: Sage Publications.
Denton, Nancy and Douglas Massey. 1989. “Racial Identity among Caribbean Hispanics: The
Effect of Double Minority Status on Residential Segregation.” American Sociological Review 54: 790-808.
Drake, St. Clair and Horace R. Cayton. 1945. Black Metropolis: A Study of Negro Life in a
Northern City. Chicago: University of Chicago Press. Eschbach, Karl. 1995. “The Enduring and Vanishing American Indian: American Indian
population growth and intermarriage in 1990.” Ethnic and Racial Studies 18: 89-109. Farley, Reynolds. 1999. “Racial Issues: Recent Trends in Residential Patterns and
Intermarriage.” P. 85-128 in Smelser, Neil J. and Jeffrey C. Alexander, eds. Diversity and Its Discontents: Cultural Conflict and Common Ground in Contemporary American Society. Princeton, NJ: Princeton University Press.
Hall, Christine C Iijima. 1992. “Please Choose One: Ethnic Identity Choices for Biracial
Individuals.” P. 250-64 in Root, Maria P.P., ed. Racially Mixed People in America. Newbury Park: Sage Publications.

26
Harris, David R. 2002. “In the eye of the beholder: Observed race and observer characteristics.” PSC Research Report No. 02-522. Population Studies Center at the Institute for Social Research, University of Michigan.
Harris, David R. and Jeremiah Joseph Sim. 2002. “Who Is Multiracial? Assessing the
Complexity of Lived Race.” American Sociological Review 76: 614-27. Jones, Nicholas A. and Amy Symens Smith. 2001. “The Two or More Races Population: 2000.”
Census 2000 Brief. Washington, DC: U.S. Census Bureau. Available on the web at http://www.census.gov/prod/2001pubs/c2kbr01-6.pdf.
Korgen, Kathleen Odell. 1998. From black to biracial: Transforming racial identity among
Americans. Westport, CT: Praeger. Long, J. Scott. 1997. Regression Models for Categorical and Limited Dependent Variables.
Thousand Oaks, CA: Sage Publications. Mandell, Daniel R. 1998. “Shifting Boundaries of Race and Ethnicity: Indian-Black
Intermarriage in Southern New England, 1760-1880.” The Journal of American History 85: 466-502.
Murguia, Edward and Edward E. Telles. 1996. “Phenotype and Schooling among Mexican Americans.” Sociology of Education 69(4): 276-289.
Nobles, Melissa. 2002. “Lessons from Brazil: The Ideational and Political Dimensions of Multiraciality.” Pp. 300-17 in Perlmann, Joel and Mary C. Waters, eds. The New Race Question: How the Census Counts Multiracial Individuals. New York City: Russell Sage Foundation.
Park, Robert. 1928. “Human migration and the marginal man.” American Journal of Sociology
33: 881-93. Perdue, Theda. 1979. Slavery and the Evolution of Cherokee Society. Knoxville: University of
Tennessee Press. Perlmann, Joel and Mary C. Waters, eds. 2002. The New Race Question: How the Census Counts
Multiracial Individuals. New York City: Russell Sage Foundation. Qian, Zhenchao. 1997. “Breaking the Racial Barriers: Variations in Interracial Marriage between
1980 and 1990.” Demography 34: 263-76. Rockquemore, Kerry Ann and David L. Brunsma. 2002. Beyond Black: Biracial Identity in
America. Thousand Oaks, CA: Sage Publications. Rodriguez, Clara E. 2000. Changing Race: Latinos, the Census, and the History of Ethnicity in
the United States. New York: New York University Press.

27
Root, Maria P.P. 1996. The multiracial experience: Racial borders as the new frontier. Thousand Oaks, CA: Sage Publications.
Sandefur, Gary D., Molly Martin, Jennifer Eggerling-Boeck, Susan E. Mannon, and Ann M.
Meier. 2001. “An overview of racial and ethnic demographic trends.” Pp. 40-102 in Neil J. Smelser, William Julius Wilson, and Faith Mitchell, eds. America Becoming: Racial trends and their consequences. Washington, DC: National Academy Press.
Spickard, Paul R. 1992. “The Illogic of American Racial Categories.” Pp. 12-23 in Root, Maria,
ed. Racially Mixed People in America. Newbury Park: Sage Publications. Tucker, Clyde et al. 1996. “Testing Methods of Collecting Racial and Ethnic Information:
Results of the Current Population Survey Supplement on Race and Ethnicity.” BLS Statistical Notes #40. Available on the web at http://www.bls.census.gov/cps/racethn/1995/stat40rp.htm.
Twine, Frances Winddance. 1996. “Heterosexual alliances: The romantic management of racial
identity.” Pp. 291-304 in Maria P.P. Root, ed. The multiracial experience: Racial borders as the new frontier. Thousand Oaks, CA: Sage Publications.
Williams, Teresa Kay and Michael C. Thornton. 1998. “Social Construction of Ethnicity Versus
Personal Experience: The Case of Afro-Amerasians.” Journal of Comparative Family Studies 29: 255-67.
Williams-León, Teresa. 2003. “Check All That Apply: Trends and Prospectives Among Asian-
Descent Multiracials.” Pp. 158-75 in Winters, Loretta I. and Herman L. DeBose, eds. New Faces in a Changing America. Thousand Oaks, CA: Sage Publications.
Williamson, Joel. 1980. New People: Miscegenation and Mulattoes in the United States. New
York: The Free Press. Xie, Yu and Kimberly Goyette. 1997. “The Racial Identification of Biracial Children with One
Asian Parent: Evidence from the 1990 Census.” Social Forces 76: 547-70.

Table 1: The racial identification of multiracial individuals with African American heritage in the CPS
Racial Identificationon the Supplement White Black American Indian Asian Other TOTAL
Black and one raceWhite 32% 47% 1% 1% 20% 194American Indian 2% 96% 1% 0% 1% 249Asian 6% 47% 3% 25% 19% 32Other 3% 92% -- 2% 4% 309Hispanic* 27% 67% -- -- 7% 30
Black and two+ races 27% 44% 2% 3% 25% 351
*Hispanic was listed as a race only in supplement panels 3 & 4, given to half the sample
Table 1a: The racial identification of multiracial individuals with African American heritage, by age
Racial Identificationon the Supplement White Black American Indian Asian Other TOTAL
Black and one raceWhite 28% 45% -- -- 27% 139American Indian -- 95% 2% 1% 2% 104Asian 8% 44% -- 24% 24% 25Other 3% 88% -- 4% 5% 123Hispanic* 33% 62% -- -- 5% 21
Black and two+ races 22% 39% 3% 4% 32% 223
Racial Identificationon the Supplement White Black American Indian Asian Other TOTAL
Black and one raceWhite 42% 51% 2% 2% 4% 55American Indian 3% 96% 1% -- 1% 145Asian -- 57% 14% 29% -- 7Other 3% 94% -- -- 3% 186Hispanic* 11% 78% -- -- 11% 9
Black and two+ races 35% 52% 2% 1% 11% 128
*Hispanic was listed as a race only in supplement panels 3 & 4, given to half the sample
Source: Calculations of the author using the May 1995 CPS Supplement
Racial Identification on the Standard CPS question
Respondents born before 1965 (over age 30)
Respondents born in 1965 or after (age 30 and younger)
Racial Identification on the Standard CPS question
Racial Identification on the Standard CPS question

Table 2: Reasons for multiracial identification for individuals with African American heritage in the CPS
Racial Identificationon the Supplement Ancestors mixed N
Black and one raceWhite 53% 194American Indian 47% 249Asian 56% 32Other 34% 309Hispanic* 43% 30
Black and two+ races 62% 351
*Hispanic was listed as a race only in supplement panels 3 & 4, given to half the sample
Source: Calculations of the author using the May 1995 CPS Supplement
Mixed group
46%31%38%29%53%49%
56%26%70%63%
Reason for Multiracial IdentificationParents mixed
69%31%
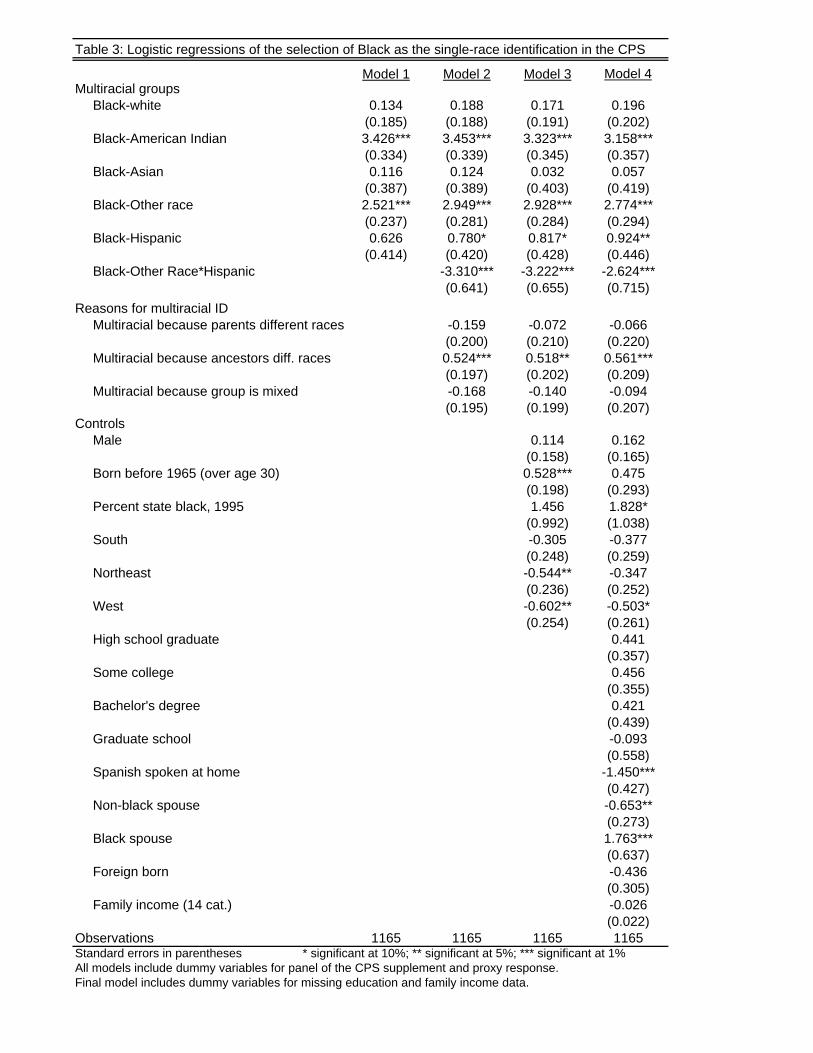
Table 3: Logistic regressions of the selection of Black as the single-race identification in the CPS
Model 1 Model 2 Model 3 Model 4Multiracial groups
Black-white 0.134 0.188 0.171 0.196(0.185) (0.188) (0.191) (0.202)
Black-American Indian 3.426*** 3.453*** 3.323*** 3.158***(0.334) (0.339) (0.345) (0.357)
Black-Asian 0.116 0.124 0.032 0.057(0.387) (0.389) (0.403) (0.419)
Black-Other race 2.521*** 2.949*** 2.928*** 2.774***(0.237) (0.281) (0.284) (0.294)
Black-Hispanic 0.626 0.780* 0.817* 0.924**(0.414) (0.420) (0.428) (0.446)
Black-Other Race*Hispanic -3.310*** -3.222*** -2.624***(0.641) (0.655) (0.715)
Reasons for multiracial IDMultiracial because parents different races -0.159 -0.072 -0.066
(0.200) (0.210) (0.220)Multiracial because ancestors diff. races 0.524*** 0.518** 0.561***
(0.197) (0.202) (0.209)Multiracial because group is mixed -0.168 -0.140 -0.094
(0.195) (0.199) (0.207)Controls
Male 0.114 0.162(0.158) (0.165)
Born before 1965 (over age 30) 0.528*** 0.475(0.198) (0.293)
Percent state black, 1995 1.456 1.828*(0.992) (1.038)
South -0.305 -0.377(0.248) (0.259)
Northeast -0.544** -0.347(0.236) (0.252)
West -0.602** -0.503*(0.254) (0.261)
High school graduate 0.441(0.357)
Some college 0.456(0.355)
Bachelor's degree 0.421(0.439)
Graduate school -0.093(0.558)
Spanish spoken at home -1.450***(0.427)
Non-black spouse -0.653**(0.273)
Black spouse 1.763***(0.637)
Foreign born -0.436(0.305)
Family income (14 cat.) -0.026(0.022)
Observations 1165 1165 1165 1165Standard errors in parentheses * significant at 10%; ** significant at 5%; *** significant at 1%All models include dummy variables for panel of the CPS supplement and proxy response.Final model includes dummy variables for missing education and family income data.
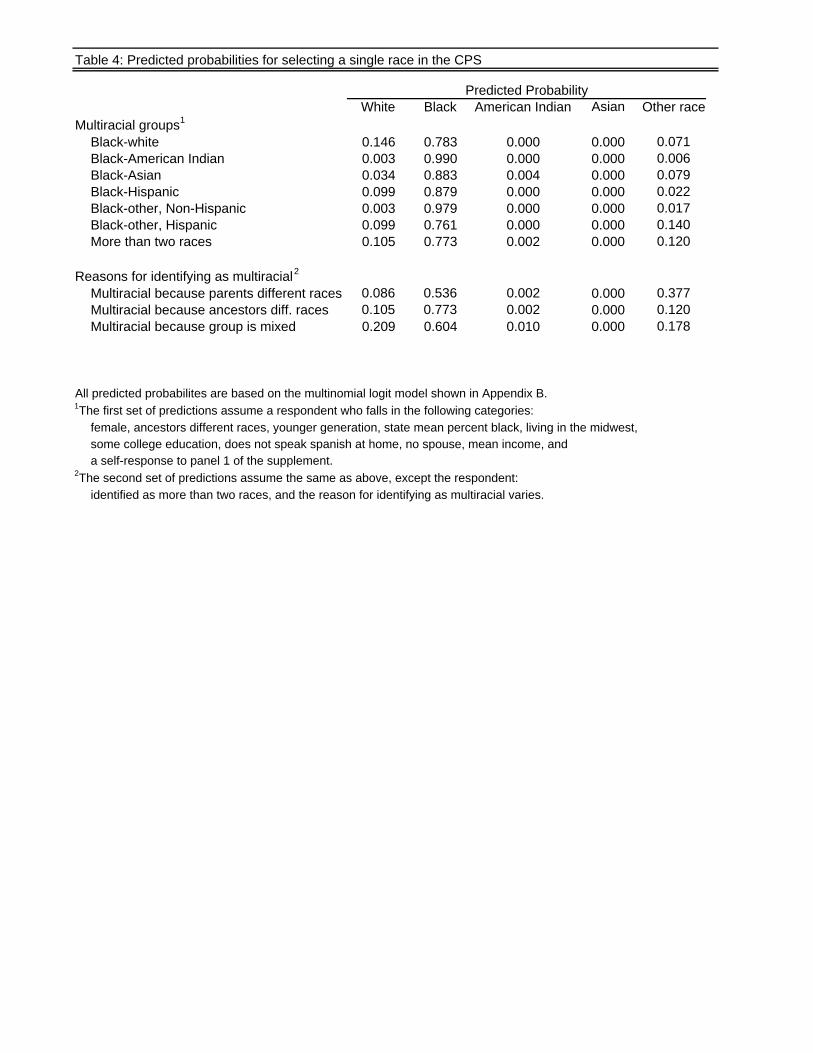
Table 4: Predicted probabilities for selecting a single race in the CPS
White Black American Indian Asian Other raceMultiracial groups1
Black-white 0.146 0.783 0.000 0.000 0.071Black-American Indian 0.003 0.990 0.000 0.000 0.006Black-Asian 0.034 0.883 0.004 0.000 0.079Black-Hispanic 0.099 0.879 0.000 0.000 0.022Black-other, Non-Hispanic 0.003 0.979 0.000 0.000 0.017Black-other, Hispanic 0.099 0.761 0.000 0.000 0.140More than two races 0.105 0.773 0.002 0.000 0.120
Reasons for identifying as multiracial2
Multiracial because parents different races 0.086 0.536 0.002 0.000 0.377Multiracial because ancestors diff. races 0.105 0.773 0.002 0.000 0.120Multiracial because group is mixed 0.209 0.604 0.010 0.000 0.178
All predicted probabilites are based on the multinomial logit model shown in Appendix B.1The first set of predictions assume a respondent who falls in the following categories:
female, ancestors different races, younger generation, state mean percent black, living in the midwest,some college education, does not speak spanish at home, no spouse, mean income, and a self-response to panel 1 of the supplement.
2The second set of predictions assume the same as above, except the respondent:identified as more than two races, and the reason for identifying as multiracial varies.
Predicted Probability
Total N: 1165Single race identification (on initial CPS survey)
White 15.5%Black 68.8%American Indian 1.1%Asian 2.1%Other race 12.6%
Multiple race identification (on supplemental survey)Black-white 16.7%Black-American Indian 21.4%Black-Asian 2.7%Black-Other race 26.5%Black-Hispanic 2.6%Black-Other race*Hispanic 1.1%More than two races (ref.) 30.1%
Reason for identifying as multiracialMultiracial because parents different races 47.1%Multiracial because ancestors diff. races 49.0%Multiracial because group is mixed 39.1%
ControlsMale 42.2%Born before 1965 (over age 30) 45.5%Mean percent of state black (1995) 15.7%South 39.5%Northeast 25.9%West 16.0%Midwest (ref.) 18.6%Less than high school grad (ref.) 12.3%High school graduate 16.7%Some college 17.4%Bachelor's degree 7.6%Graduate school 3.3%Education missing (respondents younger than 22) 42.3%Spanish spoken at home 3.9%Non-black spouse 13.0%Black spouse 8.9%No spouse (or race missing) (ref.) 78.1%Foreign born 9.7%Mean family income (14 categories) 7.27 (7="20K to 24,999," 8="25K to 29,999")Family income missing 6.0%
Controls for panel responsePanel 1 (ref.) 29.2%Panel 2 24.3%Panel 3 25.9%Panel 4 20.6%Supplement answered by self (ref.) 45.8%Supplement answered by proxy 54.2%
Appendix Table A: Descriptive statistics for all respondents who identified as multiracial and part African-American
Appendix B: Multinomial logistic regression of the selection of the single-race identification in the CPSWhite Amer. Ind. Asian Other race
Multiracial groupsBlack-white 0.320 -1.745 -1.873 -0.546**
(0.251) (1.135) (1.322) (0.265)Black-American Indian -3.732*** -1.593* 0.075 -3.246***
(0.559) (0.894) (1.432) (0.623)Black-Asian -1.245 0.728 6.008*** -0.558
(0.828) (1.311) (1.559) (0.557)Black-Other race -3.688*** -36.505 0.289 -2.177***
(0.510) (17880626) (0.905) (0.416)Black-Hispanic -0.189 -36.416 -34.446 -1.805**
(0.515) (53896443) (27569888) (0.788)Black-Other Race*Hispanic 3.647*** 4.228 -35.877 2.348***
(0.919) (93382643) (35631860) (0.899)Reasons for multiracial ID
Multiracial because parents different races -0.673** -0.451 1.203 1.092***(0.275) (0.834) (0.952) (0.335)
Multiracial because ancestors diff. races -0.839*** -0.735 0.450 -0.419(0.272) (0.855) (0.754) (0.275)
Multiracial because group is mixed 0.098 1.237 -2.773*** 0.220(0.281) (0.862) (0.839) (0.263)
ControlsMale -0.117 0.316 -1.295* -0.099
(0.217) (0.617) (0.684) (0.215)Born before 1965 (over age 30) -0.485 0.450 0.801 -0.789*
(0.355) (1.238) (1.555) (0.461)Percent state black, 1995 -3.375** 3.362 2.104 -0.978
(1.613) (3.139) (4.841) (1.360)South 0.582 0.003 20.339*** 0.177
(0.362) (1.081) (3.863) (0.323)Northeast 0.681** -0.476 21.411*** 0.016
(0.332) (1.340) (3.476) (0.325)West 0.709** 1.649* 25.004*** -0.319
(0.347) (0.998) (3.100) (0.345)High school graduate -0.153 -33.635 -0.766 -0.801
(0.421) (19095582) (2.120) (0.626)Some college -0.680 0.709 1.871 -0.207
(0.440) (1.374) (2.055) (0.542)Bachelor's degree -0.462 2.354 1.864 -0.943
(0.531) (1.459) (2.335) (0.785)Graduate school 0.050 2.718 -33.031 -0.066
(0.654) (1.758) (35195469) (0.906)Spanish spoken at home 1.669*** -33.821 5.196*** 1.257**
(0.497) (47707876) (1.753) (0.599)Non-black spouse 0.769** 2.338** -0.982 0.495
(0.331) (1.140) (1.441) (0.443)Black spouse -1.188* -32.404 -33.806 -34.334
(0.668) (25945229) (15045336) (12870104)Foreign born 0.280 -33.477 2.701** 0.518
(0.378) (20825708) (1.117) (0.431)Family income (14 cat.) 0.045 -0.208** 0.224** 0.012
(0.030) (0.102) (0.101) (0.029)Constant -0.278 -5.041** -33.946 -1.169Observations 1165 1165 1165 1165Standard errors in parentheses * significant at 10%; ** significant at 5%; *** significant at 1%Models include dummy variables for panel of the CPS supplement and proxy response, as well as
dummy variables for missing education and family income data.

Center for Demography and EcologyUniversity of Wisconsin
1180 Observatory Drive Rm. 4412Madison, WI 53706-1393
U.S.A.608/262-2182
FAX 608/262-8400comments to: [email protected]
requests to: [email protected]