center for applied research in the apostolate … 1994, cara has counted pre-theology students...
TRANSCRIPT

Center for Applied Research in the Apostolate Georgetown University
Washington, DC
Catholic Ministry Formation Enrollment: Statistical Overview for 2017-2018
March 2018
Mary L. Gautier, Ph.D. Thu T. Do, LHC, Ph.D.

© CARA, April 2018, Statistical Overview
CARA collects enrollment data on every Catholic ministry formation program that prepares men and women for ministry in the U.S. Church as priests, deacons, and lay ecclesial ministers. This statistical overview is published annually and a complete directory listing the names, addresses,
and other pertinent information on each program is published every other year.
CARA was founded by Catholic leaders in 1964 to put social science research tools at the service of the Catholic Church in the United States.
For information on CARA and its mission of research, analysis, and planning, contact:
Center for Applied Research in the Apostolate
Georgetown University 2300 Wisconsin Avenue NW, Suite 400A
Washington, DC 20007
CARA.georgetown.edu
Statistical Overview – Priestly Formation
1
Catholic Ministry Formation Enrollment: Statistical Overview for 2017-2018
Priestly Formation
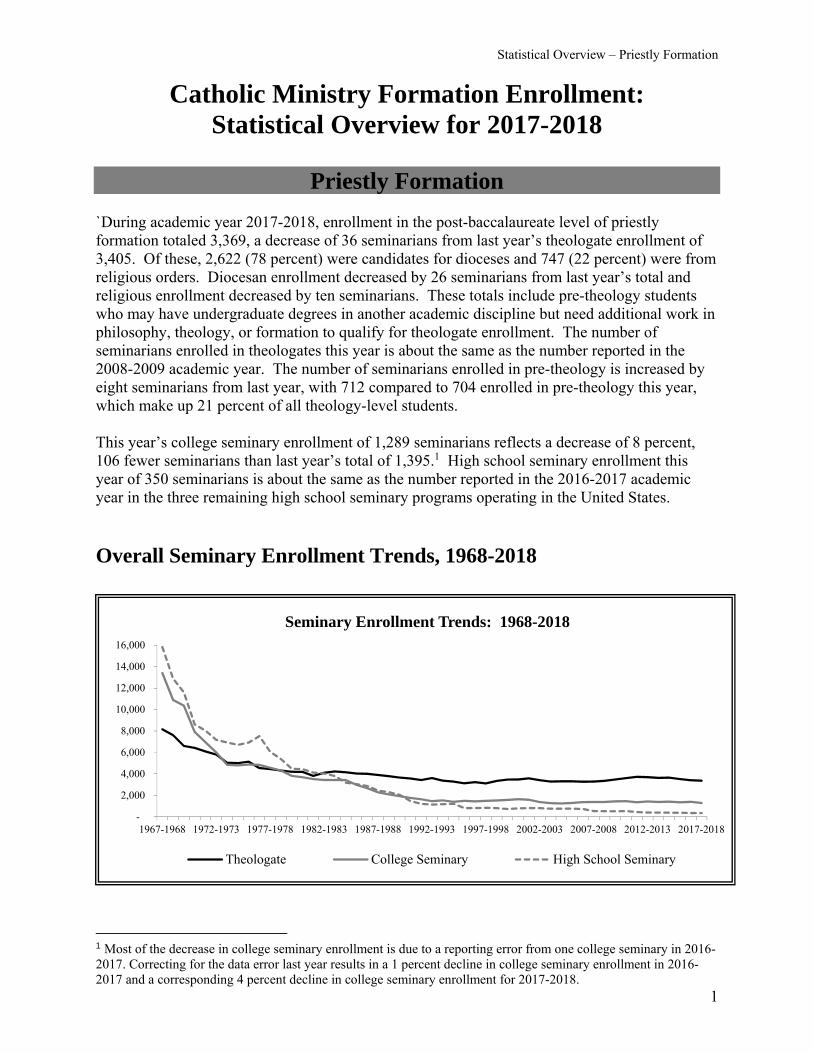
`During academic year 2017-2018, enrollment in the post-baccalaureate level of priestly formation totaled 3,369, a decrease of 36 seminarians from last year’s theologate enrollment of 3,405. Of these, 2,622 (78 percent) were candidates for dioceses and 747 (22 percent) were from religious orders. Diocesan enrollment decreased by 26 seminarians from last year’s total and religious enrollment decreased by ten seminarians. These totals include pre-theology students who may have undergraduate degrees in another academic discipline but need additional work in philosophy, theology, or formation to qualify for theologate enrollment. The number of seminarians enrolled in theologates this year is about the same as the number reported in the 2008-2009 academic year. The number of seminarians enrolled in pre-theology is increased by eight seminarians from last year, with 712 compared to 704 enrolled in pre-theology this year, which make up 21 percent of all theology-level students. This year’s college seminary enrollment of 1,289 seminarians reflects a decrease of 8 percent, 106 fewer seminarians than last year’s total of 1,395.1 High school seminary enrollment this year of 350 seminarians is about the same as the number reported in the 2016-2017 academic year in the three remaining high school seminary programs operating in the United States.
Overall Seminary Enrollment Trends, 1968-2018
1 Most of the decrease in college seminary enrollment is due to a reporting error from one college seminary in 2016-2017. Correcting for the data error last year results in a 1 percent decline in college seminary enrollment in 2016-2017 and a corresponding 4 percent decline in college seminary enrollment for 2017-2018.
-
2,000
4,000
6,000
8,000
10,000
12,000
14,000
16,000
1967-1968 1972-1973 1977-1978 1982-1983 1987-1988 1992-1993 1997-1998 2002-2003 2007-2008 2012-2013 2017-2018
Seminary Enrollment Trends: 1968-2018
Theologate College Seminary High School Seminary
Statistical Overview – Priestly Formation
2
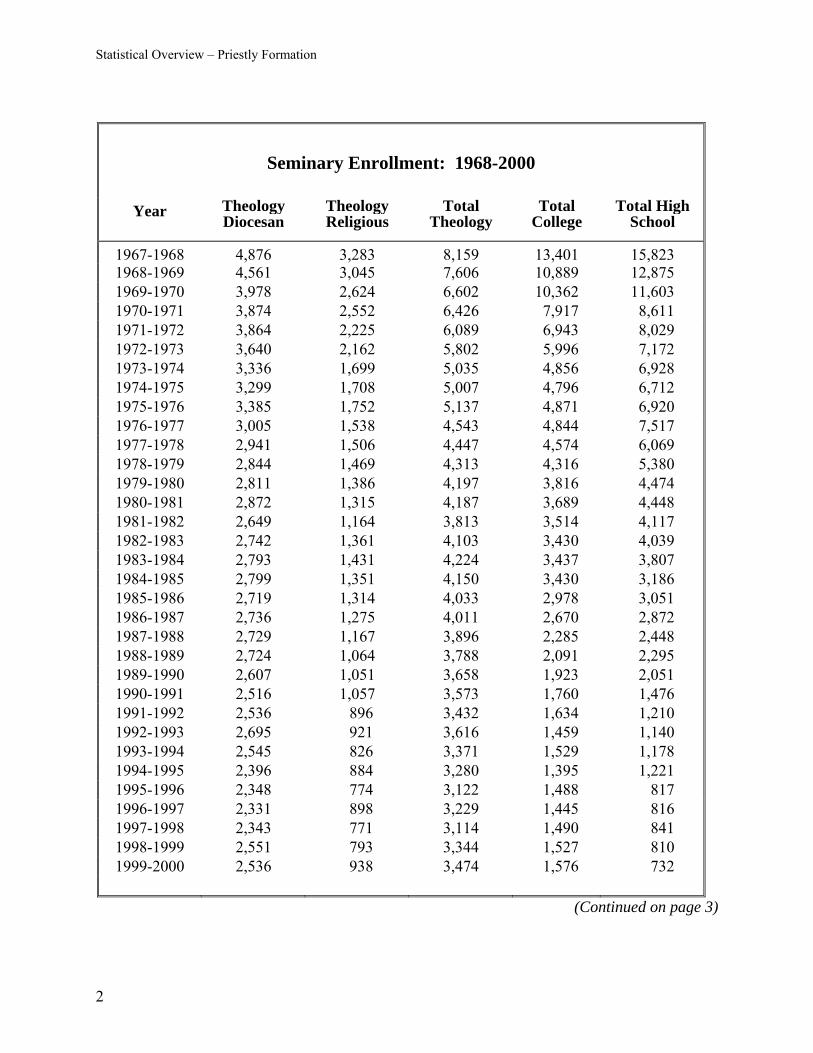
Seminary Enrollment: 1968-2000
Year Theology Diocesan
Theology Religious
Total Theology
Total College
Total High School
1967-1968 4,876 3,283 8,159 13,401 15,8231968-1969 4,561 3,045 7,606 10,889 12,875 1969-1970 3,978 2,624 6,602 10,362 11,603 1970-1971 3,874 2,552 6,426 7,917 8,611 1971-1972 3,864 2,225 6,089 6,943 8,029 1972-1973 3,640 2,162 5,802 5,996 7,172 1973-1974 3,336 1,699 5,035 4,856 6,928 1974-1975 3,299 1,708 5,007 4,796 6,712 1975-1976 3,385 1,752 5,137 4,871 6,920 1976-1977 3,005 1,538 4,543 4,844 7,517 1977-1978 2,941 1,506 4,447 4,574 6,069 1978-1979 2,844 1,469 4,313 4,316 5,380 1979-1980 2,811 1,386 4,197 3,816 4,474 1980-1981 2,872 1,315 4,187 3,689 4,448 1981-1982 2,649 1,164 3,813 3,514 4,117 1982-1983 2,742 1,361 4,103 3,430 4,039 1983-1984 2,793 1,431 4,224 3,437 3,807 1984-1985 2,799 1,351 4,150 3,430 3,186 1985-1986 2,719 1,314 4,033 2,978 3,051 1986-1987 2,736 1,275 4,011 2,670 2,872 1987-1988 2,729 1,167 3,896 2,285 2,448 1988-1989 2,724 1,064 3,788 2,091 2,295 1989-1990 2,607 1,051 3,658 1,923 2,051 1990-1991 2,516 1,057 3,573 1,760 1,476 1991-1992 2,536 896 3,432 1,634 1,210 1992-1993 2,695 921 3,616 1,459 1,140 1993-1994 2,545 826 3,371 1,529 1,178 1994-1995 2,396 884 3,280 1,395 1,221 1995-1996 2,348 774 3,122 1,488 817 1996-1997 2,331 898 3,229 1,445 816 1997-1998 2,343 771 3,114 1,490 841 1998-1999 2,551 793 3,344 1,527 810 1999-2000 2,536 938 3,474 1,576 732
(Continued on page 3)
Statistical Overview – Priestly Formation
3
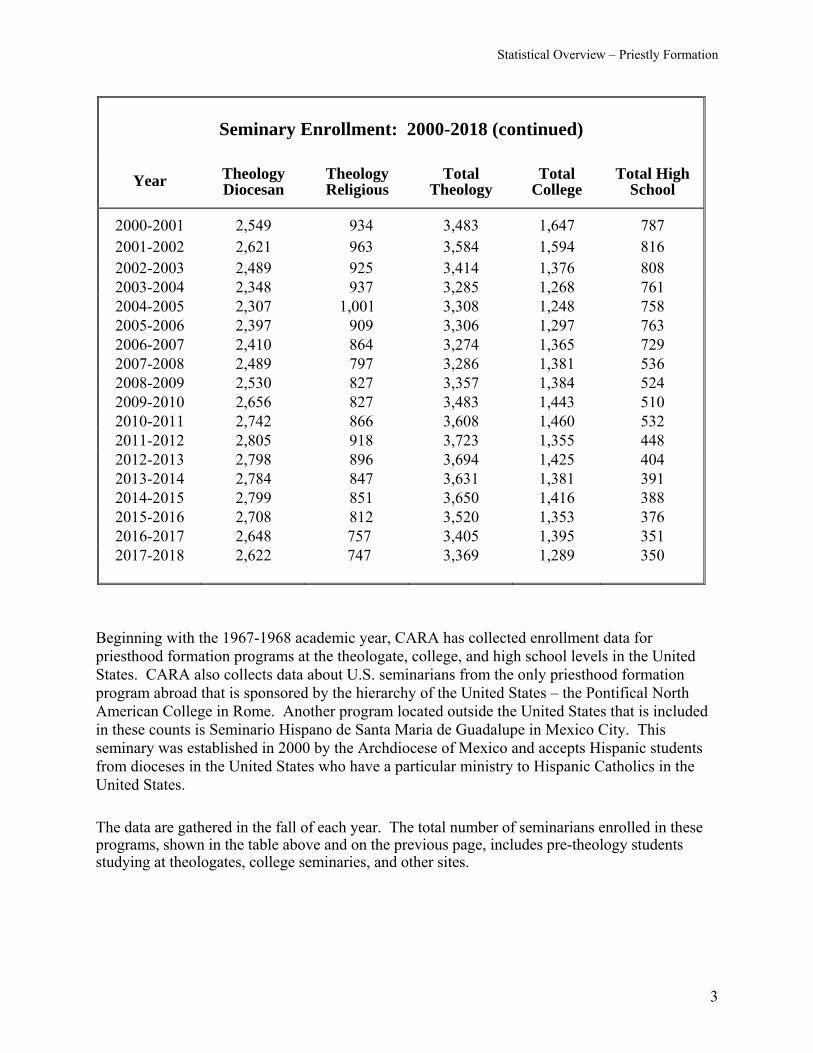
Seminary Enrollment: 2000-2018 (continued)
Year Theology Diocesan
Theology Religious
Total Theology
Total College
Total High School
2000-2001 2,549 934 3,483 1,647 787 2001-2002 2,621 963 3,584 1,594 8162002-2003 2,489 925 3,414 1,376 8082003-2004 2,348 937 3,285 1,268 7612004-2005 2,307 1,001 3,308 1,248 7582005-2006 2,397 909 3,306 1,297 7632006-2007 2,410 864 3,274 1,365 7292007-2008 2,489 797 3,286 1,381 5362008-2009 2,530 827 3,357 1,384 5242009-2010 2,656 827 3,483 1,443 5102010-2011 2,742 866 3,608 1,460 5322011-2012 2,805 918 3,723 1,355 4482012-2013 2,798 896 3,694 1,425 4042013-2014 2,784 847 3,631 1,381 3912014-2015 2,799 851 3,650 1,416 3882015-2016 2,708 812 3,520 1,353 3762016-2017 2,648 757 3,405 1,395 3512017-2018 2,622 747 3,369 1,289 350
Beginning with the 1967-1968 academic year, CARA has collected enrollment data for priesthood formation programs at the theologate, college, and high school levels in the United States. CARA also collects data about U.S. seminarians from the only priesthood formation program abroad that is sponsored by the hierarchy of the United States – the Pontifical North American College in Rome. Another program located outside the United States that is included in these counts is Seminario Hispano de Santa Maria de Guadalupe in Mexico City. This seminary was established in 2000 by the Archdiocese of Mexico and accepts Hispanic students from dioceses in the United States who have a particular ministry to Hispanic Catholics in the United States. The data are gathered in the fall of each year. The total number of seminarians enrolled in these programs, shown in the table above and on the previous page, includes pre-theology students studying at theologates, college seminaries, and other sites.

Statistical Overview – Priestly Formation
4
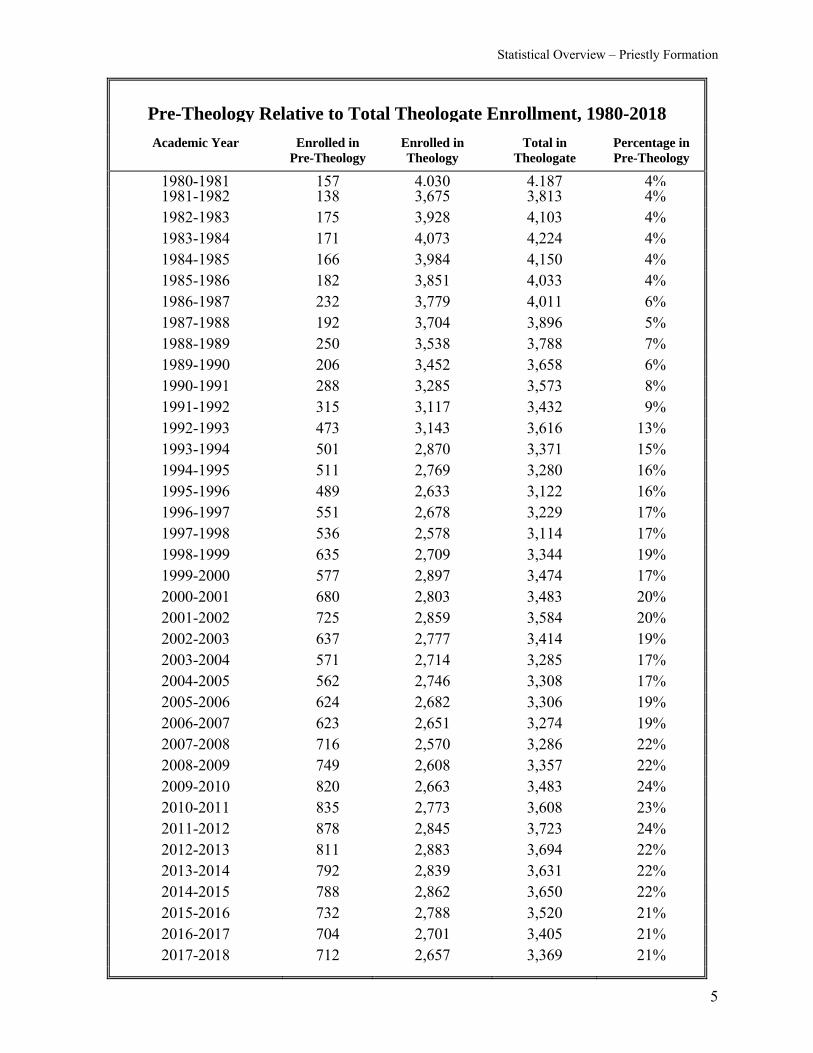
Pre-Theology Since 1994, CARA has counted pre-theology students studying at theologates, college seminaries, and other sites in its totals of theology-level seminarians. The graph below shows the trend in pre-theology students since 1980, the first year that CARA began monitoring this group. In more recent years, as enrollment in college seminaries declined and as more men apply for seminary with a college degree in hand, the need for pre-theology programs has increased. These programs provide the philosophical and theological preparation necessary to pursue graduate-level theology. The most recent documents regarding priestly formation now recommend two years of pre-theologate formation for those who did not complete college seminary.2
In academic year 2017-2018, the 712 seminarians enrolled in pre-theology make up more than a fifth (21 percent) of all theology-level seminarians, an increase of 8 seminarians from last year and approximately the same percentage of overall theologate enrollment over the past decade.
The table on the next page displays the total number of seminarians enrolled in pre-theology and compares that figure to the total theologate enrollment as a percentage of theologate students. 2 Paragraph 60 of the Program of Priestly Formation, fifth edition, (Washington, DC: USCCB, 2006) reads: “If a person has no previous preparation in a formation program, then the pre-theology program should extend over a two-year calendar period. Pre-theology programs are designed to address all four pillars of formation, not simply to meet academic requirements.”
2017-2018712
0
200
400
600
800
1000
1980-1981 1986-1987 1992-1993 1998-1999 2004-2005 2010-2011 2016-2017
Statistical Overview – Priestly Formation
5
Pre-Theology Relative to Total Theologate Enrollment, 1980-2018
Academic Year Enrolled in Pre-Theology
Enrolled in Theology
Total in Theologate
Percentage in Pre-Theology
1980-1981 157 4,030 4,187 4%1981-1982 138 3,675 3,813 4% 1982-1983 175 3,928 4,103 4% 1983-1984 171 4,073 4,224 4% 1984-1985 166 3,984 4,150 4% 1985-1986 182 3,851 4,033 4% 1986-1987 232 3,779 4,011 6% 1987-1988 192 3,704 3,896 5% 1988-1989 250 3,538 3,788 7% 1989-1990 206 3,452 3,658 6% 1990-1991 288 3,285 3,573 8% 1991-1992 315 3,117 3,432 9% 1992-1993 473 3,143 3,616 13% 1993-1994 501 2,870 3,371 15% 1994-1995 511 2,769 3,280 16% 1995-1996 489 2,633 3,122 16% 1996-1997 551 2,678 3,229 17% 1997-1998 536 2,578 3,114 17% 1998-1999 635 2,709 3,344 19% 1999-2000 577 2,897 3,474 17% 2000-2001 680 2,803 3,483 20% 2001-2002 725 2,859 3,584 20% 2002-2003 637 2,777 3,414 19% 2003-2004 571 2,714 3,285 17% 2004-2005 562 2,746 3,308 17% 2005-2006 624 2,682 3,306 19% 2006-2007 623 2,651 3,274 19% 2007-2008 716 2,570 3,286 22% 2008-2009 749 2,608 3,357 22% 2009-2010 820 2,663 3,483 24% 2010-2011 835 2,773 3,608 23% 2011-2012 878 2,845 3,723 24% 2012-2013 811 2,883 3,694 22% 2013-2014 792 2,839 3,631 22% 2014-2015 788 2,862 3,650 22% 2015-2016 732 2,788 3,520 21% 2016-2017 704 2,701 3,405 21% 2017-2018 712 2,657 3,369 21%

Statistical Overview – Priestly Formation
6
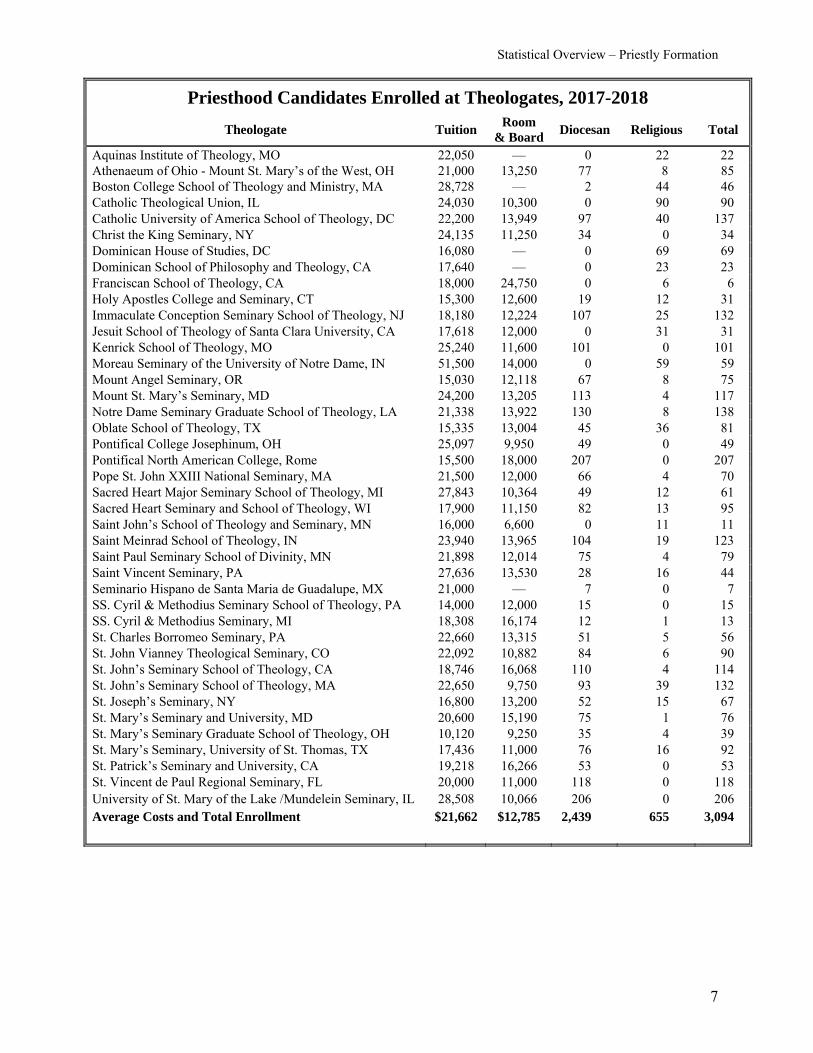
Theologate Profile
The table on the next page lists the 41 theologates that prepare seminarians for the priesthood in the United States. For institutions that have both theology- and college-level programs, enrollment figures for pre-theology seminarians are reported the way the institution reports them. For example, Holy Apostles College and Seminary in Cromwell, CT, treats its pre-theology seminarians as part of the theologate division, and so these three students are counted in its theologate enrollment figure of 31. The pre-theology program at St. Charles Borromeo Seminary in Philadelphia is administered under the college division, so its pre-theology students are included with its college enrollment rather than in its theologate enrollment figure of 56. However, all pre-theology students are included in the CARA totals for theology-level enrollment provided elsewhere in this report. Thus, the total theology enrollment of 3,369 reported earlier includes 3,094 enrolled in theologates (2,657 in theology and 437 in pre-theology), and an additional 275 in pre-theology who are enrolled in college seminaries.
Diocesan priesthood candidates typically live at the seminary and get their education and priestly formation at the theologate they attend.3 For 2017-2018, the average tuition was $21,662, an increase of $626 from 2016-2017. The average room and board for the 36 programs that reported room and board separately was $12,785, a decrease of $91 from 2016-2017. Seminario Hispano de Santa Maria de Guadalupe is excluded from these calculations since they have a single fee that covers the costs of both tuition and room and board. The other programs that do not report room and board are for religious priesthood candidates, who usually live in a house sponsored by their order and attend a nearby theologate for academic training.
CARA identified a total of 77 residences that currently house seminarians; 52 of these residences have seminarians that are studying at theologates. Apart from the exceptions listed below, all of the theology-level priesthood candidates at these residences are enrolled in one of the theologate programs listed in the 2017-2018 theologate profile table. The exceptions are five Marians studying theology at Franciscan University of Steubenville as well as four Dominicans, one Maryknoll seminarian, one Conventual Franciscan, and one Augustinian studying at seminaries outside the United States.
3 In the case of The Catholic University of America, Latin Rite diocesan seminarians reside at Theological College, the official house of formation at The Catholic University of America. Seminarians pay half the graduate CUA tuition (the seminarian tuition is listed in the table on the next page). Because room and board for most seminarians at Catholic University is provided at Theological College, room and board charges are reported with Catholic University’s tuition. Seminarians at Oblate School of Theology reside at Assumption Seminary and the room and board for those seminarians is reported with Oblate School of Theology’s tuition. In the case of St. Joseph’s Seminary, students of the Archdiocese of New York are subsidized through scholarships and endowments. In the case of Moreau Seminary, priesthood candidates receive a full scholarship from the University of Notre Dame.
Statistical Overview – Priestly Formation
7
Priesthood Candidates Enrolled at Theologates, 2017-2018
Theologate Tuition Room
& Board Diocesan Religious Total
Aquinas Institute of Theology, MO 22,050 — 0 22 22 Athenaeum of Ohio - Mount St. Mary’s of the West, OH 21,000 13,250 77 8 85 Boston College School of Theology and Ministry, MA 28,728 — 2 44 46 Catholic Theological Union, IL 24,030 10,300 0 90 90 Catholic University of America School of Theology, DC 22,200 13,949 97 40 137 Christ the King Seminary, NY 24,135 11,250 34 0 34 Dominican House of Studies, DC 16,080 — 0 69 69 Dominican School of Philosophy and Theology, CA 17,640 — 0 23 23 Franciscan School of Theology, CA 18,000 24,750 0 6 6 Holy Apostles College and Seminary, CT 15,300 12,600 19 12 31 Immaculate Conception Seminary School of Theology, NJ 18,180 12,224 107 25 132 Jesuit School of Theology of Santa Clara University, CA 17,618 12,000 0 31 31 Kenrick School of Theology, MO 25,240 11,600 101 0 101 Moreau Seminary of the University of Notre Dame, IN 51,500 14,000 0 59 59 Mount Angel Seminary, OR 15,030 12,118 67 8 75 Mount St. Mary’s Seminary, MD 24,200 13,205 113 4 117 Notre Dame Seminary Graduate School of Theology, LA 21,338 13,922 130 8 138 Oblate School of Theology, TX 15,335 13,004 45 36 81 Pontifical College Josephinum, OH 25,097 9,950 49 0 49 Pontifical North American College, Rome 15,500 18,000 207 0 207 Pope St. John XXIII National Seminary, MA 21,500 12,000 66 4 70 Sacred Heart Major Seminary School of Theology, MI 27,843 10,364 49 12 61 Sacred Heart Seminary and School of Theology, WI 17,900 11,150 82 13 95 Saint John’s School of Theology and Seminary, MN 16,000 6,600 0 11 11 Saint Meinrad School of Theology, IN 23,940 13,965 104 19 123 Saint Paul Seminary School of Divinity, MN 21,898 12,014 75 4 79 Saint Vincent Seminary, PA 27,636 13,530 28 16 44 Seminario Hispano de Santa Maria de Guadalupe, MX 21,000 — 7 0 7 SS. Cyril & Methodius Seminary School of Theology, PA 14,000 12,000 15 0 15 SS. Cyril & Methodius Seminary, MI 18,308 16,174 12 1 13 St. Charles Borromeo Seminary, PA 22,660 13,315 51 5 56 St. John Vianney Theological Seminary, CO 22,092 10,882 84 6 90 St. John’s Seminary School of Theology, CA 18,746 16,068 110 4 114 St. John’s Seminary School of Theology, MA 22,650 9,750 93 39 132 St. Joseph’s Seminary, NY 16,800 13,200 52 15 67 St. Mary’s Seminary and University, MD 20,600 15,190 75 1 76 St. Mary’s Seminary Graduate School of Theology, OH 10,120 9,250 35 4 39 St. Mary’s Seminary, University of St. Thomas, TX 17,436 11,000 76 16 92 St. Patrick’s Seminary and University, CA 19,218 16,266 53 0 53 St. Vincent de Paul Regional Seminary, FL 20,000 11,000 118 0 118 University of St. Mary of the Lake /Mundelein Seminary, IL 28,508 10,066 206 0 206 Average Costs and Total Enrollment $21,662 $12,785 2,439 655 3,094

Statistical Overview – Priestly Formation
8
Theologates with the Highest Enrollment
The 11 theologates with enrollment of at least 100 account for 1,525 or 45 percent of the 3,396 seminarians reported by theologates in 2017-2018. The table below lists these institutions in terms of enrollment of diocesan or religious priesthood candidates. New to the list this year is Kenrick School of Theology in Saint Louis, Missouri.
Theologates with Highest Enrollment, 2017-2018
Theologate
Diocesan Priesthood Candidates
Religious Priesthood Candidates
Total
Change from
2016-2017
Pontifical North American College, Rome 207 0 207 -11 University of St. Mary of the Lake/Mundelein Seminary, IL 206 0 206 +13 Notre Dame Seminary Graduate School of Theology, LA 130 8 138 -4 Catholic University of America School of Theology, DC 97 40 137 -6 Immaculate Conception Seminary School of Theology, NJ 107 25 132 -9 St. John’s Seminary School of Theology, MA 93 39 132 0 Saint Meinrad School of Theology, IN 104 19 123 0 St. Vincent de Paul Regional Seminary, FL 118 0 118 +7 Mount St. Mary’s Seminary, MD 113 4 117 -8 St. John’s Seminary School of Theology, CA 110 4 114 +3
Kenrick School of Theology, MO 101 0 101 +2
Theologates by Size of Enrollment
The figure at right groups the theologates according to their reported enrollment for the 2017-2018 academic year. Slightly more than a quarter of theologates (11 of the 41 theologates) are relatively large, enrolling 100 or more seminarians. Slightly less than a quarter (9 of the 41 theologates) have between 75 and 99 seminarians enrolled, and around half (21 in all) have fewer than 75 seminarians enrolled this year.
Fewer than 25
17%
25 - 4917%
50 - 7417%
75 - 9922%
100 or More27%
Statistical Overview – Priestly Formation
9
Canonical Degree-Granting Theologates
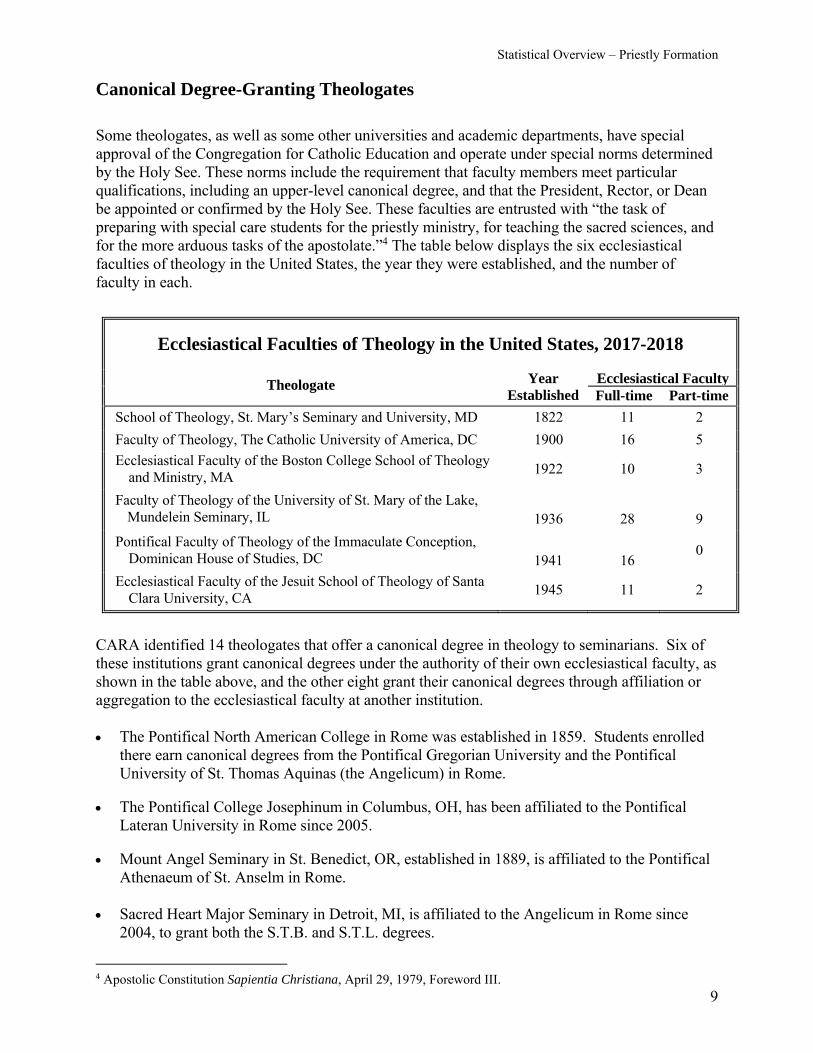
Some theologates, as well as some other universities and academic departments, have special approval of the Congregation for Catholic Education and operate under special norms determined by the Holy See. These norms include the requirement that faculty members meet particular qualifications, including an upper-level canonical degree, and that the President, Rector, or Dean be appointed or confirmed by the Holy See. These faculties are entrusted with “the task of preparing with special care students for the priestly ministry, for teaching the sacred sciences, and for the more arduous tasks of the apostolate.”4 The table below displays the six ecclesiastical faculties of theology in the United States, the year they were established, and the number of faculty in each.
Ecclesiastical Faculties of Theology in the United States, 2017-2018
Theologate Year Established
Ecclesiastical FacultyFull-time Part-time
School of Theology, St. Mary’s Seminary and University, MD 1822 11 2
Faculty of Theology, The Catholic University of America, DC 1900 16 5
Ecclesiastical Faculty of the Boston College School of Theology and Ministry, MA
1922 10 3
Faculty of Theology of the University of St. Mary of the Lake, Mundelein Seminary, IL
1936
28
9
Pontifical Faculty of Theology of the Immaculate Conception, Dominican House of Studies, DC
1941
16 0
Ecclesiastical Faculty of the Jesuit School of Theology of Santa Clara University, CA
1945 11 2
CARA identified 14 theologates that offer a canonical degree in theology to seminarians. Six of these institutions grant canonical degrees under the authority of their own ecclesiastical faculty, as shown in the table above, and the other eight grant their canonical degrees through affiliation or aggregation to the ecclesiastical faculty at another institution. The Pontifical North American College in Rome was established in 1859. Students enrolled
there earn canonical degrees from the Pontifical Gregorian University and the Pontifical University of St. Thomas Aquinas (the Angelicum) in Rome.
The Pontifical College Josephinum in Columbus, OH, has been affiliated to the Pontifical
Lateran University in Rome since 2005. Mount Angel Seminary in St. Benedict, OR, established in 1889, is affiliated to the Pontifical
Athenaeum of St. Anselm in Rome.
Sacred Heart Major Seminary in Detroit, MI, is affiliated to the Angelicum in Rome since 2004, to grant both the S.T.B. and S.T.L. degrees.
4 Apostolic Constitution Sapientia Christiana, April 29, 1979, Foreword III.

Statistical Overview – Priestly Formation
10
St. Patrick Seminary in Menlo Park, CA, has been affiliated to the ecclesiastical faculty at St. Mary’s Seminary and University in Baltimore, MD, since 1997.
St. Vincent Seminary in Latrobe, PA, has been affiliated to the Dominican House of Studies in
Washington, DC, since 2000.
St. John Vianney Theological Seminary in Denver, CO, has been affiliated to the Pontifical Lateran University in Rome since 2001.
Seminarians Enrolled in Canonical Degree Programs at Theologates, 2017-2018
Theologate Seminarians Enrolled Expected to Earn
the Degree in 2018 S.T.B. S.T.L. S.T.D.
Pontifical North American College, Rome 156 38 0 38
St. Mary’s Seminary and University, MD 79 0 0 18
St. Joseph’s Seminary, NY 77 0 0 10
The Catholic University of America, DC 74 2 0 25
St. Patrick Seminary and University, CA 53 0 0 8
St. John Vianney Theological Seminary, CO 50 0 0 5
Dominican House of Studies, DC 46 10 0 11
University of St. Mary of the Lake/ Mundelein Seminary, IL
38 13 0 19
Pontifical College Josephinum, OH 20 0 0 7
Sacred Heart Major Seminary, MI 10 0 0 14
Mount Angel Seminary, OR 5 0 0 5
St. Vincent Seminary, PA 2 0 0 0
Boston College School of Theology and Ministry, MA
0 19 2 4
Jesuit School of Theology of Santa Clara University, CA 0 6 0 5
In addition to the seminarian numbers listed above, these institutions report another 164 priests and 34 lay persons or deacons enrolled in their canonical degree programs. They anticipate awarding canonical degrees to 72 priests and 17 lay persons or deacons in 2018.
Statistical Overview – Priestly Formation
11
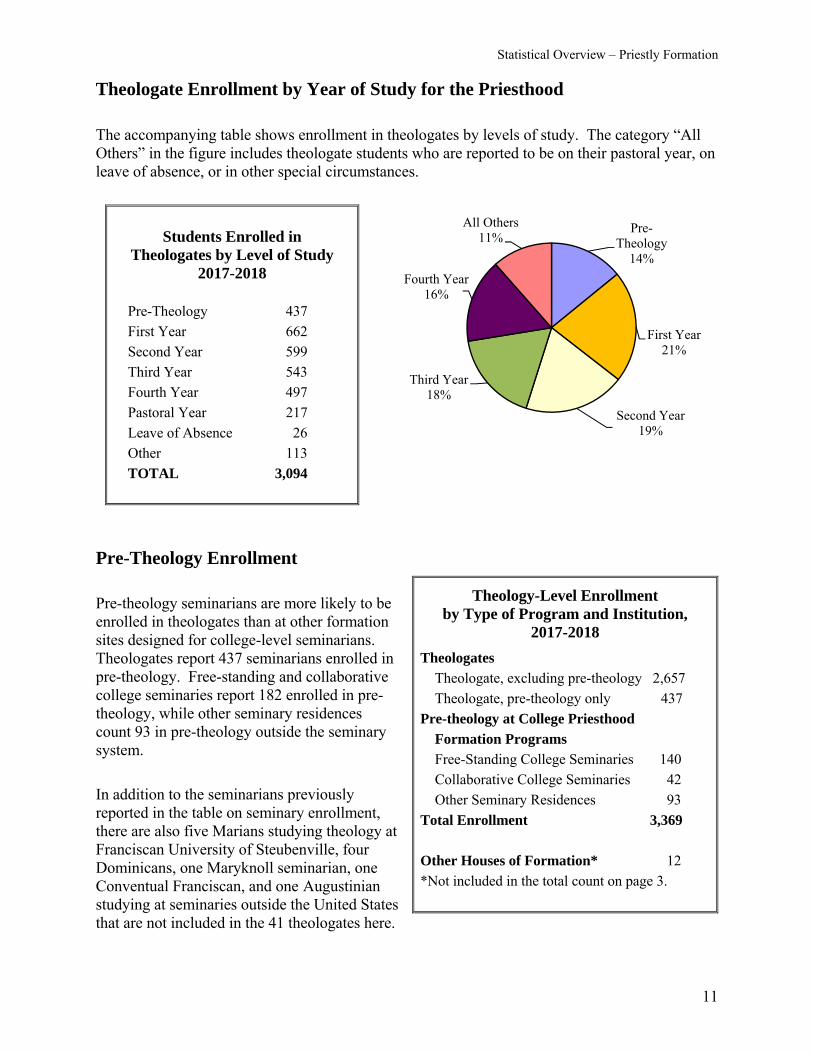
Theologate Enrollment by Year of Study for the Priesthood
The accompanying table shows enrollment in theologates by levels of study. The category “All Others” in the figure includes theologate students who are reported to be on their pastoral year, on leave of absence, or in other special circumstances.
Pre-Theology Enrollment
Pre-theology seminarians are more likely to be enrolled in theologates than at other formation sites designed for college-level seminarians. Theologates report 437 seminarians enrolled in pre-theology. Free-standing and collaborative college seminaries report 182 enrolled in pre-theology, while other seminary residences count 93 in pre-theology outside the seminary system.
In addition to the seminarians previously reported in the table on seminary enrollment, there are also five Marians studying theology at Franciscan University of Steubenville, four Dominicans, one Maryknoll seminarian, one Conventual Franciscan, and one Augustinian studying at seminaries outside the United States that are not included in the 41 theologates here.
Students Enrolled in Theologates by Level of Study
2017-2018
Pre-Theology 437
First Year 662
Second Year 599
Third Year 543
Fourth Year 497
Pastoral Year 217
Leave of Absence 26
Other 113
TOTAL 3,094
Theology-Level Enrollment by Type of Program and Institution,
2017-2018
Theologates Theologate, excluding pre-theology 2,657
Theologate, pre-theology only 437
Pre-theology at College Priesthood
Formation Programs Free-Standing College Seminaries 140
Collaborative College Seminaries 42
Other Seminary Residences 93
Total Enrollment 3,369
Other Houses of Formation* 12
*Not included in the total count on page 3.
Pre-Theology
14%
First Year21%
Second Year19%
Third Year18%
Fourth Year16%
All Others11%

Statistical Overview – Priestly Formation
12
Retention of Seminarians in Theology
Although individual exceptions occur, the typical pattern for seminarians entering their first year of theology is to have an undergraduate degree from a college seminary or to have completed a pre-theology program. The table below highlights the 2017-2018 class of seminarians through their four years in theology, that is, those who began theologate studies in 2014-2015 and who are completing their theologate studies in 2017-2018. Each class of seminarians in theology can also be compared to its corresponding cohort in the preceding academic year by following the same diagonal.
Retention of Seminarians in Theology Year of Study in Theology
First Year
Second Year
Third Year
Fourth Year
Retention Rate
1999-2000 681 687 582 625
2000-2001 704 606 573 570
2001-2002 716 670 595 536
2002-2003 738 625 543 576 85%
2003-2004 727 614 512 509 72%
2004-2005 691 633 542 519 72%
2005-2006 631 617 573 495 67%
2006-2007 656 566 546 555 76%
2007-2008 622 607 541 535 77%
2008-2009 709 546 524 500 79%
2009-2010 646 600 568 497 76%
2010-2011 725 626 549 535 86%
2011-2012 768 686 542 520 73%
2012-2013 739 706 571 513 79%
2013-2014 704 653 596 530 73%
2014-2015 661 654 591 561 73%
2015-2016 695 574 610 547 74%
2016-2017 642 599 548 561 80%
2017-2018 662 599 543 497 75%
Of the 661 seminarians who began theologate study in 2014, 497 are completing their fourth year in 2018. Thus, the retention rate for the Class of 2018 throughout their four years of theologate study is expected to be 75 percent, lower than that reported for the year before but about the same as the three years prior. The average retention rate over ten years for those who began theology from 2008-2009 to 2017-2018 was 77 percent.
Statistical Overview – Priestly Formation
13
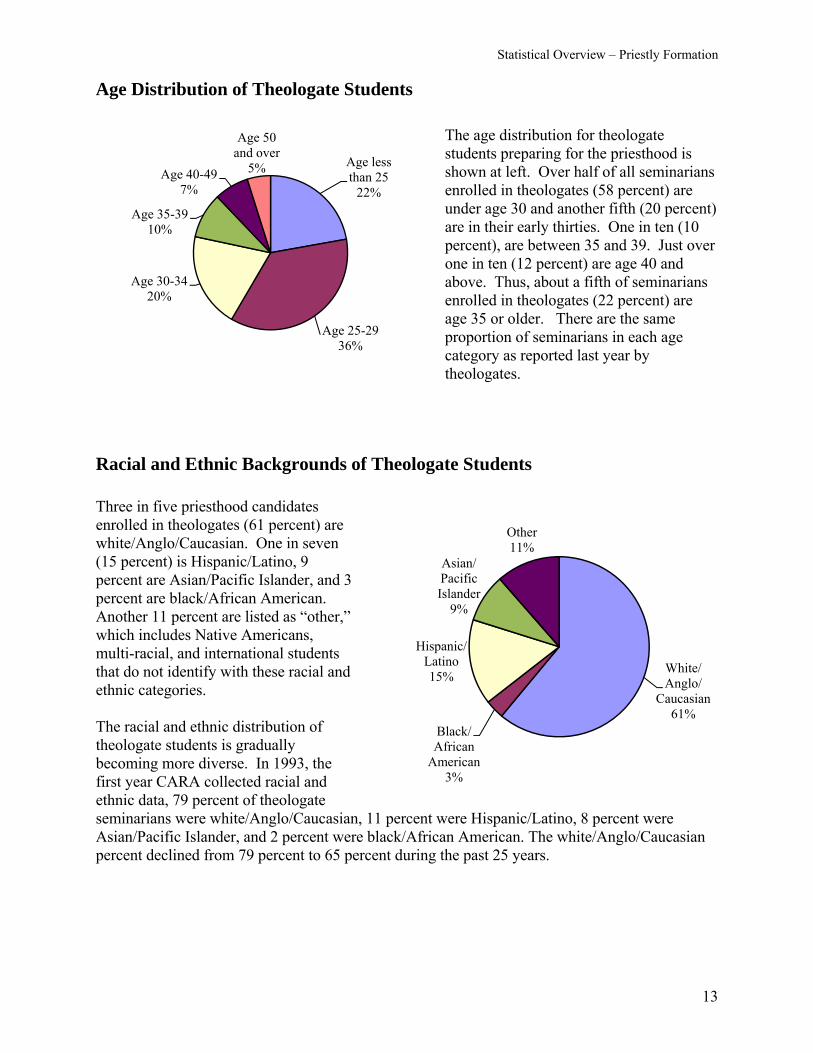
Age Distribution of Theologate Students
The age distribution for theologate students preparing for the priesthood is shown at left. Over half of all seminarians enrolled in theologates (58 percent) are under age 30 and another fifth (20 percent) are in their early thirties. One in ten (10 percent), are between 35 and 39. Just over one in ten (12 percent) are age 40 and above. Thus, about a fifth of seminarians enrolled in theologates (22 percent) are age 35 or older. There are the same proportion of seminarians in each age category as reported last year by theologates.
Racial and Ethnic Backgrounds of Theologate Students
Three in five priesthood candidates enrolled in theologates (61 percent) are white/Anglo/Caucasian. One in seven (15 percent) is Hispanic/Latino, 9 percent are Asian/Pacific Islander, and 3 percent are black/African American. Another 11 percent are listed as “other,” which includes Native Americans, multi-racial, and international students that do not identify with these racial and ethnic categories. The racial and ethnic distribution of theologate students is gradually becoming more diverse. In 1993, the first year CARA collected racial and ethnic data, 79 percent of theologate seminarians were white/Anglo/Caucasian, 11 percent were Hispanic/Latino, 8 percent were Asian/Pacific Islander, and 2 percent were black/African American. The white/Anglo/Caucasian percent declined from 79 percent to 65 percent during the past 25 years.
Age less than 25
22%
Age 25-2936%
Age 30-3420%
Age 35-3910%
Age 40-497%
Age 50 and over
5%
White/Anglo/
Caucasian61%
Black/ African
American3%
Hispanic/ Latino15%
Asian/ Pacific Islander
9%
Other11%
Statistical Overview – Priestly Formation
14
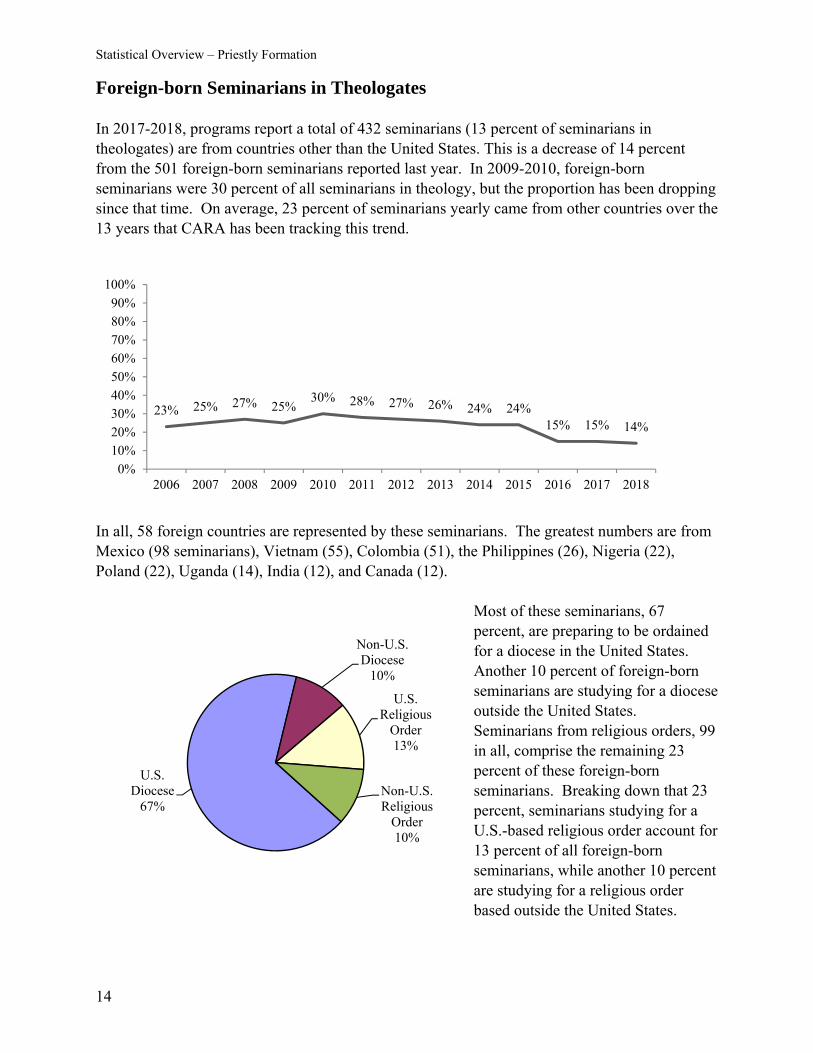
Foreign-born Seminarians in Theologates In 2017-2018, programs report a total of 432 seminarians (13 percent of seminarians in theologates) are from countries other than the United States. This is a decrease of 14 percent from the 501 foreign-born seminarians reported last year. In 2009-2010, foreign-born seminarians were 30 percent of all seminarians in theology, but the proportion has been dropping since that time. On average, 23 percent of seminarians yearly came from other countries over the 13 years that CARA has been tracking this trend.
In all, 58 foreign countries are represented by these seminarians. The greatest numbers are from Mexico (98 seminarians), Vietnam (55), Colombia (51), the Philippines (26), Nigeria (22), Poland (22), Uganda (14), India (12), and Canada (12).
Most of these seminarians, 67 percent, are preparing to be ordained for a diocese in the United States. Another 10 percent of foreign-born seminarians are studying for a diocese outside the United States. Seminarians from religious orders, 99 in all, comprise the remaining 23 percent of these foreign-born seminarians. Breaking down that 23 percent, seminarians studying for a U.S.-based religious order account for 13 percent of all foreign-born seminarians, while another 10 percent are studying for a religious order based outside the United States.
23% 25% 27% 25%30% 28% 27% 26% 24% 24%
15% 15% 14%
0%
10%20%30%40%50%
60%70%80%90%
100%
2006 2007 2008 2009 2010 2011 2012 2013 2014 2015 2016 2017 2018
U.S. Diocese
67%
Non-U.S. Diocese
10%
U.S. Religious
Order13%
Non-U.S. Religious
Order10%

Statistical Overview – Priestly Formation
15
College Seminaries In 2017-2018, there were 1,289 seminarians enrolled in 29 college-level priesthood formation programs or in seminary residence programs in religious institutes. This number does not include the 275 pre-theology students in college seminary programs, since pre-theology students are calculated in the theology-level counts. College-level priesthood formation programs may be divided into three categories: free-standing seminaries (616 seminarians), collaborative seminaries (496), and seminary residence programs (177). Free-Standing College Seminaries Free-standing college seminaries are accredited in their own right to grant a college degree. They combine all aspects of a seminary program in one institution. There are 13 such institutions reporting enrollment for the 2017-2018 academic year. The 616 seminarians enrolled at the college level in these institutions is a decrease of 114 seminarians (16 percent) from the 730 seminarians reported last year.
Free-Standing College Seminary Enrollment, 2017-2018
Free-Standing College Seminary Diocesan Religious Total Pre-theology
College level
Conception Seminary College, MO 65 15 80 10 70
Divine Word College Seminary, IA 5 45 50 2 48
Holy Apostles College and Seminary, CT* 8 1 9 0 9
Mexican American Catholic College, TX 28 3 31 6 25
Mount Angel Seminary, OR* 63 5 68 19 49
Pontifical College Josephinum, OH* 91 0 91 18 73
Sacred Heart Major Seminary College, MI* 42 13 55 23 32
Saint Joseph Seminary College, LA 142 3 145 17 128
Seminario Hispano de Santa Maria, MX* 9 0 9 0 9
St. Basil College, CT 6 0 6 1 5
St. Charles Borromeo Seminary College, PA* 83 10 93 26 67
St. Gregory the Great Seminary, NE 50 0 50 4 46
St. John Vianney College and Seminary, FL 69 0 69 14 55
Total Enrollment 661 95 756 140 616
* Also has a theologate division.
Seven of the free-standing college seminaries are sponsored by a diocese or archdiocese.
Three of these diocesan institutions have a combined college and theologate seminary program. These institutions include Sacred Heart Major Seminary, College of Liberal Arts, in

Statistical Overview – Priestly Formation
16
Detroit, MI, St. Charles Borromeo Seminary in Philadelphia, PA and the Seminario Hispano de Santa Maria de Guadalupe, Philosophy Division, in Mexico City.
There are five religious-sponsored programs, of which three are Benedictine – Conception Seminary College in Conception, MO; Mount Angel Seminary College in St. Benedict, OR; and Saint Joseph Seminary College in St. Benedict, LA. The other two free-standing college seminaries sponsored by religious orders are Divine Word College Seminary in Epworth, IA, and Holy Apostles College and Seminary in Cromwell, CT.
The Pontifical College Josephinum, in Columbus, OH, which also has both a free-standing college and a theologate, is not sponsored directly by either a diocese or a religious order but is operated instead by an independent board of trustees.

Statistical Overview – Priestly Formation
17
Collaborative College Seminaries Collaborative programs usually have a formal relationship with an accredited undergraduate program at a Catholic college or university. They tend to be long-established programs, are typically diocesan-administered, and in many cases had originally been separate, stand-alone programs. This directory includes 16 programs in the category of collaborative college seminaries. The 496 seminarians enrolled at the college level in these programs is 1 percent higher than the 492 seminarians reported last year.
Collaborative College Seminary Enrollment, 2017-2018
Collaborative College Seminary Pre- College Diocesan Religious Total Theology Level
Bishop Simon Bruté College Seminary, IN 48 1 49 0 49
Bishop White Seminary, WA 11 0 11 0 11 Borromeo Seminary, OH 27 11 38 0 38 Cardinal Glennon College, MO* 28 0 28 0 28 Cathedral Seminary House of Formation, NY 47 0 47 12 35
College Seminary of the Immaculate Conception, Saint Andrews Hall, NJ*
29 0 29 0 29
Holy Trinity Seminary, TX 62 0 62 9 53 Immaculate Heart of Mary Seminary, MN 47 0 47 5 42 Old College Seminary at Notre Dame, IN* 0 10 10 0 10 Seminary of Our Lady of Providence, RI 21 0 21 3 18 St. John Fisher Seminary Residence, CT 13 0 13 2 11 St. John Vianney College Seminary, MN 120 1 121 0 121 St. Joseph College Seminary, IL 27 2 29 0 29 St. Mark Seminary, PA 11 0 11 3 8 St. Paul Seminary, PA 12 0 12 7 5 St. Pius X Seminary, IA 10 0 10 1 9 Total Enrollment 513 25 538 42 496 * Also has a theologate division.
Other College Level Formation Programs
Other college seminary residences generally have much smaller numbers of students than free-standing or collaborative college seminaries. They tend to be conducted by religious institutes for their candidates completing college degrees. CARA has identified 32 college-level programs that fit this model. Seven of these house only college-level candidates; the other 25 currently function as joint college and theology residences. In 2017–2018, the combined number of priesthood candidates pursuing college-level studies in these residences was 177, excluding pre-theology. Another 93 were enrolled in pre-theology course work. In both cases, these seminarians were not enrolled in programs reported here as theologates, free-standing colleges, or collaborative colleges, and therefore are not double-counted when added to the enrollment totals for these institutions.
Statistical Overview – Priestly Formation
18
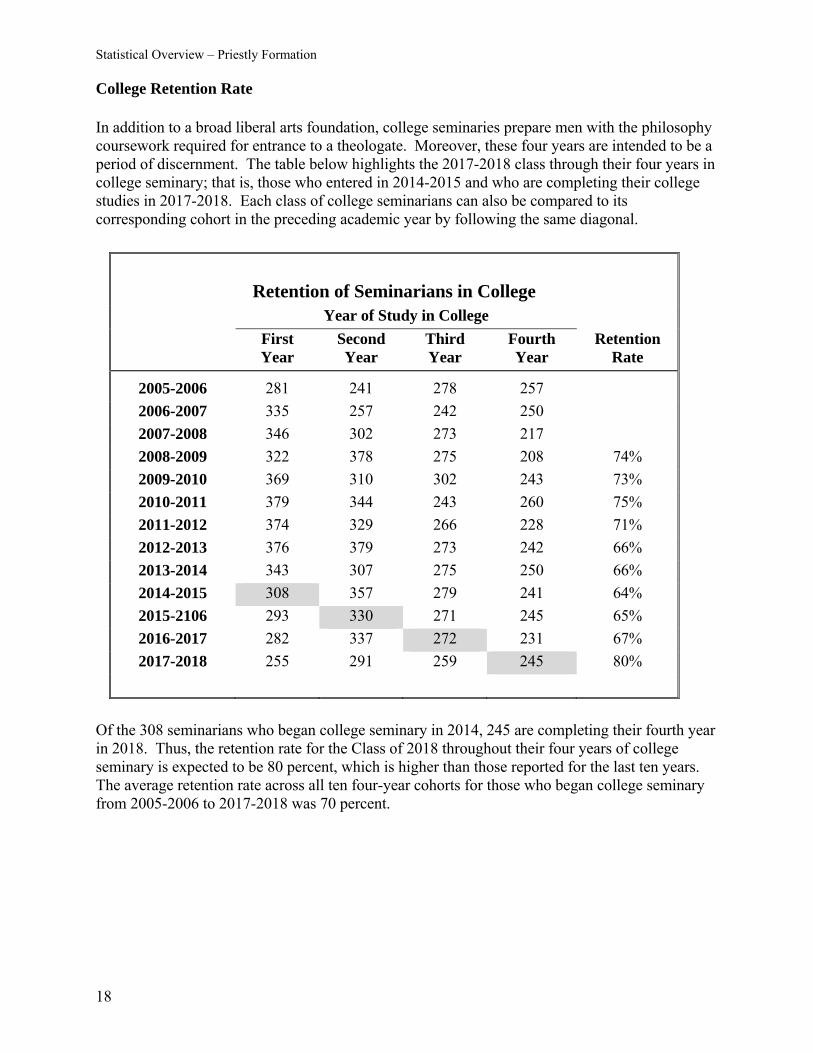
College Retention Rate In addition to a broad liberal arts foundation, college seminaries prepare men with the philosophy coursework required for entrance to a theologate. Moreover, these four years are intended to be a period of discernment. The table below highlights the 2017-2018 class through their four years in college seminary; that is, those who entered in 2014-2015 and who are completing their college studies in 2017-2018. Each class of college seminarians can also be compared to its corresponding cohort in the preceding academic year by following the same diagonal.
Retention of Seminarians in College Year of Study in College
First Year
Second Year
Third Year
Fourth Year
Retention Rate
2005-2006 281 241 278 257
2006-2007 335 257 242 250
2007-2008 346 302 273 217
2008-2009 322 378 275 208 74%
2009-2010 369 310 302 243 73%
2010-2011 379 344 243 260 75%
2011-2012 374 329 266 228 71%
2012-2013 376 379 273 242 66%
2013-2014 343 307 275 250 66%
2014-2015 308 357 279 241 64%
2015-2106 293 330 271 245 65%
2016-2017 282 337 272 231 67%
2017-2018 255 291 259 245 80%
Of the 308 seminarians who began college seminary in 2014, 245 are completing their fourth year in 2018. Thus, the retention rate for the Class of 2018 throughout their four years of college seminary is expected to be 80 percent, which is higher than those reported for the last ten years. The average retention rate across all ten four-year cohorts for those who began college seminary from 2005-2006 to 2017-2018 was 70 percent.
Statistical Overview – Priestly Formation
19
Age Distribution of College Seminarians
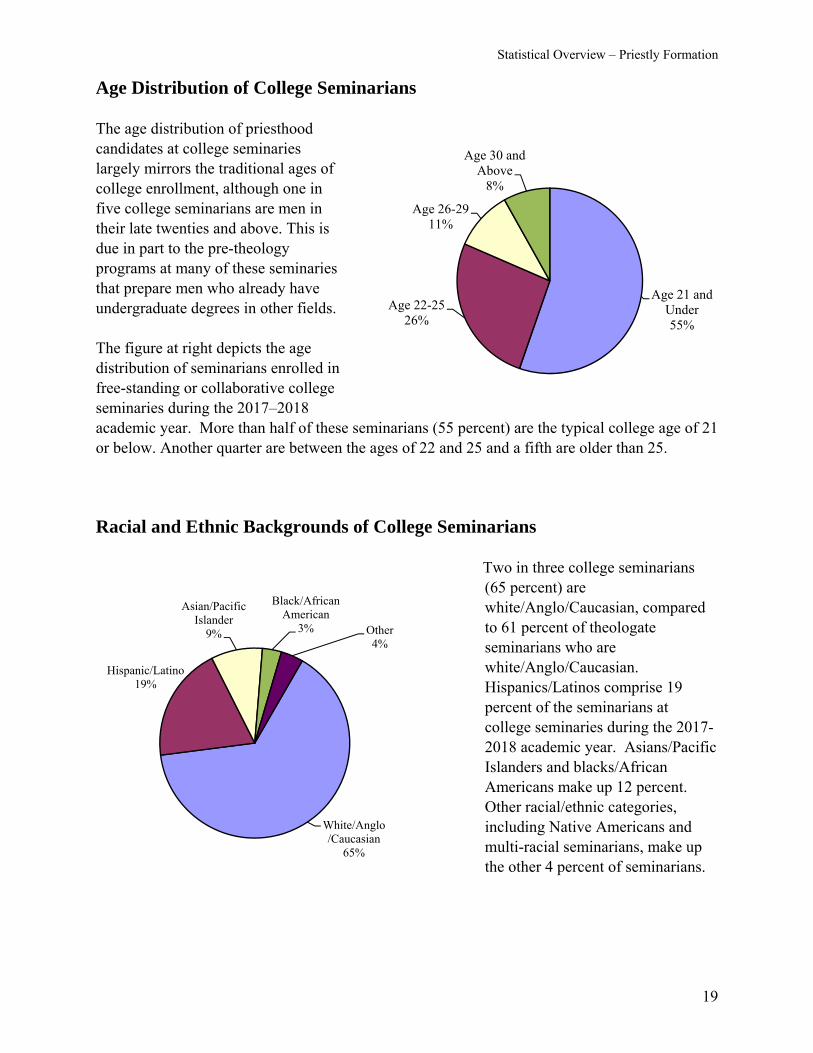
The age distribution of priesthood candidates at college seminaries largely mirrors the traditional ages of college enrollment, although one in five college seminarians are men in their late twenties and above. This is due in part to the pre-theology programs at many of these seminaries that prepare men who already have undergraduate degrees in other fields. The figure at right depicts the age distribution of seminarians enrolled in free-standing or collaborative college seminaries during the 2017–2018 academic year. More than half of these seminarians (55 percent) are the typical college age of 21 or below. Another quarter are between the ages of 22 and 25 and a fifth are older than 25.
Racial and Ethnic Backgrounds of College Seminarians
Two in three college seminarians (65 percent) are white/Anglo/Caucasian, compared to 61 percent of theologate seminarians who are white/Anglo/Caucasian. Hispanics/Latinos comprise 19 percent of the seminarians at college seminaries during the 2017-2018 academic year. Asians/Pacific Islanders and blacks/African Americans make up 12 percent. Other racial/ethnic categories, including Native Americans and multi-racial seminarians, make up the other 4 percent of seminarians.
Age 21 and Under55%
Age 22-2526%
Age 26-2911%
Age 30 and Above
8%
White/Anglo/Caucasian
65%
Hispanic/Latino19%
Asian/Pacific Islander
9%
Black/African American
3% Other4%
Statistical Overview – Priestly Formation
20
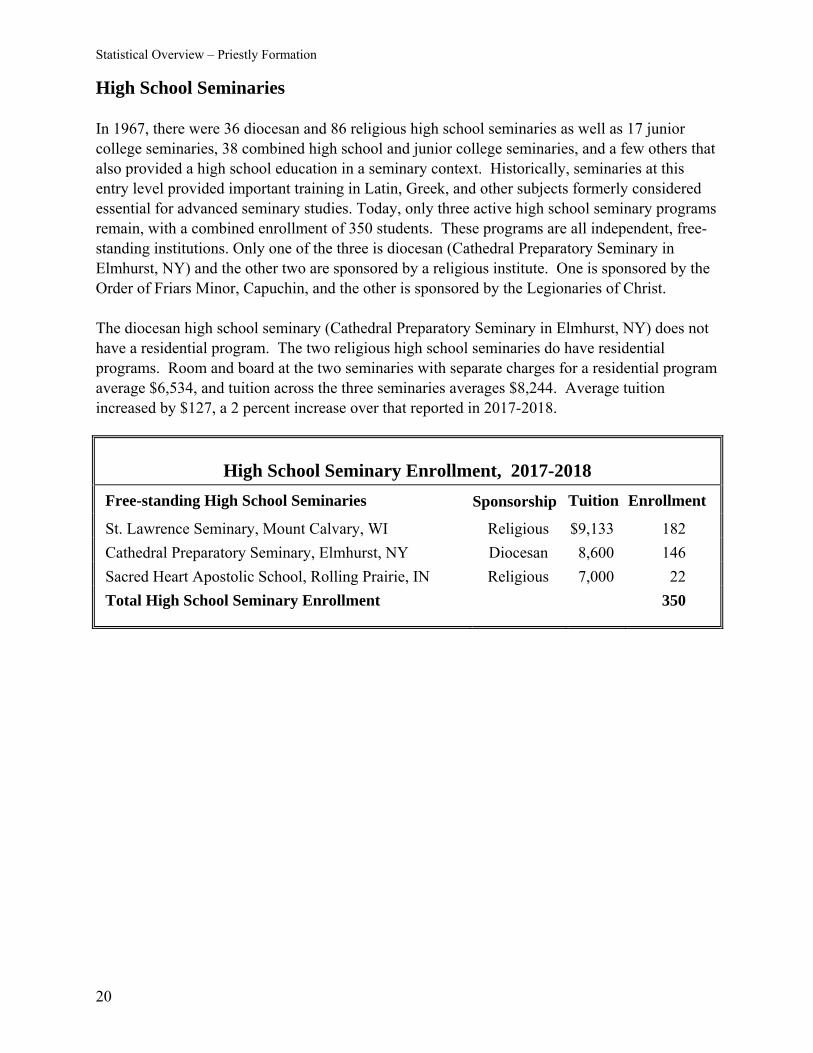
High School Seminaries In 1967, there were 36 diocesan and 86 religious high school seminaries as well as 17 junior college seminaries, 38 combined high school and junior college seminaries, and a few others that also provided a high school education in a seminary context. Historically, seminaries at this entry level provided important training in Latin, Greek, and other subjects formerly considered essential for advanced seminary studies. Today, only three active high school seminary programs remain, with a combined enrollment of 350 students. These programs are all independent, free-standing institutions. Only one of the three is diocesan (Cathedral Preparatory Seminary in Elmhurst, NY) and the other two are sponsored by a religious institute. One is sponsored by the Order of Friars Minor, Capuchin, and the other is sponsored by the Legionaries of Christ. The diocesan high school seminary (Cathedral Preparatory Seminary in Elmhurst, NY) does not have a residential program. The two religious high school seminaries do have residential programs. Room and board at the two seminaries with separate charges for a residential program average $6,534, and tuition across the three seminaries averages $8,244. Average tuition increased by $127, a 2 percent increase over that reported in 2017-2018.
High School Seminary Enrollment, 2017-2018
Free-standing High School Seminaries Sponsorship Tuition Enrollment
St. Lawrence Seminary, Mount Calvary, WI Religious $9,133 182
Cathedral Preparatory Seminary, Elmhurst, NY Diocesan 8,600 146
Sacred Heart Apostolic School, Rolling Prairie, IN Religious 7,000 22
Total High School Seminary Enrollment 350
Statistical Overview –Diaconate Formation
21
Diaconate Formation Trends
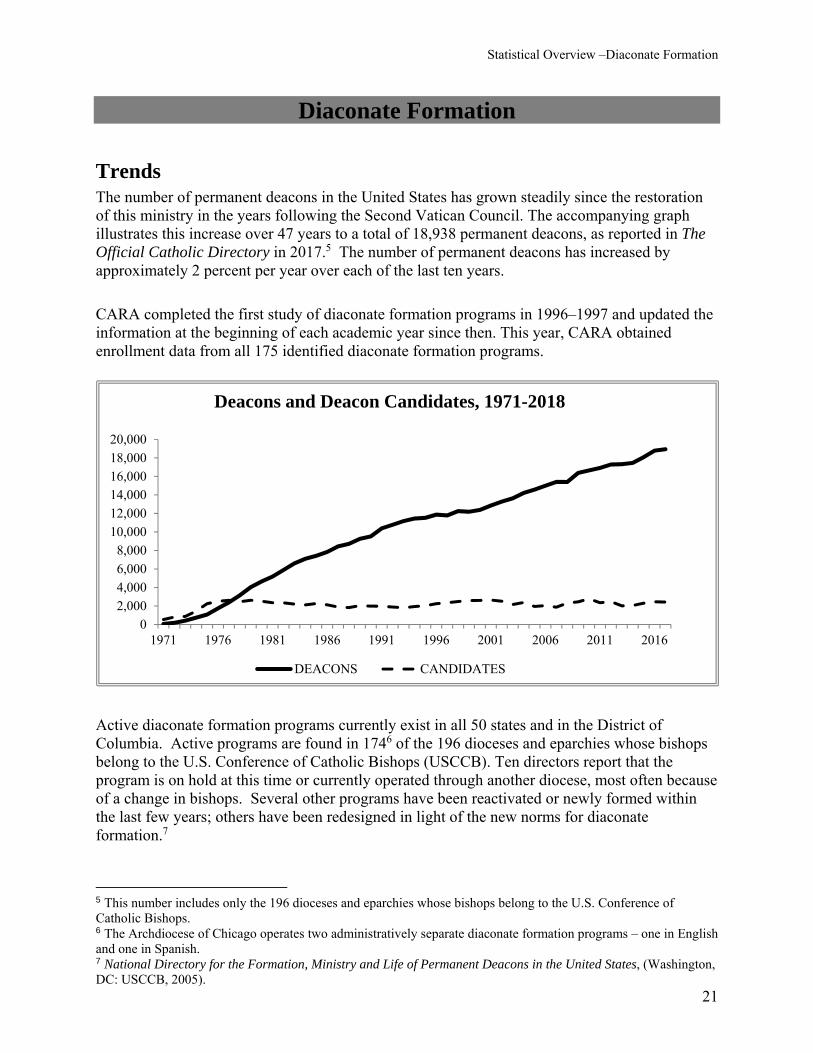
The number of permanent deacons in the United States has grown steadily since the restoration of this ministry in the years following the Second Vatican Council. The accompanying graph illustrates this increase over 47 years to a total of 18,938 permanent deacons, as reported in The Official Catholic Directory in 2017.5 The number of permanent deacons has increased by approximately 2 percent per year over each of the last ten years. CARA completed the first study of diaconate formation programs in 1996–1997 and updated the information at the beginning of each academic year since then. This year, CARA obtained enrollment data from all 175 identified diaconate formation programs.
Active diaconate formation programs currently exist in all 50 states and in the District of Columbia. Active programs are found in 1746 of the 196 dioceses and eparchies whose bishops belong to the U.S. Conference of Catholic Bishops (USCCB). Ten directors report that the program is on hold at this time or currently operated through another diocese, most often because of a change in bishops. Several other programs have been reactivated or newly formed within the last few years; others have been redesigned in light of the new norms for diaconate formation.7
5 This number includes only the 196 dioceses and eparchies whose bishops belong to the U.S. Conference of Catholic Bishops. 6 The Archdiocese of Chicago operates two administratively separate diaconate formation programs – one in English and one in Spanish. 7 National Directory for the Formation, Ministry and Life of Permanent Deacons in the United States, (Washington, DC: USCCB, 2005).
0
2,000
4,000
6,000
8,000
10,000
12,000
14,00016,000
18,000
20,000
1971 1976 1981 1986 1991 1996 2001 2006 2011 2016
Deacons and Deacon Candidates, 1971-2018
DEACONS CANDIDATES
Statistical Overview –Diaconate Formation
22
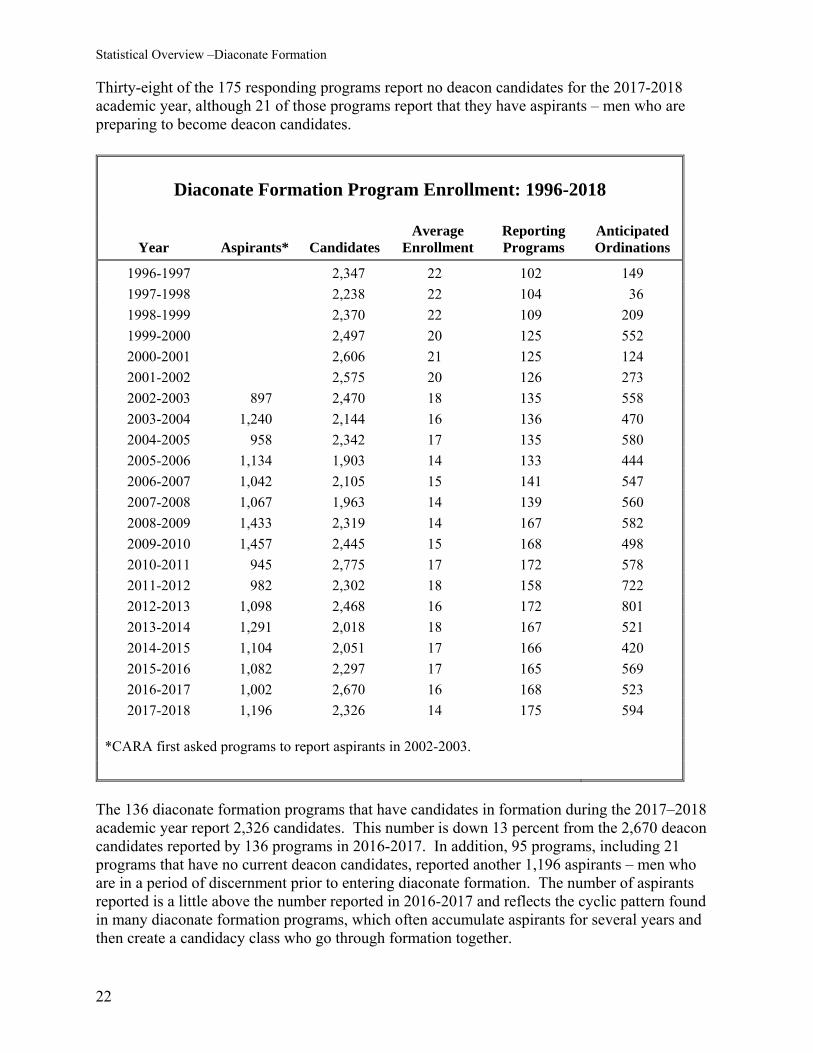
Thirty-eight of the 175 responding programs report no deacon candidates for the 2017-2018 academic year, although 21 of those programs report that they have aspirants – men who are preparing to become deacon candidates.
Diaconate Formation Program Enrollment: 1996-2018
Year Aspirants* Candidates Average
Enrollment Reporting Programs
Anticipated Ordinations
1996-1997 2,347 22 102 149
1997-1998 2,238 22 104 36
1998-1999 2,370 22 109 209
1999-2000 2,497 20 125 552
2000-2001 2,606 21 125 124
2001-2002 2,575 20 126 273
2002-2003 897 2,470 18 135 558
2003-2004 1,240 2,144 16 136 470
2004-2005 958 2,342 17 135 580
2005-2006 1,134 1,903 14 133 444
2006-2007 1,042 2,105 15 141 547
2007-2008 1,067 1,963 14 139 560
2008-2009 1,433 2,319 14 167 582
2009-2010 1,457 2,445 15 168 498
2010-2011 945 2,775 17 172 578
2011-2012 982 2,302 18 158 722
2012-2013 1,098 2,468 16 172 801
2013-2014 1,291 2,018 18 167 521
2014-2015 1,104 2,051 17 166 420
2015-2016 1,082 2,297 17 165 569
2016-2017 1,002 2,670 16 168 523
2017-2018 1,196 2,326 14 175 594
*CARA first asked programs to report aspirants in 2002-2003.
The 136 diaconate formation programs that have candidates in formation during the 2017–2018 academic year report 2,326 candidates. This number is down 13 percent from the 2,670 deacon candidates reported by 136 programs in 2016-2017. In addition, 95 programs, including 21 programs that have no current deacon candidates, reported another 1,196 aspirants – men who are in a period of discernment prior to entering diaconate formation. The number of aspirants reported is a little above the number reported in 2016-2017 and reflects the cyclic pattern found in many diaconate formation programs, which often accumulate aspirants for several years and then create a candidacy class who go through formation together.
Statistical Overview –Diaconate Formation
23
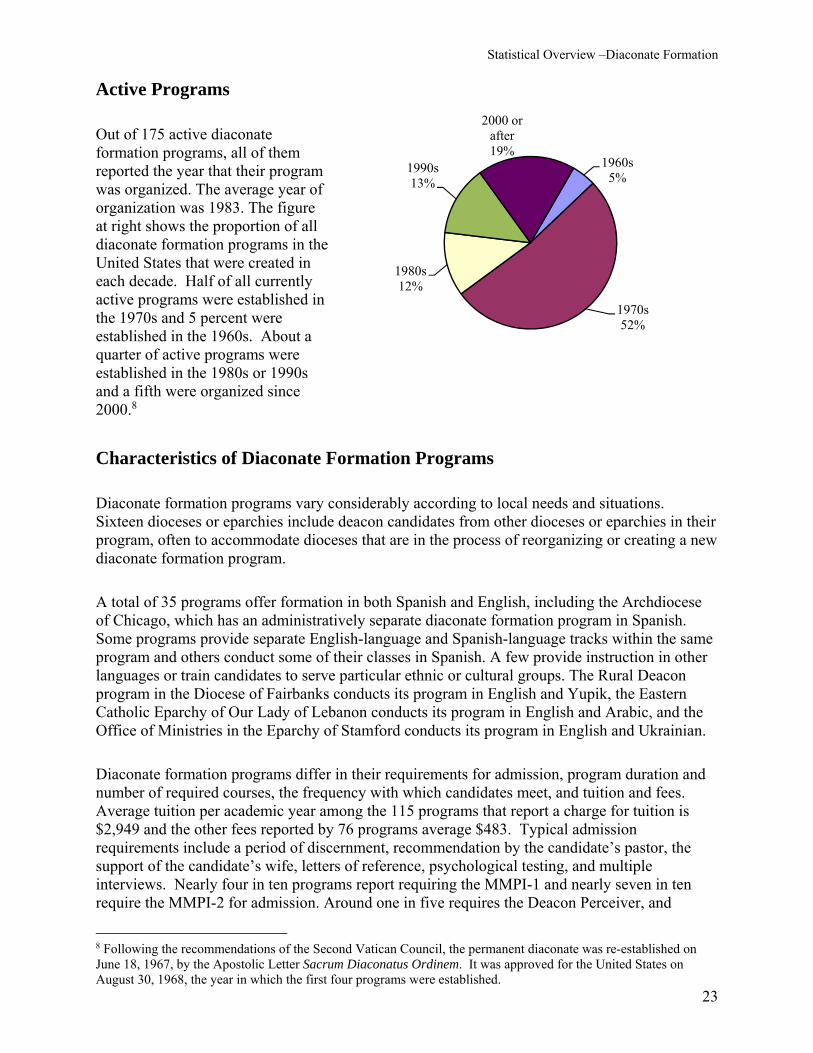
Active Programs Out of 175 active diaconate formation programs, all of them reported the year that their program was organized. The average year of organization was 1983. The figure at right shows the proportion of all diaconate formation programs in the United States that were created in each decade. Half of all currently active programs were established in the 1970s and 5 percent were established in the 1960s. About a quarter of active programs were established in the 1980s or 1990s and a fifth were organized since 2000.8
Characteristics of Diaconate Formation Programs Diaconate formation programs vary considerably according to local needs and situations. Sixteen dioceses or eparchies include deacon candidates from other dioceses or eparchies in their program, often to accommodate dioceses that are in the process of reorganizing or creating a new diaconate formation program. A total of 35 programs offer formation in both Spanish and English, including the Archdiocese of Chicago, which has an administratively separate diaconate formation program in Spanish. Some programs provide separate English-language and Spanish-language tracks within the same program and others conduct some of their classes in Spanish. A few provide instruction in other languages or train candidates to serve particular ethnic or cultural groups. The Rural Deacon program in the Diocese of Fairbanks conducts its program in English and Yupik, the Eastern Catholic Eparchy of Our Lady of Lebanon conducts its program in English and Arabic, and the Office of Ministries in the Eparchy of Stamford conducts its program in English and Ukrainian. Diaconate formation programs differ in their requirements for admission, program duration and number of required courses, the frequency with which candidates meet, and tuition and fees. Average tuition per academic year among the 115 programs that report a charge for tuition is $2,949 and the other fees reported by 76 programs average $483. Typical admission requirements include a period of discernment, recommendation by the candidate’s pastor, the support of the candidate’s wife, letters of reference, psychological testing, and multiple interviews. Nearly four in ten programs report requiring the MMPI-1 and nearly seven in ten require the MMPI-2 for admission. Around one in five requires the Deacon Perceiver, and
8 Following the recommendations of the Second Vatican Council, the permanent diaconate was re-established on June 18, 1967, by the Apostolic Letter Sacrum Diaconatus Ordinem. It was approved for the United States on August 30, 1968, the year in which the first four programs were established.
1960s5%
1970s52%
1980s12%
1990s13%
2000 or after19%
Statistical Overview –Diaconate Formation
24
around a third require clinical interview. Although many programs do not specify academic prerequisites, some stipulate a high school/equivalency diploma or college degree. Around three in ten programs report that deacon candidates must complete a lay ministry formation program as a prerequisite for diaconate formation. In a third of cases, this lay ministry formation is included as a part of the diaconate formation program. Deacon candidates typically meet one or two evenings or weekends in a month over the course of four to six years, for an average of 147 hours annually. Program length ranges from three years to six years, with an average length of 4.5 years. Shorter programs typically stipulate the prior completion of a ministry formation program. Program costs are often shared by participants, parishes, and dioceses, with the largest share typically paid by the diocese (on average, 72 percent).
Diaconate Formation Programs with Highest Enrollment, 2017-2018
Diocese Diaconate Candidates
Aspirants Anticipated Ordinations in 2018
Archdiocese of Los Angeles, CA 84 0 17
Diocese of Dallas, TX 56 27 30
Archdiocese of San Antonio, TX 56 17 0
Diocese of Austin 52 0 17
Archdiocese of Philadelphia, PA 51 7 17
Archdiocese of St. Louis, MO 48 22 25
Diocese of Joliet, IL 46 0 25
Archdiocese of Newark, NJ 46 0 0
Diocese of Harrisburg, PA 45 0 0
Archdiocese of Chicago, IL (English program) 45 12 16
Diocese of Brownsville, TX 44 0 0
Archdiocese of Galveston-Houston, TX 44 30 0
Diocese of Atlanta, GA 34 10 10
Archdiocese of Boston, MA 34 8 9
Diocese of San Bernardino, MA 33 12 0
Diocese of Brooklyn 32 0 0
Diocese of Honolulu 30 0 11
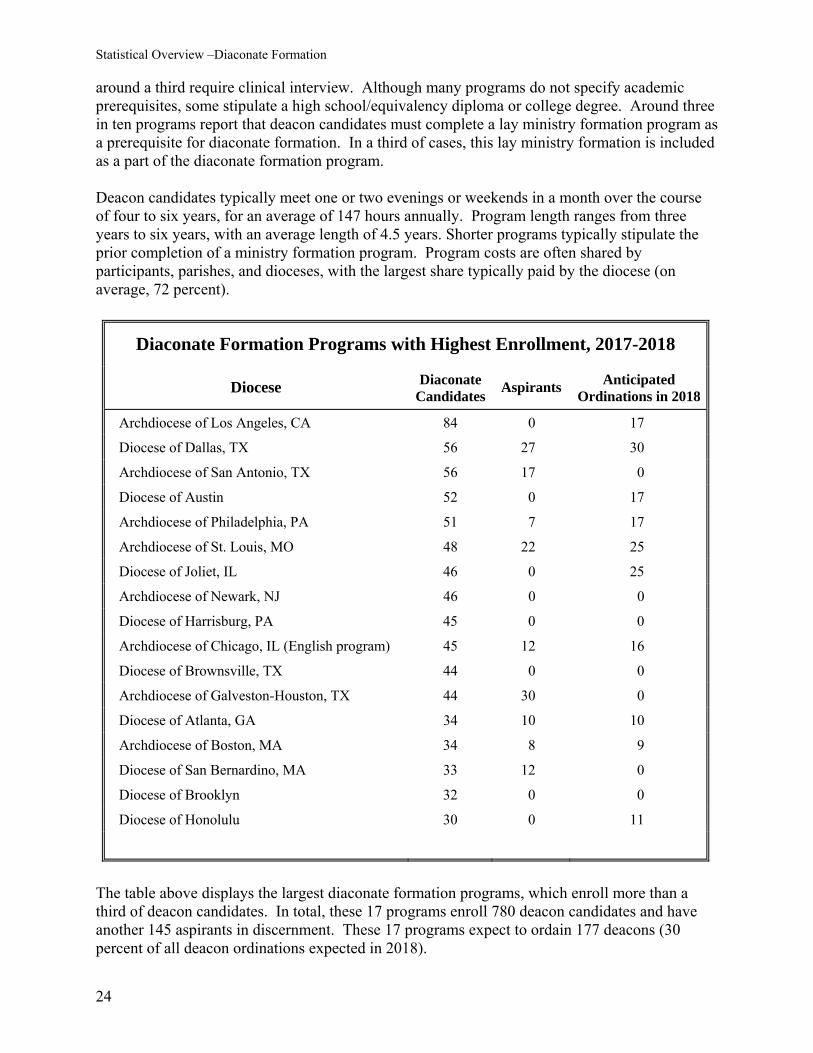
The table above displays the largest diaconate formation programs, which enroll more than a third of deacon candidates. In total, these 17 programs enroll 780 deacon candidates and have another 145 aspirants in discernment. These 17 programs expect to ordain 177 deacons (30 percent of all deacon ordinations expected in 2018).

Statistical Overview –Diaconate Formation
25
Profile of Diaconate Candidates
Age Distribution and Marital Status As the figure at right illustrates, three in four candidates (76 percent) for the permanent diaconate are in their forties and fifties. Just 4 percent are under age 40 and about one in five (20 percent) is age 60 or older. According to Canon Law, married deacon candidates must be 35 or older to be ordained. The vast majority of candidates, 96 percent, are married men. Two percent are single, never married, and 2 percent are widowed or divorced. Racial and Ethnic Background
Seven in ten deacon candidates (70 percent) are white/Anglo/Caucasian. A quarter of deacon candidates in formation programs (24 percent) are Hispanic/Latino. Asians/Pacific Islanders comprise 4 percent of deacon candidates and blacks/African Americans comprise 2 percent. Native Americans, multi-racial, and other ethnicities make up another 1 percent.
Educational Attainment
Slightly more than eight in ten deacon candidates (79 percent) have at least some college education. More than a third (36 percent) have a bachelor’s degree and a just over a quarter (26 percent) have a graduate degree. One in five (21 percent) has a high school education or less.
Age 39 and Under
4%
Age 40-4924%
Age 50-5952%
Age 60 and Above20%
White/Anglo/
Caucasian70%Black/
African American
2%
Hispanic/ Latino24%
Asian/Pacific Islander
4%
Native/ Other1%
High School or
Less21%
Some College
17%
Bachelor's Degree
36%
Graduate Degree
26%
Statistical Overview – Lay Ecclesial Ministry Formation
26
Lay Ecclesial Ministry Formation In 2005, the United States Conference of Catholic Bishops adopted Co-Workers in the Vineyard of the Lord: A Resource for Guiding the Development of Lay Ecclesial Ministry. In that document, the bishops note that they have been using the terminology of lay ecclesial minister and lay ecclesial ministry since 1980 in Called and Gifted: The American Catholic Laity. In Co-Workers, the USCCB describes lay ecclesial ministry as characterized by:
Authorization of the hierarchy to serve publicly in the local church Leadership in a particular area of ministry Close mutual collaboration with the pastoral ministry of bishops, priests, and deacons Preparation and formation appropriate to the level of responsibilities assigned to them
Lay ecclesial minister is intended to be a generic term, not a specific role description or title. Co-Workers states that the ministry is lay “because it is service done by lay persons [including vowed religious]. The Sacramental basis [for lay ecclesial ministry] is the Sacraments of Initiation, not the Sacrament of Ordination.” It is ecclesial “because it has a place within the community of the Church, whose communion and mission it serves, and because it is submitted to the discernment, authorization, and supervision of the hierarchy.” It is ministry “because it is a participation in the threefold ministry of Christ who is priest, prophet and king.” The longest section of Co-Workers is on formation for lay ecclesial ministry. It begins by noting that the Church has always required proper preparation of those who exercise a ministry: it cites Canon 231, which states that “lay persons who devote themselves permanently or temporarily to some special service of the Church are obliged to acquire the appropriate formation which is required to fulfill their function properly.” This section of the Ministry Formation Directory documents the development of such formation programs for lay persons in the United States.
Trends
In 1986, the USCCB Committee on the Laity completed the first nationwide study of formation programs designed to prepare lay Catholics for parish-level church ministry. CARA has been conducting studies of lay ministry formation programs nearly every year since 1994. As it has in each of its previous studies, CARA limits the scope of its survey to programs of at least two years’ duration that provide training for professional lay ecclesial ministry. The role of the laity and their participation in the ministry of the Church has evolved considerably in the decades since the Second Vatican Council. At the same time, the number of formation programs to train lay people for professional church ministry has increased, and many programs have expanded their scope. Since the first study of lay ministry formation in 1985-1986, the number of programs increased by more than 50 percent, but since 2010 has remained around the same as 1985-1986. The number of participants in these programs, however, has doubled.
Statistical Overview – Lay Ecclesial Ministry Formation
27
Beginning in 2003-2004, CARA collaborated with the USCCB to improve the data collection so that participants in ministry formation programs who are preparing themselves for lay ecclesial ministry can be differentiated more accurately from those who are participating in these programs primarily for adult faith formation. Since that time, CARA now asks programs to identify degree candidates and certificate candidates separately, rather than asking only for the total number enrolled in the program. In addition, CARA asks each program to identify more clearly its affiliation with a degree-granting institution, where appropriate. While adult faith formation is vitally important for the Church, the purpose of this part of the Directory is to provide a complete list and to monitor trends among the programs that prepare adults for lay ecclesial ministry in the Church. Reported enrollment in lay ecclesial ministry formation programs has fluctuated over the 30 years that the data have been collected. This fluctuation in numbers is partly a function of CARA’s work with the USCCB to distinguish more carefully lay ecclesial ministry formation from adult faith formation, as described above. The largest number reported in formation was in 2002-2003, when a record 36,048 total participants were identified. A second reason for the fluctuation is that the number of active programs offering formation in lay ecclesial ministry has also varied widely. CARA works throughout the year to identify new programs that have not been previously listed in the Directory and to clarify the status of other programs that have been discontinued or that did not respond to the survey. In 2017-2018, CARA identified a total of 204 active lay ecclesial ministry formation programs and received program information from 189 active programs, for a response of 93 percent. The 189 responding programs in 2017-2018 is a decrease of 1 percent from the 191 active programs that responded in 2016-2017. Among the directors of the 189 active programs that responded to repeated requests for information, 29 supplied program information but did not provide any information on their enrollment. The information provided in the table on the next page does not include the participants enrolled in those 29 programs.
Statistical Overview – Lay Ecclesial Ministry Formation
28
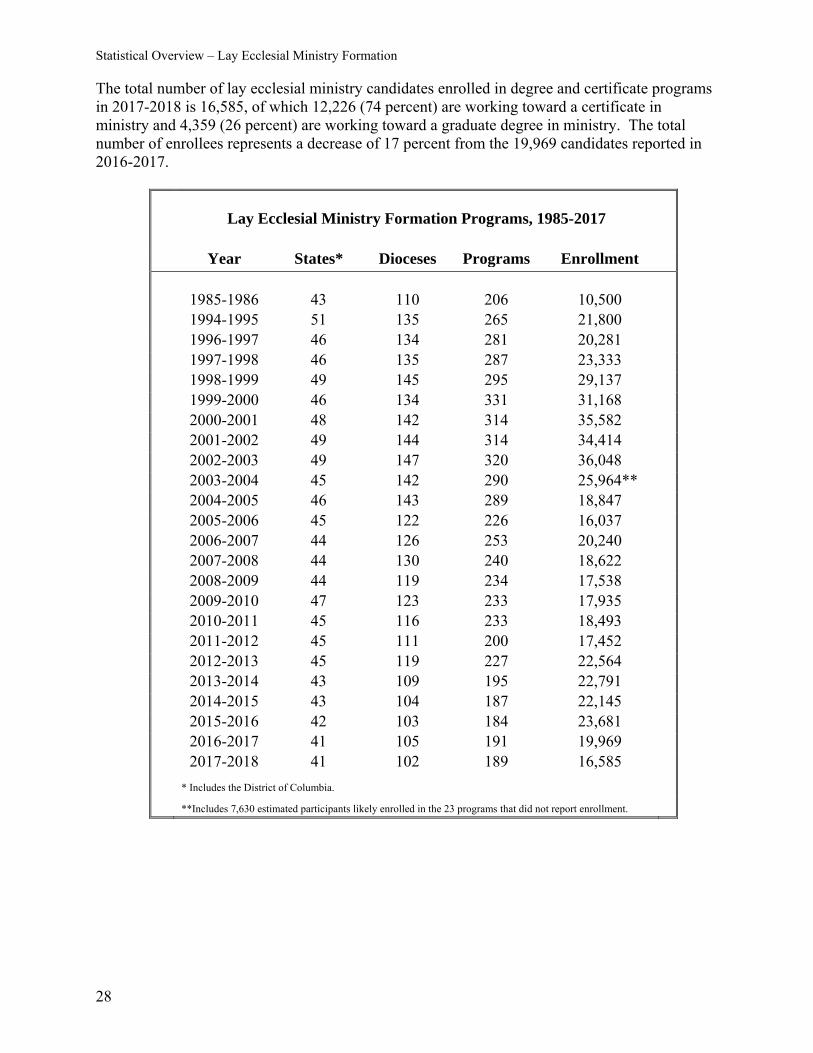
The total number of lay ecclesial ministry candidates enrolled in degree and certificate programs in 2017-2018 is 16,585, of which 12,226 (74 percent) are working toward a certificate in ministry and 4,359 (26 percent) are working toward a graduate degree in ministry. The total number of enrollees represents a decrease of 17 percent from the 19,969 candidates reported in 2016-2017.
Lay Ecclesial Ministry Formation Programs, 1985-2017 Year States* Dioceses Programs Enrollment 1985-1986 43 110 206 10,500 1994-1995 51 135 265 21,800 1996-1997 46 134 281 20,281 1997-1998 46 135 287 23,333 1998-1999 49 145 295 29,137 1999-2000 46 134 331 31,168 2000-2001 48 142 314 35,582 2001-2002 49 144 314 34,414 2002-2003 49 147 320 36,048 2003-2004 45 142 290 25,964** 2004-2005 46 143 289 18,847 2005-2006 45 122 226 16,037 2006-2007 44 126 253 20,240 2007-2008 44 130 240 18,622 2008-2009 44 119 234 17,538 2009-2010 47 123 233 17,935 2010-2011 45 116 233 18,493 2011-2012 45 111 200 17,452 2012-2013 45 119 227 22,564 2013-2014 43 109 195 22,791 2014-2015 43 104 187 22,145 2015-2016 42 103 184 23,681 2016-2017 41 105 191 19,969 2017-2018 41 102 189 16,585 * Includes the District of Columbia.
**Includes 7,630 estimated participants likely enrolled in the 23 programs that did not report enrollment.

Statistical Overview – Lay Ecclesial Ministry Formation
29
Program Profile
A number of different types of lay ecclesial ministry formation programs offer either a degree or a certificate in a ministry-related field. CARA asked program directors to classify their program into one of four categories, according to the program’s relationship with a degree-granting institution. The figure at right shows the proportion of programs that place themselves in each of the four categories. Slightly less than half (48 percent) of all responding programs offer a certificate but no degree. This table presents the average number of faculty and students in these four types of programs.
Lay Ecclesial Ministry Programs, 2017-2018
Type of Program
Average Number of Faculty
Average Number of Program Participants
Full-time Part-time Degree Certificate
Degree Program associated with a Catholic Seminary or School of Theology – no certificates
12 7 53 ―
Degree Program associated with a Catholic College or University – no certificates
13 9 80 ―
Combined Degree and Certificate Program 6 11 36 54
Certificate Program only – no degrees 2 16 ― 138
Many lay ecclesial ministry formation programs can be classified as either exclusively diocesan-based or academic-based, but several are the result of collaboration between a diocese and an academic institution. In these cases, often the diocese assumes responsibility for the human, spiritual, and pastoral formation, while the academic institution is responsible for the intellectual formation. Currently, 105 active programs are sponsored or co-sponsored by a diocese, 65 are sponsored or co-sponsored by a Catholic college or university, and 13 are sponsored or co-sponsored by a seminary or school of theology. Loyola University in New Orleans operates 18 active programs that are both diocesan-sponsored and university-affiliated through the Loyola Institute for Ministry. CARA received program information from 11 of these programs in 2017-2018.
Degree Only:
Seminary or School of Theology
5%
Degree Only:
Catholic College or University
9%
Combined Degree and Certificate Program
38%
Certificate Program
Only48%
Statistical Overview – Lay Ecclesial Ministry Formation
30
In addition to academic and diocesan-based programs, a few independent Catholic organizations sponsor several other programs. Another 14 independent programs in clinical pastoral education (CPE) are offered by Catholic hospitals to train ministers who serve as chaplains in medical settings. Some programs are designed to meet particular needs in lay ecclesial ministry formation, including several programs designed specifically for ministry with and to the Hispanic community (such as the Escuela de Ministerios Pastorales of the Diocese of Oakland or the Instituto Fe y Vida in the Diocese of Stockton), one program designed for ministry formation in the African American community (the Institute for Black Catholic Studies in New Orleans, LA), and one program, offered by the National Association of Pastoral Musicians, which prepares pastoral musicians for certification as a Director of Music Ministries. Another program, the Master of Science in Church Management at Villanova University, is designed to prepare those who are in church leadership and administrative roles who are seeking to become better stewards of church resources by improving their business and management skills.
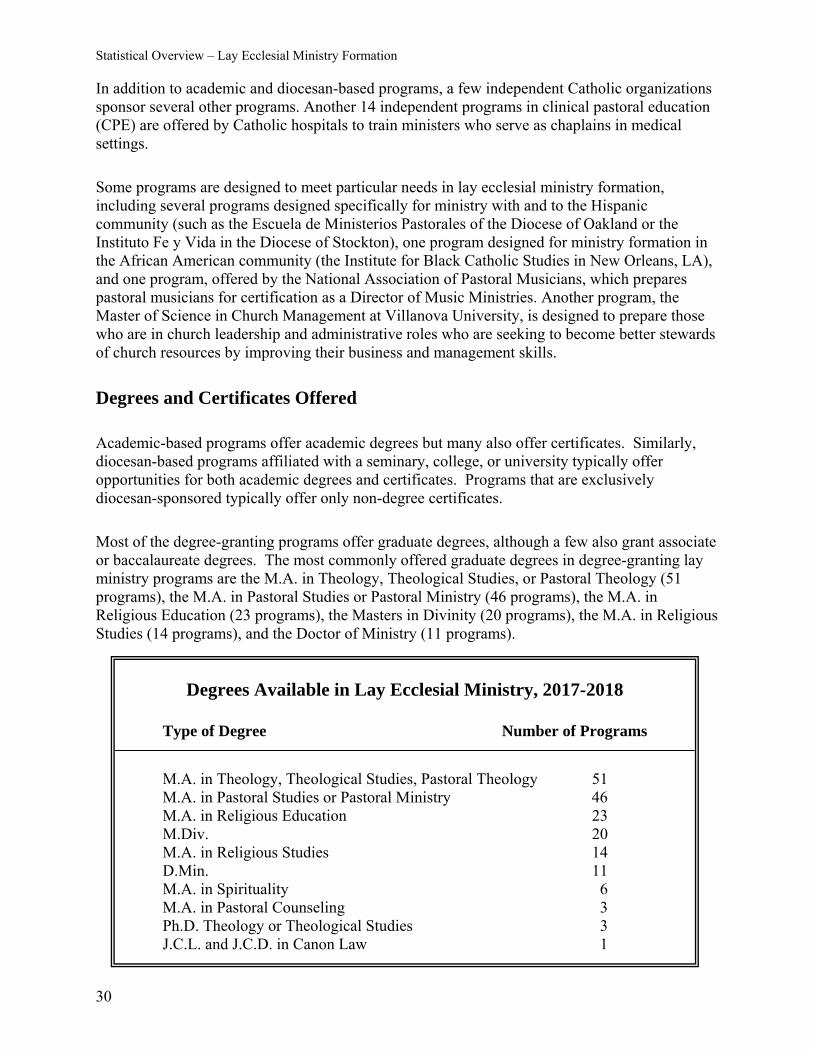
Degrees and Certificates Offered Academic-based programs offer academic degrees but many also offer certificates. Similarly, diocesan-based programs affiliated with a seminary, college, or university typically offer opportunities for both academic degrees and certificates. Programs that are exclusively diocesan-sponsored typically offer only non-degree certificates. Most of the degree-granting programs offer graduate degrees, although a few also grant associate or baccalaureate degrees. The most commonly offered graduate degrees in degree-granting lay ministry programs are the M.A. in Theology, Theological Studies, or Pastoral Theology (51 programs), the M.A. in Pastoral Studies or Pastoral Ministry (46 programs), the M.A. in Religious Education (23 programs), the Masters in Divinity (20 programs), the M.A. in Religious Studies (14 programs), and the Doctor of Ministry (11 programs).
Degrees Available in Lay Ecclesial Ministry, 2017-2018
Type of Degree Number of Programs
M.A. in Theology, Theological Studies, Pastoral Theology 51 M.A. in Pastoral Studies or Pastoral Ministry 46 M.A. in Religious Education 23 M.Div. 20 M.A. in Religious Studies 14 D.Min. 11 M.A. in Spirituality 6 M.A. in Pastoral Counseling 3 Ph.D. Theology or Theological Studies 3 J.C.L. and J.C.D. in Canon Law 1
Statistical Overview – Lay Ecclesial Ministry Formation
31
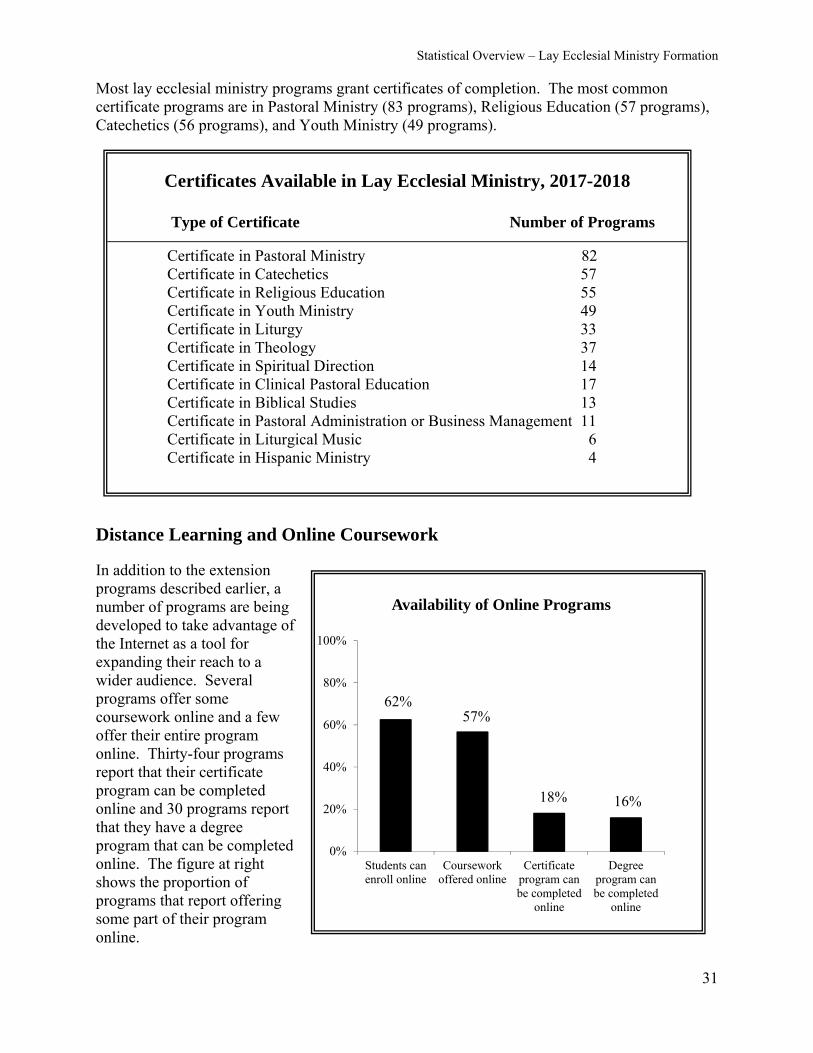
Most lay ecclesial ministry programs grant certificates of completion. The most common certificate programs are in Pastoral Ministry (83 programs), Religious Education (57 programs), Catechetics (56 programs), and Youth Ministry (49 programs).
Distance Learning and Online Coursework
In addition to the extension programs described earlier, a number of programs are being developed to take advantage of the Internet as a tool for expanding their reach to a wider audience. Several programs offer some coursework online and a few offer their entire program online. Thirty-four programs report that their certificate program can be completed online and 30 programs report that they have a degree program that can be completed online. The figure at right shows the proportion of programs that report offering some part of their program online.
Certificates Available in Lay Ecclesial Ministry, 2017-2018
Type of Certificate Number of Programs
Certificate in Pastoral Ministry 82 Certificate in Catechetics 57 Certificate in Religious Education 55 Certificate in Youth Ministry 49 Certificate in Liturgy 33 Certificate in Theology 37 Certificate in Spiritual Direction 14 Certificate in Clinical Pastoral Education 17 Certificate in Biblical Studies 13 Certificate in Pastoral Administration or Business Management 11 Certificate in Liturgical Music 6 Certificate in Hispanic Ministry 4
62%57%
18% 16%
0%
20%
40%
60%
80%
100%
Students canenroll online
Courseworkoffered online
Certificateprogram canbe completed
online
Degreeprogram canbe completed
online
Availability of Online Programs
Statistical Overview – Lay Ecclesial Ministry Formation
32
Language of Instruction
Lay ecclesial ministry formation programs are conducted in a variety of languages. Nearly all use English as the primary language of instruction, but ten programs are taught only in Spanish, 51 use both English and Spanish, and two more make some accommodation for use of Spanish. In addition, one program uses English, Spanish, and Haitian Creole; one uses English, Spanish, Vietnamese, and Korean; one uses English, Spanish, Portuguese, and Brazilian; and one uses English and Latin.
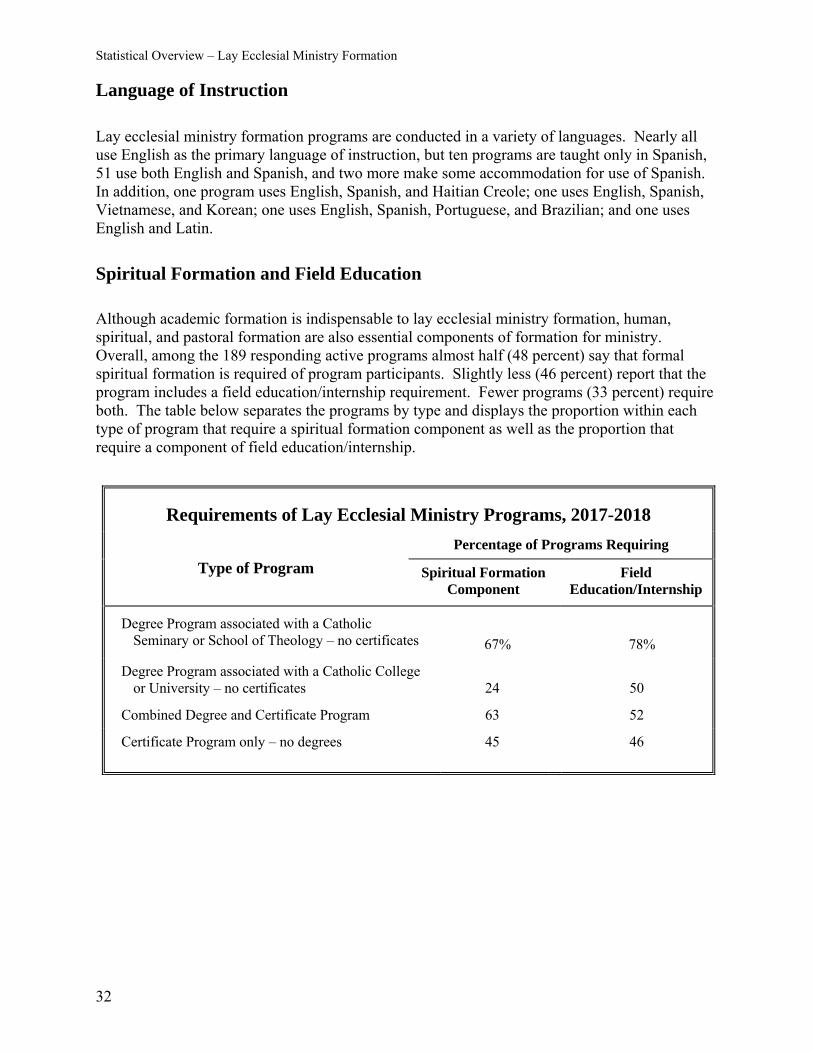
Spiritual Formation and Field Education Although academic formation is indispensable to lay ecclesial ministry formation, human, spiritual, and pastoral formation are also essential components of formation for ministry. Overall, among the 189 responding active programs almost half (48 percent) say that formal spiritual formation is required of program participants. Slightly less (46 percent) report that the program includes a field education/internship requirement. Fewer programs (33 percent) require both. The table below separates the programs by type and displays the proportion within each type of program that require a spiritual formation component as well as the proportion that require a component of field education/internship.
Requirements of Lay Ecclesial Ministry Programs, 2017-2018
Type of Program
Percentage of Programs Requiring
Spiritual Formation Component
Field Education/Internship
Degree Program associated with a Catholic Seminary or School of Theology – no certificates 67% 78%
Degree Program associated with a Catholic College or University – no certificates 24 50
Combined Degree and Certificate Program 63 52
Certificate Program only – no degrees 45 46
Statistical Overview – Lay Ecclesial Ministry Formation
33
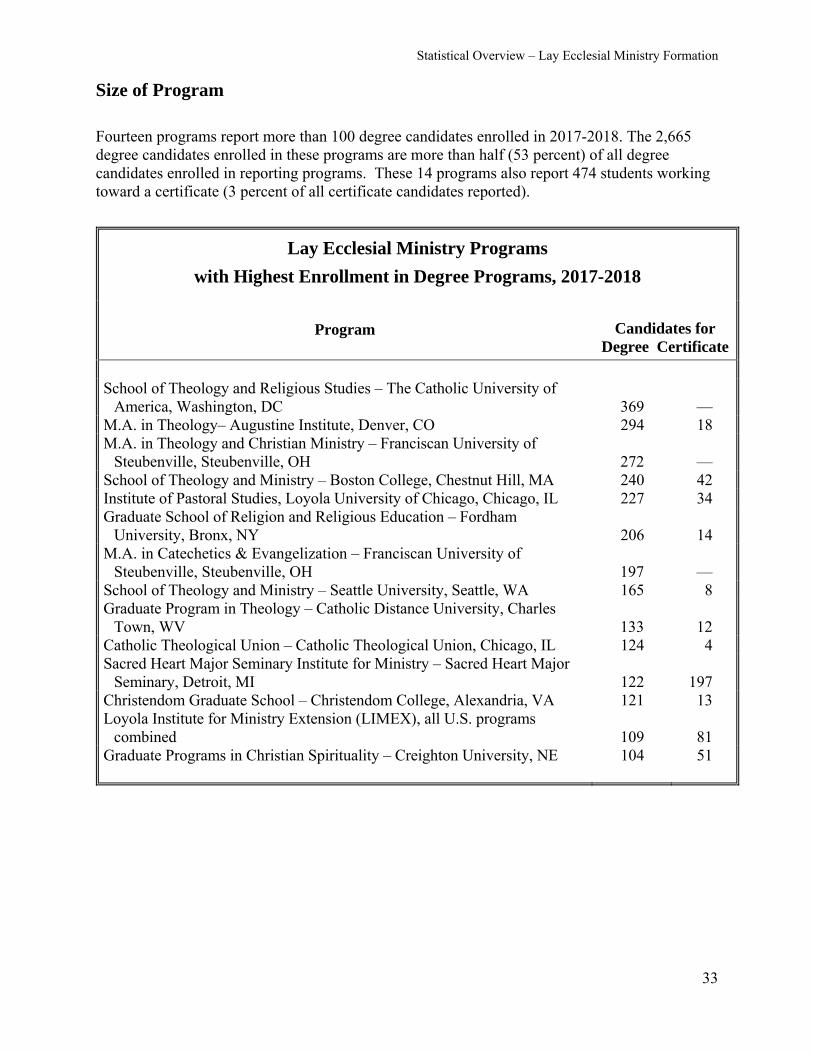
Size of Program
Fourteen programs report more than 100 degree candidates enrolled in 2017-2018. The 2,665 degree candidates enrolled in these programs are more than half (53 percent) of all degree candidates enrolled in reporting programs. These 14 programs also report 474 students working toward a certificate (3 percent of all certificate candidates reported).
Lay Ecclesial Ministry Programs
with Highest Enrollment in Degree Programs, 2017-2018
Program
Candidates for Degree Certificate
School of Theology and Religious Studies – The Catholic University of
America, Washington, DC 369 — M.A. in Theology– Augustine Institute, Denver, CO 294 18 M.A. in Theology and Christian Ministry – Franciscan University of
Steubenville, Steubenville, OH 272 — School of Theology and Ministry – Boston College, Chestnut Hill, MA 240 42 Institute of Pastoral Studies, Loyola University of Chicago, Chicago, IL 227 34 Graduate School of Religion and Religious Education – Fordham
University, Bronx, NY 206 14 M.A. in Catechetics & Evangelization – Franciscan University of
Steubenville, Steubenville, OH 197 — School of Theology and Ministry – Seattle University, Seattle, WA 165 8 Graduate Program in Theology – Catholic Distance University, Charles
Town, WV 133 12 Catholic Theological Union – Catholic Theological Union, Chicago, IL 124 4 Sacred Heart Major Seminary Institute for Ministry – Sacred Heart Major
Seminary, Detroit, MI 122 197 Christendom Graduate School – Christendom College, Alexandria, VA 121 13 Loyola Institute for Ministry Extension (LIMEX), all U.S. programs
combined 109 81 Graduate Programs in Christian Spirituality – Creighton University, NE 104 51
Statistical Overview – Lay Ecclesial Ministry Formation
34
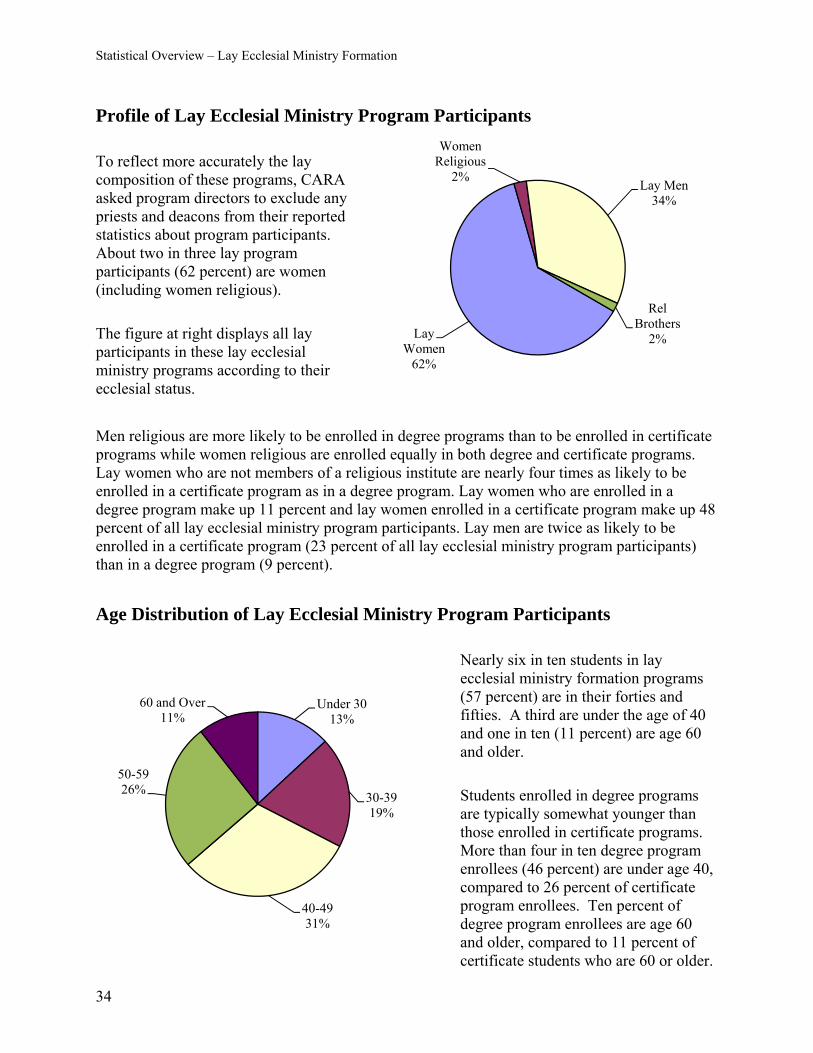
Profile of Lay Ecclesial Ministry Program Participants
To reflect more accurately the lay composition of these programs, CARA asked program directors to exclude any priests and deacons from their reported statistics about program participants. About two in three lay program participants (62 percent) are women (including women religious). The figure at right displays all lay participants in these lay ecclesial ministry programs according to their ecclesial status.
Men religious are more likely to be enrolled in degree programs than to be enrolled in certificate programs while women religious are enrolled equally in both degree and certificate programs. Lay women who are not members of a religious institute are nearly four times as likely to be enrolled in a certificate program as in a degree program. Lay women who are enrolled in a degree program make up 11 percent and lay women enrolled in a certificate program make up 48 percent of all lay ecclesial ministry program participants. Lay men are twice as likely to be enrolled in a certificate program (23 percent of all lay ecclesial ministry program participants) than in a degree program (9 percent).
Age Distribution of Lay Ecclesial Ministry Program Participants
Nearly six in ten students in lay ecclesial ministry formation programs (57 percent) are in their forties and fifties. A third are under the age of 40 and one in ten (11 percent) are age 60 and older. Students enrolled in degree programs are typically somewhat younger than those enrolled in certificate programs. More than four in ten degree program enrollees (46 percent) are under age 40, compared to 26 percent of certificate program enrollees. Ten percent of degree program enrollees are age 60 and older, compared to 11 percent of certificate students who are 60 or older.
Lay Women
62%
Women Religious
2%Lay Men
34%
Rel Brothers
2%
Under 3013%
30-3919%
40-4931%
50-5926%
60 and Over11%
Statistical Overview – Lay Ecclesial Ministry Formation
35
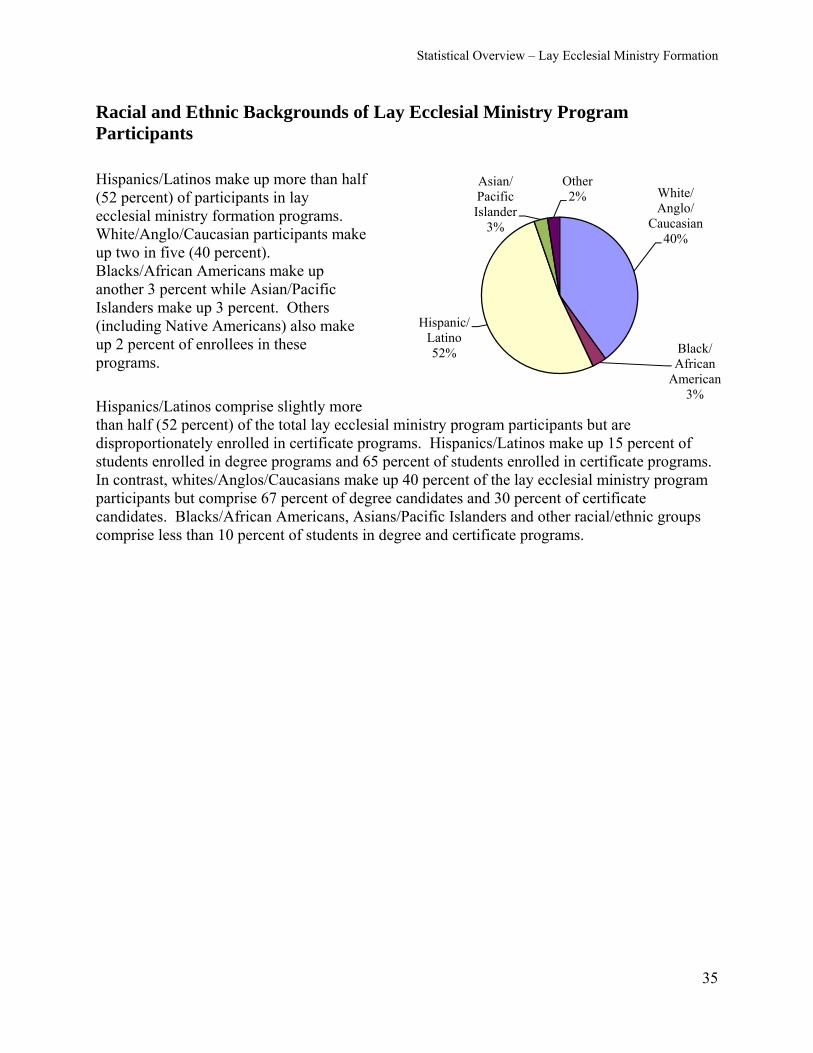
Racial and Ethnic Backgrounds of Lay Ecclesial Ministry Program Participants Hispanics/Latinos make up more than half (52 percent) of participants in lay ecclesial ministry formation programs. White/Anglo/Caucasian participants make up two in five (40 percent). Blacks/African Americans make up another 3 percent while Asian/Pacific Islanders make up 3 percent. Others (including Native Americans) also make up 2 percent of enrollees in these programs. Hispanics/Latinos comprise slightly more than half (52 percent) of the total lay ecclesial ministry program participants but are disproportionately enrolled in certificate programs. Hispanics/Latinos make up 15 percent of students enrolled in degree programs and 65 percent of students enrolled in certificate programs. In contrast, whites/Anglos/Caucasians make up 40 percent of the lay ecclesial ministry program participants but comprise 67 percent of degree candidates and 30 percent of certificate candidates. Blacks/African Americans, Asians/Pacific Islanders and other racial/ethnic groups comprise less than 10 percent of students in degree and certificate programs.
White/Anglo/
Caucasian40%
Black/African
American3%
Hispanic/ Latino52%
Asian/Pacific Islander
3%
Other2%