cell-specific computational modeling of the pim pathway in ... · integrated systems and...
TRANSCRIPT

Integrated Systems and Technologies
Cell-Specific Computational Modeling of the PIMPathway in Acute Myeloid LeukemiaDana Silverbush1,2, Shaun Grosskurth3, Dennis Wang4, Francoise Powell3,Berthold Gottgens5, Jonathan Dry3, and Jasmin Fisher2,6
Abstract
Personalized therapy is a major goal of modern oncology, aspatient responses vary greatly even within a histologicallydefined cancer subtype. This is especially true in acute myeloidleukemia (AML), which exhibits striking heterogeneity inmolecular segmentation. When calibrated to cell-specific data,executable network models can reveal subtle differences insignaling that help explain differences in drug response. Fur-thermore, they can suggest drug combinations to increaseefficacy and combat acquired resistance. Here, we experimen-tally tested dynamic proteomic changes and phenotypicresponses in diverse AML cell lines treated with pan-PIM kinaseinhibitor and fms-related tyrosine kinase 3 (FLT3) inhibitor assingle agents and in combination. We constructed cell-specificexecutable models of the signaling axis, connecting geneticaberrations in FLT3, tyrosine kinase 2 (TYK2), platelet-derived
growth factor receptor alpha (PDGFRA), and fibroblast growthfactor receptor 1 (FGFR1) to cell proliferation and apoptosis viathe PIM and PI3K kinases. The models capture key differencesin signaling that later enabled them to accurately predict theunique proteomic changes and phenotypic responses of eachcell line. Furthermore, using cell-specific models, we tailoredcombination therapies to individual cell lines and successfullyvalidated their efficacy experimentally. Specifically, we showedthat cells mildly responsive to PIM inhibition exhibitedincreased sensitivity in combination with PIK3CA inhibition.We also used the model to infer the origin of PIM resistanceengineered through prolonged drug treatment of MOLM16 celllines and successfully validated experimentally our predictionthat this resistance can be overcome with AKT1/2 inhibition.Cancer Res; 77(4); 1–12. �2016 AACR.
IntroductionThe potential of personalized medicine is dependent on our
ability to translate the molecular context of patients' tumors intointerpretable clinical outcomes. Successful steps have been takento accurately predict tumor progression and response to treatmentfrom molecular disease markers (1, 2). Using tumor cell line–based compound screening, we can provide robust readouts ofcellular responses to multiple compounds. This information canbe used to systematically train computational models of themolecular signaling pathways contributing to drug sensitivityand resistance in various cancer settings, and to propose noveldrug targets and combination approaches. Cell line screens have
provided some success in explaining or predicting drug responsesby driver gene mutations (2–4); however, in many cases the truemechanism of resistance remains elusive or more complex. Mostpredictive methods routinely used today use correlative statisticsor feature-based learning techniques such as machine learning,while network methods remain scarce despite their potential forextracting mechanistic insights and actionable biomarkers.
The molecular heterogeneity within cancer types further com-plicates the prediction of tumor cell behavior determining apatient's drug response. Multiple somatic mutations, epigeneticevents or otherwise deregulated gene/protein expression maycontribute to driving the disease. This is true in acute myeloidleukemia (AML), where patients may harbor somatic mutationsin a number of potential oncogenes, including FLT3,MLL, TYK2,FGFR1, PDGFRA, IDH1, DNMT3A, affecting expression of down-stream signaling for example through PIM kinases (5–7). FLT3internal tandemduplications (FLT3-ITD) andPIMoverexpressionare associated with poor prognosis in AML patients, motivatingthe development of small molecule inhibitors targeting theseproteins (8, 9). Incomplete signaling inhibition or the presenceof multiple molecular alterations that reduce a tumors depen-dencyonanyone targetmay result in drug resistance (10, 11). Thismay be overcome through rational drug combinations; however,optimal approaches are rarely obvious and high-throughputcombination screening is complex and expensive with limitedsuccess shown.
With an aging population, the incidence of AML is increasing,with the number of new cases per year approaching 20,000 in theUnited States alone. AML therefore presents a large unmet clinicalneed, with overall 5-year survival rates remaining at around 25%.Most patients will respond to initial cytoreductive therapy, but a
1Department of Computer Science, Tel-Aviv University, Tel-Aviv, Israel. 2Micro-soft Research, Cambridge, UK. 3AstraZeneca Oncology IMED, Waltham, Mas-sachusetts. 4AstraZeneca Oncology IMED, Cambridge, UK. 5Department ofHaematology, Cambridge Institute for Medical Research and Wellcome Trustand MRC Stem Cell Institute, University of Cambridge, UK. 6Department ofBiochemistry, University of Cambridge, Cambridge, UK.
Note: Supplementary data for this article are available at Cancer ResearchOnline (http://cancerres.aacrjournals.org/).
D. Silverbush and S. Grosskurth contributed equally to this article.
Jasmin Fisher and Jonathan Dry contributed equally to this article.
Corresponding Authors: Jasmin Fisher, Department of Biochemistry, Univer-sity of Cambridge, Cambridge, CB2 1QW, UK. Phone: 441223766058; Fax:441223333345; E-mail: [email protected]; and Jonathan Dry,[email protected]
doi: 10.1158/0008-5472.CAN-16-1578
�2016 American Association for Cancer Research.
CancerResearch
www.aacrjournals.org OF1

large proportion will relapse with emergence of drug-resistantclones. Given that bone marrow transplantation as the onlycurative therapy is not an option for many patients, a betterunderstanding of the regulatory pathways causing leukemic trans-formation and in particular the emergence of resistance will beessential to improve treatment outcomes in AML.
Computational simulations of cancer cell signaling have thepotential to overcome both the limitation of cell line diversityand in vitro screening throughput. Computational modelingapproaches can be used to capture and integrate knowledge withmolecular and phenotypic data to better understand the geneticand signaling dependencies determining a drug's mechanism ofaction. The models should be unique to the tumor cell context,include key proteins and their interactions while accounting forinfluential gene mutations, and would ideally extend to othermolecules involved in cell signaling. Execution of such modelsshould demonstrate the intracellular signaling activity as it istriggered by different mutations and different therapeutic modal-ities, resulting in different cell phenotypes.
Computational models based around Boolean networks, pio-neered by Kauffman (12) as a model for genetic regulatory net-works, have been demonstrated for interpretation of large datasets as well as for drug discovery (13–15). In these models,relationships are represented in a dynamic network with discretetime steps. Signalingmolecules represented bynodes in a networkcan have two states (hence a Boolean network) and edges aredirected and may be activating or inhibitory; however, this canoversimplify biological signaling where molecules often exist inmultiple states with interactions that are rarely binary. QualitativeNetworks (QN) make an extension to Boolean networks to allowvariables to range over larger discrete domains by replacingBoolean functions with algebraic functions (further details inSupplementary Methods; ref. 16). Specifically, the graphical toolBio Model Analyzer (BMA; ref. 17; available at http://biomode-lanalyzer.org/) has previously been used to encapsulate chronicmyeloid leukemia (CML) cell signaling information from >150publications in a QN model (18) able to then successfullyrecapitulate multiple independent experimental results. Anotherextension to Boolean networks is provided by QuantitativeModeling approaches, allowing variables to range over nondis-crete values and so capturing more complex relationships, butonly feasible for much smaller, well-studied systems (19).
In this study, we use QNs to model the protein signalingconnecting genetic aberrations in FLT3, TYK2, PDGFRA, or FGFR1to cell proliferation/apoptosis via the PIM and PI3K kinases forfour AML cell lines, accounting for their unique genetic andphenotypic diversity. Construction and analysis of the biologicalQN model was achieved in BMA (17). By incorporating cell-specific–context switches in the model for four cell lines, we wereable to accurately model response and resistance to a pan-PIMkinase inhibitor AZD1208 and the FLT3 inhibitor AC220 andvalidated experimentally our predictions. The model provides auseful tool forAML research, and the approachoffers value todrugdiscovery and early development.
Materials and MethodsReagents
AZD1208, selumetinib, and AZD5363 were synthesized byAstraZeneca R&D and diluted in dimethyl sulfoxide (Sigma-Aldrich). AC220 and pictilisib were purchased externally.
Cell line treatmentCell lines (CMK, EOL1, HL60, KASUMI3, KG1A, MOLM13,
MOLM16, MONOMAC6, MV411, NOMO1, OCIAML2,OCIM1, and OCIM2) were purchased from ATCC (http://www.atcc.org/) cell bank and passaged in our laboratory forfewer than 6 months after receipt or resuscitation. ATCC usesmorphology, karyotyping, and PCR-based approaches to con-firm the identity of human cell lines and to rule out both intra-and interspecies contamination.
All cells were cultured and assayed as previously described inref. 8 and in Supplementary Methods.
Growth inhibition calculationFor single agent, GI50 were calculated from the ratio of the
72-hour treatment to 72-hour DMSO control, after subtractionof the day 0 data from each measurement. The dose–responsedata were fitted using Xlfit (Microsoft Excel). For combination,percent growth inhibition was determined using the Chalicesoftware with values of 0 to 100%, indicating antiproliferation(fewer number of cells than the vehicle control but greaterthan or equal to the number of cells at the start of treatment)and values of 101% to 200%, indicating cell death (fewercells than at the start of treatment). Day 0 values were sub-tracted from the day 3 treatments. The combination Indexes(CI) and Synergy scores were determined using the softwareprogram Chalice (Zalicus), and CI determination was made atthe ED50 value. Synergy was determined by the Loewe addi-tivity model.
Full methods for gene expression microarray, whole-exomeDNA sequencing, and Theranositcs proteomics are in the Sup-plementary Methods; a brief description follows.
Gene expression microarrayCell line lysate was generated from logarithmic growing CMK,
EOL1, HL60, KASUMI3, KG1A, MOLM13, MOLM16, MONO-MAC6, MV411, NOMO1, OCIAML2, OCIM1, and OCIM2 celllines. Lysate was sent to Expression Analysis (http://www.expres-sionanalysis.com/) for gene expression analysis on AffymetrixHuman Genome U133 Plus 2.0 Array. Expression results werefRMAnormalized, log2 transformed, and expressionwas averagedby gene symbol across probesets.
Whole-exome DNA sequencingCell lines lysate was generated from logarithmic growing CMK,
EOL1, HL60, KASUMI3, KG1A, MOLM13, MOLM16, MONO-MAC6,MV411,NOMO1,OCIAML2,OCIM1, andOCIM2. Lysatewas sent to Expression Analysis (http://www.expressionanalysis.com/) for whole-exome DNA sequencing and processed with theBCBio pipeline (https://bcbio-nextgen.readthedocs.org). Pairedanalysis of the parental and resistant cell lines was performed tousing FreeBayes (20), MuTect (21), and VarDict (GitHub) to callresistance–specific mutations.
Theranostics Health reverse-phased protein arrayCells were treated with AZD1208 or AC220 as single agent or in
combination for 3 or 24 hours. Lysate was prepared and shippedto Theranostics Health for reverse-phased protein array (RPPA)experiments.
Silverbush et al.
Cancer Res; 77(4) February 15, 2017 Cancer ResearchOF2

Protein Array data transformation for executable networkmodel construction
The relative linear log2 RPPA values were categorized for use inexecutable network modeling (Supplementary Fig. S1) on a 5point scale from 0 to 4 fitted to the distribution of the values(Supplementary Table S1).
Protein Western blotsCells were treated with AZD1208, AZD5363, or AC220 as
single agent, combination, or resistance as experimentallydescribed. Whole-cell extracts were fractionated by SDS-PAGEand transferred to a nitrocellulose membrane in transfer buffer(500 mmol/L glycine, 50 mmol/L Tris–HCl, 0.01% SDS, 10%methanol) buffer at 20 volts for 90 minutes using a semi-drytransfer apparatus according to the manufacturer's protocols(Invitrogen). The membranes are blocked with 10% nonfatmilk in TBS-T (10 mmol/L Tris, pH 8.0, 150 mmol/L NaCl,0.5% Tween 20) for 1 hour and washed three times with TBS-Tand exposed to primary antibodies in 5% milk in TBS-T againstpPRAS40 (CST 2997), p4EBP1 Ser 65 (CST 9451), pBAD (CST9296), pp70S6 (CST 9206), pS6 (CST 4858), pERK (CST 9106),pElF4B (CST 8151), pAKT(CST 4058), a-tubulin (CST 2144),or b-actin (CST 4970) at 4�CO/N. Membranes are washed threetimes for 10 minutes and incubated with a 1:10,000 dilution ofhorseradish peroxidase–conjugated anti-mouse or anti-rabbitantibodies (CST 7074) for 1 hour at room temperature. Afterwashing the membranes three times for ten minutes, signalswere visualized using the ECL system (Thermo Scientific).
PhosphoScan mass spectrometryWe confirmed the robustness of our finding for MOLM16
cells treated with 2 mmol/L AZD1208 for 3 hours (Supple-mentary Table S2) by applying a LC-MS/MS phosphorylationproteomic approach. Additional details are provided in theSupplementary Note.
Targeted treatment of AML cell linesWe investigated phenotypic and cell signaling responses
by RPPA. Because the PIM gene family is often overexpressed(22–24) and FLT3-ITD's are prevalent in AML (7), we treated thecells with the pan-PIM kinase inhibitor AZD1208 and the potentselective FLT3 inhibitor AC220 (Qizartinib) as monotherapy andin combination (25) and compared AML cell lines were treatedwith DMSO, 1 mmol/L AZD1208, 6 nmol/L AC220, or therespective combination, for 3 or 24 hours. Lysates were generated,protein values were assessed by RPPA and quadrant mediannormalized (QMN) protein levels calculated (SupplementaryTable S3). Statistically significant total protein and phosphoryla-tion changes were determined by log2 QMN differences greaterthan or equal to 0.5 and Wilcoxon rank-sum tests P values lessthan or equal to 0.1 (Supplementary Table S4).
ResultsAML cell lines show differential sensitivity to PIM inhibition
To identify potential genetic alterations associated with sensi-tivity to the pan-PIMkinase inhibitor AZD1208,we surveyed genevariants bywhole-exomeDNA sequencing (Supplementary TableS5) and prioritized by AML disease relevance (7). Although cellssensitive to AZD1208 do harbor AML relevant PDGFRA, FGFR1,FLT3, andMLL genetic variants, only a small number of cell lines
harbor the same variant, thereby failing to reach statistical sig-nificance in association to drug response (Fig. 1A). Basal cell linePIM1 mRNA expression tends to be higher in sensitive lines, aspreviously shown at the protein level (8), underlying the impor-tance of compound target expression alongside the interplay withgenetic alterations for sensitivity. However, cells harboring path-way relevant genetic alterations or overexpressing PIM exhibitvaried response to treatment, calling for a deeper examination ofthe cell signaling relating genotype to phenotype to provide abetter understanding of the molecular dependencies underlyingPIM inhibitor sensitivity in AML cell lines.
Cell type-specific differences in PIM pathway signaling inresponse to treatment
Given the wide variability of response to therapeutic agentsacross AML cell lines, we explored the differences in phospho-protein signalingdownstreamofPIM forAMLcell linesMOLM16,MV411, EOL1, and KG1A. RPPA measurements taken 24 hourspost pan-PIM inhibitor treatment reproduced published findings(8) of reducedBADphosphorylation in theMOLM16 cell line andreduced S6 pS235/236 in EOL1 (Fig. 1B). To estimate response ofcell lines, growth inhibition was quantified according to thenumber of viable cells after culturing with different concentra-tions of pan-PIM inhibitor, AZD1208, andFLT3 inhibitor, AC220,in combination (Fig. 1C; Supplementary Fig. S2). Directionalde-phosphorylation signaling trends seen in RPPA for BRAFpS445, EIF4B pS406, mTOR pS2481, and global BAD phosphor-ylation were confirmed by PhosphoScan mass spectrometry inMOLM16 cells after 3-hour treatment with AZD1208 (Supple-mentary Table S6).
Building a generalized model of PIM signaling in AMLIn order to model the observed genotypic and phenotypic
differences between the AML cell lines, we proposed a workflowfor developing a cell-specific context network model using theBMA tool from cell line molecular information (Fig. 2).We generated an initial generalized model from the manualcuration of 68 publications (Supplementary Table S7) for theAML cell line. The initial model contains a canonical set of 64interactions among 32 interacting proteins connected to 2cell phenotypes/behaviors of apoptosis and cell proliferation(http://www.bioc.cam.ac.uk/fisher/aml;GeneralModel.json,Supp-lementary Table S8). All values at nodes range from 0 to 4 torepresent the phosphorylation activity from the transformed RPPAdata, with 0 representing low to no activity and 4 representingabnormal over activity. The cellular behavior outcome for eachdisease state is reflected by the two terminal downstream nodes,which model the outcome for cellular abnormal proliferation andapoptosis rates. The generalized model of AML signaling wasable to capture only partial abnormal cell behavior for untreatedcells, capturing the abnormal low apoptosis levels for bothMOLM16 and MV411, and showing an increase in proliferation,yet not capturing the magnitude of the increase. In addition,known perturbations such as simulating inhibition of PIMs inthe model, showed the expected trend line of decreased prolifer-ation, yet did not exhibit the expected effect on apoptosis levels.
Introducing cell-specific context in QN modelsWe incorporated multiple gene mutation switches to construct
cell-specific context model (http://www.bioc.cam.ac.uk/fisher/aml; CellSpecificAML.json; Table 1). We iteratively refined the
Cell-Specific Computational Models of Acute Myeloid Leukemia
www.aacrjournals.org Cancer Res; 77(4) February 15, 2017 OF3

target function for each internal node to reflect the levels ofphosphorylation activity as measured by the transformed RPPAdata for each cell line as well as the qualitative activity reported inthe literature in accordance to gene mutations. A cell-specificcontext in the model is simulated by setting the switches for thedrivermutations found in that cell to 1, while all other switches to
mutations that were assessed as non-driver are set to 0 (Sup-plementary Table S9). As a result of different set of mutations"turned on" the protein activity exhibited by the model willdiffer between cell lines (Supplementary Table S10). Additionaldetails on data processing and model construction are in theSupplementary notes.
–1.33 (25%)
2.82 (75%)4EBP1 pS65BAD pS112BCR pY177
ERK1/2 pT202/Y204GSK3 BETA A/B pS21/9
GSK3 BETA pS9IGFI RECEPTOR BETA Total
PARP CleavedPRAS40 pT246
PTEN pS380S6 Ribo. Prot. pS240/244
MOLM16 EOL1 KG1A MV411Log2 QMN Protein Value
0.15 (Median)
S6 Ribo. Prot. pS235/236
DM
SO
AZD
1208
DM
SO
AZD
1208
DM
SO
AZD
1208
AC
220
Com
bo.
DM
SO
AZD
1208
AC
220
Com
bo.
4.90 (Max)
–3.41 (Min)
(0.25 mg/mL spots)
Wilcoxon rank sumtest versus DMSO
Raw P >0.1 or<log2 0.5 difference
Raw P <0.1 &>log2 0.5 difference
C
AA
ZD12
08 G
I 50 (m
mol
/L)
1 mmol/L
0
0.03
0.3
3
15
MO
LM16
EOL1
KA
SUM
I3
KG
1A
MV4
11
CM
K
HL6
0
MO
LM13
MO
NO
MAC
6
NO
MO
1
OC
IAM
L2
OC
IM1
OC
IM2
PIM1PIM2PIM3
FLT3
JAK2KIT
KRASNRAS
TYK2DNMT3A
IDH1PHF6MLL
TP53
SensitivitySensitive (GI50<1 mmol/L)Insensitive (5 mmol/L<GI50)
Expression array (Log2)Exp. ≤77< Exp. ≤88< Exp. ≤9
9< Exp. ≤1010> Exp.
Mutation−RelevanceComplex−CancerFusion−Cancer
PTD−CancerITD−CancerMissense−Cancer
Missense−UnlikelySilent None
Exom
e D
NA
-Seq
mut
atio
ns
Missense−Unknown
Fusion−Active
FGFR1
PDGFRA
Expr
essi
onar
ray
BAZ
D120
8 (mm
ol/L
)
AC220 (mmol/L)
0
0 0.001 0.003 0.01 0.03 0.1
0.03
0.11
0.33
1
3
MV411
Percent (%) growth inhibition3 day post-treatment assay
Completegrowth
Completegrowth
inhibition
Completedeath
Figure 1.
AML cell lines sensitive to the PIM inhibitor AZD1208 have diverse genotypes. A, GI50 (mmol/L) waterfall plot and molecular oncoprint illustrating the diversepharmacological response of AML cells after 72 hours AZD1208 treatment as well as PIM expression and AML disease-relevant mutations. Boxed cell linenames indicate responding cell lines further investigated.B,Protein expressionmeasured byRPPA in treated and untreated cell lines showheterogeneity in signalingresponses throughvarious pathways.C,MV411,with anactiveFLT3-ITD, showsvaried responses to concentrations ofAZD1208and/or theFLT3 inhibitorAC220 for 72hours. The number of viable cells was determined by Alamar Blue measurements, where the values represent percent growth inhibition.
Silverbush et al.
Cancer Res; 77(4) February 15, 2017 Cancer ResearchOF4

Executable QN model validated by cell type–specific signalingbehavior
The executable QNmodel (Fig. 3A) was built on the RPPA andgrowth inhibition of MOLM16 and MV411 cell lines, harboringTYK2mutation and FLT3-ITD, respectively (Fig. 1B). For each cellline across each treatment (Fig. 3B), the mean square error (MSE)observed between the transformed RPPA values and modeledsignaling activity ranged from 0.17 to 0.26 and median of 0.2(0.3 to 0.57 in the generalized model, median of 0.41), with thelowest seen for untreated MV411 andMOLM16 cell lines and the
highest for the MOLM16 cell line treated with AZD1208. Mean-while, across each protein, the MSE observed between the trans-formed RPPA values and each protein signaling activity rangedfrom 0 to 0.55 andmedian of 0.25 (0.5 to 0.88 in the generalizedmodel, median of 0.58), with the lowest seen for BAD and BCRand the highest seen for p27.
Equally as important, the cell-specific contextmodel performedwell in predicting cellular response as measured both by growthinhibition and markers of reduced proliferation and increasedapoptosis (Fig. 1B and C). The model accurately predicted
Protein 1 pSProtein 1 pTProtein 2 pT
Protein 2 TotalProtein ... pSProtien ... pT
Protein ... Total
TreatmentAML Cell 1 AML Cell 2
1 1
RPPA
2 2
Model validation1. Cell behavior
0.01Compound (mmol/L)
1-20
020
406080
GI50=50 nmol/LGI 50
3. Additional cell lines2. Perturbations from literaturePaper Cell Line Drug Results Inferred3 MOLM16 PIM
InhibitionNeglectalbyPRAS40
effected(2 -› 1)04SARP61MLOM
4EBP1 Neglectalbyeffected
4EBP1 (2 -› 1)
S6 (2 -› 1)S6 Slightly moreSignificant effect onapoptosis
Apoptosisincreased (0 -› 3)
1. New drug combinations2. Mechanisms for drug resistance
Prediction validationIn silico experimentation1. Combinations increased sensitivity2. Drug tailored toresistant mechanisminitiated apoptosis
LiteratureDriver mutantions Signaling
BMA AML ModelModel construction
PIM2
H3CHK
cMyc
PRAS40
p274EBP1
EIF4E
EIF3
mTORC1
mTORC2TSC2
Akt
S6
RAS RAF
Grb2/SOS MEK
PI3K
Bad
ERK
EIF4BRSK Apoptosis
Proliferation
TYK2
FLT-ITD
PDGFRA
FGFR1
PIM1
BCR
Model R
efinement
Apoptosis Growth
3-Day assay
Figure 2.
Schematic workflow of cell-specific model construction in BMA. Motifs and interactions curated from the literature are used to build a Qualitative Network in theBMA tool. The model was calibrated with the results of RPPA experiments for two cell lines with different AML-driving mutations. The model is designed torepresent the general AML pathways and provide a cell-specific context by "turning-on" a specific set of mutations. The mutations affect outgoing interactions,thus activating the pathways in a mutation-specific manner, resulting in mutation-specific phosphorylation activity throughout the pathways, leading to specificcellular behavior. The model is iteratively refined by testing and comparing with the cell behavior measured as a response to different perturbations for the two celllines. The model robustness was tested against perturbations from the literature performed on the explored mutations and unseen cell lines incorporatedautomatically into the model. The model is then used for in silico experimentation in order to test novel drug combinations, infer the source and mechanismfor drug resistance, and predict drug response in resistant cell lines and suggest treatment for resistance.
Cell-Specific Computational Models of Acute Myeloid Leukemia
www.aacrjournals.org Cancer Res; 77(4) February 15, 2017 OF5
(Fig. 3C) the reduction in proliferation as a result of treatmentwith AZD1208 single agent, AC220 single agent, and drug com-binations in MV411 cells. Although under predicting the magni-tude of increase in apoptosis for AC220 single agent, the modelaccurately predicted the directional responses with increases inapoptosis for AZD1208 single agent, AC220 single agent, andcombination treatments in MV411 cells.
In addition to predicting differential phenotypic responses ineach cell line, the model highlights key signaling events that mayunderlie the mechanism for each. We validated the robustness ofevents suggested for MOLM16 using mass spectrometry. Mostimportantly, the mass spectrometry corroborated the decreasedEIF4B pS406 phosphorylation after AZD1208 treatment, contrib-uting to decrease in proliferation, as well as the decrease in BADpS112 and pS155 after AZD1208 treatment, which increasesapoptosis. A key differentiating feature of MOLM16 cell lines isthe lack of hyperactivity from the MAPK (Ras Raf MEK ERK) andAKT–mTORC1 pathways post AZD1208 treatment, supportedby dephosphorylation at downstream BRAF pS445 and mTORpS2481 in the mass spectrometry data.
Testing the adaptability of the model to new cell-specificcontexts, we "turned on" new genetic alterations FIP1L1-PDGFRAfusion to simulate EOL1 cell line and FGFR1 fusion to simulateKG1A cell line. The apoptosis range was expanded to span the fulldynamic range seen in these cell lines, yet no further refinement ofthe model was performed. The model reflected the cellular sig-naling changes observed in RPPA data (Fig. 3D) where the MSE
ranged from 0.18 to 0.28 with the lowest seen for KG1A cell linetreated with single agent AZD1208 and the highest for the KG1Acell line treated with AC220. Across each protein, the MSEobserved between each protein signaling activity and the trans-formed RPPA values ranged from 0 to 0.49, with the lowest seenfor AKT and the highest seen for BAD. The model also performedwell in predicting cellular response (Fig. 3E). For the proliferationand apoptosis cell behaviors, the model accurately predicted thecellular responses seen in KG1A for AZD1208, AC220, andcombination treatments, as well as the cell behaviors for EOL1with AZD1208 treatment (AC220 was not tested for EOL1).
The model also replicated variations in sensitivity, such asEOL1, reacting with reduced apoptosis to PIM inhibition whencompared with MOLM16.
Novel signaling components proposed through modelrefinement
A by-product of refining the QN model to capture cell type–specific signaling is a graphical and descriptive representation ofcell-specific signaling dynamics between proteins in the network(Fig. 3A). By simulating the QN model, we were able to test ourassumptions regarding the signaling dependencies betweenproteins, as described by the target functions (Table 1). Forinstance, despite FLT3-ITD being upstream of PIM1, the effectrevealed by the iterative optimization of the model was less thanother interacting proteins, also suggested by the RPPA measure-ments (Fig. 1A), leading to BAD overactivity in MOLM16 butnot MV411. The target function of AKT shows that it is depen-dent on the activity of the FLT3-ITD and FGFR1 fusion, reflect-ing the accumulation of evidence for AKT/mTOR pathway rolein AML (suggested previously by ref. 8). The target function ofS6 reflects the dominant over activation of it via AKT–mTORpathway, additive to the activity of the MAPK pathway, andleading to antiapoptotic cell behavior of MV411 and KG1A. Atthe same time, the target function of BAD accumulates withactivity of the MAPK pathway and of PIM1 direct phosphory-lation of all three sites of BAD (26), leading to the antiapoptoticbehavior observed in MOLM16.
In silico virtual experimentation with AML cell models canreplicate independently reported data
As a first independent test of the AML cell–specific model, weassessed its ability to replicate in silico a sample of protein andphenotypic cell line responses to drug treatment reported in theliterature but not used as part of model construction or refine-ment. We replicated each in vitro experiment by turning on arespected set of mutations and adding the new examined inhib-itor to themodel, thenobserving thepredicted protein expression.All eight protein changes were successfully predicted (Supple-mentary Table S11). Themodel successfully predicted cell-specificresponse to compounds including failure of a MEK inhibitor toinduce apoptosis in EOL1 (27); insensitivity of KG1A to thecombination of AKT, PDK1, and FLT3 inhibitors (28); and thegrowth inhibition induced on EOL1 by combining PIM and AKTinhibition (11). The decrease in cell proliferation of MV411 inresponse to the mTORC (29) inhibitor was not recapitulated;however, Willems and colleagues (29) attribute the decrease inproliferation to eIF4E decreased expression, which was accuratelyreplicated by the model.
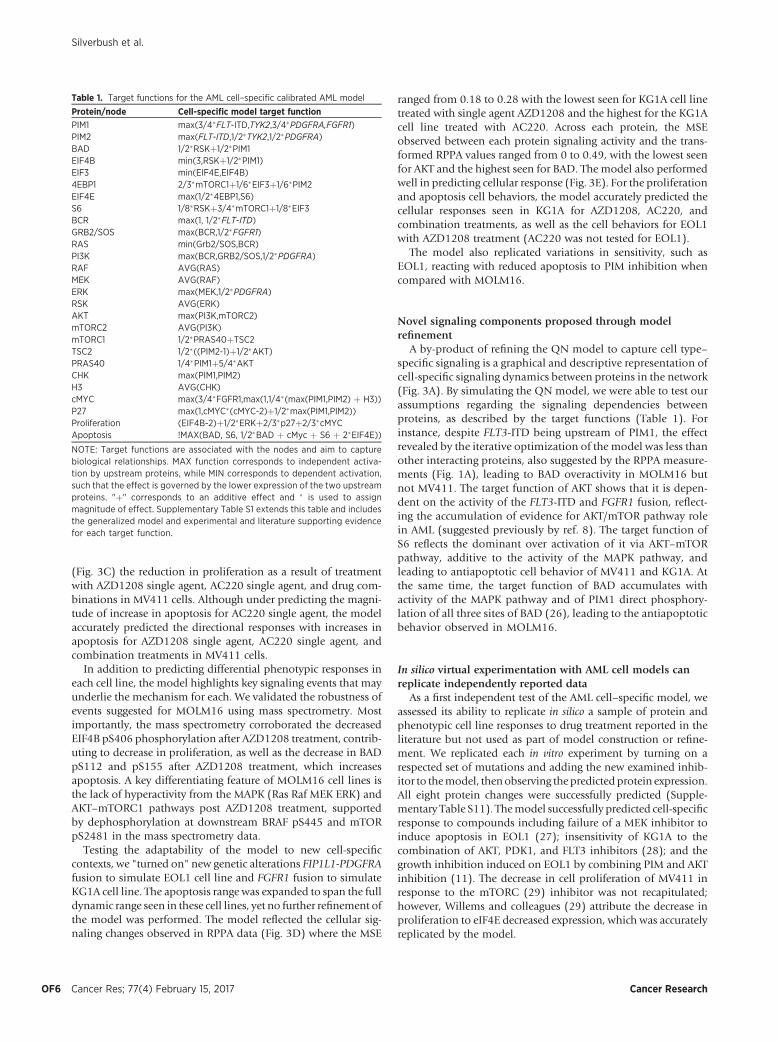
Table 1. Target functions for the AML cell–specific calibrated AML model
Protein/node Cell-specific model target function
PIM1 max(3/4�FLT-ITD,TYK2,3/4�PDGFRA,FGFR1)PIM2 max(FLT-ITD,1/2�TYK2,1/2�PDGFRA)BAD 1/2�RSKþ1/2�PIM1EIF4B min(3,RSKþ1/2�PIM1)EIF3 min(EIF4E,EIF4B)4EBP1 2/3�mTORC1þ1/6�EIF3þ1/6�PIM2EIF4E max(1/2�4EBP1,S6)S6 1/8�RSKþ3/4�mTORC1þ1/8�EIF3BCR max(1, 1/2�FLT-ITD)GRB2/SOS max(BCR,1/2�FGFR1)RAS min(Grb2/SOS,BCR)PI3K max(BCR,GRB2/SOS,1/2�PDGFRA)RAF AVG(RAS)MEK AVG(RAF)ERK max(MEK,1/2�PDGFRA)RSK AVG(ERK)AKT max(PI3K,mTORC2)mTORC2 AVG(PI3K)mTORC1 1/2�PRAS40þTSC2TSC2 1/2�((PIM2-1)þ1/2�AKT)PRAS40 1/4�PIM1þ5/4�AKTCHK max(PIM1,PIM2)H3 AVG(CHK)cMYC max(3/4�FGFR1,max(1,1/4�(max(PIM1,PIM2) þ H3))P27 max(1,cMYC�(cMYC-2)þ1/2�max(PIM1,PIM2))Proliferation (EIF4B-2)þ1/2�ERKþ2/3�p27þ2/3�cMYCApoptosis !MAX(BAD, S6, 1/2�BAD þ cMyc þ S6 þ 2�EIF4E))
NOTE: Target functions are associated with the nodes and aim to capturebiological relationships. MAX function corresponds to independent activa-tion by upstream proteins, while MIN corresponds to dependent activation,such that the effect is governed by the lower expression of the two upstreamproteins. "þ" corresponds to an additive effect and � is used to assignmagnitude of effect. Supplementary Table S1 extends this table and includesthe generalized model and experimental and literature supporting evidencefor each target function.
Silverbush et al.
Cancer Res; 77(4) February 15, 2017 Cancer ResearchOF6

A
EOL1 KG1A
Prol
ifera
tion
BAD
EOL1 KG1A
TSCAkt
BCR4EBP1EIF4B
Erkp27
cMycEIF4E
S6 Apo
ptos
is
ED
MOLM16 MV411
Prol
ifera
tion
BAD
MOLM16 MV411
TSCAkt
BCR4EBP1EIF4B
Erkp27
cMycEIF4E
S6
MSE
Apo
ptos
is
CBDMSO AZD1208 AC220 AZD1208 ComboDMSO
DMSO AZD1208 AC220 AZD1208 ComboDMSO
MOLM16MV411EOL1KG1A
Key geneticDriver relationships
PIM2
H3CHK
cMyc
p274EBP1
EIF4E
EIF3
mTORC1
PRAS40
mTORC2TSC2
Akt
S6
RAS RAF
Grb2/SOS MEK
PI3K
BAD
ERK
EIF4BRSK Apoptosis
Proliferation
TYK2
FLT-ITD
PDGFRA
FGFR1
PIM1
BCR
AZD1208
AC220
6 nmol/L AC220
Treatment
DMSO
1 mmol/L AZD1208AZD1208 + AC220
0.3 0.39 0.43 0.55 0.57 0.34
0.550.530.580.880.520.660.570.580.50.510.61
0
4
0
4
0
4
0
4
0 1 2 3 4Protein signaling activity
Type
In silico
In vitro
Generelizedmodel
Key genetic switches
0.00.330.170.00.360.190.140.550.20.290.34
0.17 0.26 0.17 0.2 0.23 0.2
0.490.460.00.410.240.30.330.440.220.140.17
0.27 0.24 0.23 0.28 0.18 0.21 MSE
Figure 3.
Generation of a predictive cell behaviormodel for AML training cell lines (MOLM16 andMV411) and unseen cell lines (EOL1 and KG1A).A, Cell-specific AML regulatorynetwork model incorporating knowledge from the literature and calibrated to phosphorylation activity measured by RPPA. Perturbations, driving mutations,and internal genes are depicted in gray, green, and red, respectively. To simulate specific cell (MOLM16, MV411, EOL1, or KG1A), the node for the protein with drivermutations (TYK2, FLT-ITD, PDGFRA, or FGFR1, respectively) is set to 1, while all other proteins with mutations are set to 0. B, Protein signaling activity(phosphorylation) levels inferred in silico using the cell-specific contexts (laptop icon) and the generalized model (papers icon) capturing levels of phosphorylationactivity as measured in vitro (petri-dish). C, Cell apoptosis and proliferation as inferred in silico by the executable model compared with levels as observedin vitro, with the generalized model capturing partial abnormal cell behavior and the cell-specific context model recapitulating measured levels. D, Unseen cell linesEOL1 and KG1A are incorporated to the executable network model. E, The robustness of the model is tested via the ability of the model to capture thephosphorylation activity unseen at the time of model construction and cell behavior as a result of different perturbations.
Cell-Specific Computational Models of Acute Myeloid Leukemia
www.aacrjournals.org Cancer Res; 77(4) February 15, 2017 OF7

AML cell-specificmodel predicts synergistic drug combinationswith the PIM inhibitor
To assess the potential to prioritize synergistic combinationsthrough in silico hypothesis testing with thesemodels, we assessedthe PIM inhibitor AZD1208, the AKT inhibitor AZD5363, MEKinhibitor selumetinib (selumetinib, ARRY-142886), FLT3 inhib-itor AC220, and PI3K inhibitor pictilisib across the 4 AML celllines (Fig. 4A; Supplementary Fig. S3) also summarized in Sup-plementary Table S12. For each cell line, we simulated inhibitionof the drug targets first as single agents and then as combinationswith PIM inhibition. We validated each combination in each cellline experimentally across a dose range for each agent (Fig. 4B).
The MOLM16 cell line was correctly predicted to be hypersen-sitive to the PIM inhibitor, resulting in almost complete cell kill,and no additional effect was predicted in combination with otherinhibitors.
In contrast, the MV411 context model, which harbors a FLT3-ITD, correctly predicted a strong synergy between AZD1208 andAC220 combination attributed to apoptotic effect, evident even atlower dosage of combined treatments. Very weak synergy withmild apoptosis was correctly predicted inMV411 in combinationwith either MEK or PI3K inhibition.
Meanwhile, EOL1 was correctly predicted to gain apoptoticsynergic effect with the PIM and AKT inhibitor combination, aswell as the PIM and PI3K inhibitor combination. Surprisingly, andthe only synergy of the 16 combinations not predicted by themodel, EOL1 alsoexhibited a synergic effectwith theAZD1208 andAC220 combination. AC220 efficacy has previously only beenreported inFLT3driven tumors; however, thesedata suggest efficacyfrom AC220 in PDGFRA mutated tumors potentially throughinhibition of PDGFRA-driven AKT/PI3K and MAPK signaling.
Finally, in the KG1Amodel, which harbors an activating FGFR1fusion, we did not see a co-occurrence of high apoptosis and highgrowth inhibition for any of the combination treatments, vali-dated as well by the in vitro assays. Our model suggests that thepersistent insensitivity of KG1Amay be derived by the high levelsof cMyc,which is not directly targeted by any of the combinations.
Executable QN model identify alternative susceptibilities inAZD1208-resistant cells
Four separate populations of MOLM16 cells were made resis-tant to PIM inhibition by growth in the presence of increasingdoses of the compound over a 4-month period until resulting cellpopulations were able tomaintain growth at 1 mmol/L AZD1208.While the parental MOLM16 cell has a 50 nmol/L GI50 in a 3-dayMTS proliferation assay, all four resistant populations had GI50sgreater than 9 mmol/L to AZD1208 over the same 3-day growthperiod (Supplementary Fig. S4A). RPPA measurements weretaken for the parental and resistant cell lines.
We predicted candidate genetic causes of resistance by itera-tively perturbing all individual and pairs of nodes in the parentalMOLM16model, and choosing those leading to similar signalingactivity and phenotype as observed in the resistant populations,quantified by lower MSE (Supplementary Fig. S4B and S4C). Thisresulted in four different resistant contexts, one for each resistantcell population (Fig. 5A). All contexts show overactivationthrough RAS/PI3K as well as AKT/mTOR signaling, supported byRPPA (Supplementary Fig. S4B). Interestingly, the different resis-tance contexts differ in their strength of altered signaling whereresistant cell populationR1has ahigher activity for bothpathwaysand resistant cell population R3 has lower activity for the AKT
pathway. The predicted and observed pathway signaling suggestsincreased signaling activity through 4EBP1, EIF4B, S6, and BADcontributing to resistance. In particular, it highlights the AKT–S6pathway as a major cause for the decreased apoptosis comparedwith MOLM16 parental when treated with AZD1208.
Whole-exome DNA-seq was performed to identify potentialprotein altering genetic variants that could be driving theAZD1208 resistance. All variant calls with significant differencesfrom the parental line (Supplementary Table S13) were furtherparsed to highlight genes encoding proteins that have BIOGRIDinteractions (Supplementary Table S14) to the RAS/PI3K and/orthe AKT/mTOR signaling pathways (Fig. 5B).
Using the four resistantMOLM16 contextmodels, we predictedpossible treatments to overcome resistance by simulating inhibi-tion at each point through systematic addition of an inhibitornode to the network. In line with signaling changes, introductionof an AKT inhibitor, AZD5363, to the resistant populations waspredicted to overcome the AZD1208 resistance by blocking theabnormal PRAS40, 4EBP1, and S6 activity (Fig. 5D). To test thisprediction, parental MOLM16- and AZD1208-resistant popula-tions were treated with and without 1 mmol/L AZD5363 for 1hour. The resistant populations responded to AKT inhibitionwithAZD5363 by decreased pS235/235 S6 ribosomal protein andpT246PRAS40 (Fig. 5D), providing strong evidence for inhibitionof AKT/MTOR signaling. The decrease in AKT/mTOR signalingwas accompanied with an increase in cleaved PARP, indicatingincreased apoptosis and highlighting the dependency on thissignaling pathway during AZD1208 resistance in MOLM16 cells.
Alternative qualitative modeling techniquesQualitative models provide coarse-grained descriptions useful
for systems whose mechanistic underpinnings remain incom-plete. The range of qualitative modeling approaches providestwo major types of simplifications: Boolean models relax theactivity of biological entities to binary (ONor OFF), alternatively,the relation of entities may be relaxed to simple logic operators(AND, OR, NOT). We explored the use of alternative approachesand robustness of findings by building a Boolean model and anAND/OR model via the same pipeline. For single-agent PIM-inhibitor treatment, the Boolean model was able to reasonablypredict the proliferation and apoptotic responses in MOLM16andKG1A, partially predicted proliferation response in EOL1, butpoorly predicted responses in MV411 (Supplementary Fig. S5).The MV411 cell line was correctly predicted to response well toFLT3 inhibition. The model was not, however, able to predicttreatment combination synergies (Supplementary Fig. S5).Because the Boolean model is simpler and easier to constructthan a qualitative model it offers a useful tool for investigatingsingle-agent treatment in larger networks.
The AND/OR gated model recaptured most of the responsesto single treatments, as well as synergistic combinations, reva-lidating the predictions made by our model (SupplementaryFig. S6). The synergistic response of KG1A to the combinationof AZD1208 and AC220 was the only response not recaptured.This phenotype is likely derived by S6 additive activity from theMAPK pathway and AKT–mTORC1, which cannot be accuratelydescribed using AND/OR gates. AND/OR models may begenerated by automated tools (30) and can serve well as aninitial model scaffold. However, more complex relationshipssuch as those in our model between BAD, S6, 4EBP1, TSC2, andEIF4B in AML need to be further refined.
Silverbush et al.
Cancer Res; 77(4) February 15, 2017 Cancer ResearchOF8

Percent (%) growth inhibition3 days Post-treatment assay25 50-
Completegrowth
MV411MOLM16
PIM2
H3CHK
cMyc
p274EBP1
EIF4E
EIF3
mTORC1
PRAS40
mTORC2TSC2
Akt
S6
RAS RAF
Grb2/SOS MEK
PI3K
BAD
ERK
EIF4BRSK Apoptosis
Proliferation
TYK2
FLT-ITD
PDGFRA
FGFR1
PIM1
BCR
Key geneticdriver relationships
MOLM16MV411EOL1KG1A
Key compoundsPIMi AZD1208
FLT3i AC220
AKTi AZD5363
MEKi selumetinib
PI3Ki pictilisib
KG1AEOL1
175 200150100 12575
Completedeath
Completegrowth
inhibition
(Growth)
1 20
Completegrowth
43
Completegrowth
inhibition
BMA-Predictedapoptosis1 20
Completegrowth
43
Completedeath
A
B
BMA-Predictedgrowth
1010FLT3i AC220
1010AKTi AZD5363
1010MEKi selumetinib
1010PI3Ki pictilisib
GrowthApoptosis
10
1010FLT3i AC220
PIM
i
10
1010AKTi AZD5363
PIM
i
10
1010MEKi selumetinib
PIM
i
10
1010PI3Ki pictilisib
PIM
i
GrowthApoptosis 3-Day assay3-Day assay
1010FLT3i AC220
1010AKTi AZD5363
1010MEKi selumetinib
1010PI3Ki pictilisib
GrowthApoptosis
1010FLT3i AC220
1010AKTi AZD5363
1010MEKi selumetinib
1010PI3Ki pictilisib
GrowthApoptosis 3-Day assay3-Day assay
Figure 4.
Validation of predicted synergistic combinations of drugs reveals new effective treatment strategies. A, Cell-specific AML model is used to test combinations ofdrugs and predict cell behavior in a cell specific manner. A drug or a combination of drugs is simulated by partially or fully nullifying the target functionsof their targets, and can be done automatically and efficiently with a large number of candidates. B, Predicted cell behavior of apoptosis and proliferations isvalidated via growth inhibition of AML cell lines cultured with the indicated concentration ranges of AZD1208 and/or tested combined inhibitor after72 hours. Predicted synergic effect, as seen for EOL1 cell line with PIM and AKT and PIM and PI3K inhibitors, is used to prioritize combinations.
Cell-Specific Computational Models of Acute Myeloid Leukemia
www.aacrjournals.org Cancer Res; 77(4) February 15, 2017 OF9

DiscussionThe success of personalizing treatments for AML patients
by tailoring to respective genetic alterations that characterizecancer subtypes has so far been limited. Moreover, drug
responses seen in genetically matched patients or representativecell lines show considerable diversity (7, 10). By integratingboth genomic and baseline proteomic data from AML cell lineswith known tumor-driving genetic events we generated an AML
TYK2
PIM1
PIM2
PRAS40
H3CHK
cMyc
p274EBP1
P
EIF4E
EIF3
mTORC1
mTORC2TSC2
Akt
S6
BCR
Ras
RAFMEK
PI3K
BAD
ERK
EIF4BRSK
A
Apoptosis
ProliferationGrb2/SOS
ParentalResistant R1Resistant R2Resistant R3
Inferred activation
B
C D
nodes
P R1 R2 R3 R4
chr11.67168328
chr17.30264479
chr17.30325904
chr19.11447889
chr6.168352185
BRAF
chr9.139400029
chr9.139409118
GeneChromosomePosition
chr7.140500184
MLLT4
NOTCH1
NOTCH1
RAB3D
PPP1CA
SUZ12
SUZ12
Variant caller FreeBayesMuTect,VarDictFreeBayes,MuTect,VarDict
Resistant R4
RAF
PI3K/AKT
PI3K/AKT
RAS
GRB2/RAS
PI3K/AKT
PI3K/AKT
PI3K/AKT
chr4.107845833 DKK2 PI3K/AKT
NetworkMapping
4EBP1 pS65
BAD pS112
β-Actin
Vinculin
β-Actin
S6 Ribo. Prot.pS235/236
EIF4B pS406
Vinculin
NA
NA
β-Actin
ERK1/2pT202/Y204
P R1 R2 R3 R4
1uM AZD1208
MOLM16Parental (P)/
Resistant (R)Continuous
P
3-HourAZD1208
EIF4B BMA
S6 BMA
4EBP1 BMA
BAD BMA
ERK BMA0 1 2 3 4BMA-Predicted protein activity
1 mmol/L AZD5363
P R1 R2 R3 R4 P R1 R2 R3 R41 mmol/L AZD12081 mmol/L AZD1208
MOLM16
PRAS40 pT246
S6 Ribo. Prot.pS235/236
Actin Total
4EBP1 pS65
Parental/Resistant
Continuous
S6 BMA
PRAS40 BMA
4EBP1 BMA
Apoptosis BMA
PARP Cleaved
Figure 5.
Origin of resistance to AZD1208 in MOLM16 is computationally inferred and validated via whole-exome DNA-seq, revealing signaling mechanism validated viaWestern blots and offers combination to combat resistance, which successfully induces apoptosis. A, Network model of MOLM16-resistant cell populations (R1-4).Perturbations (lightning bolts) were automatically predicted at specific nodes to simulate possible resistance mechanisms that would attenuate signalingdown a specific pathway (shaded red and blue). B, Whole-exome DNA-seq was performed on the 1 mmol/L AZD1208-resistant pool population to identifyprotein altering variants from variant calling as significantly different from the parental MOLM16 cell line. C, Inferred signaling activity from the parental MOLM16executable model is compared with activity from Western blots for parental and resistant cell populations. D, Predictions of signaling activity and cell apoptosisfor AZD1208 treated alone and in combination with AKT inhibitor AZD5363 are compared with activity from Western blots. Prediction of induced apoptosis issupported by the increase in PARP cleaved with AZD5363.
Silverbush et al.
Cancer Res; 77(4) February 15, 2017 Cancer ResearchOF10

network model capturing cell-context–specific signaling in thePIM kinase pathway. We developed a workflow methodologyfor constructing a network model with cell-specific contextswitches, which focuses on iterative refinement of the targetfunction to reflect literature and experimental evidences. Usersmay also consider applying automated tools to decipher thetarget functions, such as CellNOpt-cFL tool developed byMorris and colleagues (30), and follow by manual refinementof the target functions.
The resulting cell-specific model captures cell-specific signalingand response to cancer therapeutics and provides virtual cell linemodels in which to test hypotheses for tailored therapy in silico.The cell-specific model significantly reduced the prediction errorfor both the baseline training data and on-treatment changes inprotein expression compared with the generalized model. This isunsurprising because a generalized AML model insufficientlyexplains the heterogeneity in the mutational landscape andprotein-signaling dynamics reported across different cell lines,for example, a lack of signaling through AKT unique to cells withmutations in TYK2.
The cell-specific model accurately and directly recapitulatedpublished experimental results for reported changes in expressionin all 8 cases, and 9 out of 10 responses in cell behavior. Theseresults are particularly remarkable when considering the potentialvariability in signaling and phenotypic output over time, and thefocus of these models on the cells steady state reflected by modelstability.
We progressed to experimentally validate predictions madewith the cell-specific model. The MV411 context model capturedthe signaling impact of the FLT3-ITD to correctly predict inductionof apoptosis after treatment with PIM and PI3K inhibitors, and noeffect with PI3K inhibitor alone (11). For the cell line KG1A, weidentified contribution of high cMyc activity to cell proliferationand correctly predicted insensitivity to inhibition of targetsthought to be elevated by the FGFR fusion (28) including AKT,PDK1, and FLT3. The EOL1 context model identified previouslyunreported combination synergy between PIM and PI3KCA inhi-bitors, validated through increased tumor growth inhibition. Thiscould lead to patients treated with lower doses of the inhibitors ifthe same efficacy is achieved by combinations and thereby reduc-ing the risk of toxicity.
Model discrepancies highlight potential gaps in the capturednetwork knowledge and hypotheses that warrant further investi-gation. For example, our model fails to capture BCR and ERKoverexpression following treatment in EOL1 and KG1A cell lines.This cannot be resolved through simple optimization of thecurrent network, suggesting a potential gap in our knowledge ofhow the MAPK pathway influences these mechanisms (Fig. 3D).We found that Siendones and colleagues (31) had also previouslyhypothesized the coexistence of transduction signal event, trig-gering theMAPK pathway independent of the FLT-ITD event, andcoupled with poor response to FLT3 inhibitor. Investigating thisdiscrepancy may shed new light on the resistance mechanism ofthese patients to FLT inhibitors.
Furthermore, using the MOLM16 context model, we were ableto systematically explore genetic changes that may render the cellresistant to PIM inhibition. Exome sequencing and subsequentdrug combination treatment of MOLM16 cell populations withacquired resistance to AZD1208 confirmed our predicted mech-anistic dependency on AKT signaling and AKT inhibition as asecond-line therapy to overcome resistance.
By accurately predicting drug responses and combination syn-ergies, and providing the mechanistic insight on the proteinsdriving the response, we highlight the ability of simulatedmodelsand virtual experimentation to prioritize effective therapiesaccompanied with associated predictive and dynamic biomar-kers. Successful drug combinations could significantly augmenttherapy options for AML patients by overcoming innate andacquired resistance to drugs. Simulated qualitativemodels poten-tially offer a virtual platform to screen, discover andprioritize drugcombinations in silico, focusing experimental approaches to val-idation. Comprehensive genetic diagnosis using targeted exomesequencing is already entering the clinic in major teaching hospi-tals. When coupled with emerging mass cytometry analysis(PMID: 26095251), all the biological information to buildpatient specific qualitative networks models may soon be avail-able from frontline diagnostics data.
Taken together, the complexity of signaling pathways and thelarge number of resistance mechanisms mean that executablecellular models that are easily and quickly interpretable, like theones we have presented here, are key for pinpointing potentialcombination therapies for different cancer types and subtypes.Furthermore, scaling these executablemodels to simulate patient-specific cancers paves the way for improved personalized treat-ments and enhanced precision medicine choices.
Disclosure of Potential Conflicts of InterestS. Grosskurth is a senior scientist/bioinformatics at AstraZeneca and a senior
scientist III/bioinformatics at Abbvie. No potential conflicts of interest weredisclosed by the other authors.
Authors' ContributionsConception and design: D. Silverbush, S. Grosskurth, D. Wang, F. Powell,J. Dry, J. FisherDevelopment of methodology:D. Silverbush, S. Grosskurth, D. Wang, J. FisherAcquisition of data (provided animals, acquired and managed patients,provided facilities, etc.): J. DryAnalysis and interpretation of data (e.g., statistical analysis, biostatistics,computational analysis): D. Silverbush, S. Grosskurth, J. Dry, J. FisherWriting, review, and/or revision of the manuscript: D. Silverbush, S. Gross-kurth, D. Wang, F. Powell, B. Gottgens, J. Dry, J. FisherAdministrative, technical, or material support (i.e., reporting or organizingdata, constructing databases): F. PowellStudy supervision: J. Dry, J. Fisher
AcknowledgmentsWe would like to thank Dennis Huszar and Kirsten McEachern for their
knowledge surrounding the PIM signaling network, Mika Ahdesmaki forperformance of theDNA-seq alignment and variant calling, andGregO'Connorfor generation of the AZD1208-resistant MOLM16 cells. A central element ofthis study relied on single agents and combination cell line treatment; inparticular, we would like to thank Suping Wang and Erica Keaton for AZD1208combination screen data, Keith Dillman for sample preparation and Westernvalidation for FLT3 combinations and resistant cell lines; all from AstraZeneca.We would also like to thank Bloodwise for supporting B. Gottgens, and theIsraeliMinistry of Science, Technology andSpace andEdmond J. SafraCenter forBioinformatics at Tel-Aviv University for supporting D. Silverbush.
The costs of publication of this article were defrayed in part by thepayment of page charges. This article must therefore be hereby markedadvertisement in accordance with 18 U.S.C. Section 1734 solely to indicatethis fact.
Received June 20, 2016; revised November 9, 2016; accepted November 30,2016; published OnlineFirst December 13, 2016.
Cell-Specific Computational Models of Acute Myeloid Leukemia
www.aacrjournals.org Cancer Res; 77(4) February 15, 2017 OF11

References1. Majumder B, Baraneedharan U, Thiyagarajan S, Radhakrishnan P, Nara-
simhan H, Dhandapani M, et al. Predicting clinical response to anticancerdrugs using an ex vivo platform that captures tumour heterogeneity. NatCommun 2015;6:6169.
2. Costello JC, Heiser LM, Georgii E, G€onenM,MendenMP,WangNJ, et al. Acommunity effort to assess and improve drug sensitivity prediction algo-rithms. Nat Biotechnol 2014;32:1202–12.
3. Geeleher P, Cox NJ, Huang RS. Clinical drug response can be predictedusing baseline gene expression levels and in vitro drug sensitivity in celllines. Genome Biol 2014;15:R47.
4. YadavB, Pemovska T, SzwajdaA,Kulesskiy E,KontroM,KarjalainenR, et al.Quantitative scoring of differential drug sensitivity for individually opti-mized anticancer therapies. Sci Rep 2014;4:5193.
5. Marcucci G, Haferlach T, D€ohner H. Molecular genetics of adult acutemyeloid leukemia: prognostic and therapeutic implications. J Clin Oncol2011;29:475–86.
6. WangH, HuH, Zhang Q, Yang Y, Li Y, Hu Y, et al. Dynamic transcriptomesof human myeloid leukemia cells. Genomics 2013;102:250–6.
7. Cancer Genome Atlas Research Network TCGA. Genomic and epigenomiclandscapes of adult de novo acute myeloid leukemia. N Engl J Med2013;368:2059–74.
8. Keeton EK, McEachern K, Dillman KS, Palakurthi S, Cao Y, Grondine MR,et al. AZD1208, a potent and selective pan-Pim kinase inhibitor, demon-strates efficacy in preclinical models of acute myeloid leukemia. Blood2014;123:905–13.
9. Kampa-Schittenhelm KM, Heinrich MC, Akmut F, D€ohner H, D€ohner K,SchittenhelmMM.Quizartinib (AC220) is a potent second generation classIII tyrosine kinase inhibitor thatdisplays adistinct inhibitionprofile againstmutant-FLT3, -PDGFRA and -KIT isoforms. Mol Cancer 2013;12:19.
10. Klco JM, Spencer DH, Miller CA, Griffith M, Lamprecht TL, O'Laughlin M,et al. Functional heterogeneity of genetically defined subclones in acutemyeloid leukemia. Cancer Cell 2014;25:379–92.
11. Meja K, Stengel C, Sellar R, Huszar D, Davies BR, Gale RE, et al. PIM andAKT kinase inhibitors show synergistic cytotoxicity in acute myeloidleukaemia that is associated with convergence on mTOR and MCL1pathways. Br J Haematol 2014;167:69–79.
12. Kauffman S. Homeostasis and differentiation in random genetic controlnetworks. Nature 1969;224:177–8.
13. Kauffman S. Metabolic stability and epigenesis in randomly constructedgenetic nets. J Theor Biol 1969;22:437–67.
14. Huang S. Gene expression profiling, genetic networks, and cellular states:an integrating concept for tumorigenesis and drug discovery. J Mol Med1999;77:469–80.
15. Sanchez L, ThieffryD. A logical analysis of theDrosophila gap-gene system.J Theor Biol 2001;211:115–41.
16. SchaubMA,HenzingerTA,Fisher J.Qualitativenetworks: a symbolicapproachto analyze biological signaling networks. BMC Systems Biol 2007;1:4.
17. Benque D, Bourton S, Cockerton C, Cook B, Fisher J, Ishtiaq S, et al. Bma:visual tool for modeling and analyzing biological networks. ComputerAided Verification (CAV) 2012;686–92.
18. Chuang R, Hall BA, Benque D, Cook B, Ishtiaq S, Piterman N, et al. Drugtarget optimization in chronicmyeloid leukemia using innovative compu-tational platform. Sci Rep 2015;5:8190.
19. Saadatpour A, Albert R. A comparative study of qualitative and quantitativedynamic models of biological regulatory networks. EPJ Nonlinear BiomedPhys 2016;4:5.
20. Garrison E, Marth G. Haplotype-based variant detection from short-readsequencing. arXiv preprint arXiv 2012;1207.3907.
21. Cibulskis K, LawrenceMS,Carter SL, SivachenkoA, JaffeD, SougnezC, et al.Sensitive detection of somatic point mutations in impure and heteroge-neous cancer samples. Nat Biotechnol 2013;31:213–9.
22. Amson R, Sigaux F, Przedborski S, Flandrin G, Givol D, Telerman A. Thehuman protooncogene product p33pim is expressed during fetal hema-topoiesis and in diverse leukemias. Proc Natl Acad Sci U S A 1989;86:8857–61.
23. Asano J, Nakano A, Oda A, AmouH, HiasaM, Takeuchi K, et al. The serine/threonine kinase Pim-2 is a novel anti-apoptotic mediator in myelomacells. Leukemia 2011;25:1182–8.
24. Mizuki M, Schwable J, Steur C, Choudhary C, Agrawal S, Sargin B, et al.Suppression of myeloid transcription factors and induction ofSTAT response genes by AML-specific Flt3 mutations. Blood 2003;101:3164–73.
25. Zarrinkar PP, Gunawardane RN, Cramer MD, Gardner MF, Brigham D,Belli B, et al. AC220 is a uniquely potent and selective inhibitor of FLT3for the treatment of acute myeloid leukemia (AML). Blood 2009;114:2984–92.
26. Yuan LL, Green AS, Bertoli S, Grimal F, Mansat-De Mas V, Dozier C, et al.Pim kinases phosphorylate Chk1 and regulate its functions in acutemyeloid leukemia. Leukemia 2014;28:293–301.
27. Nishioka C, Ikezoe T, Yang J, Yokoyama A. Inhibition of MEK/ERKsignaling induces apoptosis of acute myelogenous leukemia cells viainhibition of eukaryotic initiation factor 4E-binding protein 1 anddown-regulation of Mcl-1. Apoptosis 2010;15:795–804.
28. Zeng Z, Samudio IJ, Zhang W, Estrov Z, Pelicano H, Harris D, et al.Simultaneous inhibition of PDK1/AKT and Fms-like tyrosine kinase 3signaling by a small-molecule KP372-1 induces mitochondrial dysfunc-tion and apoptosis in acute myelogenous leukemia. Cancer Res 2006;66:3737–46.
29. Willems L, Chapuis N, Puissant A,Maciel TT, Green AS, Jacque N, et al. ThedualmTORC1 andmTORC2 inhibitor AZD8055 has anti-tumor activity inacute myeloid leukemia. Leukemia 2012;26:1195–202.
30. Morris MK, Saez-Rodriguez J, Clarke DC, Sorger PK, Lauffenburger DA.Training signaling pathway maps to biochemical data with constrainedfuzzy logic: quantitative analysis of liver cell responses to inflammatorystimuli. PLoS Comput Biol 2011;7:e1001099.
31. Siendones E, BarbarrojaN, Torres LA, Buendía P, Velasco F,DoradoG, et al.Inhibition of Flt3-activating mutations does not prevent constitutiveactivation of ERK/Akt/STAT pathways in some AML cells: a possible causefor the limited effectiveness of monotherapy with small-molecule inhibi-tors. Hematol Oncol 2007;25:30–7.
Cancer Res; 77(4) February 15, 2017 Cancer ResearchOF12
Silverbush et al.