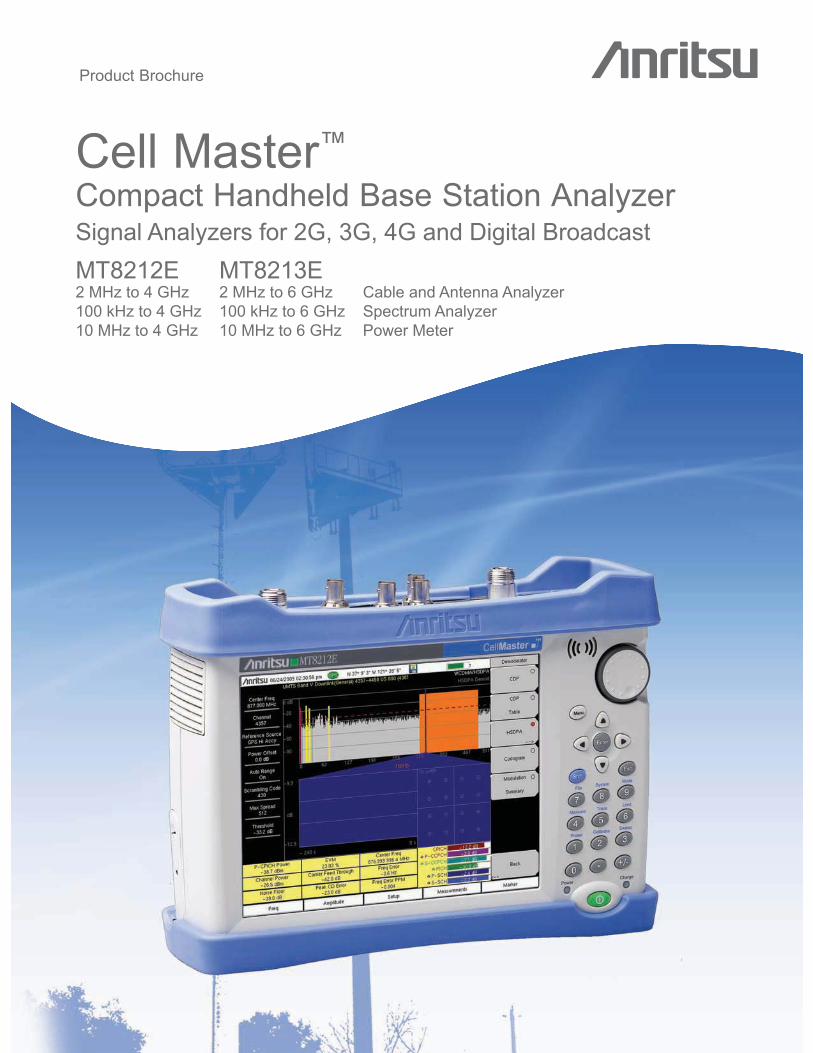
cell master mt821xe product brochure - ad instruments€¦ · maintenance and troubleshooting to...
TRANSCRIPT
��������������
����������
���������������������������������������������������� !� "����#���������������$%�&�' �$%�&!'������"��� ������(��� �)��������������������&**+����"��� &**+����(��� ����������������&*�����"��� &*�����(��� ��,�������
2
Cell Master™ Base Station Analyzer Features
Overview
Introduction
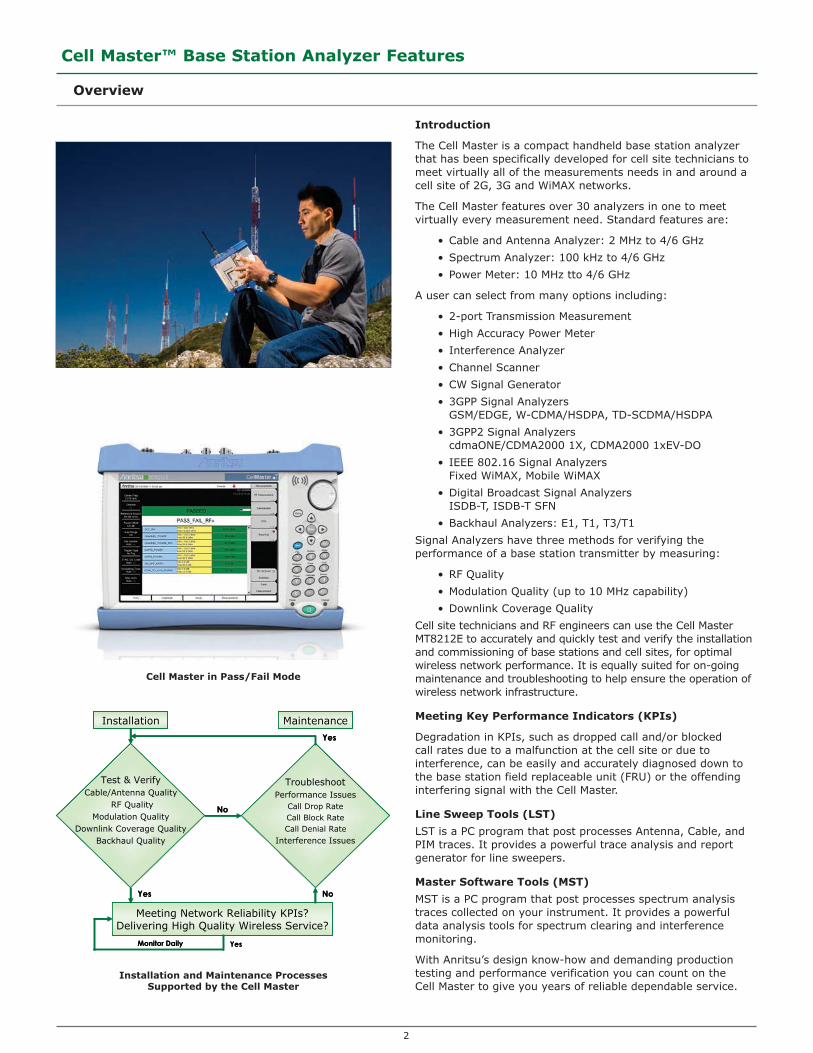
The Cell Master is a compact handheld base station analyzer that has been specifically developed for cell site technicians to meet virtually all of the measurements needs in and around a cell site of 2G, 3G and WiMAX networks.
The Cell Master features over 30 analyzers in one to meet virtually every measurement need. Standard features are:
Cable and Antenna Analyzer: 2 MHz to 4/6 GHz•
Spectrum Analyzer: 100 kHz to 4/6 GHz•
Power Meter: 10 MHz tto 4/6 GHz•
A user can select from many options including:
2-port Transmission Measurement•
High Accuracy Power Meter•
Interference Analyzer•
Channel Scanner•
CW Signal Generator•
3GPP Signal Analyzers• GSM/EDGE, W-CDMA/HSDPA, TD-SCDMA/HSDPA
3GPP2 Signal Analyzers• cdmaONE/CDMA2000 1X, CDMA2000 1xEV-DO
IEEE 802.16 Signal Analyzers• Fixed WiMAX, Mobile WiMAX
Digital Broadcast Signal Analyzers• ISDB-T, ISDB-T SFN
Backhaul Analyzers: E1, T1, T3/T1•
Signal Analyzers have three methods for verifying the performance of a base station transmitter by measuring:
RF Quality•
Modulation Quality (up to 10 MHz capability)•
Downlink Coverage Quality•
Cell site technicians and RF engineers can use the Cell Master MT8212E to accurately and quickly test and verify the installation and commissioning of base stations and cell sites, for optimal wireless network performance. It is equally suited for on-going maintenance and troubleshooting to help ensure the operation of wireless network infrastructure.
Meeting Key Performance Indicators (KPIs)
Degradation in KPIs, such as dropped call and/or blocked call rates due to a malfunction at the cell site or due to interference, can be easily and accurately diagnosed down to the base station field replaceable unit (FRU) or the offending interfering signal with the Cell Master.
Line Sweep Tools (LST)
LST is a PC program that post processes Antenna, Cable, and PIM traces. It provides a powerful trace analysis and report generator for line sweepers.
Master Software Tools (MST)
MST is a PC program that post processes spectrum analysis traces collected on your instrument. It provides a powerful data analysis tools for spectrum clearing and interference monitoring.
With Anritsu’s design know-how and demanding production testing and performance verification you can count on the Cell Master to give you years of reliable dependable service.
Test & VerifyCable/Antenna Quality
RF QualityModulation Quality
Downlink Coverage QualityBackhaul Quality
TroubleshootPerformance Issues
Call Drop RateCall Block RateCall Denial Rate
Interference Issues
Meeting Network Reliability KPIs? Delivering High Quality Wireless Service?
Installation Maintenance
���
���
���
��
��
������ ���
Cell Master in Pass/Fail Mode
Installation and Maintenance ProcessesSupported by the Cell Master
3
Cell Master™ Base Station Analyzer Features
Overview (continued)
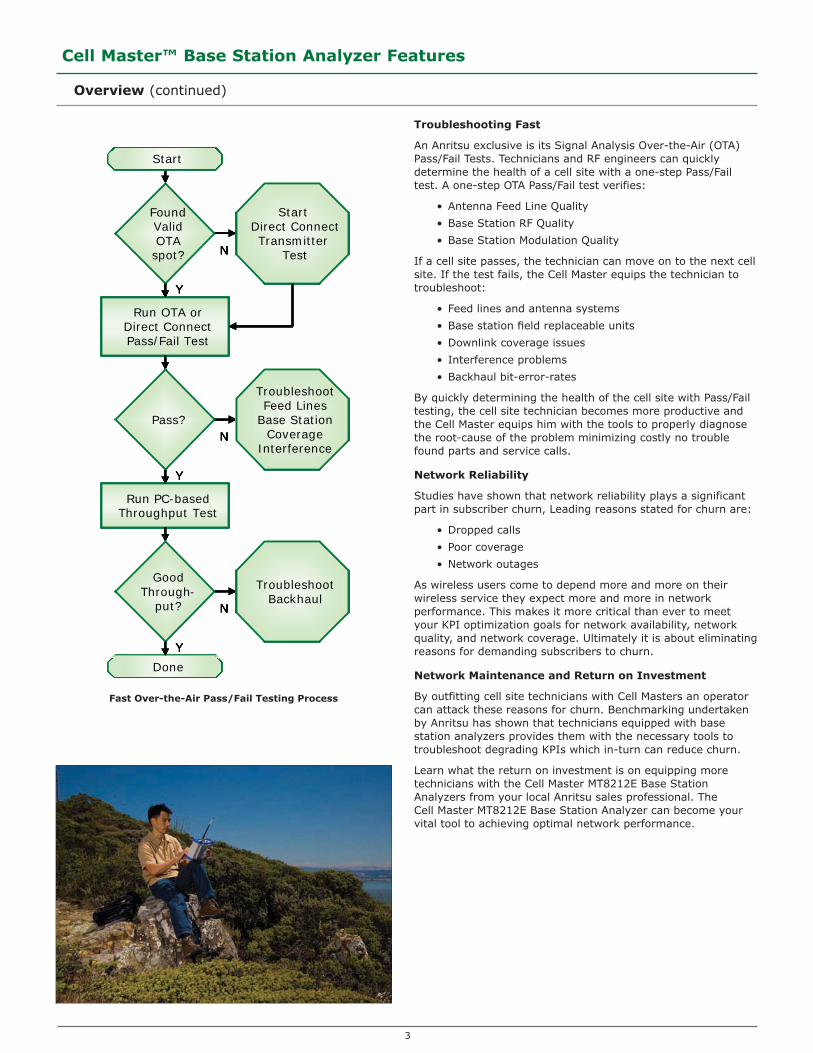
Troubleshooting Fast
An Anritsu exclusive is its Signal Analysis Over-the-Air (OTA) Pass/Fail Tests. Technicians and RF engineers can quickly determine the health of a cell site with a one-step Pass/Fail test. A one-step OTA Pass/Fail test verifies:
Antenna Feed Line Quality•
Base Station RF Quality•
Base Station Modulation Quality•
If a cell site passes, the technician can move on to the next cell site. If the test fails, the Cell Master equips the technician to troubleshoot:
Feed lines and antenna systems•
Base station field replaceable units•
Downlink coverage issues •
Interference problems•
Backhaul bit-error-rates•
By quickly determining the health of the cell site with Pass/Fail testing, the cell site technician becomes more productive and the Cell Master equips him with the tools to properly diagnose the root-cause of the problem minimizing costly no trouble found parts and service calls.
Network Reliability
Studies have shown that network reliability plays a significant part in subscriber churn, Leading reasons stated for churn are:
Dropped calls•
Poor coverage•
Network outages•
As wireless users come to depend more and more on their wireless service they expect more and more in network performance. This makes it more critical than ever to meet your KPI optimization goals for network availability, network quality, and network coverage. Ultimately it is about eliminating reasons for demanding subscribers to churn.
Network Maintenance and Return on Investment
By outfitting cell site technicians with Cell Masters an operator can attack these reasons for churn. Benchmarking undertaken by Anritsu has shown that technicians equipped with base station analyzers provides them with the necessary tools to troubleshoot degrading KPIs which in-turn can reduce churn.
Learn what the return on investment is on equipping more technicians with the Cell Master MT8212E Base Station Analyzers from your local Anritsu sales professional. The Cell Master MT8212E Base Station Analyzer can become your vital tool to achieving optimal network performance.
FoundValidOTAspot?
Run OTA orDirect ConnectPass/Fail Test
StartDirect ConnectTransmitter
TestN
Done
Run PC-basedThroughput Test
Pass?
TroubleshootFeed Lines
Base StationCoverage
InterferenceN
GoodThrough-
put?
TroubleshootBackhaul
N
Y
Y
Y
FoundValidOTAspot?
Run OTA orDirect ConnectPass/Fail Test
StartDirect ConnectTransmitter
TestN
Done
Run PC-basedThroughput Test
Pass?
TroubleshootFeed Lines
Base StationCoverage
InterferenceN
GoodThrough-
put?
TroubleshootBackhaul
N
Y
Y
Y
FoundValidOTAspot?
Run OTA orDirect ConnectPass/Fail Test
StartDirect ConnectTransmitter
TestN
Done
Run PC-basedThroughput Test
Pass?
TroubleshootFeed Lines
Base StationCoverage
InterferenceN
GoodThrough-
put?
TroubleshootBackhaul
N
Y
Y
Y
FoundValidOTAspot?
Run OTA orDirect ConnectPass/Fail Test
StartDirect ConnectTransmitter
TestN
Done
Run PC-basedThroughput Test
Pass?
TroubleshootFeed Lines
Base StationCoverage
InterferenceN
GoodThrough-
put?
TroubleshootBackhaul
N
Y
Y
Y
DoneDoneDoneStart
Fast Over-the-Air Pass/Fail Testing Process

4
Cell Master™ Base Station Analyzer Features
Cable and Antenna Analyzer PIM Analyzer (Option 0419)
Cable and Antenna Analyzer Measurements
VSWR
Return Loss
Cable Loss
Distance-to-Fault (DTF) Return Loss
Distance-to-Fault (DTF) VSWR
1-port Phase
Smith Chart
2-port Transmission Measurement (Option 0021)
PIM Analyzer Measurements (Option (0419)
(Requires PIM Master™)
PIM
Noise Floor
Distance-to-PIM™ (DTP)
(see PIM Master Product Brochure 11410-00546)
Cable and Antenna Analyzer PIM Analyzer (Option 0419)
The Cell Master features 1-port Cable and Antenna Analyzer and optional 2-port Transmission Measurement and PIM Analyzer to be able to test and verify the performance of nearly every feed-line and antenna component. This includes:
Connectors• Cables/Jumpers• Antenna Isolation• Diplexers/Duplexers• Tower Mounted Amplifiers•
The goal of these measurements is to maximize the coverage, data rate and capacity with problem-free antenna systems minimizing dropped calls and blocked calls for a good customer experience.
Antenna Systems Failure Mechanisms
Maintenance is an on-going requirement as antenna systems’ performance can degrade at any point in time due to:
Loose connectors• Improperly weatherized connectors• Pinched cables• Poor grounding• Corroded connectors• Lightning strikes• Strong winds misaligning antennas• Rain getting into cables• Bullet holes/nails in the cable•
Intermodulation of multiple signals•
Making Measurements Easier
The Cell Master provides features for making measurements easier to perform and to analyze test results such as:
InstaCal™ provides the most • accurate one-step calibration processFlexCal™ eliminates the need to • recalibrate when changing frequenciesHigh RF Immunity for testing in • harsh RF environmentsTrace Overlay compares reference • traces to see changes over timeLimit Lines and Alarming for • providing reference standardsHigh Power output to test tower-top • components without climbing the towerGPS tagging of data to verify • location of testsLine Sweep Tools for post-analysis • and report generation
PIM Analyzer (Option 0419)
The PIM Analyzer measures the 3rd, 5th, or 7th
order intermodulation products in the receive band of two high power tones generated by the 40 Watt PIM Master. To learn more about PIM and finding the location of PIM with the Distance-to-PIM™ option see the PIM Master™ product brochure 11410-00546.
Return Loss/VSWR Measurement
Poor Return Loss/VSWR can damage transmitters, reduce the coverage area, increase dropped and blocked calls, and lower data rates.
Cable Loss Measurement
This an important commissioning check. Excessive loss reduces the coverage area and can mask return loss issues, creating false good readings later.
Distance-to- Fault (DTF) Measurement
DTF can be used to identify and locate faulty cable components or connector pairs with poor Return Loss/VSWR in meters or feet.
Dual Trace Display with Independent Markers
Make two traces at once to increase productivity. Select which two traces to display from the Cable and Antenna Analyzer measurements.
5
Cell Master™ Base Station Analyzer Features
Spectrum Analyzer
Measurements
One Button Measurements
Field Strength – in dBm/m2 or dBmV/m
Occupied Bandwidth - 1% to 99% of power
Channel Power - in specified bandwidth
ACPR - adjacent channel power ratio
AM/FM/SSB Demodulation - audio out only
C/I - carrier-to-interference ratio
Gated Sweep – Option 0090
Sweep Functions
Sweep
Single/Continuous, Manual Trigger, Reset,
Minimum Sweep Time
Detection
Peak, RMS, Negative, Sample, Quasi-peak
Triggers
Free Run, External, Video, Change Position,Manual
Trace Functions
Traces
1-3 Traces (A, B, C), View/Blank, Write/Hold
Trace A Operations
Normal, Max Hold, Min Hold, Average,
Number of Averages, (always the live trace)
Trace B Operations
A � B, B �� C, Max Hold, Min Hold
Trace C Operations
A � C, B �� C, Max Hold, Min Hold, A - B � C,
B - A � C, Relative Reference (dB), Scale
Marker Functions
Markers
1-6 Markers each with a Delta Marker, or
Marker 1 Reference with 6 Delta Markers
Marker Types
Fixed, Tracking, Noise, Frequency Counter
Marker Auto-Position
Peak Search, Next Peak (Right/Left),
Peak Threshold %, To Channel, To Center,
To Reference Level, Delta Marker to Span
Marker Table
1-6 markers’ frequency & amplitude plus
delta markers’ frequency offset & amplitude
Limit Line Functions
Limit Lines
Upper/Lower, Limit Alarm, Default Limit
Limit Line Edit
Frequency, Amplitude, Add/Delete Point,
Add Vertical, Next Point Left/Right
Limit Line Move
To Current Center Frequency, By dB or Hz,
To Marker 1, Offset from Marker 1
Limit Line Envelope
Create, Update Amplitude, Number of
Points (41), Offset, Shape Square/Slope
Limit Line Advanced
Absolute/Relative, Mirror, Save/Recall
Spectrum Analyzer
The Cell Master features the most powerful handheld spectrum analyzer for field use with unmatched performance such as:
Sensitivity•
Dynamic Range•
Phase Noise•
Frequency Accuracy•
Resolution Bandwidth (RBW)•
The goal of the Spectrum Analyzers’ measurements is to be able to monitor, measure, and analyze RF signals and their environments. It finds rouge signals, measures carriers and distortion, and verifies base stations’ signal performance. It validates carrier frequency and identifies desired and undesired signals.
Simple But Powerful
The Cell Master features dedicated routines for one-button measurements and for more in-depth analysis s the technician has control over the setting and features not even found on lab-grade benchtop spectrum analyzers, for instance:
Multiple sweep detection methods – • true RMS detector, quasi-peak, …
Multiple traces and control – three • traces, trace math, …
Advanced marker functions – noise • marker, frequency counter, …
Advanced limit line functions – one-• button envelope creation, relative, …
Save-on-Event – automatically saves • a sweep when crossing a limit line
Gated sweep - view pulsed or burst • signals only when they are on, or off
The Cell Master automatically sweeps as fast as possible for the selected settings consistent with accurate results.
GPS-Assisted Frequency Accuracy
With GPS Option 0031 the frequency accuracy is 50 ppb (parts per billion). Also all measurements can be GPS tagged for exporting to maps.
Rx Noise Floor Testing
The Cell Master can measure the Rx Noise Floor on the uplink a base station using the channel power measurement. An elevated noise floor indicates interference and leads to call blocking, denial of services, call drops, low data rate, and low capacity.
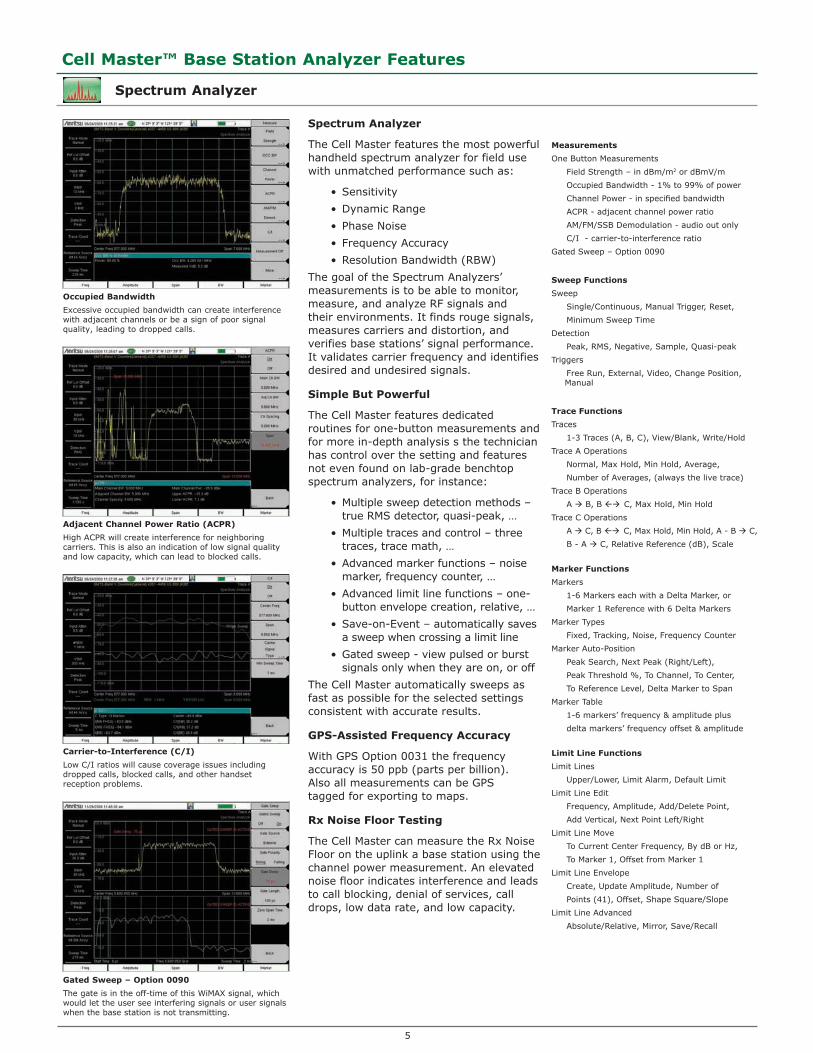
Occupied Bandwidth
Excessive occupied bandwidth can create interference with adjacent channels or be a sign of poor signal quality, leading to dropped calls.
Adjacent Channel Power Ratio (ACPR)
High ACPR will create interference for neighboring carriers. This is also an indication of low signal quality and low capacity, which can lead to blocked calls.
Carrier-to-Interference (C/I)
Low C/I ratios will cause coverage issues including dropped calls, blocked calls, and other handset reception problems.
Gated Sweep – Option 0090
The gate is in the off-time of this WiMAX signal, which would let the user see interfering signals or user signals when the base station is not transmitting.
6
Cell Master™ Base Station Analyzer Features
Power Meter High Accuracy Power Meter (Option 0019)
Power Sensors
PSN50
High Accuracy RF Power Sensor
50 MHz to 6 GHz
Type N(m), 50 Ω
-30 to + 20 dBm
(.001 to 100 mW)
True-RMS
MA24104A
Inline High Power Sensor
600 MHz to 4 GHz
+3 to +51.76 dBm
(2 mW to 150 W)
True-RMS
MA24106A
High Accuracy RF Power Sensor
50 MHz to 6 GHz
-40 to +23 dBm
(0.1 μW to 200 mW)
True-RMS
MA24108A
Microwave USB Power Sensor
10 MHz to 8 GHz
-40 to +20 dBm
(0.1 μW to 100 mW)
True-RMS
Slot Power
Burst Average Power
MA24118A
Microwave USB Power Sensor
10 MHz to 1 8 GHz,
-40 to +20 dBm
(0.1 μW to 100 mW)
True-RMS
Slot Power
Burst Average Power
MA24126A
Microwave USB Power Sensor
10 MHz to 26 GHz,
-40 to +20 dBm
(0.1 μW to 100 mW)
True-RMS
Slot Power
Burst Average Power
Power Meters
The Cell Master offers standard a built-in Power Meter utilizing the Spectrum Analyzer and an optional High Accuracy Power Meter requiring external power sensors.
Setting the transmitter output power of a base station properly is critical to the overall operation of wireless network. A 1.5 dB change in power levels means a 15% change in coverage area.
To much power means overlapping coverage which translates into cell-to-cell self interference. To little power, to little coverage, creates island cells with non-overlapping cell sites and reduced in-building coverage. High or low values will cause dead zones/dropped calls, lower data rates/reduced capacity near cell edges, and cell loading imbalances/blocked calls.
High Accuracy Power Meter (Option 19)
For the most accurate power measurement requirements select the high accuracy measurement option with a choice of sensors with:
Frequency ranges: 10 MHz to 18 GHz •
Power ranges: -40 dBm to +51.76 dBm•
Measurement uncertainties: ≤ ±0.18 dB•
These sensors enable users to make accurate measurements for CW and digitally modulated signals for 2G/3G and upcoming 4G wireless networks.
The power sensor easily connects to the Cell Master via a USB A/mini-B cable. An additional benefit of using the USB connection is that a separate DC supply (or battery) is not needed since the necessary power is supplied by the USB port.
PC Power Meter
These power sensors can be used with a PC running Microsoft Windows® via USB. They come with PowerXpert™ application, a data analysis, and control software. The application has abundant features, such as data logging, power versus time graph, big numerical display, and many more, that enable quick and accurate measurements.
Remote Power Monitoring via LAN
A USB-to-LAN hub converter enables power monitoring via the Internet across continents, if desired.
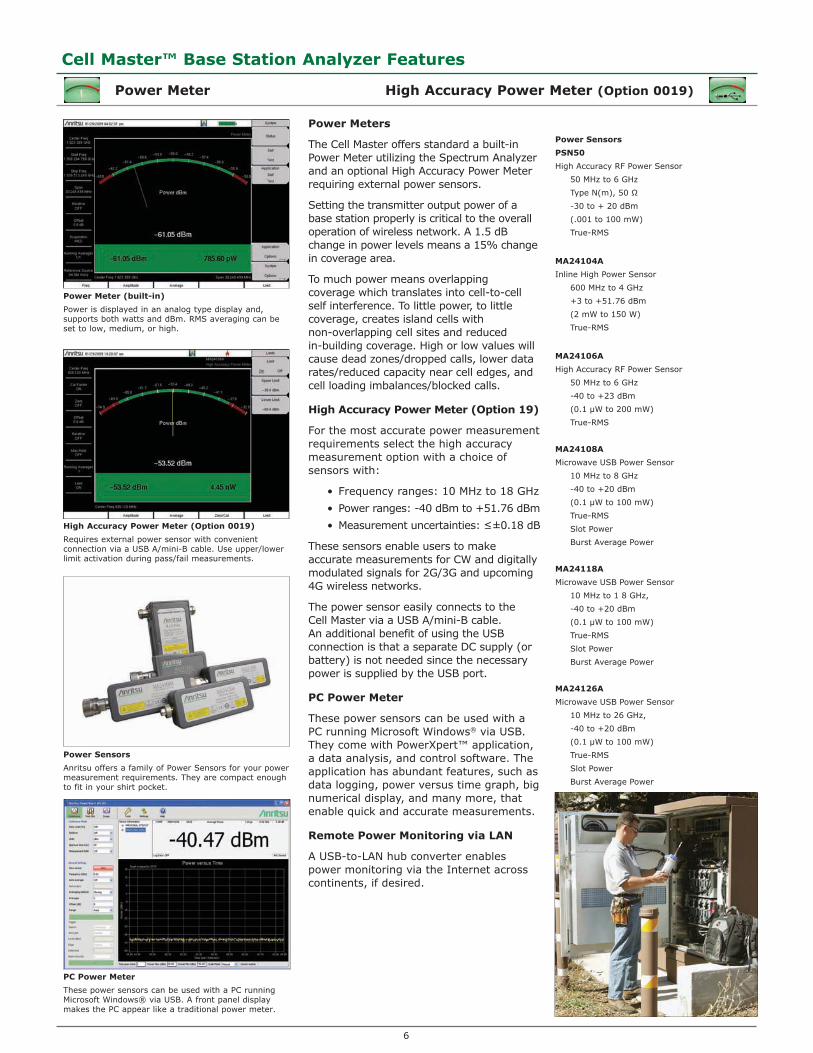
Power Meter (built-in)
Power is displayed in an analog type display and, supports both watts and dBm. RMS averaging can be set to low, medium, or high.
High Accuracy Power Meter (Option 0019)
Requires external power sensor with convenient connection via a USB A/mini-B cable. Use upper/lower limit activation during pass/fail measurements.
Power Sensors
Anritsu offers a family of Power Sensors for your power measurement requirements. They are compact enough to fit in your shirt pocket.
PC Power Meter
These power sensors can be used with a PC running Microsoft Windows® via USB. A front panel display makes the PC appear like a traditional power meter.
7
Cell Master™ Base Station Analyzer Features
Interference Analyzer (Opton 0025) Channel Scanner (Option 0027)
Interference Analyzer Measurements
Spectrogram
Signal Strength Meter
Received Signal Strength Indicator (RSSI)
Signal ID (up to 12 signals)
FM
GSM/GPRS/EDGE
W-CDMA/HSDPA
CDMA/EV-DO
Wi-Fi
Interference Mapping
Spectrum
Field Strength – in dBm/m2 or dBmV/m
Occupied Bandwidth - 1% to 99% of power
Channel Power - in specified bandwidth
ACPR - adjacent channel power ratio
AM/FM/SSB Demodulation - audio out only
C/I - carrier-to-interference ratio
SEM - spectral emission mask
Channel Scanner
Scan
20 channels at once, by frequency or channel
Noncontiguous channels
Different channel bandwidths in one scan
Display
Current plus Max hold display
Graph View
Table View
Script Master™
Up to 1200 Channels
Auto-repeat sets of 20 channels and total
Auto-Save with GPS tagging
Interference Analyzer (Option 0025) Channel Scanner (Option 0027)
Interference is a continuously growing problem for wireless network operators. Compounding the problem are the many sources that can generate interference such as:
Intentional Radiators•
Unintentional Radiators•
Self Interference•
Interference causes Carrier-to-Interference degradation robbing the network of capacity. In many instances interference can cause an outage to a sector, a cell, and/or neighboring cells. The goal of these measurements is to resolve interference issues as quickly as possible.
Monitoring Interference
The Cell Master offers many tools for monitoring intermittent interferers over time to determine patterns:
Spectrogram•
Received Signal Strength Indicator•
Remote Monitoring over the Internet•
Save-on-Event – crossing a limit line•
Master Software Tools for your PC features diagnostic tools for efficient analysis of the data collected during interference monitoring. These features include:
Folder Spectrogram – creates a • composite file of multiple traces for quick review
Movie playback – playback data in • the familiar frequency domain view
Histogram – filter data and search for • number of occurrences and time of day
3D Spectrogram – for in-depth analysis • with 3-axis rotation viewing control
Identifying Interference
The Cell Master provides several tools to identify the interference – either from a neighboring wireless operator, illegal repeater or jammer, or self-interference:
Signal ID (up to 12 signals at once)•
Signal Analyzer Over-the-Air Scanners•
Channel Scanner (up to 1200 channels, • 20 at a time)
Interference Mapping•
Locating Interference
Once interference has been identified the Signal Strength Meter with its audible output beep coupled with a directional antenna makes finding the interference easier. Use Interference Mapping to triangulate the interference signal on an on-screen map.
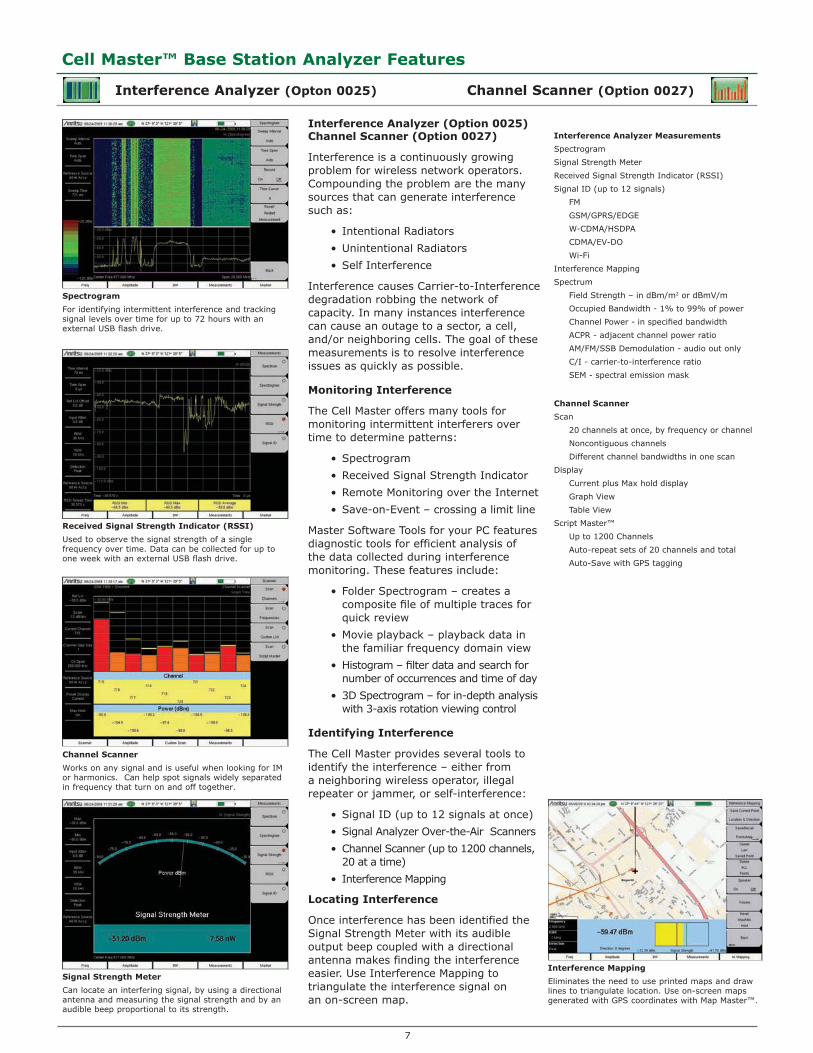
Spectrogram
For identifying intermittent interference and tracking signal levels over time for up to 72 hours with an external USB flash drive.
Received Signal Strength Indicator (RSSI)
Used to observe the signal strength of a single frequency over time. Data can be collected for up to one week with an external USB flash drive.
Channel Scanner
Works on any signal and is useful when looking for IM or harmonics. Can help spot signals widely separated in frequency that turn on and off together.
Signal Strength Meter
Can locate an interfering signal, by using a directional antenna and measuring the signal strength and by an audible beep proportional to its strength.
Interference Mapping
Eliminates the need to use printed maps and draw lines to triangulate location. Use on-screen maps generated with GPS coordinates with Map Master™.
8
Cell Master™ Base Station Analyzer Features
Coverage Mapping (Option 0431)
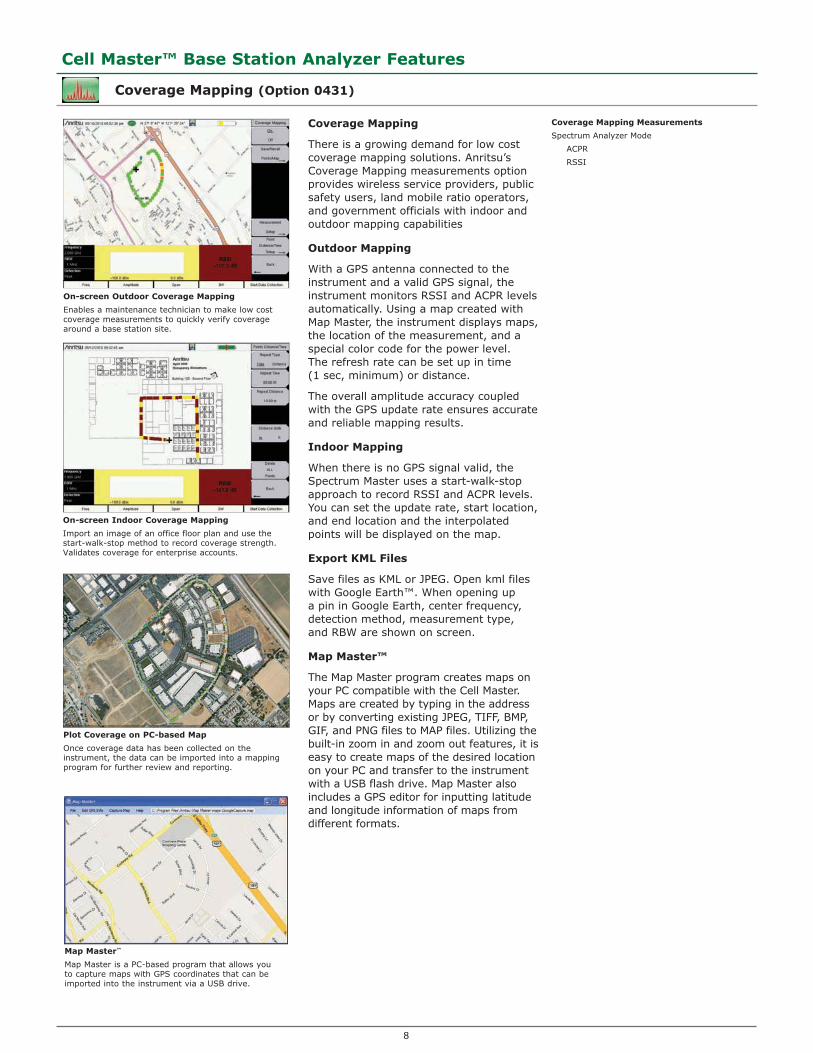
On-screen Outdoor Coverage Mapping
Enables a maintenance technician to make low cost coverage measurements to quickly verify coverage around a base station site.
On-screen Indoor Coverage Mapping
Import an image of an office floor plan and use the start-walk-stop method to record coverage strength. Validates coverage for enterprise accounts.
Map Master™
Map Master is a PC-based program that allows you to capture maps with GPS coordinates that can be imported into the instrument via a USB drive.
Plot Coverage on PC-based Map
Once coverage data has been collected on the instrument, the data can be imported into a mapping program for further review and reporting.
Coverage Mapping Measurements
Spectrum Analyzer Mode
ACPR
RSSI
Coverage Mapping
There is a growing demand for low cost coverage mapping solutions. Anritsu’s Coverage Mapping measurements option provides wireless service providers, public safety users, land mobile ratio operators, and government officials with indoor and outdoor mapping capabilities
Outdoor Mapping
With a GPS antenna connected to the instrument and a valid GPS signal, the instrument monitors RSSI and ACPR levels automatically. Using a map created with Map Master, the instrument displays maps, the location of the measurement, and a special color code for the power level. The refresh rate can be set up in time (1 sec, minimum) or distance.
The overall amplitude accuracy coupled with the GPS update rate ensures accurate and reliable mapping results.
Indoor Mapping
When there is no GPS signal valid, the Spectrum Master uses a start-walk-stop approach to record RSSI and ACPR levels. You can set the update rate, start location, and end location and the interpolated points will be displayed on the map.
Export KML Files
Save files as KML or JPEG. Open kml files with Google Earth™. When opening up a pin in Google Earth, center frequency, detection method, measurement type, and RBW are shown on screen.
Map Master™
The Map Master program creates maps on your PC compatible with the Cell Master. Maps are created by typing in the address or by converting existing JPEG, TIFF, BMP, GIF, and PNG files to MAP files. Utilizing the built-in zoom in and zoom out features, it is easy to create maps of the desired location on your PC and transfer to the instrument with a USB flash drive. Map Master also includes a GPS editor for inputting latitude and longitude information of maps from different formats.
9
Cell Master™ Base Station Analyzer Features
Introduction to Signal Analyzers
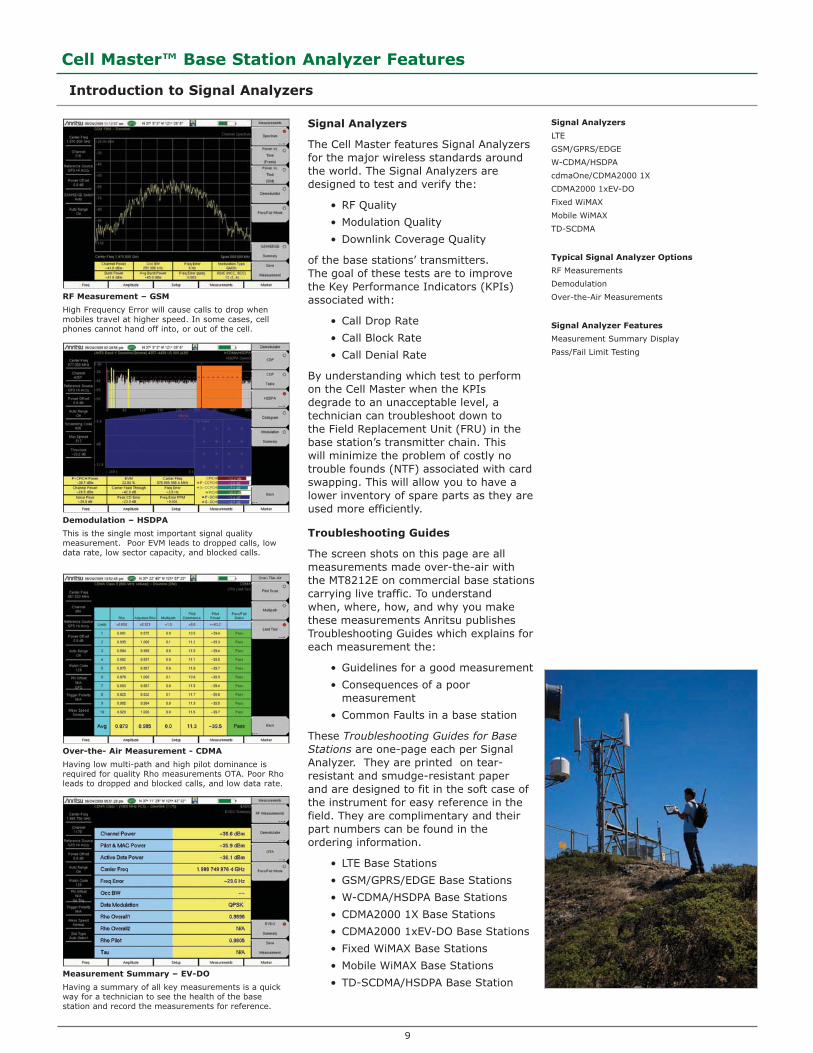
RF Measurement – GSM
High Frequency Error will cause calls to drop when mobiles travel at higher speed. In some cases, cell phones cannot hand off into, or out of the cell.
Demodulation – HSDPA
This is the single most important signal quality measurement. Poor EVM leads to dropped calls, low data rate, low sector capacity, and blocked calls.
Over-the- Air Measurement - CDMA
Having low multi-path and high pilot dominance is required for quality Rho measurements OTA. Poor Rho leads to dropped and blocked calls, and low data rate.
Measurement Summary – EV-DO
Having a summary of all key measurements is a quick way for a technician to see the health of the base station and record the measurements for reference.
Signal Analyzers
LTE
GSM/GPRS/EDGE
W-CDMA/HSDPA
cdmaOne/CDMA2000 1X
CDMA2000 1xEV-DO
Fixed WiMAX
Mobile WiMAX
TD-SCDMA
Typical Signal Analyzer Options
RF Measurements
Demodulation
Over-the-Air Measurements
Signal Analyzer Features
Measurement Summary Display
Pass/Fail Limit Testing
Signal Analyzers
The Cell Master features Signal Analyzers for the major wireless standards around the world. The Signal Analyzers are designed to test and verify the:
RF Quality•
Modulation Quality•
Downlink Coverage Quality•
of the base stations’ transmitters. The goal of these tests are to improve the Key Performance Indicators (KPIs) associated with:
Call Drop Rate•
Call Block Rate•
Call Denial Rate•
By understanding which test to perform on the Cell Master when the KPIs degrade to an unacceptable level, a technician can troubleshoot down to the Field Replacement Unit (FRU) in the base station’s transmitter chain. This will minimize the problem of costly no trouble founds (NTF) associated with card swapping. This will allow you to have a lower inventory of spare parts as they are used more efficiently.
Troubleshooting Guides
The screen shots on this page are all measurements made over-the-air with the MT8212E on commercial base stations carrying live traffic. To understand when, where, how, and why you make these measurements Anritsu publishes Troubleshooting Guides which explains for each measurement the:
Guidelines for a good measurement•
Consequences of a poor • measurement
Common Faults in a base station•
These ����������� ���������������������� are one-page each per Signal Analyzer. They are printed on tear-resistant and smudge-resistant paper and are designed to fit in the soft case of the instrument for easy reference in the field. They are complimentary and their part numbers can be found in the ordering information.
LTE Base Stations•
GSM/GPRS/EDGE Base Stations•
W-CDMA/HSDPA Base Stations•
CDMA2000 1X Base Stations•
CDMA2000 1xEV-DO Base Stations•
Fixed WiMAX Base Stations•
Mobile WiMAX Base Stations•
TD-SCDMA/HSDPA Base Station•
10
GSM/GPRS/EDGE Analyzers
The Cell Master features two GSM/GPRS/ EDGE measurement modes.
RF Measurements•
Demodulation•
The goal of these measurements is to increase data rate and capacity by accurate power settings, ensuring low out-of-channel emissions, and good signal quality. These attributes help to create a low dropped call rate, a low blocked call rate, and a good customer experience.
Cell site technicians or RF engineers can make measurements Over-the-Air (OTA) to spot-check a transmitter’s coverage and signal quality without taking the cell site off-line. When the OTA test results are ambiguous one can directly connect to the base station to check the signal quality and transmitter power.
For easy identification of which cell your are measuring the Base Station Identity Code (BSIC) gives the base station id, the Network Color Code (NCC) identifies the owner of the network, and the Base Station Color Code (BCC) provides the sector information.
Carrier-to-Interference (C/I)
C/I indicates the quality of the received signal. It also can be used to identify areas of poor signal quality. Low C/I ratios will cause coverage issues including dropped calls, blocked calls, and other handset reception problems.
Phase Error
Phase Error is a measure of the phase difference between an ideal and actual GMSK modulated voice signal. High phase error leads to dropped calls, blocked calls, and missed handoffs.
Origin Offset
Origin Offset is a measure of the DC power leaking through local oscillators and mixers. A high Origin Offset will lower EVM and Phase Error measurements and create higher dropped call rates.
Power versus Time (Slot and Frame)
Power versus Time (Slot and Frame) should be used if the GSM base station is setup to turn RF power off between timeslots. When used OTA, this measurement can also spot GSM signals from other cells. Violations of the mask create dropped calls, low capacity, and small service area issues.
Cell Master™ Base Station Analyzer Features
GSM/GPRS/EDGE Signal Analyzers (Options 0040, 0041)
RF Measurements
(Option 0040)
Channel Spectrum
Channel Power
Occupied Bandwidth
Burst Power
Average Burst Power
Frequency Error
Modulation Type
BSIC (NCC, BCC)
Multi-channel Spectrum
Power vs. Time (Frame/Slot)
Channel Power
Occupied Bandwidth
Burst Power
Average Burst Power
Frequency Error
Modulation Type
BSIC (NCC, BCC)
Demodulation
(Option 0041)
Phase Error
EVM
Origin Offset
C/I
Modulation Type
Magnitude Error
BSIC (NCC, BCC)
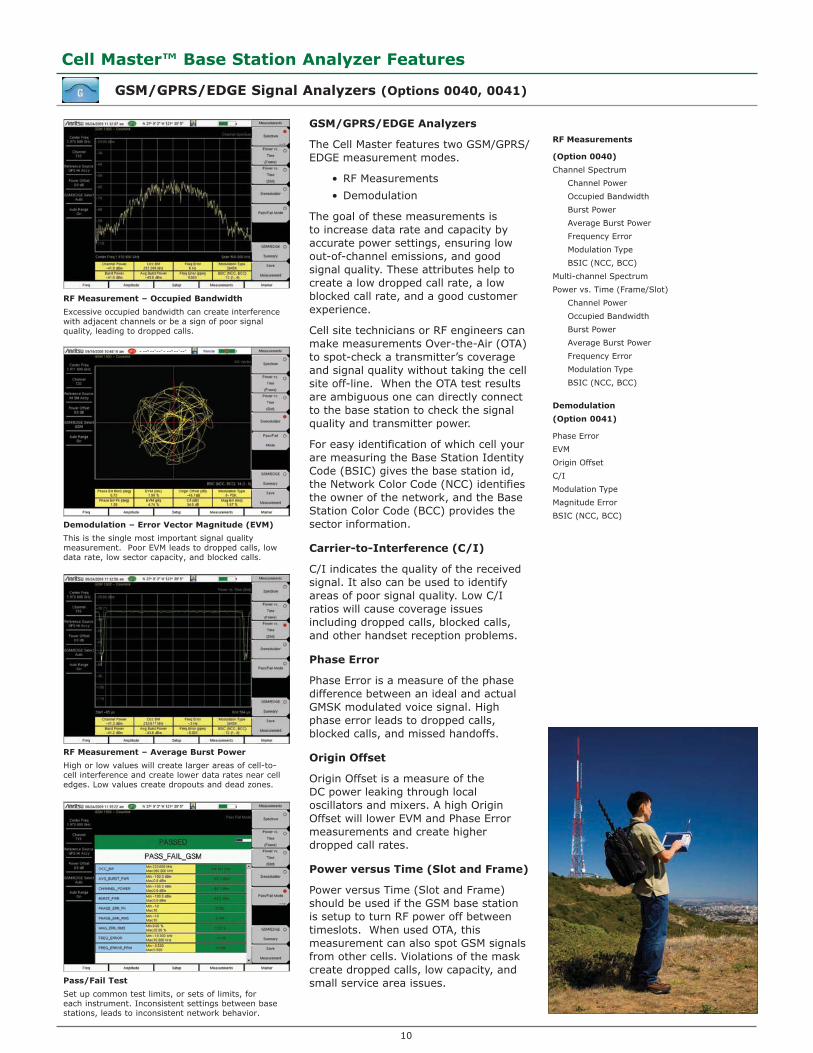
RF Measurement – Occupied Bandwidth
Excessive occupied bandwidth can create interference with adjacent channels or be a sign of poor signal quality, leading to dropped calls.
Demodulation – Error Vector Magnitude (EVM)
This is the single most important signal quality measurement. Poor EVM leads to dropped calls, low data rate, low sector capacity, and blocked calls.
RF Measurement – Average Burst Power
High or low values will create larger areas of cell-to-cell interference and create lower data rates near cell edges. Low values create dropouts and dead zones.
Pass/Fail Test
Set up common test limits, or sets of limits, for each instrument. Inconsistent settings between base stations, leads to inconsistent network behavior.
11
Cell Master™ Base Station Analyzer Features
W-CDMA/HSDPA Signal Analyzers (Options 0044, 0045 or 0065, 0035)
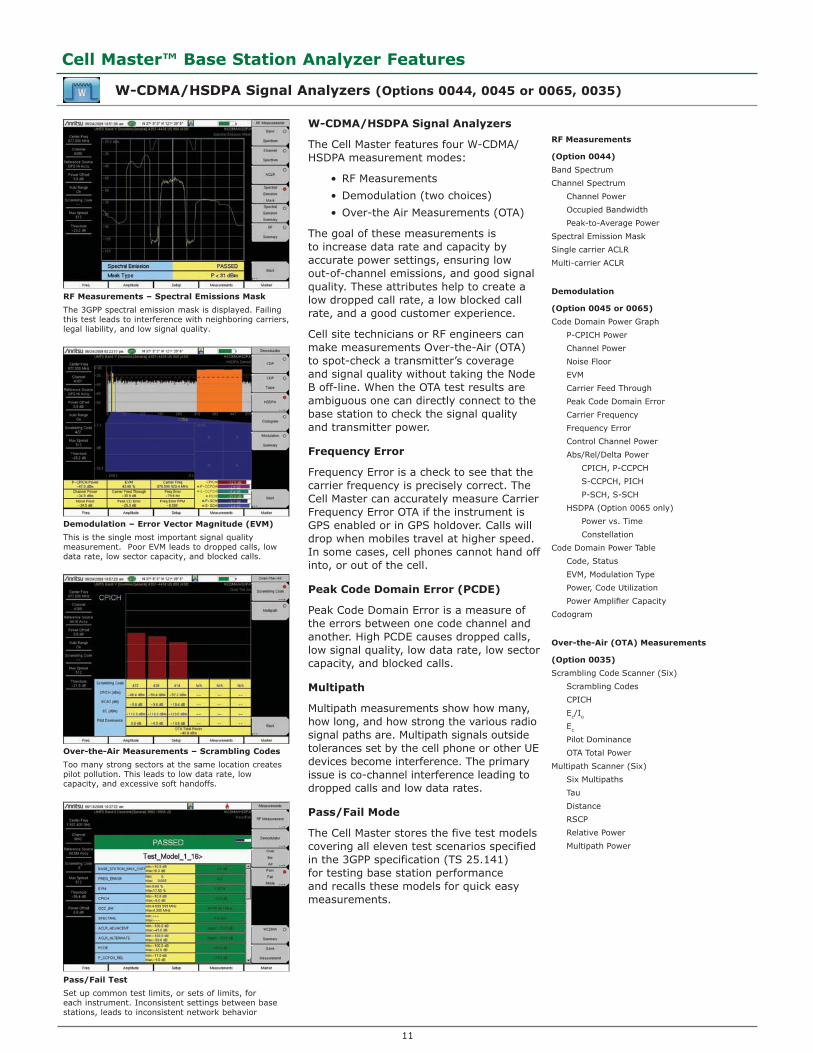
RF Measurements – Spectral Emissions Mask
The 3GPP spectral emission mask is displayed. Failing this test leads to interference with neighboring carriers, legal liability, and low signal quality.
Demodulation – Error Vector Magnitude (EVM)
This is the single most important signal quality measurement. Poor EVM leads to dropped calls, low data rate, low sector capacity, and blocked calls.
Over-the-Air Measurements – Scrambling Codes
Too many strong sectors at the same location creates pilot pollution. This leads to low data rate, low capacity, and excessive soft handoffs.
Pass/Fail Test
Set up common test limits, or sets of limits, for each instrument. Inconsistent settings between base stations, leads to inconsistent network behavior
RF Measurements
(Option 0044)
Band Spectrum
Channel Spectrum
Channel Power
Occupied Bandwidth
Peak-to-Average Power
Spectral Emission Mask
Single carrier ACLR
Multi-carrier ACLR
Demodulation
(Option 0045 or 0065)
Code Domain Power Graph
P-CPICH Power
Channel Power
Noise Floor
EVM
Carrier Feed Through
Peak Code Domain Error
Carrier Frequency
Frequency Error
Control Channel Power
Abs/Rel/Delta Power
CPICH, P-CCPCH
S-CCPCH, PICH
P-SCH, S-SCH
HSDPA (Option 0065 only)
Power vs. Time
Constellation
Code Domain Power Table
Code, Status
EVM, Modulation Type
Power, Code Utilization
Power Amplifier Capacity
Codogram
Over-the-Air (OTA) Measurements
(Option 0035)
Scrambling Code Scanner (Six)
Scrambling Codes
CPICH
Ec/Io
Ec
Pilot Dominance
OTA Total Power
Multipath Scanner (Six)
Six Multipaths
Tau
Distance
RSCP
Relative Power
Multipath Power
W-CDMA/HSDPA Signal Analyzers
The Cell Master features four W-CDMA/ HSDPA measurement modes:
RF Measurements•
Demodulation (two choices)•
Over-the Air Measurements (OTA)•
The goal of these measurements is to increase data rate and capacity by accurate power settings, ensuring low out-of-channel emissions, and good signal quality. These attributes help to create a low dropped call rate, a low blocked call rate, and a good customer experience.
Cell site technicians or RF engineers can make measurements Over-the-Air (OTA) to spot-check a transmitter’s coverage and signal quality without taking the Node B off-line. When the OTA test results are ambiguous one can directly connect to the base station to check the signal quality and transmitter power.
Frequency Error
Frequency Error is a check to see that the carrier frequency is precisely correct. The Cell Master can accurately measure Carrier Frequency Error OTA if the instrument is GPS enabled or in GPS holdover. Calls will drop when mobiles travel at higher speed. In some cases, cell phones cannot hand off into, or out of the cell.
Peak Code Domain Error (PCDE)
Peak Code Domain Error is a measure of the errors between one code channel and another. High PCDE causes dropped calls, low signal quality, low data rate, low sector capacity, and blocked calls.
Multipath
Multipath measurements show how many, how long, and how strong the various radio signal paths are. Multipath signals outside tolerances set by the cell phone or other UE devices become interference. The primary issue is co-channel interference leading to dropped calls and low data rates.
Pass/Fail Mode
The Cell Master stores the five test models covering all eleven test scenarios specified in the 3GPP specification (TS 25.141) for testing base station performance and recalls these models for quick easy measurements.
12
Cell Master™ Base Station Analyzer Features
cdmaOne/CDMA2000 1X Signal Analyzers (Options 0042, 0043, 0033)
RF Measurements
(Option 0042)
Channel Spectrum
Channel Power
Occupied Bandwidth
Peak-to-Average Power
Spectral Emission Mask
Multi-carrier ACPR
Demodulation
(Option 43)
Code Domain Power Graph
Pilot Power
Channel Power
Noise Floor
Rho
Carrier Feed Through
Tau
RMS Phase Error
Frequency Error
Abs/Rel/ Power
Pilot
Page
Sync
Q Page
Code Domain Power Table
Code
Status
Power
Multiple Codes
Code Utilization
Over-the-Air (OTA) Measurements
(0ption 33)
Pilot Scanner (Nine)
PN
Ec/Io
Tau
Pilot Power
Channel Power
Pilot Dominance
Multipath Scanner (Six)
Ec/Io
Tau
Channel Power
Multipath Power
Limit Test – 10 Tests Averaged
Rho
Adjusted Rho
Multipath
Pilot Dominance
Pilot Power
Pass/Fail Status
CDMA Signal Analyzers
The Cell Master features three CDMA measurement modes:
RF Measurements•
Demodulation•
Over-the Air Measurements (OTA)•
The goal of these measurements is to increase data rate and capacity by accurate power settings, ensuring low out-of-channel emissions, and good signal quality. These attributes help to create a low dropped call rate, a low blocked call rate, and a good customer experience.
Cell site technicians or RF engineers can make measurements Over-the-Air (OTA) to spot-check a transmitter’s coverage and signal quality without taking the cell site off-line. When the OTA test results are ambiguous one can directly connect to the base station to check the signal quality and transmitter power.
Adjacent Channel Power Ratio (ACPR)
ACPR measures how much of the carrier gets into neighboring RF channels. ACPR, and multi-channel ACPR, check the closest (adjacent) and second closest (alternate) RF channels for single and multicarrier signals. High ACPR will create interference for neighboring carriers. This is also an indication of low signal quality and low capacity, which can lead to blocked calls.
RMS Phase Error
RMS Phase Error is a measure of signal distortion caused by frequency instability. Any changes in the reference frequency or the radio’s internal local oscillators will cause problems with phase error. A high reading will cause dropped calls, low signal quality, low data rate, low sector capacity, and blocked calls.
Noise Floor
Noise Floor is the average level of the visible code domain noise floor. This will affect Rho. A high noise floor will result in dropped calls, low signal quality, low data rate, low sector capacity, and blocked calls.
Ec/Io
Ec/Io indicates the quality of the signal from each PN. Low Ec/Io leads to low data rate and low capacity.
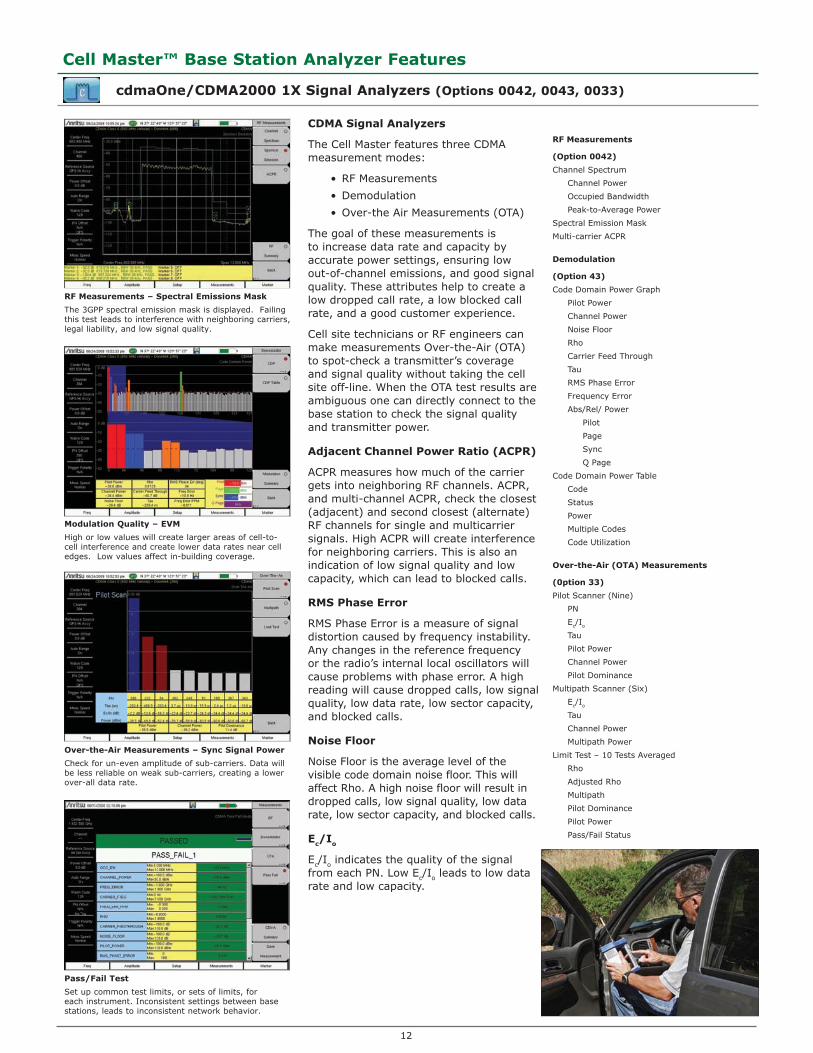
RF Measurements – Spectral Emissions Mask
The 3GPP spectral emission mask is displayed. Failing this test leads to interference with neighboring carriers, legal liability, and low signal quality.
Modulation Quality – EVM
High or low values will create larger areas of cell-to-cell interference and create lower data rates near cell edges. Low values affect in-building coverage.
Over-the-Air Measurements – Sync Signal Power
Check for un-even amplitude of sub-carriers. Data will be less reliable on weak sub-carriers, creating a lower over-all data rate.
Pass/Fail Test
Set up common test limits, or sets of limits, for each instrument. Inconsistent settings between base stations, leads to inconsistent network behavior.
13
Cell Master™ Base Station Analyzer Features
CDMA2000 1xEV-DO Signal Analyzers (Options 0062, 0063, 0034)
RF Measurements – Pilot and MAC Power
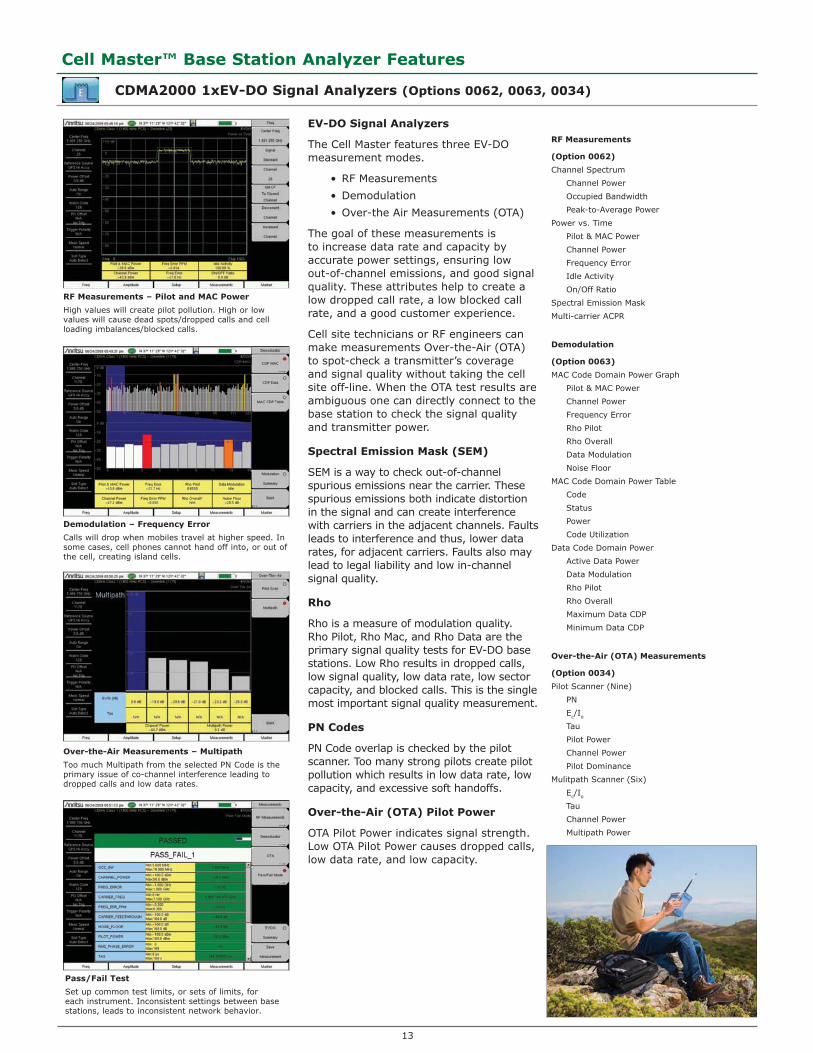
High values will create pilot pollution. High or low values will cause dead spots/dropped calls and cell loading imbalances/blocked calls.
Demodulation – Frequency Error
Calls will drop when mobiles travel at higher speed. In some cases, cell phones cannot hand off into, or out of the cell, creating island cells.
Over-the-Air Measurements – Multipath
Too much Multipath from the selected PN Code is the primary issue of co-channel interference leading to dropped calls and low data rates.
Pass/Fail Test
Set up common test limits, or sets of limits, for each instrument. Inconsistent settings between base stations, leads to inconsistent network behavior.
RF Measurements
(Option 0062)
Channel Spectrum
Channel Power
Occupied Bandwidth
Peak-to-Average Power
Power vs. Time
Pilot & MAC Power
Channel Power
Frequency Error
Idle Activity
On/Off Ratio
Spectral Emission Mask
Multi-carrier ACPR
Demodulation
(Option 0063)
MAC Code Domain Power Graph
Pilot & MAC Power
Channel Power
Frequency Error
Rho Pilot
Rho Overall
Data Modulation
Noise Floor
MAC Code Domain Power Table
Code
Status
Power
Code Utilization
Data Code Domain Power
Active Data Power
Data Modulation
Rho Pilot
Rho Overall
Maximum Data CDP
Minimum Data CDP
Over-the-Air (OTA) Measurements
(Option 0034)
Pilot Scanner (Nine)
PN
Ec/Io
Tau
Pilot Power
Channel Power
Pilot Dominance
Mulitpath Scanner (Six)
Ec/Io
Tau
Channel Power
Multipath Power
EV-DO Signal Analyzers
The Cell Master features three EV-DO measurement modes.
RF Measurements•
Demodulation•
Over-the Air Measurements (OTA)•
The goal of these measurements is to increase data rate and capacity by accurate power settings, ensuring low out-of-channel emissions, and good signal quality. These attributes help to create a low dropped call rate, a low blocked call rate, and a good customer experience.
Cell site technicians or RF engineers can make measurements Over-the-Air (OTA) to spot-check a transmitter’s coverage and signal quality without taking the cell site off-line. When the OTA test results are ambiguous one can directly connect to the base station to check the signal quality and transmitter power.
Spectral Emission Mask (SEM)
SEM is a way to check out-of-channel spurious emissions near the carrier. These spurious emissions both indicate distortion in the signal and can create interference with carriers in the adjacent channels. Faults leads to interference and thus, lower data rates, for adjacent carriers. Faults also may lead to legal liability and low in-channel signal quality.
Rho
Rho is a measure of modulation quality. Rho Pilot, Rho Mac, and Rho Data are the primary signal quality tests for EV-DO base stations. Low Rho results in dropped calls, low signal quality, low data rate, low sector capacity, and blocked calls. This is the single most important signal quality measurement.
PN Codes
PN Code overlap is checked by the pilot scanner. Too many strong pilots create pilot pollution which results in low data rate, low capacity, and excessive soft handoffs.
Over-the-Air (OTA) Pilot Power
OTA Pilot Power indicates signal strength. Low OTA Pilot Power causes dropped calls, low data rate, and low capacity.
14
Cell Master™ Base Station Analyzer Features
LTE Signal Analyzers (Options 0541, 0542, 0546)
RF Measurements – Occupied Bandwidth
The bandwidth that contains 99% of the total carrier power. Excessive occupied bandwidth means excessive adjacent channel interference.
Modulation Quality – EVM
This is the single most important signal quality measurement. Poor EVM leads to dropped calls, low data rate, low sector capacity, and blocked calls.
Over-the-Air Measurements – Sync Signal Power
Check for un-even amplitude of sub-carriers. Data will be less reliable on weak sub-carriers, creating a lower over-all data rate.
Pass/Fail Test
Set up common test limits, or sets of limits, for each instrument. Inconsistent settings between base stations, leads to inconsistent network behavior.
RF Measurements
(Option 0541)
Channel Spectrum
Channel Power
Occupied Bandwidth
ACLR
Modulation Measurements
(10 MHz Bandwidth)
(Option 0542)
Constellation
Reference Signal Power
Sync Signal Power
EVM
Frequency Error
Carrier Frequency
Cell ID
Control Channel Power
RS
P-SS
S-SS
PBCH
PCFICH
Over-the-Air Scanner (OTA)
(Option 0546)
Synch Signal Power (Six Strongest)
Power
Cell ID
Sector ID
Group ID
Dominance
Auto-Save with GPS Tagging and Logging
LTE Signal Analyzers
The Cell Master features three LTE measurement modes:
RF Measurements•
Modulation Measurements•
Over-the-Air Measurements (OTA)•
The goal of these measurements is to increase data rate and capacity by accurate power settings, ensuring low out-of-channel emissions, and good signal quality. These attributes help to create a low dropped call rate, a low blocked call rate, and a good customer experience.
Cell site technicians or RF engineers can make measurements Over-the-Air (OTA) to spot-check a transmitter’s coverage and signal quality without taking the cell site off-line. When the OTA test results are ambiguous one can directly connect to the base station to check the signal quality and transmitter power.
Adjacent Channel Leakage Ratio (ACLR)
Adjacent Channel Leakage Ratio (ACLR) measures how much BTS signal gets into neighboring RF channels. ACLR checks the closest (adjacent) and the second closest (alternate) channels. Poor ACLR can lead to interference with adjacent carriers and legal liability. It also can indicate poor signal quality which leads to low throughput.
Cell ID (Sector ID, Group ID)
Cell ID indicates which base station is being measured OTA. The strongest base station at your current location is selected for measurement. Wrong values for Cell ID lead to inability to register. If the cause is excessive overlapping coverage, it also will lead to poor EVM and low data rates
Frequency Error
Frequency Error is a check to see that the carrier frequency is precisely correct. The Cell Master can accurately measure Carrier Frequency Error OTA if the instrument is GPS enabled or in GPS holdover. Calls will drop when mobiles travel at higher speed. In some cases, cell phones cannot hand off into, or out of the cell.
Sync Signal Mapping
Sync Signal Scanner can be used with the GPS to save scan results for later display on a map. The EVM of the strongest synch signal available at that spot is also recorded. The Cell, Sector, and Group ID information is also included so that it’s easier to interpret the results. Once the Synch Signals are mapped, it becomes much easier to understand and troubleshoot any interference or coverage issues.
15
Cell Master™ Base Station Analyzer Features
Fixed and Mobile WiMAX Signal Analyzers (Options 0046, 0047, 0066, 0067, 0037)
RF Measurement – Preamble Power
High or low values will create larger areas of cell-to-cell interference and create lower data rates near cell edges. Low values affect in-building coverage.
Demodulation – Frequency Error
Calls will drop when user’s equipment travels at high speed. In severe cases, handoffs will not be possible at any speed, creating island cells.
Over-the-Air Measurements – PCINR
A low Physical Carrier to Interference plus Noise Ratio (PCINR) indicates poor signal quality, low data rate and reduced sector capacity.
Pass/Fail Test
Set up common test limits, or sets of limits, for each instrument. Inconsistent settings between base stations, leads to inconsistent network behavior.
RF Measurements
(Option 0046/0066, Fixed/Mobile)
Channel Spectrum
Channel Power
Occupied Bandwidth
Power vs. Time
Channel Power
Preamble Power
Downlink Burst Power (Mobile only)
Uplink Burst Power (Mobile only)
Data Burst Power (Fixed only)
Crest Factor (Fixed only)
ACPR
Demodulation (10 MHz maximum)
(Option 0047/0067, Fixed/Mobile)
Constellation
RCE (RMS/Peak)
EVM (RMS/Peak)
Frequency Error
CINR (Mobile only)
Base Station ID
Carrier Frequency
Sector ID
Spectral Flatness
Adjacent Subcarrier Flatness
EVM vs. Subcarrier/Symbol
RCE (RMS/Peak)
EVM (RMS/Peak)
Frequency Error
CINR (Mobile only)
Base Station ID
Sector ID (Mobile only)
DL-MAP (Tree View) (Mobile only)
Over-the-Air (OTA)
(Option 0037 Mobile only)
Channel Power Monitor
Preamble Scanner (Six)
Preamble
Relative Power
Cell ID
Sector ID
PCINR
Dominant Preamble
Base Station ID
Auto-Save with GPS Tagging and Logging
Fixed and Mobile WiMAX Signal Analyzers
The Cell Master features two Fixed WiMAX and three Mobile WiMAX measurement modes:
RF Measurements•
Demodulation (up to 10 MHz)•
Over-the Air Measurements (OTA)• (Mobile only)
The goal of these measurements is to increase data rate and capacity by accurate power settings, ensuring low out-of-channel emissions, and good signal quality. These attributes help to create a low dropped call rate, a low blocked call rate, and a good customer experience.
Cell site technicians or RF engineers can make measurements Over-the-Air (OTA) to spot-check a transmitter’s coverage and signal quality without taking the cell site off-line. When the OTA test results are ambiguous one can directly connect to the base station to check the signal quality and transmitter power.
Cell ID, Sector ID, and Preamble
Cell ID, Sector ID, and Preamble show which cell, sector, and segment are being measured OTA. The strongest signal is selected automatically for the additional PCINR and Base Station ID measurement. Wrong values for cell, sector and segment ID lead to dropped handoffs and island cells. If the cause is excessive coverage, it also will lead to large areas of low data rates.
Error Vector Magnitude (EVM) Reletive Constellation Error (RCE)
RCE and EVM measure the difference between the actual and ideal signal. RCE is measured in dB and EVM in percent. A known modulation is required to make these measurements. High RCE and EVM causes low signal quality, low data rate, and low sector capacity. This is the single most important signal quality measurement.
Preamble Mapping (Mobile WiMAX)
Preamble Scanner can be used with the GPS to save scan results for later display on a map. PCINR ratio for the strongest WiMAX preamble available at that spot. The Base Station ID and Sector ID information are also included so that it’s easier to interpret the results. Once PCINR data is mapped, it becomes much easier to understand and troubleshoot any interference or coverage issues.
16
Cell Master™ Base Station Analyzer Features
TD-SCDMA/HSDPA Signal Analyzers (Options 0060, 0061, 0038)
RF Measurement – Time Slot Power
Empty downlink slots with access power will reduce the sensibility of the receiver and the size of the sector.This will cause dropped and blocked calls.
Demodulation – Scrambling Code
Scrambling Code measurements provide a check for the BTS settings. Scrambling Code errors can cause a very high dropped call rate on hand off.
Over-the-Air Measurements – Code Scanner
Excessive sync codes produce too much co-channel interference, which leads to lower capacity, low data rate and excessive handoffs.
Pass/Fail Test
Set up common test limits, or sets of limits, for each instrument. Inconsistent settings between base stations, leads to inconsistent network behavior.
RF Measurements
(Option 0060)
Channel Spectrum
Channel Power
Occupied Bandwidth
Left Channel Power
Left Channel Occ B/W
Right Channel Power
Right Channel Occ B/W
Power vs. Time
Six Slot Powers
Channel Power (RRC)
DL-UL Delta Power
UpPTS Power
DwPTS Power
On/Off Ratio
Slot Peak-to-Average Power
Spectral Emission
Demodulation
(Option 0061)
Code Domain Power/Error
(QPSK/8 PSK/16 QAM)
Slot Power
DwPTS Power
Noise Floor
Frequency Error
Tau
Scrambling Code
EVM
Peak EVM
Peak Code Domain Error
Over-the-Air (OTA) Measurements
(Option 0038)
Code Scan (32)
Scrambling Code Group
Tau
Ec/Io
DwPTS Power
Pilot Dominance
Tau Scan (Six)
Sync-DL#
Tau
Ec/Io
DwPTS Power
Pilot Dominance
TD-SCDMA/HSDPA Signal Analyzers
The Cell Master features three TD-SCDMA/ HSDPA measurement modes:
RF Measurements•
Demodulation•
Over-the Air Measurements (OTA)•
The goal of these measurements is to increase data rate and capacity by accurate power settings, ensuring low out-of-channel emissions, and good signal quality. These attributes help to create a low dropped call rate, a low blocked call rate, and a good customer experience.
Cell site technicians or RF engineers can make measurements Over-the-Air (OTA) to spot-check a transmitter’s coverage and signal quality without taking the cell site off-line. When the OTA test results are ambiguous one can directly connect to the base station to check the signal quality and transmitter power.
Error Vector Magnitude (EVM) EVM is the ratio of errors, or distortions, in the actual signal, compared to a perfect signal. EVM faults will result in poor signal quality to all user equipment. In turn, this will result in extended hand off time, lower sector capacity, and lower data rates, increasing dropped and blocked calls.
Peak Code Domain Error (Peak CDE)
Peak CDE is the EVM of the worst code. Code Domain displays show the traffic in a specific time slot. Peak CDE faults will result in poor signal quality to all user equipment. In turn, this will result in extended hand off time, lower sector capacity, and lower data rates.
OTA Tau Scanner Ec/Io
Ec/Io faults indicate excessive or inadequate coverage and lead to low capacity, low data rates, extended handoffs, and excessive call drops.
DwPTS OTA Power Mapping
DwPTS OTA Power when added to Ec/Io gives the absolute sync code power which is often proportional to PCCPCH (pilot) power. Use this to check and plot coverage with GPS. Coverage plots can be downloaded to PC based mapping programs for later analysis. Poor readings will lead to low capacity, low data rates, excessive call drops and call blocking.
17
Cell Master™ Base Station Analyzer Features
ISDB-T Signal Analyzers (Options 0030, 0032)
RF Measurements – Signal Power
The Signal Power screen showing the transmission channel power and signal field strength used to assess suitable reception coverage area.
RF Measurements – Spectrum Mask
The Spectrum Mask measurement is shown. ISDB-T systems in Japan and South America call for different spectrum mask specifications. Both are catered for.
Signal Analysis – Constellation and MER
This is the single most important signal quality measurement. Poor MER leads to higher received errors which can cause serious picture degradation.
SFN Analysis – Delay Profile
This measurement indicates whether signals from different transmitters in an SFN are received correctly to prevent interference and high received errors.
RF Measurements
(Option 0030)
Signal Power
Channel Power
Termination Voltage
Open Terminal Voltage
Field Strength
Spectrum Monitor
Channel Power
Zone Center Channel
Zone Center Frequency
Spectrum Mask
Mask (Standard A) Japan
Mask (Standard B) Japan
Mask (Critical) Brazil
Mask (Sub-critical) Brazil
Mask (Non-critical) Brazil
Phase Noise
Spurious Emissions
Signal Analysis
(Option 0030)
Constellation (w/zoom)
Layer A, B, C, TMCC
Sub-carrier MER
Delay Profile (w/zoom)
Frequency Response
Measured Data
Frequency
Frequency Offset
MER (Total, Layer A/B/C, TMCC, AC1)
Modulation (Layer A/B/C)
Mode, GI
Sub-carrier MER w/marker
Delay w/marker
Frequency Response w/marker
Measurement Modes
(Option 0030)
Custom
User specified measurement
and setup parameters
Easy
User specified measurements.
Some setup parameters are
automatically set or detected
Batch
User specified measurements
and channels for automatic
measurement, display of
results and storage
SFN Analysis
(Option 0032)
Delay Profile (w/zoom)
Inband Spectrum
Measured Data
Channel Power
Delay
DU Ratio
Power
Field Strength
ISDB-T Signal Analyzer
The Cell Master features options that enable area survey measurements and the installation and field maintenance of ISDB-T digital broadcasting equipment in accordance with ARIB (Japan) and ABNT (Brazil) standards.
The user has three measurement modes to choose from depending on the his skill level and test environment: Custom, where specific measurements and setups are chosen; Easy, where some setup parameters are automatically set or detected; Batch, where the user can specify all relevant measurements, setups and channels for automatic measurement and results’ display for fast and efficient field testing.
The goal of all measurements is to ensure digital TV transmitters are configured according to license agreements and optimized for error-free reception over the entire coverage area helping to create an excellent televisual experience.
Field Strength
Field Strength (dBμV/m) measurement enables a technician to assess whether signals will be detected at a location with sufficient power for good TV reception. The antenna factors of the antenna used for measurement can be compensated for to facilitate easy measurement comparison.
Modulation Error Ratio (MER)
MER is the fundamental measurement in digital TV broadcast systems. It quantifies the modulation signal quality directly. It is essential for managing signal margin and the deterioration of equipment with time, as well as for maintaining stable broadcast services. MER is independent of modulation type so MER measurements can be easily compared.
Delay Profile
This function measures the difference in time and frequency of multi-path signals caused by reflections from obstacles or from other transmitters. By measuring the channel frequency response, the multi-path effect or frequency selective fading can be observed. It is important that all signals from reflections or other transmitters are received within the guard interval to prevent inter-symbol interference which will cause reception degradation. Delay Profile measurement is useful for adjusting the timing of SFN repeaters to achieve this.

18
Cell Master™ Base Station Analyzer Features
Backhaul Analyzers (Options 0051, 0052, 0053)
Bi-Polar Violation (BPV)
BPVs occur when the polarity does not switch every time a “1” is transmitted. BPVs are symptoms of low signal quality and result in lower, or no, throughput.
Histogram – Cyclic Redundancy Check (CRC)
CRC errors result in a lower overall throughput for the T1 link. CRC errors can indicate problems bad enough to shut down the link.
Rx Signal Measurements – Vpp
Unusually low Vpp leads to a high bit error rate or alarms, loss of sync and loss of carrier. Unusually high Vpp leads to signal clipping and bit errors.
E1 Measurements
(Option 0052)
Error Detection
Frame Bits, Bit Errors, BER,
BPV, CRC, E Bits
Error Analysis
Errored Seconds (ES)
Error Free Seconds (EFS)
Severely Errored Seconds (SES)
Unavailable Seconds (UAS)
Available Seconds (AS)
Degraded Minutes (DGRM)
Rx Signal
Frequency, Vpp (Max/Min), dBdsx,
Clock Slips, Frame Slips
VF
Frequency, Power
T1 Measurements
(Option 0051)
Error Detection
Frame Bits, Bit Errors, BER,
BPV, CRC, PATLS
Error Analysis
Errored Seconds (ES)
Error Free Seconds (EFS)
Severely Errored Seconds (SES)
Unavailable Seconds (UAS)
Available Seconds (AS)
Degraded Minutes (DGRM)
Rx Signal
Frequency, Vpp (Max/Min), dBdsx,
Clock Slips, Frame Slips
VF
Frequency, Power
T3 Measurements
(Option 0053)
Error Detection
Frame Bits, Bit Errors, BER, BPV,
Lof Count, P-bit Errors, C-bit Errors,
FEBE Errors
Error Analysis
Excess Zeros
Errored Seconds (ES)
Error Free Seconds (EFS)
Severely Errored Seconds (SES)
Unavailable Seconds (UAS)
Available Seconds (AS)
Degraded Minutes (DGRM)
Pattern Loss Seconds (PATLS)
Rx Signal
Frequency, Vpp (Max/Min), dBdsx
VF
Frequency, Power
Backhaul Analyzers
The Cell Master features three Backhaul Analyzer measurement modes:
E1 Analyzer•
T1 Analyzer•
T13/T1 Analyzer•
The goal of these measurements is to maximize throughput for the cell site so the base station can operate at maximum call capacity and data rates for a good customer experience.
Wireless operators need to test the backhaul circuits prior to acceptance from the Telco and for troubleshooting faults. When troubleshooting cell site technicians or RF engineers first step is decide if the fault is on the Telco side of the demarcation point or on the wireless operator’s side, since that determines who needs to fix the fault.
When identifying faults, the troubleshooting can often be done by monitoring an in-service signal, looking for data related errors. However, in some cases, in-service testing is not enough, and an out-of-service test must be performed.
Bit Error Rate Test (BERT)
A Bit Error Rate Test will measure how accurately a backhaul circuit can send and receive data. BER testing is always an out-of-service activity. Errors will cause re-transmissions and a lower over-all data rate. Large numbers of errors will shut down the circuit.
Frame Loss
Frame Loss counts errors in the framing bits. Framing errors do not accumulate as fast as other errors. When monitored for extended periods of time, framing errors can become a valuable indication of signal quality. Frame Loss result in lower, or no, throughput.
Carrier Loss
Carrier Loss keeps track of times that the carrier is interrupted which means the line is dropped and the cell site is off the air.
Frequency Accuracy
Frequency refers to the number of bits per second on the backhaul line. Poor frequency accuracy leads to slipped frames and data loss.
VF Channel Measurements
Verifies the level and frequency of the VF Channel. Through the speaker the tester can make an audible assessment of the signal quality of the circuit.
19
Cell Master™ Base Station Analyzer Features
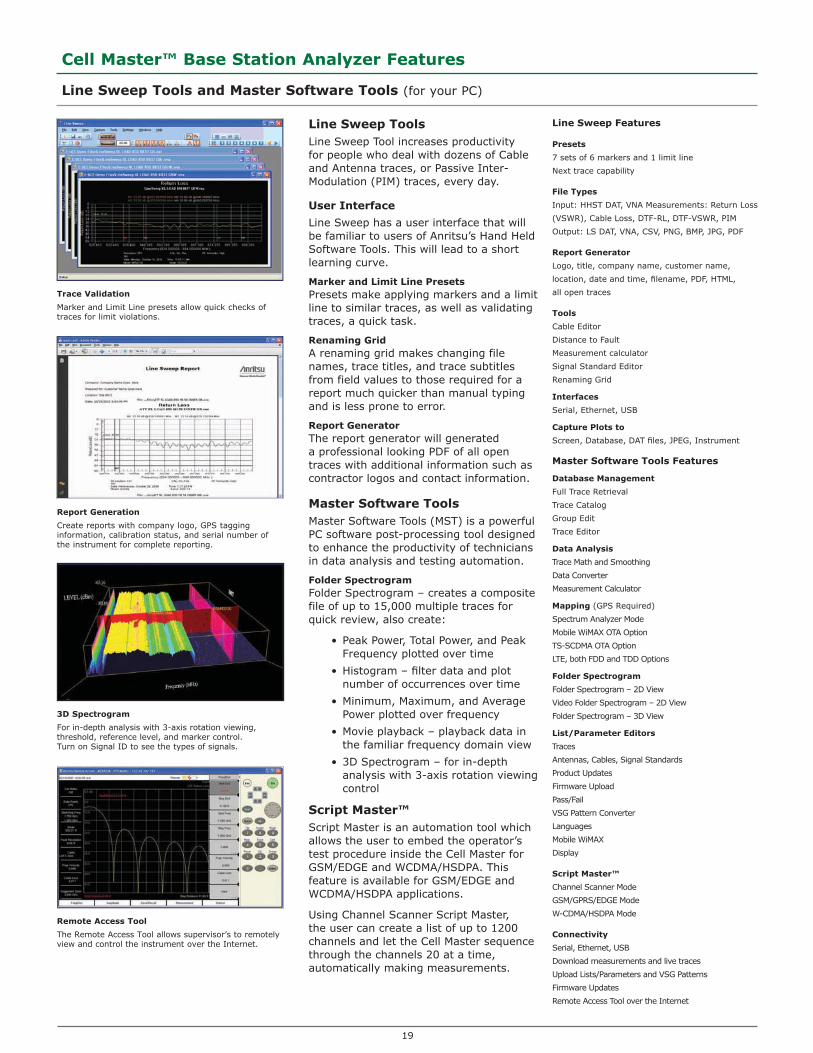
Line Sweep Tools and Master Software Tools (for your PC)
3D Spectrogram
For in-depth analysis with 3-axis rotation viewing, threshold, reference level, and marker control. Turn on Signal ID to see the types of signals.
Remote Access Tool
The Remote Access Tool allows supervisor’s to remotely view and control the instrument over the Internet.
Line Sweep Features
Presets
7 sets of 6 markers and 1 limit line
Next trace capability
File Types
Input: HHST DAT, VNA Measurements: Return Loss
(VSWR), Cable Loss, DTF-RL, DTF-VSWR, PIM
Output: LS DAT, VNA, CSV, PNG, BMP, JPG, PDF
Report Generator
Logo, title, company name, customer name,
location, date and time, filename, PDF, HTML,
all open traces
Tools
Cable Editor
Distance to Fault
Measurement calculator
Signal Standard Editor
Renaming Grid
Interfaces
Serial, Ethernet, USB
Capture Plots to
Screen, Database, DAT files, JPEG, Instrument
Master Software Tools Features
Database Management
Full Trace Retrieval
Trace Catalog
Group Edit
Trace Editor
Data Analysis
Trace Math and Smoothing
Data Converter
Measurement Calculator
Mapping (GPS Required)
Spectrum Analyzer Mode
Mobile WiMAX OTA Option
TS-SCDMA OTA Option
LTE, both FDD and TDD Options
Folder Spectrogram
Folder Spectrogram – 2D View
Video Folder Spectrogram – 2D View
Folder Spectrogram – 3D View
List/Parameter Editors
Traces
Antennas, Cables, Signal Standards
Product Updates
Firmware Upload
Pass/Fail
VSG Pattern Converter
Languages
Mobile WiMAX
Display
Script Master™
Channel Scanner Mode
GSM/GPRS/EDGE Mode
W-CDMA/HSDPA Mode
Connectivity
Serial, Ethernet, USB
Download measurements and live traces
Upload Lists/Parameters and VSG Patterns
Firmware Updates
Remote Access Tool over the Internet
Line Sweep ToolsLine Sweep Tool increases productivity for people who deal with dozens of Cable and Antenna traces, or Passive Inter-Modulation (PIM) traces, every day.
User Interface
Line Sweep has a user interface that will be familiar to users of Anritsu’s Hand Held Software Tools. This will lead to a short learning curve.
Marker and Limit Line PresetsPresets make applying markers and a limit line to similar traces, as well as validating traces, a quick task.
Renaming GridA renaming grid makes changing file names, trace titles, and trace subtitles from field values to those required for a report much quicker than manual typing and is less prone to error.
Report GeneratorThe report generator will generated a professional looking PDF of all open traces with additional information such as contractor logos and contact information.
Master Software ToolsMaster Software Tools (MST) is a powerful PC software post-processing tool designed to enhance the productivity of technicians in data analysis and testing automation.
Folder SpectrogramFolder Spectrogram – creates a composite file of up to 15,000 multiple traces for quick review, also create:
Peak Power, Total Power, and Peak • Frequency plotted over time
Histogram – filter data and plot • number of occurrences over time
Minimum, Maximum, and Average • Power plotted over frequency
Movie playback – playback data in • the familiar frequency domain view
3D Spectrogram – for in-depth • analysis with 3-axis rotation viewing control
Script Master™Script Master is an automation tool which allows the user to embed the operator’s test procedure inside the Cell Master for GSM/EDGE and WCDMA/HSDPA. This feature is available for GSM/EDGE and WCDMA/HSDPA applications.
Using Channel Scanner Script Master, the user can create a list of up to 1200 channels and let the Cell Master sequence through the channels 20 at a time, automatically making measurements.
Trace Validation
Marker and Limit Line presets allow quick checks of traces for limit violations.
Report Generation
Create reports with company logo, GPS tagging information, calibration status, and serial number of the instrument for complete reporting.

20
Cell Master™ Base Station Analyzer Features
ALL CONNECTORS ARE CONVENIENTLY LOCATED ON THE TOP PANEL, LEAVING THE SIDES CLEAR FOR HANDHELD USE
HANDHELD SIZE: 273 X 199 X 91 MM (10.7 X 7.8 X 3.6 IN), LIGHTWEIGHT: 3.71 KG (8.2 LBS)
FAN EXHAUST PORT
EXTERNALREFERENCE
EXT TRIGGER T1 E1 REF. FREQ.
RF IN
USB A-TYPE
USB MINI-B
EXTERNALPOWER
OPTION 52: RX, TX, E1 CONNECTORSOPTION 51, 53: RJ45 IS REPLACED WITH BANTAM CONNECTORS
ON/OFF BUTTON
CALIBRATIONSTATUS & TYPE
RF OUT
SHIFT KEY
GPS
TOUCH SCREEN MAIN MENU KEYS
TOUCH SCREEN SUBMENU KEYS
FAN INLET PORT
FAN INLET PORT
NUMERIC KEYPAD/SHIFT MENU KEYS (1 TO 9) PRINTED IN BLUE

21
Cell Master™ Base Station Analyzer Features
TILT BAILS ARE INTEGRATED INTO THE CASE AND SOFT CASE FOR BETTER SCREEN VIEWING.
TOUCHSCREEN MENU
The Menu Key activates the touchscreen menu for one button access to all of the Analyzers.
User defined shortcuts can be created for one-button access to commonly used functions.
TOUCHSCREEN KEYBOARD
A built-in touchscreen keyboard saves valuable time in the field when entering trace names.
For Cable and Antenna Analysis, a Quick Name Matrix can be customized for quickly naming naming your line sweeps.
22
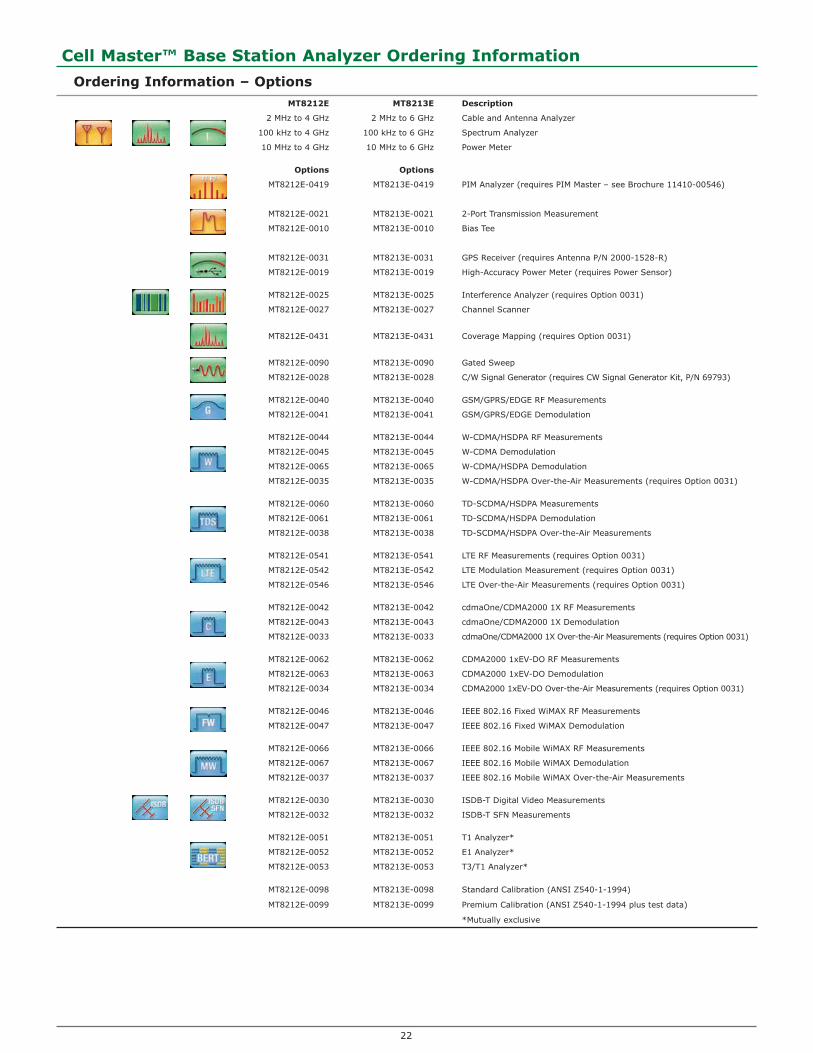
Cell Master™ Base Station Analyzer Ordering Information
Ordering Information – OptionsMT8212E MT8213E Description
2 MHz to 4 GHz 2 MHz to 6 GHz Cable and Antenna Analyzer
100 kHz to 4 GHz 100 kHz to 6 GHz Spectrum Analyzer
10 MHz to 4 GHz 10 MHz to 6 GHz Power Meter
Options Options
MT8212E-0419 MT8213E-0419 PIM Analyzer (requires PIM Master – see Brochure 11410-00546)
MT8212E-0021 MT8213E-0021 2-Port Transmission Measurement
MT8212E-0010 MT8213E-0010 Bias Tee
MT8212E-0031 MT8213E-0031 GPS Receiver (requires Antenna P/N 2000-1528-R)
MT8212E-0019 MT8213E-0019 High-Accuracy Power Meter (requires Power Sensor)
MT8212E-0025 MT8213E-0025 Interference Analyzer (requires Option 0031)
MT8212E-0027 MT8213E-0027 Channel Scanner
MT8212E-0431 MT8213E-0431 Coverage Mapping (requires Option 0031)
MT8212E-0090 MT8213E-0090 Gated Sweep
MT8212E-0028 MT8213E-0028 C/W Signal Generator (requires CW Signal Generator Kit, P/N 69793)
MT8212E-0040 MT8213E-0040 GSM/GPRS/EDGE RF Measurements
MT8212E-0041 MT8213E-0041 GSM/GPRS/EDGE Demodulation
MT8212E-0044 MT8213E-0044 W-CDMA/HSDPA RF Measurements
MT8212E-0045 MT8213E-0045 W-CDMA Demodulation
MT8212E-0065 MT8213E-0065 W-CDMA/HSDPA Demodulation
MT8212E-0035 MT8213E-0035 W-CDMA/HSDPA Over-the-Air Measurements (requires Option 0031)
MT8212E-0060 MT8213E-0060 TD-SCDMA/HSDPA Measurements
MT8212E-0061 MT8213E-0061 TD-SCDMA/HSDPA Demodulation
MT8212E-0038 MT8213E-0038 TD-SCDMA/HSDPA Over-the-Air Measurements
MT8212E-0541 MT8213E-0541 LTE RF Measurements (requires Option 0031)
MT8212E-0542 MT8213E-0542 LTE Modulation Measurement (requires Option 0031)
MT8212E-0546 MT8213E-0546 LTE Over-the-Air Measurements (requires Option 0031)
MT8212E-0042 MT8213E-0042 cdmaOne/CDMA2000 1X RF Measurements
MT8212E-0043 MT8213E-0043 cdmaOne/CDMA2000 1X Demodulation
MT8212E-0033 MT8213E-0033 cdmaOne/CDMA2000 1X Over-the-Air Measurements (requires Option 0031)
MT8212E-0062 MT8213E-0062 CDMA2000 1xEV-DO RF Measurements
MT8212E-0063 MT8213E-0063 CDMA2000 1xEV-DO Demodulation
MT8212E-0034 MT8213E-0034 CDMA2000 1xEV-DO Over-the-Air Measurements (requires Option 0031)
MT8212E-0046 MT8213E-0046 IEEE 802.16 Fixed WiMAX RF Measurements
MT8212E-0047 MT8213E-0047 IEEE 802.16 Fixed WiMAX Demodulation
MT8212E-0066 MT8213E-0066 IEEE 802.16 Mobile WiMAX RF Measurements
MT8212E-0067 MT8213E-0067 IEEE 802.16 Mobile WiMAX Demodulation
MT8212E-0037 MT8213E-0037 IEEE 802.16 Mobile WiMAX Over-the-Air Measurements
MT8212E-0030 MT8213E-0030 ISDB-T Digital Video Measurements
MT8212E-0032 MT8213E-0032 ISDB-T SFN Measurements
MT8212E-0051 MT8213E-0051 T1 Analyzer*
MT8212E-0052 MT8213E-0052 E1 Analyzer*
MT8212E-0053 MT8213E-0053 T3/T1 Analyzer*
MT8212E-0098 MT8213E-0098 Standard Calibration (ANSI Z540-1-1994)
MT8212E-0099 MT8213E-0099 Premium Calibration (ANSI Z540-1-1994 plus test data)
*Mutually exclusive
23
Cell Master™ Base Station Analyzer Ordering Information
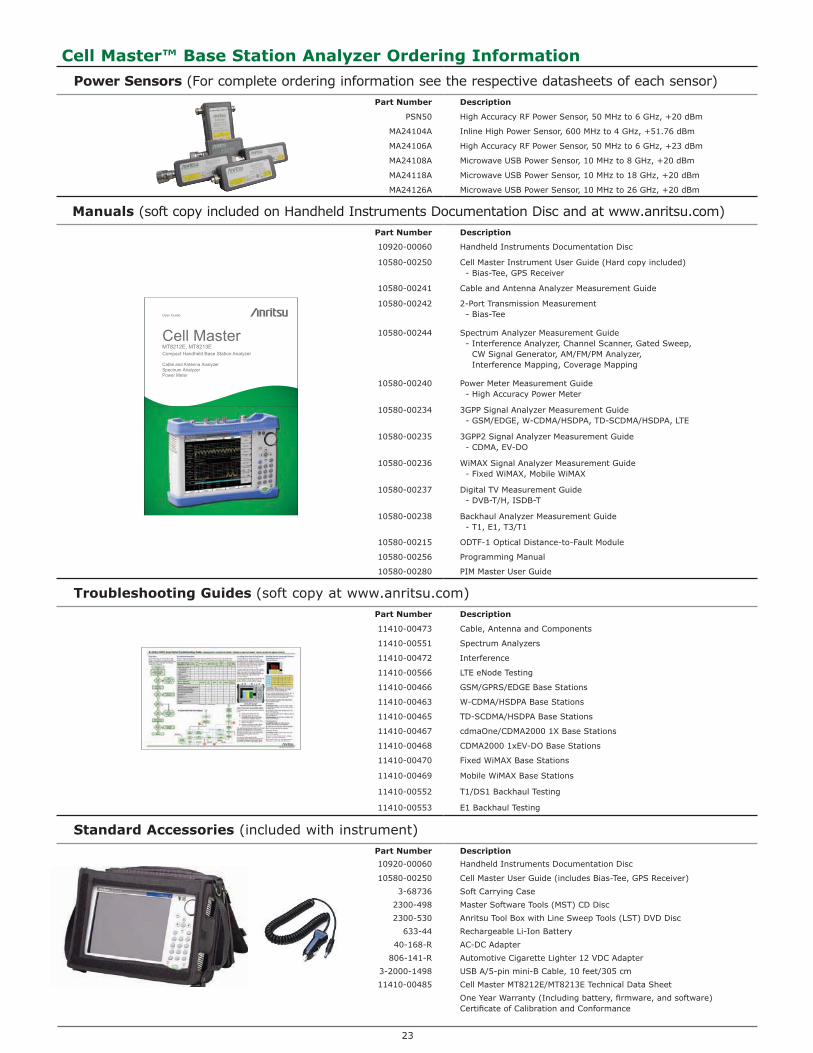
Power Sensors (For complete ordering information see the respective datasheets of each sensor)Part Number Description
PSN50 High Accuracy RF Power Sensor, 50 MHz to 6 GHz, +20 dBm
MA24104A Inline High Power Sensor, 600 MHz to 4 GHz, +51.76 dBm
MA24106A High Accuracy RF Power Sensor, 50 MHz to 6 GHz, +23 dBm
MA24108A Microwave USB Power Sensor, 10 MHz to 8 GHz, +20 dBm
MA24118A Microwave USB Power Sensor, 10 MHz to 18 GHz, +20 dBm
MA24126A Microwave USB Power Sensor, 10 MHz to 26 GHz, +20 dBm
Manuals (soft copy included on Handheld Instruments Documentation Disc and at www.anritsu.com)Part Number Description
10920-00060 Handheld Instruments Documentation Disc
10580-00250 Cell Master Instrument User Guide (Hard copy included) - Bias-Tee, GPS Receiver
10580-00241 Cable and Antenna Analyzer Measurement Guide
10580-00242 2-Port Transmission Measurement - Bias-Tee
10580-00244 Spectrum Analyzer Measurement Guide - Interference Analyzer, Channel Scanner, Gated Sweep,
CW Signal Generator, AM/FM/PM Analyzer, Interference Mapping, Coverage Mapping
10580-00240 Power Meter Measurement Guide - High Accuracy Power Meter
10580-00234 3GPP Signal Analyzer Measurement Guide - GSM/EDGE, W-CDMA/HSDPA, TD-SCDMA/HSDPA, LTE
10580-00235 3GPP2 Signal Analyzer Measurement Guide - CDMA, EV-DO
10580-00236 WiMAX Signal Analyzer Measurement Guide - Fixed WiMAX, Mobile WiMAX
10580-00237 Digital TV Measurement Guide - DVB-T/H, ISDB-T
10580-00238 Backhaul Analyzer Measurement Guide - T1, E1, T3/T1
10580-00215 ODTF-1 Optical Distance-to-Fault Module
10580-00256 Programming Manual
10580-00280 PIM Master User Guide
Troubleshooting Guides (soft copy at www.anritsu.com)Part Number Description
11410-00473 Cable, Antenna and Components
11410-00551 Spectrum Analyzers
11410-00472 Interference
11410-00566 LTE eNode Testing
11410-00466 GSM/GPRS/EDGE Base Stations
11410-00463 W-CDMA/HSDPA Base Stations
11410-00465 TD-SCDMA/HSDPA Base Stations
11410-00467 cdmaOne/CDMA2000 1X Base Stations
11410-00468 CDMA2000 1xEV-DO Base Stations
11410-00470 Fixed WiMAX Base Stations
11410-00469 Mobile WiMAX Base Stations
11410-00552 T1/DS1 Backhaul Testing
11410-00553 E1 Backhaul Testing
Standard Accessories (included with instrument)Part Number Description
10920-00060 Handheld Instruments Documentation Disc
10580-00250 Cell Master User Guide (includes Bias-Tee, GPS Receiver)
3-68736 Soft Carrying Case
2300-498 Master Software Tools (MST) CD Disc
2300-530 Anritsu Tool Box with Line Sweep Tools (LST) DVD Disc
633-44 Rechargeable Li-Ion Battery
40-168-R AC-DC Adapter
806-141-R Automotive Cigarette Lighter 12 VDC Adapter
3-2000-1498 USB A/5-pin mini-B Cable, 10 feet/305 cm
11410-00485 Cell Master MT8212E/MT8213E Technical Data Sheet
One Year Warranty (Including battery, firmware, and software)Certificate of Calibration and Conformance
���������-��������
�$%�&�' �$%�&!' ��������������������������������
�)��������������������������������������,�������

24
Cell Master™ Base Station Analyzer Ordering Information
Optional Accessories
Calibration Components, 50 Ω
Part Number Description
ICN50B InstaCal™ Calibration Module, 38 dB, 2 MHz to 6.0 GHz, N(m), 50 Ω
OSLN50-1 Precision Open/Short/Load, N(m), 42 dB, 6.0 GHz, 50 Ω
OSLNF50-1 Precision Open/Short/Load, N(f), 42 dB, 6.0 GHz, 50 Ω
2000-1618-R Precision Open/Short/Load, 7/16 DIN(m), DC to 4.0 GHz 50 Ω
2000-1619-R Precision Open/Short/Load, 7/16 DIN(f), DC to 4.0 GHz 50 Ω
22N50 Open/Short, N(m), DC to 18 GHz, 50 Ω
22NF50 Open/Short, N(f), DC to 18 GHz, 50 Ω
SM/PL-1 Precision Load, N(m), 42 dB, 6.0 GHz
SM/PLNF-1 Precision Load, N(f), 42 dB, 6.0 GHz
Calibration Components, 75 Ω
Part Number Description
22N75 Open/Short, N(m), DC to 3 GHz, 75 Ω
22NF75 Open/Short, N(f), DC to 3 GHz, 75 Ω
26N75A Precision Termination, N(m), DC to 3 GHz, 75 Ω
26NF75A Precision Termination, N(f), DC to 3 GHz, 75 Ω
12N50-75B Matching Pad, DC to 3 GHz, 50 Ω to 75 Ω
Phase-Stable Test Port Cables, Armored w/ Reinforced Grip (recommended for cable & antenna line sweep applications)
Part Number Description
15RNFN50-1.5-R 1.5 m, DC to 6 GHz, N(m) to N(f), 50 Ω
15RDFN50-1.5-R 1.5 m, DC to 6 GHz, N(m) to 7/16 DIN(f), 50 Ω
15RDN50-1.5-R 1.5 m, DC to 6 GHz, N(m) to 7/16 DIN(m), 50 Ω
15RNFN50-3.0-R 3.0 m, DC to 6 GHz, N(m) to N(f), 50 Ω
15RDFN50-3.0-R 3.0 m, DC to 6 GHz, N(m) to 7/16 DIN(f), 50 Ω
15RDN50-3.0-R 3.0 m, DC to 6 GHz, N(m) to 7/16 DIN(m), 50 Ω
InterChangeable Adaptor Phase Stable Test Port Cables, Armored w/Reinforced Grip (recommended for cable and antenna line sweep applications. It uses the same ruggedized grip as the Reinforced grip series cables. Now you can also change the adaptor interface on the grip to four different connector types)
Part Number Description
15RCN50-1.5-R 1.5 m, DC to 6 GHz, N(m), N(f), 7/16 DIN(m), 7/16 DIN(f), 50 Ω
15RCN50-3.0-R 3.0 m, DC to 6 GHz, N(m), N(f), 7/16 DIN(m), 7/16 DIN(f), 50 Ω
Phase-Stable Test Port Cables, Armored (ideal for use with tightly spaced connectors and other general use applications)
Part Number Description
15NNF50-1.5C 1.5 m, DC to 6 GHz, N(m) to N(f), 50 Ω
15NN50-1.5C 1.5 m, DC to 6 GHz, N(m) to N(m), 50 Ω
15NDF50-1.5C 1.5 m, DC to 6 GHz, N(m) to 7/16 DIN(f), 50 Ω
15ND50-1.5C 1.5 m, DC to 6 GHz, N(m) to 7/16 DIN(m), 50 Ω
15NNF50-3.0C 3.0 m, DC to 6 GHz, N(m) to N(f), 50 Ω
15NN50-3.0C 3.0 m, DC to 6 GHz, N(m) to N(m), 50 Ω
Adapters
Part Number Description
1091-26-R SMA(m) to N(m), DC to 18 GHz, 50 Ω
1091-27-R SMA(f) to N(m), DC to 18 GHz, 50 Ω
1091-80-R SMA(m) to N(f), DC to 18 GHz, 50 Ω
1091-81-R SMA(f) to N(f), DC to 18 GHz, 50 Ω
1091-172-R BNC(f) to N(m), DC to 1.3 GHz, 50 Ω
510-90 7/16 DIN(f) to N(m), DC to 7.5 GHz, 50 Ω
510-91 7/16 DIN(f) to N(f), DC to 7.5 GHz, 50 Ω
510-92 7/16 DIN(m) to N(m), DC to 7.5 GHz, 50 Ω
510-93 7/16 DIN(m) to N(f), DC to 7.5 GHz, 50 Ω
510-96 7/16 DIN(m) to 7/16 DIN (m), DC to 7.5 GHz, 50 Ω
510-97 7/16 DIN(f) to 7/16 DIN (f), DC to 7.5 GHz, 50 Ω
1091-379-R 7/16 DIN(f) to 7/16 DIN(f), DC to 6 GHz, 50 Ω, w/ Reinforced Grip
510-102-R N(m) to N(m), DC to 11 GHz, 50 Ω, 90 degrees right angle

25
Cell Master™ Base Station Analyzer Ordering Information
Optional Accessories (continued)
Precision Adapters
Part Number Description
34NN50A Precision Adapter, N(m) to N(m), DC to 18 GHz, 50 Ω
34NFNF50 Precision Adapter, N(f) to N(f), DC to 18 GHz, 50 Ω
Miscellaneous Accessories
Part Number Description
2000-1528-R GPS Antenna, SMA(m)
69793 CW Signal Generator Kit
ODTF-1 Optical Distance-to-Fault Module, 1550 nm, Single Mode
2000-1520-R USB Flash Drive
2000-1374 External Charger for Li-lon Batteries
2300-532 Map Master CD
Backpack and Transit Case
Part Number Description
67135 Anritsu Backpack (For Handheld Instrument and PC)
760-243-R Large Transit Case with Wheels and Handle
Directional Antennas
Part Number Description
2000-1411-R 824 MHz to 896 MHz, N(f), 10 dBd, Yagi
2000-1412-R 885 MHz to 975 MHz, N(f), 10 dBd, Yagi
2000-1413-R 1710 MHz to 1880 MHz, N(f), 10 dBd. Yagi
2000-1414-R 1850 MHz to 1990 MHz, N(f), 9.3 dBd, Yagi
2000-1415-R 2400 MHz to 2500 MHz, N(f), 10 dBd, Yagi
2000-1416-R 1920 MHz to 2170 MHz, N(f), 10 dBd, Yagi
2000-1519-R 500 MHz to 3000 MHz, log periodic
Portable Antennas
Part Number Description
2000-1200-R 806 MHz to 866 MHz, SMA(m), 50 Ω
2000-1473-R 870 MHz to 960 MHz, SMA(m), 50 Ω
2000-1035-R 896 MHz to 941 MHz, SMA(m), 50 Ω (1/2 wave)
2000-1030-R 1710 MHz to 1880 MHz, SMA(m), 50 Ω (1/2 wave)
2000-1474-R 1710 MHz to 1880 MHz with knuckle elbow (1/2 wave)
2000-1031-R 1850 MHz to 1990 MHz, SMA(m), 50 Ω (1/2 wave)
2000-1475-R 1920 MHz to 1980 MHz and 2110 MHz to 2170 MHz, SMA(m), 50 Ω
2000-1032-R 2400 MHz to 2500 MHz, SMA(m), 50 Ω (1/2 wave)
2000-1361-R 2400 MHz to 2500 MHz, 5000 MHz to 6000 MHz, SMA(m), 50 Ω
2000-1636-R Antenna Kit (Consists of: 2000-1030-R, 2000-1031-R, 2000-1032-R, 2000-1200-R, 2000-1035-R, 2000-1361-R, and carrying pouch)
Mag Mount Broadband Antenna
Part Number Description
2000-1647-R Cable 1: 698-1200 MHz 2 dBi peak gain, 1700-2700 MHz 5 dBi peak gain,N(m), 50 Ω, 10 ftCable 2: 3000-6000 MHz 5 dBi peak gain, N(m), 50 Ω, 10 ftCable 3: GPS 26 db gain, SMA(m), 50 Ω, 10 ft
2000-1645-R 694-894 MHz 3 dBi peak gain, 1700-2700 MHz 3dBi peak gain,N(m), 50 Ω, 10 ft
2000-1646-R 750-1250 MHz 3 dBi peak gain, 1650-2000 MHz 5 dBi peak gain,2100-2700 MHz 3 dBi peak gain, N(m), 50 Ω, 10 ft
2000-1648-R 1700-6000 MHz 3 dBi peak gain,N(m), 50 Ω, 10 ft
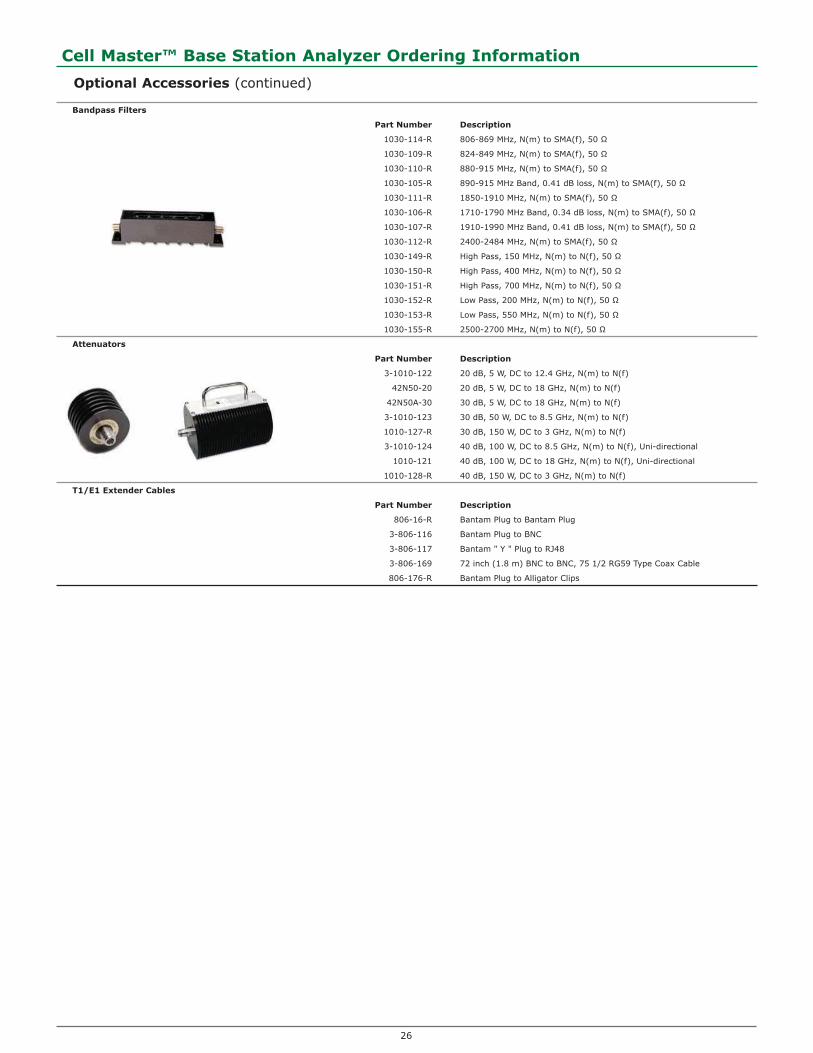
26
Cell Master™ Base Station Analyzer Ordering Information
Optional Accessories (continued)
Bandpass Filters
Part Number Description
1030-114-R 806-869 MHz, N(m) to SMA(f), 50 Ω
1030-109-R 824-849 MHz, N(m) to SMA(f), 50 Ω
1030-110-R 880-915 MHz, N(m) to SMA(f), 50 Ω
1030-105-R 890-915 MHz Band, 0.41 dB loss, N(m) to SMA(f), 50 Ω
1030-111-R 1850-1910 MHz, N(m) to SMA(f), 50 Ω
1030-106-R 1710-1790 MHz Band, 0.34 dB loss, N(m) to SMA(f), 50 Ω
1030-107-R 1910-1990 MHz Band, 0.41 dB loss, N(m) to SMA(f), 50 Ω
1030-112-R 2400-2484 MHz, N(m) to SMA(f), 50 Ω
1030-149-R High Pass, 150 MHz, N(m) to N(f), 50 Ω
1030-150-R High Pass, 400 MHz, N(m) to N(f), 50 Ω
1030-151-R High Pass, 700 MHz, N(m) to N(f), 50 Ω
1030-152-R Low Pass, 200 MHz, N(m) to N(f), 50 Ω
1030-153-R Low Pass, 550 MHz, N(m) to N(f), 50 Ω
1030-155-R 2500-2700 MHz, N(m) to N(f), 50 Ω
Attenuators
Part Number Description
3-1010-122 20 dB, 5 W, DC to 12.4 GHz, N(m) to N(f)
42N50-20 20 dB, 5 W, DC to 18 GHz, N(m) to N(f)
42N50A-30 30 dB, 5 W, DC to 18 GHz, N(m) to N(f)
3-1010-123 30 dB, 50 W, DC to 8.5 GHz, N(m) to N(f)
1010-127-R 30 dB, 150 W, DC to 3 GHz, N(m) to N(f)
3-1010-124 40 dB, 100 W, DC to 8.5 GHz, N(m) to N(f), Uni-directional
1010-121 40 dB, 100 W, DC to 18 GHz, N(m) to N(f), Uni-directional
1010-128-R 40 dB, 150 W, DC to 3 GHz, N(m) to N(f)
T1/E1 Extender Cables
Part Number Description
806-16-R Bantam Plug to Bantam Plug
3-806-116 Bantam Plug to BNC
3-806-117 Bantam " Y " Plug to RJ48
3-806-169 72 inch (1.8 m) BNC to BNC, 75 1/2 RG59 Type Coax Cable
806-176-R Bantam Plug to Alligator Clips

27
Notes
&&"&*.**/&0 1�234 ���������-����������� �*&*.&&5�*&*������� ������3���1�����1����2��3
6������������������+����������������������+�������� ��������2����������3#�����)7�����������,������ ������34�����������������������������2����8,,,3�������3���
$��������-������������������������ ���������������2������������� ���������������� ���,��+����������������������+������������������2�������� �����3������)�����,��������2����9�����:��������;�,�������,�������������� ��������������� ��,���������,��������3<���������������������8,,,3�������3��=����������
$������2��>����������������������������������������
2�������������������������8,,,3�����������3���
Training at Anritsu����������������������������������������������,������������������������������7�)34���2����)�����������������2����8,,,3��3�������3���=��������
������������
Anritsu Corporation/.&.&?��� ������.��� @�����,� �"!.%///A���������8B%&."(.��!.&&&&4�C8B%&."(.�D(.&�!%
• U.S.A.Anritsu Company&&//'��� ����������2��� �����&** 1��������� $E 0/*%&-3�3�3$���4���8&.%**.�;19$�-F�(0."%0%G�����8B&.D0�.("".&0004�C8B&.D0�.(0&.&%00• CanadaAnritsu Electronics Ltd.0**���2����2��1��� �����&�* @����� ?������@�<& ! ����������8B&.(&!./D&.�**!4�C8B&.(&!./D&.&**(
• BrazilAnritsu Electrônica Ltda.���H������������� �0.&�����*&!�0.*&*.���<����.�I������.��.����������8B//.&&.!�%!.�/&&4�C8B//.&&.!�%%.(D"*
• MexicoAnritsu Company, S.A. de C.V.�23'7J�����;�������;�3/0D����D ��3�������&&/�*�JC��� #343 �JC��������8B/�.//.&&*&.�!0*4�C8B/�.//./�/".!&"0
• U.K.Anritsu EMEA Ltd.�** ���)���������� K���� �����������K-&!K- -3@3�����8B"".&/%�."!!�%*4�C8B"".&/%�.0!&!*!
• FranceAnritsu S.A.&��2������:�J)�� L������9���&.�����(!% D&&"*<9KK'?;�-1M<'$$' 4����������8B!!.&.(*.D�.&/./*4�C8B!!.&.("."(.&*.(/
• GermanyAnritsu GmbH;��������+���� @�����.N���.�����&%&%�D�O����� ������������8B"DF*G%D""�!*%.*4�C8B"DF*G%D""�!*%.//
• ItalyAnritsu S.p.A.<��'���<�������� &�D **&""1��� 9���������8B!D.*(./*D.D0&&4�C8B!D.*(./*�.�"�/
• SwedenAnritsu AB�����7���������&! &(""*@9�$� �,���������8B"(.%./!".0*0.**4�C8B"(.%./!".0*0.!*
• FinlandAnritsu AB$�+��)���2����!./ 49.*&/!*<�;$�� 4�����������8B!/%.�*.0"&.%&**4�C8B!/%.�*.0"&.%&&&
• DenmarkAnritsu A/S (for Service Assurance)Anritsu AB (for Test & Measurement)@��+�)7������JD*#@.�(*/�P��)� #�����+�����8B"/.0�&&.��**4�C8B"/.0�&&.��&*
• RussiaAnritsu EMEA Ltd. Representation Office in Russia$2���+������3&(=� )��3& 0�������31����� &�/**D �����,�����8B0."D/.!(!.&(D"4�C8B0."D/.D!/.%D(�
• United Arab EmiratesAnritsu EMEA Ltd.Dubai Liaison Office�?�C/**"&!.#�)��9������� �����$������������� $�,��& �����0*& 0��4����#�)�� -��������)'������������8BD0&.".!(0*!/�4�C8BD0&.".!(%%"(*
• SingaporeAnritsu Pte. Ltd.(*���C�����$������ Q*�.*% $�� ������FK�))��G���������&&%/*������8B(/.(�%�.�"**4�C8B(/.(�%�.�/!!
• IndiaAnritsu Pte. Ltd. India Branch Office!��4���� ����K�+�����������;�,�� Q�0�( %*��1��� ��K!������� �������� ./(**0/ 9���������8BD&.%*."*/%.&!**4�C8BD&.%*."*/%.&!*&
• P. R. China (Hong Kong)Anritsu Company Ltd.-����"R/ �%��4���� ����������$�,�� ������������� ;�3&�������������1��� $������$���'��� @�,���� ����@��� �313 ���������8B%/�.�!*&."D%*4�C8B%/�.�!*&.!/"/
• P. R. China (Beijing)Anritsu Company Ltd.Beijing Representative Office1����**% ��7���4������������� ;�3/ #���.���.������1��� ���.M���#������� ��7���&****" �313 ���������8B%(.&*.(/D*.D�!*4�C8B%(.&*.(/D*.D�!/
• KoreaAnritsu Corporation, Ltd.%4����7�+���3%!�."& M��+���.#��� @������.+� ����� &!/.*%* @���������8B%�.�.//!.((*!4�C8B%�.�.//!.((*"
• AustraliaAnritsu Pty Ltd.-����&=�0*4������������1��� ;����������<������� !&(% ��������������8B(&.!.D//%.%&004�C8B(&.!.D//%.%�//
• TaiwanAnritsu Company Inc.04 ;�3!&( ���3& ;����1�3 $�����&&" $��,�������8B%%(.�.%0/&.&%&(4�C8B%%(.�.%0/&.&%&0