cell cycle commitment in budding yeast emerges...
TRANSCRIPT

on July 28, 2018http://rsob.royalsocietypublishing.org/Downloaded from
rsob.royalsocietypublishing.org
ResearchCite this article: Zhang T, Schmierer B, Novak B.
2011 Cell cycle commitment in budding yeast
emerges from the cooperation of multiple
bistable switches. Open Biol 1: 110009.
http://dx.doi.org/10.1098/rsob.110009
Received: 16 September 2011
Accepted: 3 November 2011
Subject Area:systems biology/cellular biology
Keywords:bistability, budding yeast, decision making,
dynamical systems, pheromone response,
START transition
Author for correspondence:Bela Novak
e-mail: [email protected]
& 2011 The Authors. Published by the Royal Society under the terms of the Creative Commons AttributionLicense http://creativecommons.org/licenses/by/3.0/, which permits unrestricted use, provided the originalauthor and source are credited.
Cell cycle commitment inbudding yeast emerges fromthe cooperation of multiplebistable switchesTongli Zhang, Bernhard Schmierer and Bela Novak
Oxford Centre for Integrative Systems Biology (OCISB), Department of Biochemistry,University of Oxford, South Parks Road, Oxford OX1 3QU, UK
1. SummaryThe start-transition (START) in the G1 phase marks the point in the cell cycle at
which a yeast cell initiates a new round of cell division. Once made, this
decision is irreversible and the cell is committed to progressing through the
entire cell cycle, irrespective of arrest signals such as pheromone. How commit-
ment emerges from the underlying molecular interaction network is poorly
understood. Here, we perform a dynamical systems analysis of an established
cell cycle model, which has never been analysed from a commitment perspec-
tive. We show that the irreversibility of the START transition and subsequent
commitment can be consistently explained in terms of the interplay of multiple
bistable molecular switches. By applying an existing mathematical model to a
novel problem and by expanding the model in a self-consistent manner, we
achieve several goals: we bring together a large number of experimental find-
ings into a coherent theoretical framework; we increase the scope and the
applicability of the original model; we give a systems level explanation of
how the START transition and the cell cycle commitment arise from the dyna-
mical features of the underlying molecular interaction network; and we make
clear, experimentally testable predictions.
2. IntroductionYeast cells enter the cell division cycle depending on cell mass as well as on
environmental cues such as nutrient availability, and they arrest cycling in
response to factors such as mating pheromone. Signal transduction cascades
interact with and affect the cell cycle control network to either promote or
halt entry into a new round of cell division [1]. The decision to initiate a new
cycle is made at the start-transition (START) in the G1 phase [2]. START is a
point of no return: post-START cells are irrevocably committed to cell division
and will finish the cycle, irrespective of environmental cues. This characteristic
has led to the initial conceptual definition of START as the point in the cell cycle
after which a yeast cell no longer responds with arrest to mating pheromone [3].
Such cells are said to be committed and, despite the presence of pheromone,
progress normally through late G1, S, G2 and M to finally arrest early in G1
of the following cycle, indicating that, at this point, pheromone sensitivity is
restored. Robust decision-making is required to guarantee that the two incom-
patible cell fates—pheromone-induced mating and cell division—are never
realized simultaneously.
At the molecular level, pheromone binds to the receptor Ste2 to initiate a
mitogen-activated protein kinase (MAPK) cascade. The terminal kinase in

Cln3 SBF Cln2
Clb2
Cln-switch
Sic1
Cdh1Cdc20
Clb-switch
mass
Figure 1. Some important feedback loops in the budding yeast cell cyclecontrol network. Cln3, Cln2 and Clb2 denote the corresponding Cyclin:Cdk1complexes. Briefly, Cln3 initiates the cell cycle in a cell-mass-dependentfashion by activating the transcription factor SBF, which triggers theexpression of Cln2. Cln2 activates its own transcription (Cln-switch). Byinhibiting both Sic1 and Cdh1, Cln2 promotes the activity of Clb2, which self-activates by further inhibiting Sic1 and Cdh1 (Clb-switch). Once active,Clb2 represses SBF and blocks Cln2 expression. At late cell cycle stages,Clb2 induces Cdc20, which triggers Clb2 degradation. A comprehensivedescription of the cell cycle control network used for modelling is given byChen et al. [19].
rsob.royalsocietypublishing.orgOpen
Biol1:110009
2
on July 28, 2018http://rsob.royalsocietypublishing.org/Downloaded from
this cascade, Fus3, activates the transcription factor Ste12,
which in turn induces the expression of mating genes. One
of these targets, the Cdk1-inhibitor Far1 [4], pheromone-
dependently interacts with Cln1/2/3:Cdk1 complexes [5] to
inhibit their activity [6], but not to B-type cyclin:Cdk1 com-
plexes. Far1 is crucially involved in arresting cells in
response to pheromone [7] and requires Fus3-dependent
phosphorylation for full activity [8,9]. Transcriptional induc-
tion and activation of Far1 by Ste12 depend on the assembly
of the pheromone-induced MAPK cascade on the scaffolding
protein Ste5, which is recruited to the membrane in response
to pheromone. Membrane recruitment activates Ste5 [10],
whereas phosphorylation by Cln1/2:Cdk1 complexes inacti-
vates the protein, thus blocking Far1 activation, and also
transcriptional activation of other Ste12 targets [11]. In
addition, direct phosphorylation of Far1 by Cln1/2:Cdk1
promotes Far1 degradation [12]. In summary, Cln1/2:Cdk1
complexes inhibit their own inhibitor Far1 in a dual
manner—by blocking its synthesis and activation, and by
promoting its degradation.
While the topologies of the molecular interaction networks
of both the cell cycle engine and of pheromone signalling are
becoming increasingly well-defined, the fundamental ques-
tions of how the molecular interaction network gives rise to
robust decision-making and to commitment have only recently
begun to be addressed [13,14]. From a dynamical systems point
of view, the irreversible START transition can be explained by
the presence of a positive feedback loop in the under-
lying biochemical control network [13], which can cause
switch-like behaviour [15,16]. However, additional negative
feedback loops counteract these self-enhancing processes
[17,18]. How cells balance these contradictory forces remains
poorly understood.
Here, we address these issues by analysing and expanding
the model of Chen et al. [19] (hereafter ‘Chen’s Model’), the
most comprehensive mathematical model of the yeast cell
cycle to date. This model combines an ambitious scope with
extremely careful validation against a large number of datasets
from a large number of cell cycle mutants, and is thus well con-
strained. By integrating a large proportion of the available
knowledge on the interactions in the budding yeast cell cycle,
its original parametrization successfully captures the behav-
iour of more than 130 mutant strains. Chen’s model has
never been analysed from a commitment perspective, and we
first use the model in its original form and parametrization
to simulate and corroborate recent experimental findings. We
showcase that a published model can be successfully applied
to novel problems, and can be expanded in its scope in a self-
consistent manner. In doing so, we hope to encourage a
wider use of existing mathematical models both by experi-
mentalists (to predict the outcomes of experiments) and by
modellers (to use newly available datasets to challenge and
improve published models).
Our simulations explain the notion that Cln2 auto-
activation is important for a robust START transition [13]
at the level of the comprehensive cell cycle control system.
We demonstrate that cell cycle commitment is a systems
property and propose that commitment emerges from
the cooperation of several bistable switches in the underly-
ing, feedback-controlled reaction network. We go on
to demonstrate that commitment is maintained by two
fundamentally distinct mechanisms, depending on the
post-START cell cycle stage.
Two mutations in components of the pheromone path-
way (Far1-S87P and Ste5-8A) have been described, which
both render the respective protein resistant to the inhibitory
effect of Cln1/2:Cdk1-dependent phosphorylation; however,
they differ in their phenotypes. Only our theoretical results
are not only consistent with the observed differential behav-
iour of these mutants, but in addition make a testable
prediction as to how the abnormal cell cycle arrest, which is
observed in a fraction of Ste5-8A cells, could arise.
3. ResultsFor simplicity, ‘Cln2’ and ‘Clb2’ are used throughout as
shorthand for Cln1/2:Cdk1 complexes and Clb1/2:Cdk1
complexes, respectively. Chen’s model explains cell cycle
dynamics in budding yeast in terms of interconnected posi-
tive and double-negative feedback loops, which can act as
bistable switches (figure 1). Cln2 activity is controlled by a
positive feedback loop: Cln2 phosphorylates and induces
the nuclear export of Whi5 to activate the transcription
factor SBF [20,21], which in turn promotes the expression of
CLN2 and also of CLN1 [22,23]. We refer to this positive feed-
back loop as the ‘Cln-switch’. By contrast, Clb2 is controlled
by double-negative feedback loops: Clb2 inactivates its stoi-
chiometric inhibitor Sic1 [24] as well as the anaphase-
promoting complex (APC) component Cdh1, which targets
the cyclin-component of Clb2 (and also of Clb1) for degra-
dation. We refer to these double-negative feedback loops as
the ‘Clb-switch’. These network motifs interact with each
other, the Cln-switch activating the Clb-switch and the
Clb-switch inhibiting the Cln-switch in a negative feedback
loop [17]. For a detailed description of the considerably
more complex full model network, the model assumptions,
the parameter values, etc., refer to the original publication
of Chen’s model [19] or the model webpage (the URL is
given in §5.4).

rsob.royalsocietypublishing.orgOpen
Biol1:110009
3
on July 28, 2018http://rsob.royalsocietypublishing.org/Downloaded from
3.1. Chen’s model captures novel experimental resultsOur first goal was to test whether Chen’s model in its original
form and parametrization could explain novel experimental
findings that were unknown at the time of model conception.
In a series of elegant experiments, Charvin et al. [13] (hereafter
‘Charvin’s experiments’) have recently provided good evidence
for a bistable Cln-switch, which had long been postulated on
theoretical grounds [25], but not been demonstrated exper-
imentally. Briefly, Cln1 and Cln2 were isolated from other
regulatory interactions in the cell cycle machinery using a
strain with the genetic background cln3D bck2D GAL1-SIC1-4A MET3-CLN2. This strain lacks both Cln3 and Bck2, contains
a galactose-inducible version of the B-cyclin:Cdk1 inhibitor Sic1
(Sic1-4A), which is non-phosphorylatable and thus constitu-
tively active, and a methionine-repressible CLN2. In this
strain, the Clb2 switch is kept in the OFF state by GAL-SIC1-4A. To determine whether transiently expressed Cln2 would
be sufficient to turn the Cln-switch ON, cells are initially
arrested in early G1 in the presence of galactose and methionine
(no Clb2 activity and no exogenous Cln2 expressed). Transient
methionine removal causes a short pulse of expression of
exogenous Cln2, which activates SBF. SBF then induces the
expression of endogenous CLN1 and CLN2, which are able to
sustain their own expression through SBF. The experiment
demonstrates an irreversible transition brought about by a tran-
sient signal. (In wild-type cells, the activity of Cln2 would be
turned off once B-type cyclins are activated, which in the exper-
imental strain is prevented by Sic1-4A expression, effectively
isolating Cln2 from Clb2.)
To test whether Chen’s model captures this behaviour, we
simulated the experiment (compare the model simulation in
figure 2a with fig. 4j in [13], which shows the accumulation
of a fluorescent reporter protein driven by the CLN2 promo-
ter in cln3D bck2D GAL1-SIC1-4A MET3-CLN2). The model
simulation was carried out with Chen’s standard parameter
set, except for parameters that had to be zeroed to account
for the specific genetic background of the experimental
strain. At simulation time zero, exogenous CLN2 is zero
and the expression of endogenous CLN2 and SBF activity is
at background levels. This corresponds to methionine repres-
sion of exogenous CLN2. In full agreement with the
experiment, a simulated transient expression of ectopic
CLN2 for 15 min starting at time zero is sufficient to activate
SBF and to trigger the sustained expression of the endogen-
ous CLN2 gene. Thus, a simulation using Chen’s original
model ‘predicts’ that a short pulse of CLN2 expression
would be sufficient to irreversibly engage the Cln-switch in
the described genetic background.
3.2. The Cln-switch contributes to the irreversibility ofSTART-transition also in wild-type cells
In the wild-type situation, the Cln-switch is not isolated as
in Charvin’s experiments, but embedded into the global cell
cycle control network. It is thus difficult to attribute a specific
role to any one network motif, and we argue that the role
of the Cln-switch in the START transition needs to be under-
stood in the context of the global control system. In particular,
Clb2 activation by Cln2 is expected to negatively influence
the Cln-switch in the wild-type, but not in the mutant
strain used in the experiments. Chen’s model is a validated
and exceptionally well-tested tool, which, owing to its com-
prehensiveness, allowed us to simulate the behaviour of
wild-type cells, in which the Cln-switch is embedded
within the global cell cycle control system. In a wild-type
background, Clb2 activity is inhibited by Sic1 early in G1.
Late in G1, high Cln2 activity releases this inhibition, and
Clb2 auto-activation causes the Clb-switch to fire. Figure 2bshows a time course simulation of a cycling wild-type cell.
In contrast to the mutant strain used in Charvin’s exper-
iments, the wild-type shows typical oscillations of Cln2 and
Clb2 as a function of time. The temporal order of cell cycle
progression arises from Cln2-inducing Clb2 activity, and
Clb2-repressing Cln2 activity. At later stages in the cell
cycle, Clb2 activity decreases mainly owing to Clb1/2
degradation by APC [26], which is initiated by Cdc20 and
sustained by Cdh1. This eventually resets the system to low
cyclin/Cdk1 activity.
To obtain an understanding of the relationship between
the Cln-switch and the Clb-switch, we performed bifurcation
analyses. To illustrate the results, we overlay two one-par-
ameter bifurcation diagrams to obtain a pseudo-phaseplane:
Because the system has many more than two state variables,
a phase-plane analysis is not possible. We can, however, ima-
gine what a phaseplane would look like, if we fix all but two
state variables to their respective steady-state values. To do
this, we first plot a bifurcation diagram using Clb2 as the
only state variable, with Cln2 as a bifurcation parameter
(figure 2c, black curve). All other state variables in the control
system are at steady state (i.e. their differential equations are
set to zero). Similarly, we can plot a one-parameter bifur-
cation diagram using Cln2 as a state variable and Clb2 as a
bifurcation parameter (figure 2c, red curve). In this way, we
obtain two pseudo-nullclines. Although the dynamics of
the system are only approximated by the pseudo-nullclines,
the steady states at the intersections of the Cln2 and Clb2
pseudo-nullclines represent the true steady states of the con-
trol system (figure 2c, green circles).
Because both Clb2 and Cln2 are bistable variables, both
curves are S-shaped and have two stable branches connected
by one unstable branch. The system has three steady states:
one stable and two unstable (figure 2c, solid and faint
green circles, respectively). A cycling cell follows the blue tra-
jectory. The cell cycle starts close to the origin, where all
cyclins are low (early G1 phase). If the cell has become big
enough, Cln3 and Bck2 start to activate Cln2, and the
system moves to the right. Once the Cln-switch engages
and Cln2 activates itself through SBF, the trajectory shoots
over a threshold determined by the Clb2 bifurcation curve,
towards very high Cln2 activity. This, however, induces
Clb2 activity through Cln2-dependent inhibition of Sic1 and
Cdh1, which allows Clb2 to increase, causing the trajectory
to turn upwards, and, because Clb2 inhibits SBF (and thus
Cln2), also to the left. The trajectory is attracted by the only
stable steady state, which is found at high Clb2 and low
Cln2 activity (Clb-switch ON, Cln-switch OFF). In wild-
type cells, this stable steady state is, however, never reached,
because later events in the cell cycle, such as degradation of
Clbs by the APC, cause the trajectory to bend down (not
shown) and to eventually return to its origin. The cell cycle
is completed.
In the wild-type situation, the Cln2 bifurcation curve crosses
the abscissa only once, namely at high Cln2 (figure 2d, red
curve; same as figure 2c, red curve). Thus, in the absence of

Clb
2
Cln20 1 2 3
0.1
0.2
0.3
0
wild-type
Δbck2Δcln3
time (min)time (min)0 50 100 150 20020 40 60 80 1000
1
0
2
3
4
total Cln2
endogenous Cln2
SBF
ectopic Cln2
Cln20 1 2 3
2
1
Clb
2
Cln2
Clb2
3
2
1
0
Cln2
Clb2
activ
ity
activ
ity
(a) (b)
(c) (d)
0
Figure 2. Dynamical systems analysis of START. (a) Time course simulation of Charvin’s experiment. Fifteen minutes of expression of ectopic Cln2 in a cln3D bck2DGAL1-SIC1-4A MET3-CLN2 background is sufficient to activate SBF, which induces self-sustained expression of endogenous Cln2; compare fig. 4j in [13]. BecauseClb2 is kept inactive by Sic1-4A in this particular strain, Cln2 remains high. (b) Time course simulation of a wild-type cell. Cln2 expression precedes Clb2 expression.This temporal order is a consequence of Cln2-activating Clb2, and Clb2-inhibiting Cln2. Completion of the cell cycle is achieved by downregulation of Clb2 atlater stages of the cell cycle, which resets the system to its original state. (c) Bifurcation analysis of a wild-type cell. Two one-parameter bifurcation curves areplotted on the same diagram ( pseudo-phaseplane). Both the Cln2 bifurcation curve (red, Cln-switch) and the Clb2 bifurcation curve (black, Clb-switch) are bistable.The Clb-switch engages at a threshold concentration of Cln2 and is self-sustaining. This transition is irreversible (black curve). Cln2 activity (red curve) is inhibited byClb2 activity and is high only if Clb2 is low. The time trajectory of the system (blue curve) starts from G1 with low levels of both Cln2 and Clb2 activity; thesystem moves in an anti-clockwise direction. As the Cln-switch engages, the trajectory shoots towards the stable upper branch of the Cln2 curve. High Cln2 activitytriggers firing of the Clb-switch, which feeds back negatively to repress Cln2 activity, and the trajectory moves to the upper left towards the system’s only stablesteady state (green circle). This steady state is not reached, however, because processes at later stages of the cell cycle, such as Cdc20 activation, inactivate Clb2,which would cause the trajectory to move down to eventually reach its origin (not shown). (d ) Bifurcation analysis. In cln3D bck2D cells (green curve), thesystem is bistable even at zero Clb2 activity. This is the situation in Charvin’s experiment. In wild-type cells, by contrast (red curve, identical to the red curve in (c)),a finite Clb2 activity is required to allow bistability. If such activity is absent, the steady state corresponding to low Cln2 activity is lost. The Cln-switch is stuckin the ON state.
rsob.royalsocietypublishing.orgOpen
Biol1:110009
4
on July 28, 2018http://rsob.royalsocietypublishing.org/Downloaded from
any Clb2 activity, as would be the case in Sic1-4A cells, Cln2 is
high and mono-stable. In Charvin’s experiment, which uses
Sic1-4A cells, the Cln2 switch is kept bistable only by the
additional lack of Cln3 and Bck2: in cln3Dbck2D, the Cln2 bifur-
cation curve is shifted downwards, because Cln3 and Bck2
cannot support the ON state of the Cln-switch. The saddle
nodes of the Cln2 nullcline are thus shifted to lower values of
Clb2 and Cln2 can be bistable even in the absence of Clb2
(figure 2d, green curve). Thus, Charvin’s experimental evidence
suggests that, if experimentally isolated from other events, the
Cln-switch is the predominant contributor to the irreversible
START transition. Our theoretical analysis of START, per-
formed in the context of a full cell cycle control system rather
than an isolated switch, confirms the importance of the Cln-
switch for the START transition, but additionally highlights
how the function of the Cln-switch depends on the state of
the Clb-switch. Our findings suggest that a robust START tran-
sition is an emergent property of several interacting network
motifs rather than the consequence of any one such motif.
3.3. Commitment is initiated by the interaction of twobistable switches
Having analysed the START transition within the compre-
hensive framework of Chen’s model, we focused our
attention on a related set of problems, namely how cell
cycle commitment (i.e. pheromone resistance) is initiated
and maintained once START has been passed. The main
link between pheromone signalling and the cell cycle
engine is Far1 [7], which interacts with the cell cycle control-
ler Cln1/2:Cdk1 in a double-negative feedback loop. Far1

Ste5 Ste5
Ste5P P P
PP PPP Ste5
P P P
PP PPP
Cln2
pheromone
Cln2
Far1
Far1Cln2
(a) (b)
Cln3 SBF Cln2
Clb2
Cln-switch
Sic1
Cdh1Cdc20
Far1
Clb-switch
Far1-switch
masspheromone
Figure 3. Pheromone signalling and its interaction with the cell cycle engine. Cln3, Cln2 and Clb2 denote the corresponding Cyclin:Cdk1 complexes. (a) Pheromonesignalling. The scaffolding protein Ste5 is recruited to the plasma membrane in response to pheromone and activated. Only Ste5 that is not phosphorylated by Cln2,however, is able to act as a scaffold to promote the activation of Far1. Cln2 phosphorylates Far1 to promote its degradation, while Far1 inhibits Cln2 activity. (b) TheFar1-switch. Mutual antagonism between Far1 and Cln2 is predicted to generate an additional bistable switch (Far1-switch). The Cln-, Clb- and Far1-switches andtheir interactions are shown.
rsob.royalsocietypublishing.orgOpen
Biol1:110009
5
on July 28, 2018http://rsob.royalsocietypublishing.org/Downloaded from
inhibits Cln1/2/3:Cdk1 complexes [21,27], while Cln1/2:Cdk1
complexes inhibit Far1 by enhancing its degradation [7,12], and
by preventing both Far1 synthesis and activation (figure 3a)
through phosphorylation and inhibition of the upstream scaf-
folding protein Ste5 [11].
On the basis of the well-studied mutual antagonism
between Cln2 and Far1, we propose the existence of
an additional bistable switch, which we refer to as the
Far1-switch. The differential response of pre-START and
post-START cells to pheromone suggests that Far1 interacts
differentially with the cell cycle engine at different stages of
the cell cycle. We aimed at explaining these phenomena in
terms of the Cln-switch, the Clb-switch and the proposed
Far1-switch (figure 3b).
After incorporation of Far1 into Chen’s model (for details,
see §5.6 and table 1), we first tested how the pseudo-phase-
plane shown in figure 2c would change in the presence of
pheromone (figure 4a). Because Far1 inhibits Cln2, the Cln-
switch is impaired and it is easier for Clb2 to turn it OFF.
The saddle nodes of the Cln2 bifurcation curve are thus
shifted to lower Clb2 values by pheromone, whereas the
Clb2 bifurcation curve is unaffected. As a consequence, a
stable steady state emerges at low Cln2/Clb2 levels (compare
figure 4a with figure 2c). In cells with low Cln2 levels, the
system will be attracted by this steady state, which corre-
sponds to the experimentally observed G1 arrest of pre-
START cells with low Cln2 and low Clb2. A cell with suffi-
ciently high Cln2 activity, by contrast (i.e. a post-START
cell), will be initially attracted by the stable branch of the
Cln2 bifurcation curve found at high Cln2 levels, following
a trajectory similar to the one shown in figure 2c. Despite
the presence of pheromone, such a cell is committed to
finish the on-going cycle to eventually settle in the only
steady state—it will arrest in G1 of the following cycle.
In summary, our dynamical systems analysis of the inter-
action of the Cln-switch and the Far1-switch visualizes how
pheromone blocks the START transition, and why cells are
resistant when Cln2 activity is high. One apparent problem
remains, however—at later stages of the cell cycle, Cln2
is repressed by negative feedback from the engaging
Clb-switch, which should restore Far1 activity. How is
commitment to cell division maintained at this later stage?
3.4. Distinct modes of resistance to pheromone sustaincommitment
In the framework of Chen’s model, the answer is simple:
Cln2 causes the Clb-switch to fire. Because Clb2 self-activates,
this process is irreversible; Cln2 activity is no longer requi-
red for Clb2 activity. Thus, cell cycle progression becomes
independent of Cln2 and is driven by Clbs only. The Clb
self-activation seems strong enough to maintain cell cycle
progression even in the presence of pheromone signalling
[28]. Time course simulations using Chen’s modified model
reveal a three-stage response to pheromone, depending on
the cell cycle stage. If pheromone is added prior to the
START transition when Cln2 is still low, Far1 becomes acti-
vated immediately upon pheromone addition and prevents
the Cln-switch from firing. The cell stably arrests in G1
(figure 4b). If pheromone is added after START, however,
our simulations reveal two time windows with qualitatively
different responses, depending on the post-START cell cycle
stage: In the first phase, when Cln2 activity is still high
(figure 4c), addition of pheromone has no immediate effect
on Far1, because Cln2 efficiently blocks Far1 activation. The
cell is resistant to pheromone and remains committed to
cell division. In the second, later phase, however, the Clb-
switch has engaged and has inhibited Cln2 activity, which
is now low. Pheromone addition at this late stage thus acti-
vates Far1 immediately (figure 4d ), similar to the situation
in pre-START cells, which also have low Cln2 activity. How-
ever, because cell cycle progression at this stage is no longer
driven by Cln2, but by Clb2, which is not inhibited by Far1,
the cell proceeds and finishes its cycle to finally arrest in the
G1 phase of the next cycle.
time (min)50 100 150 200
time (min)0 50 100 150 200
time (min)0 25 50 75 100 125 150
(a) (b)
(c) (d)
0
3
2
1
conc
entr
atio
n or
act
ivity
0
3
2
1
0
conc
entr
atio
n or
act
ivity
0
2
1C
lb2
0
3
2
1co
ncen
trat
ion
or a
ctiv
ity
0 1 2 3
Cln2
Clb2
pheromone
pher.pher.
Far1
Far1 Far1
Cln2
Cln2 Cln2
Clb2
Clb2 Clb2
Cln2
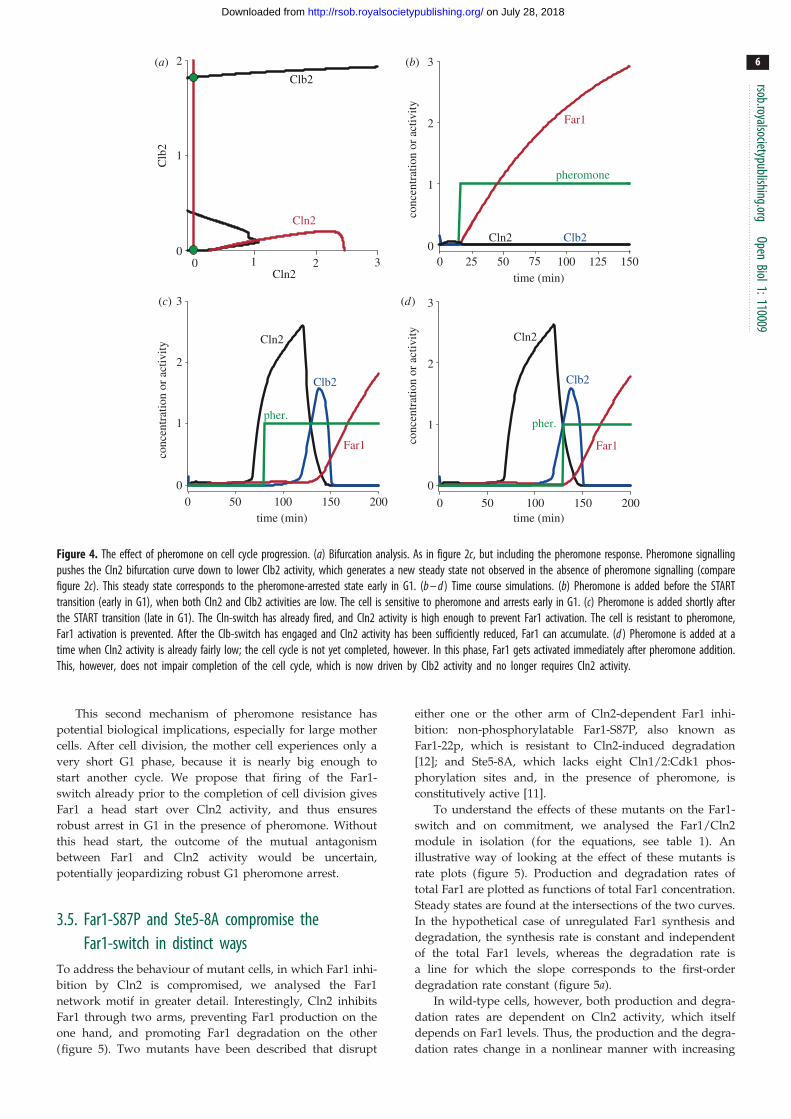
Figure 4. The effect of pheromone on cell cycle progression. (a) Bifurcation analysis. As in figure 2c, but including the pheromone response. Pheromone signallingpushes the Cln2 bifurcation curve down to lower Clb2 activity, which generates a new steady state not observed in the absence of pheromone signalling (comparefigure 2c). This steady state corresponds to the pheromone-arrested state early in G1. (b – d ) Time course simulations. (b) Pheromone is added before the STARTtransition (early in G1), when both Cln2 and Clb2 activities are low. The cell is sensitive to pheromone and arrests early in G1. (c) Pheromone is added shortly afterthe START transition (late in G1). The Cln-switch has already fired, and Cln2 activity is high enough to prevent Far1 activation. The cell is resistant to pheromone,Far1 activation is prevented. After the Clb-switch has engaged and Cln2 activity has been sufficiently reduced, Far1 can accumulate. (d ) Pheromone is added at atime when Cln2 activity is already fairly low; the cell cycle is not yet completed, however. In this phase, Far1 gets activated immediately after pheromone addition.This, however, does not impair completion of the cell cycle, which is now driven by Clb2 activity and no longer requires Cln2 activity.
rsob.royalsocietypublishing.orgOpen
Biol1:110009
6
on July 28, 2018http://rsob.royalsocietypublishing.org/Downloaded from
This second mechanism of pheromone resistance has
potential biological implications, especially for large mother
cells. After cell division, the mother cell experiences only a
very short G1 phase, because it is nearly big enough to
start another cycle. We propose that firing of the Far1-
switch already prior to the completion of cell division gives
Far1 a head start over Cln2 activity, and thus ensures
robust arrest in G1 in the presence of pheromone. Without
this head start, the outcome of the mutual antagonism
between Far1 and Cln2 activity would be uncertain,
potentially jeopardizing robust G1 pheromone arrest.
3.5. Far1-S87P and Ste5-8A compromise theFar1-switch in distinct ways
To address the behaviour of mutant cells, in which Far1 inhi-
bition by Cln2 is compromised, we analysed the Far1
network motif in greater detail. Interestingly, Cln2 inhibits
Far1 through two arms, preventing Far1 production on the
one hand, and promoting Far1 degradation on the other
(figure 5). Two mutants have been described that disrupt
either one or the other arm of Cln2-dependent Far1 inhi-
bition: non-phosphorylatable Far1-S87P, also known as
Far1-22p, which is resistant to Cln2-induced degradation
[12]; and Ste5-8A, which lacks eight Cln1/2:Cdk1 phos-
phorylation sites and, in the presence of pheromone, is
constitutively active [11].
To understand the effects of these mutants on the Far1-
switch and on commitment, we analysed the Far1/Cln2
module in isolation (for the equations, see table 1). An
illustrative way of looking at the effect of these mutants is
rate plots (figure 5). Production and degradation rates of
total Far1 are plotted as functions of total Far1 concentration.
Steady states are found at the intersections of the two curves.
In the hypothetical case of unregulated Far1 synthesis and
degradation, the synthesis rate is constant and independent
of the total Far1 levels, whereas the degradation rate is
a line for which the slope corresponds to the first-order
degradation rate constant (figure 5a).
In wild-type cells, however, both production and degra-
dation rates are dependent on Cln2 activity, which itself
depends on Far1 levels. Thus, the production and the degra-
dation rates change in a nonlinear manner with increasing

(b)
Far1
Ste5
Cln2
0 1 2 3 4 5
Far1
Ste5-8ACln2
rate
0
0
1 2 3 4 5
0.02
0.04
0.06
Ste5
Cln2
Far1S87P
total Far1 (Far1 + Cln2:Far1) total Far1 (Far1 + Cln2:Far1)
rate
(a)
(d)(c)
0.02
0.04
0.06
Far1
Figure 5. Rate plots suggest that the bistability of the Far1-switch is less robust in two mutants. All simulations were done at constant Cln2 levels and in thepresence of pheromone. For parameter values, see table 1. The Far1 production rate (solid lines) and the Far1 degradation rate (dashed lines) are plotted asfunctions of total Far1 concentration. The network motifs corresponding to the plots are shown in insets. (a) No feedback regulation. In the hypothetical case ofunregulated Far1 production and degradation, the Far1 production rate is a horizontal line (constant, zero-order synthesis). The degradation rate is proportional tothe total concentration of Far1 and its slope represents the degradation rate constant (first-order degradation kinetics). (b) Wild-type with two double-negativefeedbacks. Cln2 exerts dual control by repressing Far1 activation and promoting Far1 degradation, creating two double-negative feedback loops. Because of theshapes of the curves, production and degradation rates are highly likely to intersect three times for a wide range of parameters to create two stable (solid greencircles) and one unstable (faint green circle) steady states. This suggests robust bistability in the wild-type case. (c) Far1-S87P with one double-negative feedbackloop. The Far1-S87P degradation rate is not enhanced by Cln2 and is thus directly proportional to the total amount of Far1-S87P (blue-dashed line). The Far1-S87Pproduction rate is the same as for the wild-type. The shapes of the curves in principle still allow three intersections, albeit only in a restricted range of parameters.For most parameter sets, the bistability is lost, as is exemplified here. This finding suggests less robust bistability in the Far1-S87P mutant when compared withwild-type. (d) Ste5-8A with one double-negative feedback loop. In Ste5-8A cells, Far1 production rate is no longer repressed by Cln2 and is constant. The Far1degradation rate is as in the wild-type. Similar to Far1-S87P, bistability is still possible, but predicted to be less robust.
rsob.royalsocietypublishing.orgOpen
Biol1:110009
7
on July 28, 2018http://rsob.royalsocietypublishing.org/Downloaded from
concentrations of Far1 (figure 5b). If total Far1 is low, the Far1
production rate is small (figure 5b, solid line), because Cln2 is
active, and phosphorylates and inactivates Ste5, which is
required for pheromone-induced Far1 production. However,
if total Far1 exceeds the level of total Clns, Clns activity
approaches zero, and most Ste5 is in the unphosphorylated,
active form. The Far1 production rate becomes maximal.
The Far1 degradation rate also shows a nonlinear response
with respect to total Far1 (figure 5b, dashed line): if total
Far1 is smaller than Cln2, Cln2 is able to phosphorylate
Far1 and accelerate Far1 degradation. If total Far1 exceeds
total Cln2, Cln2 activity is negligible and Far1 is degraded
close to the basal first-order rate, directly proportionally to
its concentration. The curves for Far1 production rate and
degradation rate intersect at three points, creating two
stable (solid green circles) and one unstable (faint green
circle) steady states. Thus, Far1 is bistable and, depending
on the state of the system, either high or low. The rate plot
suggests robust bistability in the wild-type case: the curves
can change their positions substantially without losing any
of the steady states. In the mutant cases, however, either
one or the other rate curve becomes linear: the production
rate in the Ste5-8A mutant (figure 5c), or the degradation
rate in Far1-S87P cells (figure 5d ). Three intersections of the
curves (and thus bistability) are still possible in both mutants;
however, the regions in parameter space that yield bistability
are expected to be more restricted than in the wild-type. From
this simple graphical analysis, we hypothesize that the see-
mingly redundant regulation of Far1 by Cln2 (suppressing
Far1 synthesis and enhancing Far1 degradation) contributes
to robust bistability and that disruption of either arm of
this regulation will compromise this robustness.
To corroborate our hypothesis, we first performed a
one-parameter bifurcation analysis (figure 6a). Indeed, the bi-
stable regime is largest for wild-type cells, while both
mutants decrease the bistable regime. If we define as ‘com-
mitment point’ the Cln2 activity at which the cell becomes
resistant to pheromone, the commitment points of both

total Cln2 (Cln2 + Cln2:Far1) total Cln2 (Cln2 + Cln2:Far1)total Cln2 (Cln2 + Cln2:Far1)
wild-typeSte5-8AFar1-S87P
tota
l Far
1
(a)
rate
of
Cln
2-de
p. F
ar1
degr
adat
ion
rate
of
Cln
2 de
p. S
te5
phos
pho.
wild-type
Ste5-8A
(b) (c)
1 2 3 4 50
0.2
0.4
0.6
0.8
1.0
1 2 3 4 50
0.2
0.4
0.6
0.8
1.0
0 1 2 3 4 5
1
2
3
4
5
Far1-S87P
wild-type
Figure 6. The commitment point is predicted to be shifted more markedly in Far1-S87P than Ste5-8A cells. (a) One-parameter bifurcation diagram. Comparison ofthe bistability regimes of the Far1-switch in the wild-type case (black curve) with Ste5-8A (red curve) and Far1-S87P (blue curve). In the wild-type, the bistableregime extends over a wide range of Cln2 levels. The commitment point (defined as the Cln2 activity at which the cell becomes resistant to pheromone; dashedvertical lines) is low. In the case of the mutants, the bistable regime is significantly reduced, and the commitment points are shifted to higher Cln2, more so in thecase of Far1-S87P than in the case of Ste5-8A. (b,c) The difference in commitment point shift between Far1-S87P and Ste5-8A is a robust system property. (b) Two-parameter bifurcation diagram for Ste5-8A. The control parameters are the total amounts of Cln2, and the rate constant of the Cln2-dependent Far1 degradation,kdfar1,pp. High values of kdfar1,pp indicate that Cln2-dependent Far1 degradation is fast. In this case, Ste5-8A and wild-type are very similar, because sufficient mutualinhibition between Cln2 and Far1 arises by Cln2-dependent Far1 degradation alone. At low values of kdfar1,pp, however, higher levels of Clns are required to enter thebistable regime in the Ste5-8A mutant than in the wild-type. (c) Two-parameter bifurcation diagram for Far1-S87P. Here, the second control parameter is the rateconstant of the Cln2-dependent Ste5 phosphorylation, kp5n. Comparing the wild-type case with the Far1-S87P mutation yields a similar picture as in (b); however,the reduction of the bistable regime by the Far1-S87P mutation is more pronounced, suggesting higher importance of this arm for bistability.
rsob.royalsocietypublishing.orgOpen
Biol1:110009
8
on July 28, 2018http://rsob.royalsocietypublishing.org/Downloaded from
mutants are predicted to be shifted to higher Cln2 activity
compared with the wild-type. Moreover, our results suggest
that this effect is more pronounced in Far1-S87P cells than
in Ste5-8A cells: Far1-S87P cells are expected to require
higher Cln2 activity to acquire pheromone resistance and to
commit to division than Ste5-8A cells. Two-parameter bifur-
cation diagrams (figure 6b,c) reveal that these effects are
robust in terms of parameter values and are thus an emergent
property of the specific wiring of the network. Importantly,
this finding is consistent with recently published data,
which defined the commitment point in terms of the degree
of Whi5 nuclear export [14]. In qualitative agreement with
our generic results, these authors found a shift of the commit-
ment point in Far1-S87P cells, but not in Ste5-8A cells, a
situation that happens in our model when Cln2-dependent
Far1 degradation is fast (figure 6b,c). Thus, the experimen-
tally observed behaviour is a particular realization of our
more general description, and is entirely consistent with
our model.
Unexpectedly, in response to pheromone, a significant
proportion of Ste5-8A cells arrest post-START with 2N sets
of chromosomes in a Far1-independent manner [11]. The
arrest at this second block point is reminiscent of the phero-
mone arrest of cells deficient in Clns and overexpressing
Clb5 [29]. We propose that the puzzling phenotype of Ste5-
8A cells is caused by pheromone-dependent reduction of
Clb2 activity. In terms of a dynamical systems analysis, com-
promised Clb2 activity by Ste5-8A is predicted to change
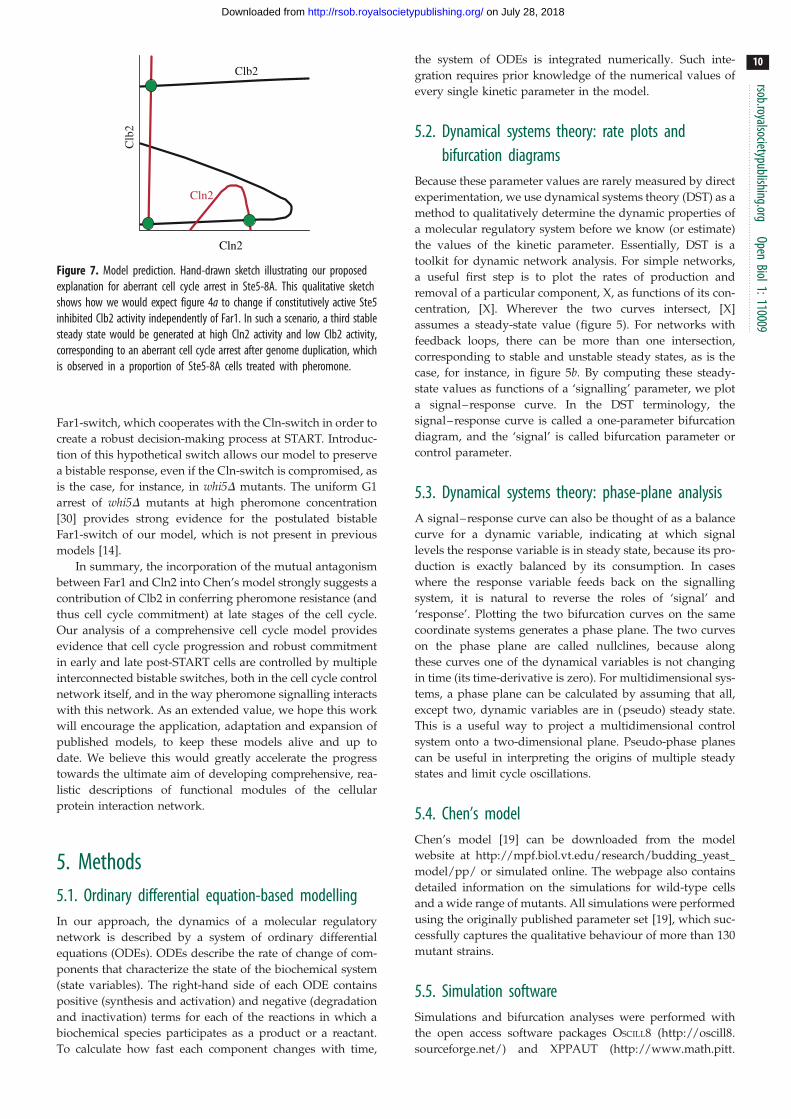
the picture shown in figure 4a as sketched in figure 7. Clb2
inhibition in response to pheromone makes firing of the
Clb-switch more difficult, and its OFF state would extend
to higher Cln-levels. The Cln-switch, in turn, now lacking
the negative feedback from the Clb-switch, would be more
likely to reside in the ON state. In this way, an additional
stable steady state is created at high Cln2 and low Clb2
activity, which might explain the arrest after genome
duplication observed in a sub-population of Ste5-8A cells in
response to pheromone. Importantly, the original stable
steady state that corresponds to a G1 arrest is still present
in these cells, which would explain why some cells arrest in
G1 and some cells arrest in later stages of the cell cycle.
In summary, we make the testable prediction that the pro-
portion of Ste5-8A cells that shows an abnormal arrest in
response to pheromone has high Cln2 activity, but low
Clb2 activity.
4. DiscussionMathematical models of biological systems often have a
limited scope, because the datasets required to sufficiently
constrain larger models are not available at the time of
model conception. Despite its potential to overcome this
problem, the frequently cited ‘virtuous cycle’ between exper-
imentation and modelling usually ceases once a model is
published, and only a few models seem to benefit from
being tested against new experimental datasets as new infor-
mation becomes available. This is surprising, given the broad
consensus that models should be continuously challenged
with novel datasets and updated accordingly in order to
grow both in scope and in accuracy. Here, we use Chen’s
model [19] to showcase that a published model can indeed
be used to analyse novel experimental findings and to gain
insight into problems that were not originally considered
during model conception. As an additional benefit of this
approach, the mathematical model itself is increased in
scope, applicability and accuracy. Only by continuous devel-
opment can models remain up-to-date tools to further our
understanding of biological systems.
Charvin et al. [13] have shown experimentally that transient
expression of exogenous Cln2 triggers sustained expression
of endogenous Cln2. When queried accordingly, Chen’s
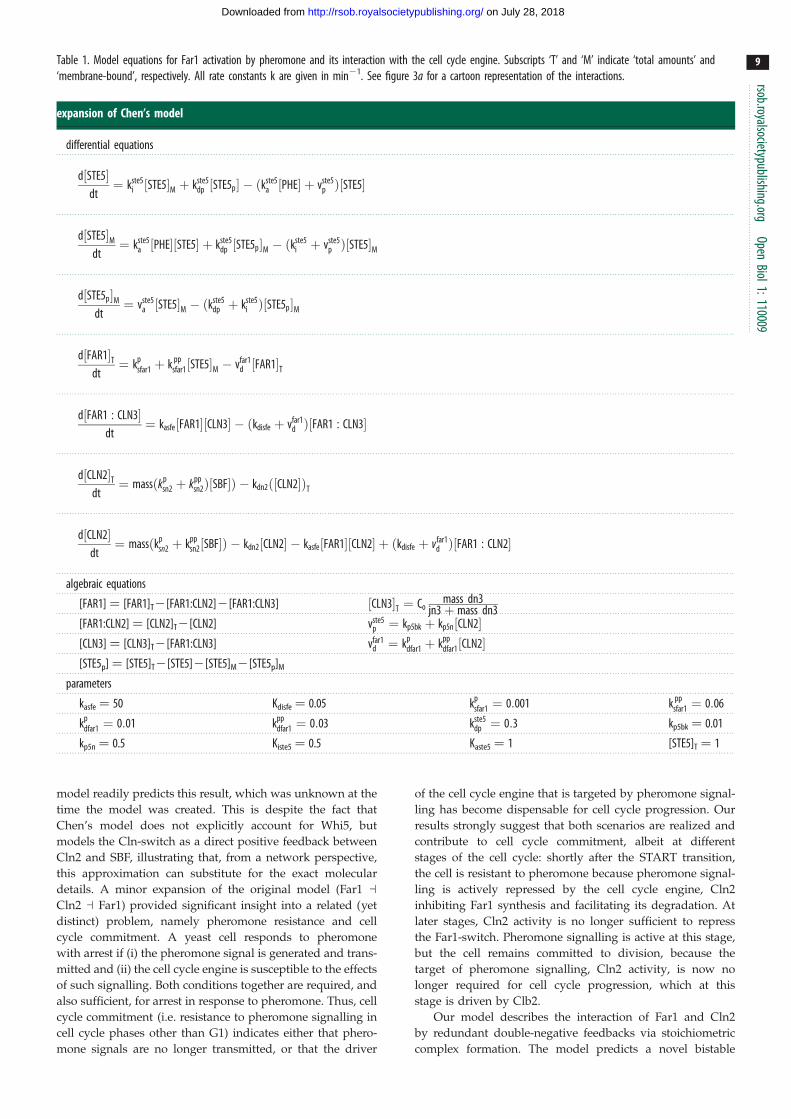
Table 1. Model equations for Far1 activation by pheromone and its interaction with the cell cycle engine. Subscripts ‘T’ and ‘M’ indicate ‘total amounts’ and‘membrane-bound’, respectively. All rate constants k are given in min21. See figure 3a for a cartoon representation of the interactions.
expansion of Chen’s model
differential equations
d½STE5�dt¼ kste5
i ½STE5�M þ kste5dp ½STE5p� � ðkste5
a ½PHE� þ vste5p Þ½STE5�
d½STE5�Mdt
¼ kste5a ½PHE�½STE5� þ kste5
dp ½STE5p�M � ðkste5i þ vste5
p Þ½STE5�M
d½STE5p�Mdt
¼ vste5a ½STE5�M � ðkste5
dp þ kste5i Þ½STE5p�M
d½FAR1�Tdt¼ kp
sfar1 þ k ppsfar1½STE5�M � vfar1
d ½FAR1�T
d½FAR1 : CLN3�dt
¼ kasfe½FAR1�½CLN3� � ðkdisfe þ vfar1d Þ½FAR1 : CLN3�
d½CLN2�Tdt¼ massðkp
sn2 þ kppsn2Þ½SBF�Þ � kdn2ð½CLN2�ÞT
d½CLN2�dt¼ massðkp
sn2 þ kppsn2½SBF�Þ � kdn2½CLN2� � kasfe½FAR1�½CLN2� þ ðkdisfe þ vfar1
d Þ½FAR1 : CLN2�
algebraic equations
[FAR1] ¼ [FAR1]T2[FAR1:CLN2]2[FAR1:CLN3] ½CLN3�T ¼ Comass dn3
jn3þ mass dn3[FAR1:CLN2] ¼ [CLN2]T2[CLN2] vste5
p ¼ kp5bk þ kp5n½CLN2�[CLN3] ¼ [CLN3]T2[FAR1:CLN3] vfar1
d ¼ kpdfar1 þ kpp
dfar1½CLN2�[STE5p] ¼ [STE5]T2[STE5]2[STE5]M2[STE5p]M
parameters
kasfe ¼ 50 Kdisfe ¼ 0.05 kpsfar1 ¼ 0:001 k pp
sfar1 ¼ 0:06
kpdfar1 ¼ 0:01 kpp
dfar1 ¼ 0:03 kste5dp ¼ 0:3 kp5bk ¼ 0.01
kp5n ¼ 0.5 Kiste5 ¼ 0.5 Kaste5 ¼ 1 [STE5]T ¼ 1
rsob.royalsocietypublishing.orgOpen
Biol1:110009
9
on July 28, 2018http://rsob.royalsocietypublishing.org/Downloaded from
model readily predicts this result, which was unknown at the
time the model was created. This is despite the fact that
Chen’s model does not explicitly account for Whi5, but
models the Cln-switch as a direct positive feedback between
Cln2 and SBF, illustrating that, from a network perspective,
this approximation can substitute for the exact molecular
details. A minor expansion of the original model (Far1 sCln2 s Far1) provided significant insight into a related (yet
distinct) problem, namely pheromone resistance and cell
cycle commitment. A yeast cell responds to pheromone
with arrest if (i) the pheromone signal is generated and trans-
mitted and (ii) the cell cycle engine is susceptible to the effects
of such signalling. Both conditions together are required, and
also sufficient, for arrest in response to pheromone. Thus, cell
cycle commitment (i.e. resistance to pheromone signalling in
cell cycle phases other than G1) indicates either that phero-
mone signals are no longer transmitted, or that the driver
of the cell cycle engine that is targeted by pheromone signal-
ling has become dispensable for cell cycle progression. Our
results strongly suggest that both scenarios are realized and
contribute to cell cycle commitment, albeit at different
stages of the cell cycle: shortly after the START transition,
the cell is resistant to pheromone because pheromone signal-
ling is actively repressed by the cell cycle engine, Cln2
inhibiting Far1 synthesis and facilitating its degradation. At
later stages, Cln2 activity is no longer sufficient to repress
the Far1-switch. Pheromone signalling is active at this stage,
but the cell remains committed to division, because the
target of pheromone signalling, Cln2 activity, is now no
longer required for cell cycle progression, which at this
stage is driven by Clb2.
Our model describes the interaction of Far1 and Cln2
by redundant double-negative feedbacks via stoichiometric
complex formation. The model predicts a novel bistable
Clb
2
Cln2
Clb2
Cln2
Figure 7. Model prediction. Hand-drawn sketch illustrating our proposedexplanation for aberrant cell cycle arrest in Ste5-8A. This qualitative sketchshows how we would expect figure 4a to change if constitutively active Ste5inhibited Clb2 activity independently of Far1. In such a scenario, a third stablesteady state would be generated at high Cln2 activity and low Clb2 activity,corresponding to an aberrant cell cycle arrest after genome duplication, whichis observed in a proportion of Ste5-8A cells treated with pheromone.
rsob.royalsocietypublishing.orgOpen
Biol1:110009
10
on July 28, 2018http://rsob.royalsocietypublishing.org/Downloaded from
Far1-switch, which cooperates with the Cln-switch in order to
create a robust decision-making process at START. Introduc-
tion of this hypothetical switch allows our model to preserve
a bistable response, even if the Cln-switch is compromised, as
is the case, for instance, in whi5D mutants. The uniform G1
arrest of whi5D mutants at high pheromone concentration
[30] provides strong evidence for the postulated bistable
Far1-switch of our model, which is not present in previous
models [14].
In summary, the incorporation of the mutual antagonism
between Far1 and Cln2 into Chen’s model strongly suggests a
contribution of Clb2 in conferring pheromone resistance (and
thus cell cycle commitment) at late stages of the cell cycle.
Our analysis of a comprehensive cell cycle model provides
evidence that cell cycle progression and robust commitment
in early and late post-START cells are controlled by multiple
interconnected bistable switches, both in the cell cycle control
network itself, and in the way pheromone signalling interacts
with this network. As an extended value, we hope this work
will encourage the application, adaptation and expansion of
published models, to keep these models alive and up to
date. We believe this would greatly accelerate the progress
towards the ultimate aim of developing comprehensive, rea-
listic descriptions of functional modules of the cellular
protein interaction network.
5. Methods5.1. Ordinary differential equation-based modellingIn our approach, the dynamics of a molecular regulatory
network is described by a system of ordinary differential
equations (ODEs). ODEs describe the rate of change of com-
ponents that characterize the state of the biochemical system
(state variables). The right-hand side of each ODE contains
positive (synthesis and activation) and negative (degradation
and inactivation) terms for each of the reactions in which a
biochemical species participates as a product or a reactant.
To calculate how fast each component changes with time,
the system of ODEs is integrated numerically. Such inte-
gration requires prior knowledge of the numerical values of
every single kinetic parameter in the model.
5.2. Dynamical systems theory: rate plots andbifurcation diagrams
Because these parameter values are rarely measured by direct
experimentation, we use dynamical systems theory (DST) as a
method to qualitatively determine the dynamic properties of
a molecular regulatory system before we know (or estimate)
the values of the kinetic parameter. Essentially, DST is a
toolkit for dynamic network analysis. For simple networks,
a useful first step is to plot the rates of production and
removal of a particular component, X, as functions of its con-
centration, [X]. Wherever the two curves intersect, [X]
assumes a steady-state value (figure 5). For networks with
feedback loops, there can be more than one intersection,
corresponding to stable and unstable steady states, as is the
case, for instance, in figure 5b. By computing these steady-
state values as functions of a ‘signalling’ parameter, we plot
a signal–response curve. In the DST terminology, the
signal–response curve is called a one-parameter bifurcation
diagram, and the ‘signal’ is called bifurcation parameter or
control parameter.
5.3. Dynamical systems theory: phase-plane analysisA signal–response curve can also be thought of as a balance
curve for a dynamic variable, indicating at which signal
levels the response variable is in steady state, because its pro-
duction is exactly balanced by its consumption. In cases
where the response variable feeds back on the signalling
system, it is natural to reverse the roles of ‘signal’ and
‘response’. Plotting the two bifurcation curves on the same
coordinate systems generates a phase plane. The two curves
on the phase plane are called nullclines, because along
these curves one of the dynamical variables is not changing
in time (its time-derivative is zero). For multidimensional sys-
tems, a phase plane can be calculated by assuming that all,
except two, dynamic variables are in (pseudo) steady state.
This is a useful way to project a multidimensional control
system onto a two-dimensional plane. Pseudo-phase planes
can be useful in interpreting the origins of multiple steady
states and limit cycle oscillations.
5.4. Chen’s modelChen’s model [19] can be downloaded from the model
website at http://mpf.biol.vt.edu/research/budding_yeast_
model/pp/ or simulated online. The webpage also contains
detailed information on the simulations for wild-type cells
and a wide range of mutants. All simulations were performed
using the originally published parameter set [19], which suc-
cessfully captures the qualitative behaviour of more than 130
mutant strains.
5.5. Simulation softwareSimulations and bifurcation analyses were performed with
the open access software packages OSCILL8 (http://oscill8.
sourceforge.net/) and XPPAUT (http://www.math.pitt.

rsob.royalsocietypublishing.orgOpen
Biol1:110009
11
on July 28, 2018http://rsob.royalsocietypublishing.org/Downloaded from
edu/~bard/xpp/xpp.html). Discrete events were removed
from Chen’s model in all bifurcation computation. Cell
mass was set to mass ¼ 2, corresponding to a big mother cell.
5.6. Computation of the figuresTo simulate Charvin’s experiment (figure 2a), Chen’s model
was modified to match the experimental strain and conditions.
Expression of GAL1-SIC1-4A was modelled by setting k0sc1 ¼
0.12, MDT ¼ 150, Vkp,c1 ¼ 0 and kpp,c1 ¼ 0. The Dcln3Dbck2background was accounted for (Bck2 ¼ 0 and Cln3 ¼ 0). For
ectopic Cln2, we added an additional equation with a binary
production rate and a degradation rate matching the rate of
endogenous Cln2. Figure 2b is simulated using the original
Chen model and parameters. In figure 2c, the black Clb-bifur-
cation curve was calculated at constant Cdc20 to remove the
Clb2-Cdc20 negative feedback loop (cdc20 ¼ 0.3). This is
required to reveal the bistable switch. The red Cln-bifurcation
curves in figure 2c,d are identical and were calculated using
the equations for Cln2, SBF, Bck2 and Cln3. The black
curve in figure 2d is computed with Bck2 ¼ 0 and Cln3 ¼ 0
(figure 4). Figure 4a was computed as for figure 2c, but includ-
ing pheromone signalling in the calculation of the Cln2
bifurcation curve. The additional equations are shown in
table 1. Figure 4b–d were all computed with the compre-
hensive model (i.e. Chen’s model expanded to include the
Far1-Cln2 mutual antagonism). Figures 5 and 6 were com-
puted with the pheromone signalling pathway isolated from
the comprehensive model (i.e. using the equations and par-
ameters given in table 1). Pheromone was present in the
simulation. To focus on the interplay between Cln2 and Far1,
Cln3 was removed (dn3 ¼ 0), and Cln2 levels were set constant
([CLN2]T ¼ 1.8). Ste5-8A and Far1-S87P were mimicked by
zeroing their phosphorylation rates (kp5n ¼ 0 and kdfar1pp ¼ 0,
respectively). The two-parameter bifurcation diagrams were
computed by tracing the saddle-node bifurcations shown in
the one-parameter bifurcation diagram.
6. AcknowledgementsThis work was supported by the Oxford Centre for Integra-
tive Systems Biology (OCISB), and by grants from the
Biotechnology and Biological Sciences Research Council
(BBSRC) and the European Community’s Seventh Frame-
work Programme (UniCellSys Grant 201142). We thank
John Tyson, Kathy Chen, Peter Pryciak and members of the
Novak laboratory for helpful discussions and advice.
References
1. Murray A, Hunt T. 1994 The cell cycle. Oxford, UK:Oxford University Press.
2. Cross FR. 1995 Starting the cell cycle: what’s thepoint? Curr. Opin. Cell Biol. 7, 790 – 797. (doi:10.1016/0955-0674(95)80062-X)
3. Hereford LM, Hartwell JH. 1974 Sequential genefunction in the initiation of Saccharomyces cerevisiaeDNA synthesis. J. Mol. Biol. 85, 445 – 461. (doi:10.1016/0022-2836(74)90451-3)
4. Chang F, Herskowitz I. 1990 Identification of a genenecessary for cell cycle arrest by a negative growthfactor of yeast: FAR1 is an inhibitor of a G1 cyclin,CLN2. Cell 63, 999 – 1011. (doi:10.1016/0092-8674(90)90503-7)
5. Tyers M, Futcher B. 1993 Far1 and Fus3 link themating pheromone signal transduction pathway tothree G1-phase Cdc28 kinase complexes. Mol. Cell.Biol. 13, 5659 – 5669.
6. Peter M, Herskowitz I. 1994 Direct inhibition of theyeast cyclin-dependent kinase Cdc28-Cln by Far1.Science 265, 1228 – 1231. (doi:10.1126/science.8066461)
7. Peter M, Gartner A, Horecka J, Ammerer G,Herskowitz I. 1993 FAR1 links the signaltransduction pathway to the cell cycle machineryin yeast. Cell 73, 747 – 760. (doi:10.1016/0092-8674(93)90254-N)
8. Breitkreutz A, Boucher L, Tyers M. 2001 MAPKspecificity in the yeast pheromone responseindependent of transcriptional activation. Curr.Biol. 11, 1266 – 1271. (doi:10.1016/S0960-9822(01)00370-0)
9. Chang F, Herskowitz I. 1992 Phosphorylation ofFAR1 in response to alpha-factor: a possible
requirement for cell-cycle arrest. Mol. Biol. Cell 3,445 – 450.
10. Pryciak PM, Huntress FA. 1998 Membranerecruitment of the kinase cascade scaffold proteinSte5 by the Gbetagamma complex underliesactivation of the yeast pheromone responsepathway. Genes Dev. 12, 2684 – 2697. (doi:10.1101/gad.12.17.2684)
11. Strickfaden SC, Winters MJ, Ben-Ari G, Lamson RE,Tyers M, Pryciak PM. 2007 A mechanism for cell-cycle regulation of MAP kinase signaling in ayeast differentiation pathway. Cell 128, 519 – 531.(doi:10.1016/j.cell.2006.12.032)
12. Henchoz S, Chi Y, Catarin B, Herskowitz I, DeshaiesRJ, Peter M. 1997 Phosphorylation- and ubiquitin-dependent degradation of the cyclin-dependentkinase inhibitor Far1p in budding yeast. GenesDev. 11, 3046 – 3060. (doi:10.1101/gad.11.22.3046)
13. Charvin G, Oikonomou C, Siggia ED, Cross FR. 2010Origin of irreversibility of cell cycle start in buddingyeast. PLoS Biol. 8, e1000284. (doi:10.1371/journal.pbio.1000284)
14. Doncic A, Falleur-Fettig M, Skotheim JM. 2011Distinct interactions select and maintain a specificcell fate. Mol. Cell 43, 528 – 539. (doi:10.1016/j.molcel.2011.06.025)
15. Skotheim JM, Di Talia S, Siggia ED, Cross FR. 2008Positive feedback of G1 cyclins ensures coherent cellcycle entry. Nature 454, 291 – 296. (doi:10.1038/nature07118)
16. Yao G, Lee TJ, Mori S, Nevins JR, You L. 2008 Abistable Rb-E2F switch underlies the restrictionpoint. Nat. Cell Biol. 10, 476 – 482. (doi:10.1038/ncb1711)
17. Amon A, Tyers M, Futcher B, Nasmyth K. 1993Mechanisms that help the yeast cell cycle clock tick:G2 cyclins transcriptionally activate G2 cyclins andrepress G1 cyclins. Cell 74, 993 – 1007. (doi:10.1016/0092-8674(93)90722-3)
18. Novak B, Vinod PK, Freire P, Kapuy O. 2010Systems-level feedback in cell-cycle control.Biochem. Soc. Trans. 38, 1242 – 1246. (doi:10.1042/BST0381242)
19. Chen KC, Calzone L, Csikasz-Nagy A, Cross FR, NovakB, Tyson JJ. 2004 Integrative analysis of cell cyclecontrol in budding yeast. Mol. Biol. Cell 15,3841 – 3862. (doi:10.1091/mbc.E03-11-0794)
20. de Bruin RA, McDonald WH, Kalashnikova TI, YatesIII J, Wittenberg C. 2004 Cln3 activates G1-specifictranscription via phosphorylation of the SBFbound repressor Whi5. Cell 117, 887 – 898.(doi:10.1016/j.cell.2004.05.025)
21. Oehlen LJ, Cross FR. 1994 G1 cyclins CLN1 and CLN2repress the mating factor response pathway at Startin the yeast cell cycle. Genes Dev. 8, 1058 – 1070.(doi:10.1101/gad.8.9.1058)
22. Nasmyth K, Dirick L. 1991 The role of SWI4and SWI6 in the activity of G1 cyclins in yeast.Cell 66, 995 – 1013. (doi:10.1016/0092-8674(91)90444-4)
23. Ogas J, Andrews BJ, Herskowitz I. 1991Transcriptional activation of CLN1, CLN2, and aputative new G1 cyclin (HCS26) by SWI4, apositive regulator of G1-specific transcription.Cell 66, 1015 – 1026. (doi:10.1016/0092-8674(91)90445-5)
24. Schwob E, Bohm T, Mendenhall MD, Nasmyth K.1994 The B-type cyclin kinase inhibitor p40SIC1

rsob.royalsocietypublishin
12
on July 28, 2018http://rsob.royalsocietypublishing.org/Downloaded from
controls the G1 to S transition in S. cerevisiae.Cell 79, 233 – 244. (doi:10.1016/0092-8674(94)90193-7)
25. Novak B, Tyson JJ. 2003 Modelling thecontrols of the eukaryotic cell cycle. Biochem.Soc. Trans. 31, 1526 – 1529. (doi:10.1042/BST0311526)
26. Peters JM. 2006 The anaphase promoting complex/cyclosome: a machine designed to destroy. Nat.
Rev. Mol. Cell Biol. 7, 644 – 656. (doi:10.1038/nrm1988)
27. Jeoung DI, Oehlen LJ, Cross FR. 1998 Cln3-associated kinase activity in Saccharomycescerevisiae is regulated by the mating factorpathway. Mol. Cell. Biol. 18, 433 – 441.
28. Ydenberg CA, Rose MD. 2009 Antagonisticregulation of Fus2p nuclear localization bypheromone signaling and the cell cycle.
J. Cell Biol. 184, 409 – 422. (doi:10.1083/jcb.200809066)
29. Oehlen LJ, Jeoung DI, Cross FR. 1998 Cyclin-specificSTART events and the G1-phase specificity of arrestby mating factor in budding yeast. Mol. Gen. Genet.258, 183 – 198. (doi:10.1007/s004380050722)
30. Costanzo M et al. 2004 CDK activity antagonizesWhi5, an inhibitor of G1/S transcription in yeast. Cell117, 899 – 913. (doi:10.1016/j.cell.2004.05.024)
g .orgOpenBiol1:110009