celebrating moments - trilogy products · certification roll-outs complete, our brand investment...
TRANSCRIPT

ce l ebrat ing
MOMENTS
TR I LOGY I NTE RNAT IONAL L I M ITE D AN N UAL RE PORTFOR THE YEAR ENDED 31 M ARCH 2014
A N N UA L R E PORT
2014

1 ECOYA PRODUC T I S N OW SOLD E VERY
45 SECON DS AROU N D TH E WORLD .
1 TR I LOGY PRODUC T I S N OW SOLD E VERY
29 SECON DS AROU N D TH E WORLD .

CHA I R M AN & CEO R EPO RT
D I R EC TO R S ’ R ESPO NS I B I L I T Y S TATEM ENT
D I R EC TO R S ’ PRO F I LES
CO R PO R ATE GOVER NANCE
AU D ITO R S ’ R EPO RT
F I NANCIAL S TATEM ENTS
SHAR EH O LDER & S TATUTO RY I N FO R M AT I O N
CO R PO R ATE D I R EC TO RY & SHAR EH O LDER I N FO R M AT I O N
5
11
15
21
29
33
93
103
S TATE M E NTS O F COM P R E H E N S IV E I N COM E
S TATE M E NTS O F F I N A N CI A L POS I T I O N
S TATE M E NTS O F M OV E M E NTS I N EQ U I T Y
S TATE M E NTS O F C A S H F LOWS
N OTES TO TH E F I N A N CI A L S TATE M E NTS
35
36
37
39
40


CHAIR M AN AND CEO REPORT
5
T R I LOG Y I N T E R N AT I O N A L L I M I T E D A N N UA L R E PO RT 31S T M ARCH 2014
CHAIR M AN & CEO REPORT

CHAIR M AN & CEO REPORT
6
T R I LOG Y I N T E R N AT I O N A L L I M I T E D A N N UA L R E PO RT 31S T M ARCH 2014

CHAIR M AN AND CEO REPORT
7
T R I LOG Y I N T E R N AT I O N A L L I M I T E D A N N UA L R E PO RT 31S T M ARCH 2014
Dear Shareholder,
Welcome to the 2014 Annual Report for Trilogy International Limited.
During the last financial year we recorded an increase in sales of 12% and our net profit after tax climbed from $34k in 2013 to $1.1m in 2014.
Both Ecoya and Trilogy continued to perform well, with Ecoya seeing sales growth of 27% and with Trilogy revenue in all markets except Australia growing by 13%.
Product development and design are important to both brands and this year continues to see leading edge work from our internal brand creative and design teams.
Highlights for the year to 31 March for each brand are described further below together with some insight into the year ahead.
The group now has 100 staff based around the world and the last year has seen many reasons for the team to celebrate. For Ecoya, launching the Ecoya Celebration candle and selling out all over the world within weeks and for Trilogy, securing ranging in Debenhams department stores in the UK were some of the key highlights for the team.
I would like to take this opportunity to thank the entire group for their hard work in helping grow both brands this year.
CHA IR M AN & CEO REPORT
FY14 Group Revenue by Market $29.8m
$13M
$8.9M
$3.8M
$2.3M
$1.8M
A U S T R A L I A
N E W ZE A L A N D
UK / IE
R . O .W
OT H E R
Revenue (NZDm)
14 . 3
2 2 . 6
2 6 .7
2 9 . 8
f y 1 2f y 1 1 f y 1 3 f y 14
NPAT (NZDm)
(4 . 0)
(0 . 2)
0 . 0
1 . 1
f y 1 2f y 14
f y 1 3f y 1 1
CHAIR M AN & CEO REPORT
8
T R I LOG Y I N T E R N AT I O N A L L I M I T E D A N N UA L R E PO RT 31S T M ARCH 2014
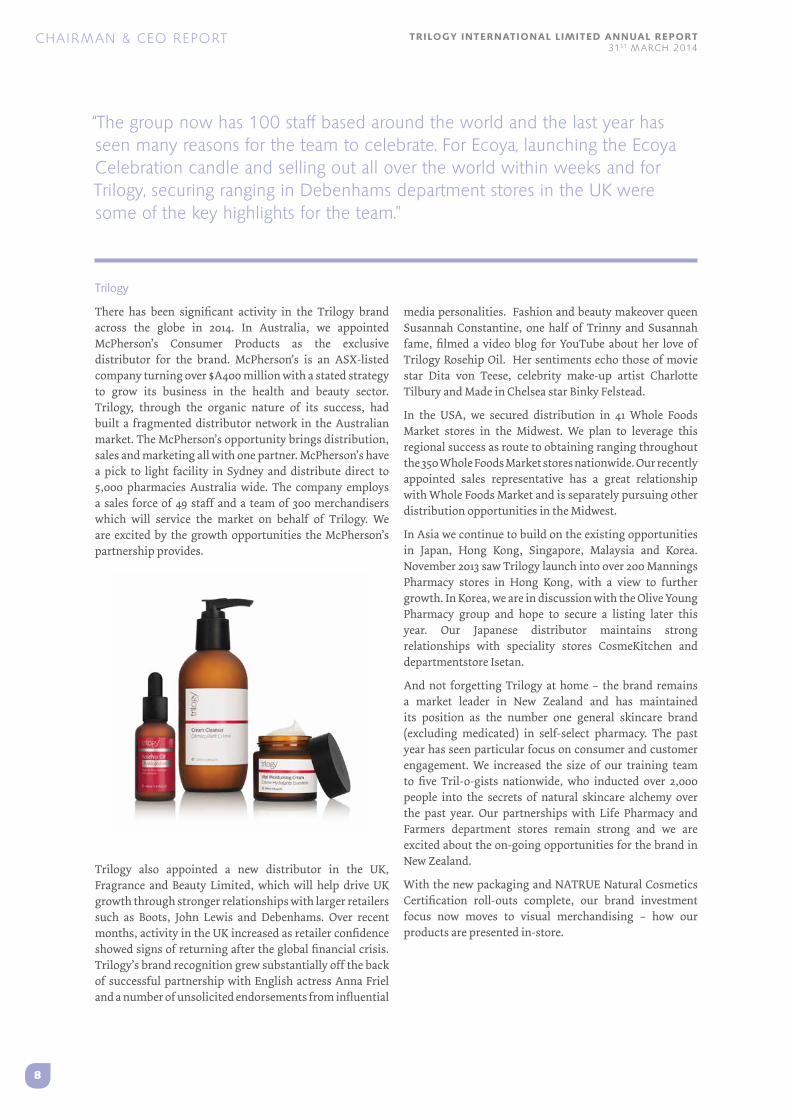
Trilogy
There has been significant activity in the Trilogy brand across the globe in 2014. In Australia, we appointed McPherson’s Consumer Products as the exclusive distributor for the brand. McPherson’s is an ASX-listed company turning over $A400 million with a stated strategy to grow its business in the health and beauty sector. Trilogy, through the organic nature of its success, had built a fragmented distributor network in the Australian market. The McPherson’s opportunity brings distribution, sales and marketing all with one partner. McPherson’s have a pick to light facility in Sydney and distribute direct to 5,000 pharmacies Australia wide. The company employs a sales force of 49 staff and a team of 300 merchandisers which will service the market on behalf of Trilogy. We are excited by the growth opportunities the McPherson’s partnership provides.
Trilogy also appointed a new distributor in the UK, Fragrance and Beauty Limited, which will help drive UK growth through stronger relationships with larger retailers such as Boots, John Lewis and Debenhams. Over recent months, activity in the UK increased as retailer confidence showed signs of returning after the global financial crisis. Trilogy’s brand recognition grew substantially off the back of successful partnership with English actress Anna Friel and a number of unsolicited endorsements from influential
media personalities. Fashion and beauty makeover queen Susannah Constantine, one half of Trinny and Susannah fame, filmed a video blog for YouTube about her love of Trilogy Rosehip Oil. Her sentiments echo those of movie star Dita von Teese, celebrity make-up artist Charlotte Tilbury and Made in Chelsea star Binky Felstead.
In the USA, we secured distribution in 41 Whole Foods Market stores in the Midwest. We plan to leverage this regional success as route to obtaining ranging throughout the 350 Whole Foods Market stores nationwide. Our recently appointed sales representative has a great relationship with Whole Foods Market and is separately pursuing other distribution opportunities in the Midwest.
In Asia we continue to build on the existing opportunities in Japan, Hong Kong, Singapore, Malaysia and Korea. November 2013 saw Trilogy launch into over 200 Mannings Pharmacy stores in Hong Kong, with a view to further growth. In Korea, we are in discussion with the Olive Young Pharmacy group and hope to secure a listing later this year. Our Japanese distributor maintains strong relationships with speciality stores CosmeKitchen and departmentstore Isetan.
And not forgetting Trilogy at home – the brand remains a market leader in New Zealand and has maintained its position as the number one general skincare brand (excluding medicated) in self-select pharmacy. The past year has seen particular focus on consumer and customer engagement. We increased the size of our training team to five Tril-o-gists nationwide, who inducted over 2,000 people into the secrets of natural skincare alchemy over the past year. Our partnerships with Life Pharmacy and Farmers department stores remain strong and we are excited about the on-going opportunities for the brand in New Zealand.
With the new packaging and NATRUE Natural Cosmetics Certification roll-outs complete, our brand investment focus now moves to visual merchandising – how our products are presented in-store.
“The group now has 100 staff based around the world and the last year has seen many reasons for the team to celebrate. For Ecoya, launching the Ecoya Celebration candle and selling out all over the world within weeks and for Trilogy, securing ranging in Debenhams department stores in the UK were some of the key highlights for the team.”

T R I LOG Y I N T E R N AT I O N A L L I M I T E D A N N UA L R E PO RT 31S T M ARCH 2014
H IGHL IGHTS
9
Ecoya
The last two years with the Ecoya brand has seen consolidation in the Australian market with focus on new product and a new operating structure.
The brand has responded exceptionally well to this new structure and product development, with sales growth in Australia of 23% and in New Zealand revenue has grown 44%.
Product design continues to remain a focus for the Ecoya brand with fantastic design ideas coming from our internal design team. This year has seen new Limited Edition products, the Celebration candle and an extended Christmas collection (which has already been ordered by some of our key retail partners). We are also refreshing our body care range and expect this to be in store early September.
We expect sales to continue to build in 2015, in both Australia and New Zealand. This is through growth in same store sales and as the brand continues to develop and our product offering expands. We will also invest in
“We expect sales to continue to build in 2015, in both Australia and New Zealand.”
additional sales staff across the two markets to open new opportunities.
With Australia and New Zealand performing so well, more focus can be given to our international markets. Our focus markets in Asia are Korea, Taiwan, Hong Kong and China. In Taiwan and Korea we are in discussion with our distributors about partnering to open a flagship store to raise brand profile in these markets. In Europe we have distributor relationships in the United Kingdom, Sweden and Switzerland. We will continue to invest in these markets to build sales growth.

T R I LOG Y I N T E R N AT I O N A L L I M I T E D A N N UA L R E PO RT 31S T M ARCH 2014
H IGHL IGHTS
10
Geoff Ross
Chairman
Stephen Sinclair
CEO
Retail and Online
The online business across both brands has grown 27% in 2014 and we see value in investing in the future growth of this channel. Our plans include driving online sales whilst at the same time investing in the digital footprint for both brands. We see online as a great tool to promote both brands and we remain active across digital platforms such as Facebook, Twitter, Instagram and Pinterest.
In retail we have the store at Auckland Airport and our flagship store in Woollhara in Sydney. During the year we operated two Sydney pop-up stores, one in Westfield Pitt Street and the other in Westfield Bondi Junction. Going forward, our pop-ups will be open for shorter durations in any one location and will target specific retail sales periods, primarily Christmas and Mothers’ Day. We look to short term retail pop ups as a great way to profile and increase brand awareness rather than a permanent channel to market.
We would like to thank you for your continued support as shareholders. We look forward to the year ahead and to continuing to build momentum and capitalise on opportunities created in 2014.
Kind Regards,
ECOYA FACEBOOK
TR I LOGY FACEBOOK
DIRECTORS ’ RESPONSIB I L I T Y STATEMENT
11
T R I LOG Y I N T E R N AT I O N A L L I M I T E D A N N UA L R E PO RT 31S T M ARCH 2014
DIREC TOR S ’RESPONSIB I L IT Y S TATEMENT

DIRECTORS ’ RESPONSIB I L I T Y STATEMENT
12
T R I LOG Y I N T E R N AT I O N A L L I M I T E D A N N UA L R E PO RT 31S T M ARCH 2014

DIRECTORS ’ RESPONSIB I L I T Y STATEMENT
13
T R I LOG Y I N T E R N AT I O N A L L I M I T E D A N N UA L R E PO RT 31S T M ARCH 2014
The Board of Directors have pleasure in presenting the annual report of Trilogy International Limited (‘the Company’) and its subsidiaries (together ‘the Group’), incorporating the financial statements and the auditors’ report, for the year ended 31 March 2014.
The directors are responsible for presenting financial statements in accordance with New Zealand law and generally accepted accounting practice, which give a true and fair view of the financial position of the Group as at 31 March 2014 and the results of the Group’s operations and cash flows for the year ended on that date.
The directors consider the financial statements of the Group have been prepared using accounting policies which have been consistently applied and supported by reasonable judgements and estimates and that all relevant financial reporting and accounting standards have been followed.
The directors believe that proper accounting records have been kept which enable with reasonable accuracy, the determination of the financial position of the Group and facilitate compliance with the Financial Reporting Act 1993.
The directors consider that they have taken adequate steps to safeguard the assets of the Group, and to prevent and detect fraud and other irregularities. Internal control procedures are also considered to be sufficient to provide a reasonable assurance as to the integrity and reliability of the financial statements.
The Board of Directors of the Group authorised these financial statements presented on pages 33 to 92 for issue on 29 May 2014.
For and on behalf of the Board.
Geoff Ross
Chairman
30th June 2014
Stephen Sinclair
CEO
DIREC TOR S ’ R ESPONSIB I L I T Y S TATE MENT


15
T R I LOG Y I N T E R N AT I O N A L L I M I T E D A N N UA L R E PO RT 31S T M ARCH 2014
D IRECTORS ’ PROF I LES
DIREC TOR S ’ PROF I LES

DIRECTORS ’ PROF I LES
16
T R I LOG Y I N T E R N AT I O N A L L I M I T E D A N N UA L R E PO RT 31S T M ARCH 2014

17
T R I LOG Y I N T E R N AT I O N A L L I M I T E D A N N UA L R E PO RT 31S T M ARCH 2014
D IRECTORS ’ PROF I LES
GEOFF ROSS Chairman (Auckland, NZ)
Geoff was the founder and CEO of 42 Below, which was a listed Company for three years prior to its sale to Bacardi in late 2006. Geoff is also CEO of Moa Group Limited, an NZX listed Company focused on the craft brewing market. Prior to 42 Below, he was a Managing Partner and Board Member of DDB Advertising for two years and was a Client Service Director and Management Team Member for Saatchi & Saatchi in Wellington for eight years. Geoff is also a Trustee of the Melanoma Foundation and Pure Advantage.
Geoff has a Bachelor of Commerce (Agriculture).
S TEPHEN S INCL A IR Chief Executive Officer (Auckland, NZ)
Stephen has been with the Group since 2008 and has held the roles of Chief Financial Officer and Chief Operating Officer prior to being appointed as CEO. Prior to this Stephen was Chief Financial Officer of 42 Below Limited as well as an Executive Director and Company Secretary.
Stephen assisted Bacardi with the business integration post its acquisition of 42 Below Limited. Prior to this, he spent 13 years with PricewaterhouseCoopers.

DIRECTORS ’ PROF I LES
18
T R I LOG Y I N T E R N AT I O N A L L I M I T E D A N N UA L R E PO RT 31S T M ARCH 2014
GR ANT BAKER Executive Director (Auckland, NZ)
Grant was the Executive Chairman of 42 Below Limited before its sale to Bacardi in 2006 and has experience within numerous New Zealand businesses, both private and executive. He has previously held a number of senior business positions, including Chief Executive and Executive Director of Blue Star Group Limited, Chairman and founding Director of EFTPOS retailer Netco Limited, as well as serving as Executive Chairman of Empower Limited. Grant is currently Chairman of Dorchester Pacific Limited, Chairman of Moa Group Limited and Deputy Chairman of the New Zealand cancer charity GICI (Gastro Intestinal Cancer Institute Limited).
SAR AH G IBBS Non-Executive Director (Wellington, NZ)
Sarah Gibbs is the co-founder and former Chief Executive of natural skincare brand Trilogy. She brings to the Board a mix of strategic vision, foresight and expertise in international business expansion. After running her own business manufacturing ingredients for the natural cosmetics and supplements industries, Sarah established Trilogy with her sister Catherine de Groot in 2002. They built the business from a boutique local operation into a successful international brand, before selling to Ecoya in 2010. Sarah was named Emerging International Business Leader in the 2012 New Zealand International Business Awards. She is a Fellow of the NZ Institute of Chartered Accountants and a Director on the Board of Export New Zealand, Positively Wellington Trust and The Cosmetic, Toiletry and Fragrance Association.

19
T R I LOG Y I N T E R N AT I O N A L L I M I T E D A N N UA L R E PO RT 31S T M ARCH 2014
D IRECTORS ’ PROF I LES
M ANDY S IGALOFF Independent Director (Sydney, Australia)
Mandy comes from a media background, publishing magazines in both UK and Australia for Emap PLC before moving into Digital Media in the boom of 2000. She launched OSOYOU for Bright Station Ventures, which become part of the biggest online Fashion network in Europe. She lives in Australia where she was listed as business women of the year in 2012 by Australia’s Dynamic Business. Mandy runs an advertising agency, launches websites and consults in e-commerce and digital marketing. She is a Member of Australian Institute of Company Directors (MAICD)
R ICH FR ANK Independent Director (West Coast, USA)
Rich is a former Chairman President of Walt Disney Studios, former President of Paramount TV Group and is currently Vice Chairman of the American Film Institute. He currently produces two television shows, Royal Pains for the USA network and Wilfred for the FX network. He is a Board Director of Napastyle, retailing exclusive home goods and specialty foods with a focus on sustainable living. Rich and his family own The Frank Family Vineyards in California’s Napa Valley.

JUST ADD CANDLELIGHT

CORPOR ATE GOVERNANCE
21
T R I LOG Y I N T E R N AT I O N A L L I M I T E D A N N UA L R E PO RT 31S T M ARCH 2014
CORPOR ATEGOVERNANCE

CORPOR ATE GOVERNANCE
22
T R I LOG Y I N T E R N AT I O N A L L I M I T E D A N N UA L R E PO RT 31S T M ARCH 2014
CORPOR ATE GOVERNANCE
23
T R I LOG Y I N T E R N AT I O N A L L I M I T E D A N N UA L R E PO RT 31S T M ARCH 2014
The overall responsibility for ensuring that Trilogy International Limited (the ”Company”) is properly managed to enhance investor confidence through corporate governance and accountability lies with the Board of Directors. On 27 May 2010 the Board of Directors adopted a corporate governance code (“Code”). A copy of the code is available on the Trilogy International website www.trilogyproducts.com/investors.
The Code is generally consistent with the principles identified in the “Corporate Governance in New Zealand Principles and Guidelines” report, released by the New Zealand Securities Commission in 2004. The Code materially complies with the NZX Corporate Governance Best Practice Code.
The Company will continue to monitor best practice in the governance area and update its policies to ensure it maintains the most appropriate standards.
Our principal governance statements are outlined in this report.
The Board has ultimate responsibility for the strategic direction of the Company and supervision of the Company’s management for the benefit of shareholders.
The specific responsibilities of the Board include:
Working with management to set the strategic direction of the Company.
Monitoring and working with management to direct the business and financial performance of the Company.
Monitoring compliance and risk management.
Establishing and monitoring the compnay’s health and safety policies.
Establishing and overseeing succession plans for senior management.
Ensuring effective disclosure policies and procedures are adopted.
The Board met twelve times during the financial year, including sessions to consider the Company’s strategic direction and business plans.
Ethical Conduct
The Code includes a policy on business ethics which is designed to govern the board’s conduct. The Code addresses conflicts of interest, receipt of gifts, confidentiality and fair business practices.
Board Membership
The Board currently consists of two independent directors, one non- Executive Director and three executive directors, who are elected based on the value they bring to the Board.
Each director is a skilled and experienced business person. Together they provide value by making quality contributions to corporate governance matters, conceptual thinking, strategic planning, policies and providing guidance to management.
CORPOR ATE GOVERNANCE THE BOARD OF D IREC TOR S

CORPOR ATE GOVERNANCE
24
T R I LOG Y I N T E R N AT I O N A L L I M I T E D A N N UA L R E PO RT 31S T M ARCH 2014
Board Meeting and Committee Attendance
As at 31 March 2014 the Board consisted of:
Geoff Ross Chairman
Stephen Sinclair Chief Executive Officer
Grant Baker Executive Director
Sarah Gibbs Non-Executive Director
Rich Frank Independent Director
Mandy Sigaloff Independent Director
On 6 September 2013, Mandy Sigaloff was appointed as a new Independent Director, replacing outgoing Independent Director, Rob Fyfe, who did not seek re-election to the board at the Company’s annual meeting on 24 September 2013.
Profiles of current board members are shown on page 15 to 19.
The number of elected directors and the procedure for their retirement and re-election at annual meetings of shareholders are set out in the Constitution of the Company.
Director Independence
In order for a director to be independent, the Board has determined that he or she must not be an executive of the Company and must have no disqualifying relationship as
defined in the corporate governance code and the NZSX Listing Rules.
The Board has determined that Rich Frank and Mandy Sigaloff are independent directors.
Geoff Ross, Grant Baker, Stephen Sinclair and Sarah Gibbs were not independent directors.
Nomination and Appointment of Directors
The Board is responsible for identifying and recommending candidates. Directors may also be nominated by shareholders under NZSX Listing Rule 3.3.5.
A director may be appointed by ordinary resolution and all directors are subject to removal by ordinary resolution.
The Board may at any time appoint additional directors. A director appointed by the Board shall only hold office until the next annual meeting of the Company, but shall be eligible for election at that meeting.
One third of directors shall retire from office at the annual meeting each year. The directors to retire shall be those who have been longest in office since they were last elected or deemed to be elected.
Board Meeting
Audit and Risk Management
Committee
Geoff Ross 12 n/aGrant Baker 11 n/aStephen Sinclair 12 2Sarah Gibbs 12 1Rich Frank 5 2Rob Fyfe ( to August 2013) 4 1Mandy Sigaloff (from September 2013) 7 1

CORPOR ATE GOVERNANCE
25
T R I LOG Y I N T E R N AT I O N A L L I M I T E D A N N UA L R E PO RT 31S T M ARCH 2014
Disclosure of Interests by Directors
The Code sets out the procedures to be followed where directors have an interest in a transaction or proposed transaction or are faced with a potential conflict of interest requiring the disclosure of that conflict to the Board. The Company maintains an interests register in which particulars of certain transactions and matters involving directors are recorded. The interests register for the Company is available for inspection at its registered office.
Directors’ Share Dealings
The Company has adopted a securities dealing policy which sets out the procedure to be followed by directors and staff when trading in the Company’s listed securities, to ensure that no trades are effected whilst that person is in possession of material information which is not generally available to the market. Details of directors’ share dealings are outlined on page 98.
Indemnification and Insurance of Directors and Officers
The Company has directors’ and officers’ liability insurance which ensures that generally, directors and officers will incur no monetary loss as a result of actions undertaken by them.
The Board has two formally constituted committees of Directors. These Committees, established by the Board, review and analyse policies and strategies, usually developed by management, which are within their terms of reference. The Committees examine proposals and, where appropriate, make recommendations to the Board. Committees do not take action or make decisions on behalf of the Board unless specifically authorised to do so by the Board.
Audit and Risk Management Committee
The Audit and Risk Management Committee is responsible for overseeing the risk management (including treasury and financing policies), treasury, insurance, accounting and audit activities of Trilogy International, and reviewing the adequacy and effectiveness of internal controls, meeting with and reviewing the performance of external auditors, reviewing the consolidated financial statements, and making recommendations on financial and accounting policies.
The members of the Audit and Risk Management Committee are Sarah Gibbs, Mandy Sigaloff and Rich Frank.
The Audit and Risk Committee met on 21 November 2013 and 23 May 2014.
Remuneration Committee
The Remuneration Committee is responsible for overseeing management succession planning, establishing employee incentive schemes, reviewing and approving the compensation arrangements for the executive Directors and senior management, and recommending to the full Board the remuneration of Directors.
The members of the Remuneration Committee are Sarah Gibbs, Mandy Sigaloff and Rich Frank.
During the year all remuneration issues were reviewed within the normal Board meetings.
BOARD COM MIT TEES

CORPOR ATE GOVERNANCE
26
T R I LOG Y I N T E R N AT I O N A L L I M I T E D A N N UA L R E PO RT 31S T M ARCH 2014
Remuneration of directors and executives is the key responsibility of the Remuneration Committee. Details of directors and executives’ remuneration and entitlements are detailed on pages 97 to 100.
Directors’ Remuneration
The Directors’ fees for the Independent Directors of Trilogy International have been fixed, initially at a total of A$40,000 per Independent Director with the exception of NZ$50,000 in the case of Mandy Sigaloff. To provide the flexibility, the existing shareholders have approved an aggregate cap on Independent Directors’ fees of A$200,000 for the purpose of NZSX Listing Rule 3.5. At the election of each Independent Director, Directors’ fees may be paid in part or whole by issue of Shares in accordance with the NZSX Listing Rules. The Executive Directors are not entitled to be paid Directors’ fees.
Trilogy International has access to the Executive Directors through consultancy agreements with The Business Bakery LP (“The Bakery”). The Bakery has entered into a consultancy agreement with the Company, pursuant to which it has agreed to make Geoff Ross, Stephen Sinclair and Grant Baker available to the Company to provide specialist management and executive services. Under the consultancy agreement, the Company paid a consultancy fee of NZ$580,000 plus GST to The Bakery in respect of services provided for the year ended 31 March 2014.
Bill & George’s Investments Ltd (associated with Non-Executive Director Sarah Gibbs) is paid fees pursuant to a consulting agreement dated 9 January 2012. Bill & George’s Investments Ltd also receives Directors’ Fee on behalf of Sarah Gibbs based on an annual fee of A$40,000. Total payments made under these agreements during the year were $94,753.
The Directors are also entitled to be paid for all reasonable travel, accommodation and other expenses incurred by them in connection with their attendance at Board or shareholder meetings, or otherwise in connection with the Company’s business.
Share Based Payments
On 22 November 2013 the Company issued 200,000 options, with an exercise price of $0.80 per share to Club QT Australia Pty Ltd (an entity associated with Mandy Sigaloff, a director of Trilogy International Limited). Each ordinary share option will be converted to one ordinary share on exercise. These options vest immediately and expire on 30 September 2016. As at 31 March 2014, these options had not been exercised.
Loans to Independent Directors
As part of an incentive package, the Company plans to provide limited recourse loans to the Independent Directors to enable them to subscribe for an aggregate of 425,000 shares in the Company at $1 per Share. Loans will not bear interest, and will be repayable after five years or earlier at the discretion of the Independent Director. The loans will be non recourse against the borrowing Independent Directors, but will be secured against the relevant Shares held by or on behalf of the Independent Directors and which were acquired with the loan proceeds.
The Independent Directors will be offered loans to enable them to subscribe for the shares at NZ$1.00 per share.
Loans had not been made to directors as at the date of this report.
RE MUNER AT ION

CORPOR ATE GOVERNANCE
27
T R I LOG Y I N T E R N AT I O N A L L I M I T E D A N N UA L R E PO RT 31S T M ARCH 2014
The Board has overall responsibility for the Company’s system of risk management and internal control and has procedures in place to provide effective control within the management and reporting structure.
Financial Statements are prepared monthly and reviewed by the Board progressively during the year to monitor performance against budget goals and objectives. The Board also requires managers to identify and respond to risk exposures.
A structured framework is in place for capital expenditure, including appropriate authorisations and approval levels.
The Board maintains an overall view of the risk profile of the Company and is responsible for monitoring corporate risk assessment processes.
DISCLOSURE
The Company adheres to the NZX continuous disclosure requirements which govern the release of all material information that may affect the value of the Company’s listed shares. The Board and senior management team have processes in place to ensure that all material information flows up to the Chairman with a view to consultation with the Board and disclosure of that information if appropriate.
AUDITOR S
PricewaterhouseCoopers acted as auditors of the Company, and have undertaken the audit of the financial statements for the 31 March 2014 year and provided other services to the Company for which they were remunerated. Particulars of the audit and other fees paid during the year are set out on page 64.
M ANAGING R ISK

0274 Moneta_0_1 PATH FA.indd 1 13/05/14 3:55 PM

AUDITORS ’ REPORT
29
T R I LOG Y I N T E R N AT I O N A L L I M I T E D A N N UA L R E PO RT 31S T M ARCH 2014
AUDITOR S ’REPORT

AUDITORS ’ REPORT
30
T R I LOG Y I N T E R N AT I O N A L L I M I T E D A N N UA L R E PO RT 31S T M ARCH 2014

AUDITORS ’ REPORT
31
T R I LOG Y I N T E R N AT I O N A L L I M I T E D A N N UA L R E PO RT 31S T M ARCH 2014
Report on the Financial Statements
We have audited the financial statements of Trilogy International Limited on pages 33 to 92, which comprise the statements of financial position as at 31 March 2014, the statements of comprehensive income, statements of movements in equity and statements of cash flows for the year then ended, and the notes to the financial statements that include a summary of significant accounting policies and other explanatory information for both the Company and the Group. The Group comprises the Company and the entities it controlled at 31 March 2014 or from time to time during the financial year.
Directors’ Responsibility for the Financial Statements
The Directors are responsible for the preparation of these financial statements in accordance with generally accepted accounting practice in New Zealand and that give a true and fair view of the matters to which they relate and for such internal controls as the Directors determine are necessary to enable the preparation of financial statements that are free from material misstatement, whether due to fraud or error.
Auditors’ Responsibility
Our responsibility is to express an opinion on these financial statements based on our audit. We conducted our audit in accordance with International Standards on Auditing (New Zealand) and International Standards on Auditing. These standards require that we comply with relevant ethical requirements and plan and perform the audit to obtain reasonable assurance about whether the financial statements are free from material misstatement.
An audit involves performing procedures to obtain audit evidence about the amounts and disclosures in the financial statements. The procedures selected depend on the auditors’ judgement, including the assessment of the risks of material misstatement of the financial statements, whether due to fraud or error. In making those risk assessments, the auditor considers the internal controls relevant to the Company and Group’s preparation
of financial statements that give a true and fair view of the matters to which they relate, in order to design audit procedures that are appropriate in the circumstances, but not for the purpose of expressing an opinion on the effectiveness of the Company and Group’s internal control. An audit also includes evaluating the appropriateness of accounting policies used and the reasonableness of accounting estimates, as well as evaluating the overall presentation of the financial statements.
We believe that the audit evidence we have obtained is sufficient and appropriate to provide a basis for our audit opinion.
Other than in our capacity as auditors, we have no relationship with, or interests in, Trilogy International Limited or any of its subsidiaries.
Opinion
In our opinion, the financial statements on pages 33 to 92:
i Comply with generally accepted accounting practice in New Zealand;
ii Comply with International Financial Reporting Standards; and
iii Give a true and fair view of the financial position of the Company and the Group as at 31 March 2014, and their financial performance and cash flows for the year then ended.
Report on Other Legal and Regulatory Requirements
We also report in accordance with Sections 16(1)(d) and 16(1)(e) of the Financial Reporting Act 1993. In relation to our audit of the financial statements for the year ended 31 March 2014:
i We have obtained all the information and explanations that we have required; and
ii In our opinion, proper accounting records have been kept by the Company as far as appears from an examination of those records.
INDEPENDENT AUDITOR S ’ R EPORT TO THE SHAREHOLDER S OF TR I LOGY INTERNAT IONAL L IM I TED

AUDITORS ’ REPORT
32
T R I LOG Y I N T E R N AT I O N A L L I M I T E D A N N UA L R E PO RT 31S T M ARCH 2014
Restriction on Distribution or Use
This report is made solely to the Company’s Shareholders, as a body, in accordance with Section 205(1) of the Companies Act 1993. Our audit work has been undertaken so that we might state to the Company’s Shareholders those matters which we are required to state to them in an auditors’ report and for no other purpose. To the fullest extent permitted by law, we do not accept or assume responsibility to anyone other than the Company and the Company’s Shareholders, as a body, for our audit work, for this report or for the opinions we have formed.
Chartered Accountants Auckland 29 May 2014

F INANCIAL STATEMENTS
33
T R I LOG Y I N T E R N AT I O N A L L I M I T E D A N N UA L R E PO RT 31S T M ARCH 2014
F INANCIALSTATEMENTS

F INANCIAL STATEMENTS
34
T R I LOG Y I N T E R N AT I O N A L L I M I T E D A N N UA L R E PO RT 31S T M ARCH 2014

F INANCIAL STATEMENTS
35
T R I LOG Y I N T E R N AT I O N A L L I M I T E D A N N UA L R E PO RT 31S T M ARCH 2014
the above statements of comprehensive income should be read in conjunction with the accompanying notes.
Statements of Comprehensive IncomeFor the year ended 31 March 2014
notes
Consolidated2014
$’000
Consolidated2013
$’000
Parent2014
$’000
Parent2013
$’000
Revenue 5,24 29,754 26,666 831 1,284Cost of sales (11,419) (9,611) - -Gross profit 18,335 17,055 831 1,284
Other income/(expenditure) 6 - 8 (11) 369Other gains/(losses) – net 6 44 41 - (1)Expenses 7
Distribution (1,407) (1,245) - -Sales & marketing (10,421) (10,190) - -Administration (4,810) (4,890) (1,024) (1,458)
Finance income 8 8 11 1,115 949Finance costs 8 (489) (702) (1,861) (707)
Profit/(loss) before income tax 1,260 88 (950) 436Income tax expense 9 (190) (54) (118) (41)
Profit/(loss) for the year 1,070 34 (1,068) 395
Other comprehensive income – items that may be reclassified subsequently to profit and loss:
Foreign currency translation, net of tax 21 (774) (63) - -Total comprehensive income/(loss) for the year 296 (29) (1,068) 395
Dollars Dollars
Earnings per share attributable to the ordinary equity holders of the Company during the period:
Basic earnings per share 26 0.02 0.00Diluted earnings per share 26 0.02 0.00

F INANCIAL STATEMENTS
36
T R I LOG Y I N T E R N AT I O N A L L I M I T E D A N N UA L R E PO RT 31S T M ARCH 2014
Statements of Financial PositionAs at 31 March 2014
the above statements of financial position should be read in conjunction with the accompanying notes.
notes
Consolidated 2014
$’000
Consolidated2013
$’000
Parent2014
$’000
Parent 2013
$’000
Current assets
Cash and cash equivalents 10 1,185 1,185 6 -Trade and other receivables 11 5,118 5,020 502 254Inventories 12 4,386 5,539 - -Tax receivable - 15 - 2Receivables from subsidiaries 24 - - 31,003 33,409Derivative financial instruments 19 231 22 - -
Total current assets 10,920 11,781 31,511 33,665
Non-current assets
Plant and equipment 14 1,395 1,915 - -Intangible assets 16 17,569 17,790 - -Shares in subsidiaries 13 - - 3,490 3,490Deferred tax asset 15 167 165 6 124
Total non-current assets 19,131 19,870 3,496 3,614
Total assets 30,051 31,651 35,007 37,279
Current liabilities
Trade and other payables 17 2,340 3,231 320 342Interest bearing liabilities 18 - 6,576 - 6,576Tax payable 154 - - -Derivative financial instruments 19 71 40 - -
Total current liabilities 2,565 9,847 320 6,918
Non-current liabilities
Deferred tax liability 15 - 8 - -Interest bearing liabilities 18 4,500 - 4,500 -
Total non-current liabilities 4,500 8 4,500 -
Total liabilities 7,065 9,855 4,820 6,918
Net assets 22,986 21,796 30,187 30,361
Equity
Contributed equity 20 32,356 31,481 32,356 31,481Reserves 21 (820) (65) 19 -Accumulated losses 21 (8,550) (9,620) (2,188) (1,120)Equity attributable to equity holders of Trilogy International Limited 22,986 21,796 30,187 30,361
On behalf of the Board29th May 2014
Geoff Ross – Chairman Stephen Sinclair – CEO

F INANCIAL STATEMENTS
37
T R I LOG Y I N T E R N AT I O N A L L I M I T E D A N N UA L R E PO RT 31S T M ARCH 2014
the above statements of movements in equity should be read in conjunction with the accompanying notes.
attributable to equity holders of trilogy international limited
Statements of Movements in EquityFor the year ended 31 March 2014
Consolidated notes
ShareCapital
$’000
AccumulatedLosses
$’000Reserves
$’000
TotalEquity
$’000
Balance as at 1 April 2012 29,195 (9,654) (2) 19,539Profit for the year 21(b) - 34 - 34Foreign currency translation 21(a) - - (63) (63)
Total comprehensive income - 34 (63) (29)
Transactions with shareholders
Issue of ordinary shares 20
For cash in April 2,000 - - 2,000For cash from series 2 warrant allotment 3 - - 3Issued in July 253 - - 253Shares in lieu of Directors’ fees 43 - - 43Share issue costs (13) - - (13)
2,286 - - 2,286
Balance as at 31 March 2013 31,481 (9,620) (65) 21,796
Balance as at 1 April 2013 31,481 (9,620) (65) 21,796Profit for the year 21(b) - 1,070 - 1,070Foreign currency translation 21(a) - - (774) (774)
Total comprehensive income - 1,070 (774) 296
Transactions with shareholders
Issue of ordinary shares 20
For cash from series 2 warrant allotment 778 - - 778Shares in lieu of Directors’ fees 101 - - 101Share issue costs (4) - - (4)
875 - - 875
Share based payments 21(a) - - 19 19
Balance as at 31 March 2014 32,356 (8,550) (820) 22,986

F INANCIAL STATEMENTS
38
T R I LOG Y I N T E R N AT I O N A L L I M I T E D A N N UA L R E PO RT 31S T M ARCH 2014
the above statements of movements in equity should be read in conjunction with the accompanying notes.
Statements of Movements in EquityFor the year ended 31 March 2014
Parent notes
ShareCapital
$’000
Accumulated Losses
$’000Reserves
$’000
TotalEquity
$’000
Balance as at 1 April 2012 29,195 (1,515) - 27,680Profit for the year 21(b) - 395 - 395
Total comprehensive income - 395 - 395
Transactions with shareholders
Issue of ordinary shares 20
For cash in April 2,000 - - 2,000For cash from series 2 warrant allotment 3 - - 3Issued in July 253 - - 253Shares in lieu of Directors’ fees 43 - - 43Share issue costs (13) - - (13)
2,286 - - 2,286
Balance as at 31 March 2013 31,481 (1,120) - 30,361
Balance as at 1 April 2013 31,481 (1,120) - 30,361Loss for the year 21(b) - (1,068) - (1,068)
Total comprehensive income - (1,068) - (1,068)
Transactions with shareholders
Issue of ordinary shares 20
For cash from series 2 warrant allotment 778 - - 778Shares in lieu of Directors’ fees 101 - - 101Share issue costs (4) - - (4)
875 - - 875
Share based payments 21(a) - - 19 19
Balance as at 31 March 2014 32,356 (2,188) 19 30,187

F INANCIAL STATEMENTS
39
T R I LOG Y I N T E R N AT I O N A L L I M I T E D A N N UA L R E PO RT 31S T M ARCH 2014
Statements of Cash FlowsFor the year ended 31 March 2014
the above statements of cash flows should be read in conjunction with the accompanying notes.
notes
ConsolidatedYear ended
2014$’000
ConsolidatedYear ended
2013$’000
ParentYear ended
2014$’000
ParentYear ended
2013$’000
Cash flows from operating activities
Receipts from customers (inclusive of goods and services tax) 31,748 28,596 430 71
Payments to suppliers and employees (inclusive of goods and services tax) (29,749) (28,474) (1,039) (1,084)
Government grants received - 8 - -Interest received 8 11 1 2Interest paid (500) (591) (505) (564)Taxation (paid)/received (31) (30) - 2Net cash inflow / (outflow) from operating activities 25 1,476 (480) (1,113) (1,573)
Cash flows from investing activities
Payments for plant and equipment (221) (751) - -Proceeds from sale of plant and equipment - 25 - -Payments for intangible assets (55) (251) - -Loan repaid by subsidiary - - 6,345 7,325Loan advanced to subsidiary - - (3,924) (6,525)Net cash inflow / (outflow) from investing activities (276) (977) 2,421 800
Cash flows from financing activities
Proceeds from borrowings 18 200 1,650 200 1,650Repayment of borrowings 18 (2,200) (3,250) (2,200) (3,250)Net proceeds from issue of shares 20 774 2,215 774 2,215Net cash inflow / (outflow) from financing activities (1,226) 615 (1,226) 615
Net increase/(decrease) in cash and cash equivalents (26) (842) 82 (158)
Cash and cash equivalents at the beginning of the period 1,109 1,904 (76) 82
Exchange gains on cash and cash equivalents 102 47 - -Cash and cash equivalents at end of period 1,185 1,109 6 (76)
Composition of cash and cash equivalents:
Cash and cash equivalents 10 1,185 1,185 6 -Bank overdraft 18 - (76) - (76)
1,185 1,109 6 (76)

F INANCIAL STATEMENTS
40
T R I LOG Y I N T E R N AT I O N A L L I M I T E D A N N UA L R E PO RT 31S T M ARCH 2014
G E N E R A L I N FO R M AT I O N
SU M M A RY O F S I G N I F I C A NT ACCO U NT I N G PO L I C I E S
F I N A N CI A L R I S K M A N AG E M E NT
CR I T I C A L ACCO U NT I N G ES T I M ATES A N D J U DG E M E NTS
S EGM E NT I N FO R M AT I O N
OTH E R I N COM E/( E XP E N D I TU R E )
E XP EN S ES
F I N A N CE I N COM ES A N D E XP E N S ES
I N COM E TA X ( E XP E N S E )/CR E D I T
C A S H A N D C A S H EQ U IVA LE NTS
TR A D E A N D OTH E R R ECE IVA B LES
I N V E NTO R I ES
S H A R ES I N SU BS I D I A R I E S
P L A NT A N D EQ U I PM E NT
D EF ER R ED TA X
I NTA N G I B LE A SS E TS
TR A D E A N D OTH E R PAYA B LES
I NTE R ES T B E A R I N G L I A B I L I T I E S
D E R IVAT IV E F I N A N CI A L I N S TR U M E NTS
CO NTR I B UTE D EQ U I T Y
R ES E RV ES A N D ACCU M U L ATE D LOSS ES
CO NT I N G E N CI ES
COM M ITM E NTS
R E L ATE D PA RT Y TR A N SAC T I O N S
R ECO N CI L I AT I O N O F P R O F I T/( LOSS ) A F TE R I N COM E TA X TO N E T C A S H I N F LOW F R OM O P E R AT I N G AC T IV I T I E S
E A R N I N GS P E R S H A R E
E V E NTS O CCU R R I N G A F TE R TH E BA L A N CE DATE
41
41
49
58
58
62
63
64
65
66
66
69
70
71
72
73
75
76
79
80
83
85
85
86
90
91
92
NOTE :
1
2
3
4
5
6
7
8
9
10
11
12
13
14
15
16
17
18
19
20
21
22
23
24
25
26
27
NOTES TO THE F INANCIAL S TATE MENTS
PAGE :

F INANCIAL STATEMENTS
41
T R I LOG Y I N T E R N AT I O N A L L I M I T E D A N N UA L R E PO RT 31S T M ARCH 2014
1 GENER AL INFOR M AT ION
Trilogy International Limited (‘the Company’) and its subsidiaries (together ‘the Group’) is a manufacturer and wholesaler of products in the home fragrance, bodycare and natural skincare categories. Its major markets are New Zealand and Australia. The Group has manufacturing operations in Australia and the head office is based in New Zealand.
The Company is a limited liability company incorporated and domiciled in New Zealand. The address of its registered office is Level 1, 116-118 Quay Street, Auckland
These financial statements have been approved for issue by the Board of Directors on 29 May 2014.
2 SUM M ARY OF S IGN I F IC ANT ACCOUNT ING POL IC I ES
The principal accounting policies adopted in the preparation of the financial statements are set out below. These policies have been consistently applied through the periods presented, unless otherwise stated.
a Basis of preparation
The Directors have prepared the financial statements on the basis that the Company and the Group are going concerns.
The financial statements have been prepared in accordance with New Zealand generally accepted accounting practice (NZ GAAP). They comply with New Zealand equivalents to International Financial Reporting Standards (NZ IFRS), and other applicable New Zealand Financial Reporting Standards, as appropriate for profit oriented entities.
The separate and consolidated financial statements of Trilogy International Limited also comply with International Financial Reporting Standards (IFRS).
The preparation of financial statements in accordance with NZ IFRS requires the use of certain critical accounting estimates. It also requires management to exercise its judgement in applying the Group’s accounting
policies. The areas involving a higher degree of judgement or complexity, or areas where assumptions and estimates are significant to the consolidated financial statements are disclosed in note 4.
New and amended standards adopted by the Company and the Group.
During the period the Group adopted Standard XRB A1 ‘Accounting Standards Framework’ issued by the External Reporting Board. XRB A1 establishes a for-profit tier structure and outlines which suite of accounting standards entities in different tiers must follow. The Group is a Tier 1 entity. There was no impact on the current or prior year financial statements.
Amendment to NZ IAS 1, ‘Financial statement presentation’ regarding other comprehensive income. The main change resulting from these amendments is a requirement for entities to group items presented in ‘other comprehensive income’ on the basis of whether they are potentially reclassifiable to profit or loss subsequently (reclassification adjustments).
NZ IFRS 10, ‘Consolidated financial statements’ builds on existing principles by identifying the concept of control as the determining factor in whether an entity should be included within the consolidated financial statements of the parent company. The standard provides additional guidance to assist in the determination of control where this is difficult to assess.
NZ IFRS 12, ‘Disclosures of interests in other entities’, includes the disclosure requirements for all forms of interests in other entities, including joint arrangements, associates, special purpose vehicles and other off balance sheet vehicles.
NZ IFRS 13, ‘Fair value measurement’, aims to improve consistency and reduce complexity by providing a precise definition of fair value and a single source of fair value measurement and disclosure requirements for use across IFRSs. The requirements, which are largely aligned between IFRSs and US GAAP, do not extend the use of fair value accounting but provide guidance on how it should be applied where its use is already required or permitted by other standards within IFRSs.
The adoption of these new standards or amendments has not resulted in material accounting or disclosure changes for the Group or Company.

F INANCIAL STATEMENTS
42
T R I LOG Y I N T E R N AT I O N A L L I M I T E D A N N UA L R E PO RT 31S T M ARCH 2014
Entities reporting
The financial statements for the ‘Parent’ are for Trilogy International Limited as a separate legal entity.
The consolidated financial statements for the ‘Group’ are for the economic entity comprising Trilogy International Limited and its subsidiaries.
Statutory base
Trilogy International Limited is a limited liability company which is domiciled and incorporated in New Zealand. It is registered under the Companies Act 1993.
The financial statements have been prepared in accordance with the requirements of the Financial Reporting Act 1993 and the Companies Act 1993.
Historical cost convention
These financial statements have been prepared under the historical cost convention, as modified by the revaluation of certain financial instruments (including derivative financial instruments) at fair value through profit or loss.
b Principles of consolidation
i Subsidiaries
The consolidated financial statements incorporate the assets and liabilities of all subsidiaries of Trilogy International Limited (‘Company’ or ‘parent entity’) as at 31 March 2014 and the results of all subsidiaries for the period then ended. Trilogy International Limited and its subsidiaries together are referred to in these financial statements as the Group or the consolidated entity.
Subsidiaries are all entities over which the Group has control. The Group controls an entity when the Group is exposed to, or has rights to, variable returns from its involvement with the entity and has the ability to affect those returns through its power over the entity. Subsidiaries are fully consolidated from the date on which control is transferred to the Group. They are deconsolidated from the date that control ceases.
The acquisition method of accounting is used to account for the acquisition of subsidiaries and
businesses by the Group.
The cost of an acquisition is measured as the fair value of the assets given, equity instruments issued and liabilities incurred or assumed at the date of exchange. The consideration transferred includes the fair value of any asset or liability resulting from a contingent consideration arrangement. Acquisition related costs are expensed as incurred. Identifiable assets acquired and liabilities and contingent liabilities assumed in a business combination are measured initially at their fair values at the acquisition date, irrespective of the extent of any non-controlling interest.
The excess of the consideration transferred, the amount of any non-controlling interest in the acquiree and the acquisition-date fair value of any previous equity interest in the acquiree over the fair value of the identifiable net assets acquired is recorded as goodwill. If the total of consideration transferred, non-controlling interest recognised and previously held interest measured is less than the fair value of the net assets of the subsidiary acquired in the case of a bargain purchase, the difference is recognised directly in the income statement.
Intercompany transactions, balances and unrealised gains on transactions between Group companies are eliminated. Unrealised losses are also eliminated unless the transaction provides evidence of the impairment of the asset transferred. Accounting policies of subsidiaries have been changed where necessary to ensure consistency with the policies adopted by the Group.
c Foreign currency translation
i Functional and presentation currency
Items included in the financial statements of each of the Group’s entities are measured using the currency of the primary economic environment in which the entity operates, ‘the functional currency’. The consolidated and parent financial statements are presented in New Zealand dollars, which is Trilogy International Limited’s functional and presentation currency.

F INANCIAL STATEMENTS
43
T R I LOG Y I N T E R N AT I O N A L L I M I T E D A N N UA L R E PO RT 31S T M ARCH 2014
ii Transactions and balances
Foreign currency transactions are translated into the functional currency using the exchange rates prevailing at the dates of the transactions. Foreign exchange gains and losses resulting from the settlement of such transactions and from the translation at year end exchange rates of monetary assets and liabilities denominated in foreign currencies are recognised in the profit and loss component of the statement of comprehensive income, except when recognised in other comprehensive income as qualifying net investment hedges.
Foreign exchange gains and losses that relate to borrowings are presented in the profit and loss component of the statement of comprehensive income within ‘finance income or cost’. All other foreign exchange gains and losses are presented in the profit and loss component of the statement of comprehensive income within ‘other gains/(losses) net’.
iii Group companies
The results and financial position of all the Group entities (none of which has the currency of a hyperinflationary economy) that have a functional currency different from the presentation currency are translated into the presentation currency as follows:
• Assets and liabilities for each statement of financial position item presented are translated at the closing rate at the date of that statement of financial position;
• Income and expenses for each statement of comprehensive income are translated at average exchange rates (unless this is not a reasonable approximation of the cumulative effect of the rates prevailing on the transaction dates, in which case income and expenses are translated at the dates of the transactions); and
• All resulting exchange differences are recognised in other comprehensive income in the foreign currency translation reserve.
On consolidation, exchange differences arising from the translation of any net investment in foreign
entities are taken to other comprehensive income. When a foreign operation is sold or borrowings repaid, a proportionate share of such exchange differences are recognised in the profit and loss component of the statement of comprehensive income as part of the gain or loss on sale.
Goodwill and fair value adjustments arising on the acquisition of foreign entities are treated as assets and liabilities of the foreign entities and translated at the closing rate.
d Revenue recognition
Revenue comprises the fair value for the sale of goods and services, net of value added tax (including Goods and Services Tax), rebates and discounts and after eliminating sales within the Group. Revenue is recognised as follows:
i Sales of goods
Sales of goods are recognised when a Group entity has delivered products to the customer, the customer has accepted the products and collectability of the related receivables is reasonably assured.
ii Interest income
Interest income is recognised on a time proportion basis using the effective interest method.
iii Government grants
Government grants are recognised at fair value where there is reasonable assurance that the grant will be received and the Group will comply with all the attached conditions.
Government grants relating to operating activities are included in “other income” in the statement of comprehensive income.
e Income tax
The income tax expense or revenue for the period is the total of the current period’s taxable income based on the national income tax rate for each jurisdiction plus/minus any prior years’ under/over provisions, plus/minus movements in the deferred tax balance except where the

F INANCIAL STATEMENTS
44
T R I LOG Y I N T E R N AT I O N A L L I M I T E D A N N UA L R E PO RT 31S T M ARCH 2014
movement in deferred tax is attributable to a movement in reserves.
Movements in deferred tax are attributable to temporary differences between the tax base of assets and liabilities and their carrying amounts in the financial statements and any unused tax losses or credits. Deferred tax assets and liabilities are recognised for temporary differences at the tax rates expected to apply when the assets are recovered or liabilities are settled, based on those tax rates which are enacted or substantively enacted for each jurisdiction. An exception is made for certain temporary differences arising from the initial recognition of an asset or a liability. No deferred tax asset or liability is recognised in relation to these temporary differences if they arose in a transaction, other than a business combination, that at the time of the transaction did not affect either accounting profit or loss or taxable profit or loss.
Deferred tax assets are recognised for deductible temporary differences and unused tax losses only to the extent that is probable that future taxable amounts will be available to utilise those temporary differences and losses.
Deferred tax liabilities and assets are not recognised for temporary differences between the carrying amount and tax bases of investments in controlled entities where the parent entity is able to control the timing of the reversal of the temporary differences and it is probable that the differences will not reverse in the foreseeable future.
The income tax expense or revenue attributable to amounts recognised in other comprehensive income or directly in equity are also recognised in other comprehensive income or directly in equity.
Current and deferred tax assets and liabilities of individual entities are reported separately in the consolidated financial statements unless the entities have a legally enforceable right to make or receive a single net payment of tax and the entities intend to make or receive such a net payment or to recover the current tax asset or settle the current tax liability simultaneously.
f Goods and Services Tax (GST)
The statement of comprehensive income has been prepared so that all components are stated exclusive of
GST. All items in the statement of financial position are stated net of GST, with the exception of receivables and payables, which include GST invoiced.
g Leases
Leases in which a significant portion of the risks and rewards of ownership are retained by the lessor are classified as operating leases. Payments made under operating leases (net of any incentives received from the lessor) are charged to the profit and loss component of the statement of comprehensive income on a straight line basis over the period of the lease.
h Financial instruments
Financial instruments comprise cash and cash equivalents, trade and other receivables, trade and other payables, derivative financial instruments and borrowings.
Financial assets and financial liabilities are recognised on the Group’s statement of financial position when the Group becomes a party to the contractual provisions of the instrument.
i Cash and cash equivalents
Cash and cash equivalents includes cash on hand, deposits held at call with financial institutions, other short term, highly liquid investments with original maturities of three months or less that are readily convertible to known amounts of cash and which are subject to an insignificant risk of changes in value, and bank overdrafts. Bank overdrafts are shown within interest bearing liabilities in current liabilities on the statement of financial position.
j Trade receivables
Trade receivables are recognised initially at fair value and subsequently measured at amortised cost using the effective interest method, less provision for doubtful debts. Trade receivables are due for settlement between 30-90 days from invoice date.
Collectability of trade receivables is reviewed on an ongoing basis. Debts which are known to be uncollectible are written off. A provision for doubtful receivables is

F INANCIAL STATEMENTS
45
T R I LOG Y I N T E R N AT I O N A L L I M I T E D A N N UA L R E PO RT 31S T M ARCH 2014
established when there is objective evidence that the Group will not be able to collect all amounts due according to the original terms of receivables. The amount of the provision is the difference between the asset’s carrying amount and the present value of estimated future cash flows, discounted at the effective interest rate.
The loss is recognised in the profit and loss component of the statement of comprehensive income within ‘administration expenses’. When a trade receivable is uncollectible, it is written off against the allowance account for trade receivables. Subsequent recoveries of amounts previously written off are credited against ‘administration expense’ in the statement of comprehensive income.
k Financial assets
The Group classifies its financial assets in the following categories: loans and receivables and financial assets at fair value through profit and loss. The classification depends on the purpose for which the financial assets were acquired. Management determines the classification of its financial assets at initial recognition and re evaluates this designation at each reporting date.
i Loans and receivables
Loans and receivables are non derivative financial assets with fixed or determinable payments that are not quoted in an active market. They arise when the Group provides money, goods or services directly to a debtor with no intention of selling the receivable. They are included in current assets, except for those with maturities greater than 12 months after the statement of financial position date which are classified as non current assets. The Group’s loans and receivables comprise ‘trade and other receivables’ and ‘cash and cash equivalents’ in the statement of financial position.
ii Financial assets at fair value through profit or loss
This category has two sub-categories: financial assets held for trading, and those designated at fair value through profit or loss on initial recognition. For
accounting purposes, derivatives are categorised as held for trading unless they are designated as hedges. Assets in this category are classified as current assets if they are either held for trading or are expected to be realised within 12 months of the statement of financial position date.
Purchases and sales of financial assets are recognised on trade date, the date on which the Group commits to purchase or sell the asset. Loans and receivables are initially recognised at fair value and subsequently carried at amortised cost using the effective interest method.
The Group establishes fair value by using valuation techniques. These include reference to the fair values of recent arm’s length transactions, involving the same instruments or other instruments that are substantially the same, and discounted cash flow analysis.
l Fair value estimation
The fair value of financial assets and financial liabilities must be estimated for recognition and measurement or for disclosure purposes.
The carrying value of cash and cash equivalents, receivables, payables and accruals and the current portion of borrowings are assumed to approximate their fair values due to the short term maturity of these investments. The fair value of financial liabilities for disclosure purposes is estimated by discounting the future contractual cash flows at the current market interest rate that is available to the Group for similar financial instruments. The fair value of forward exchange contracts is determined using forward exchange market rates at the statement of financial position date.
m Derivative financial instruments
The Group uses derivative financial instruments to hedge its exposure to foreign exchange risks. The Group does not hold or issue derivative financial instruments for trading purposes. However, derivatives that do not qualify for hedge accounting are accounted for as trading instruments.
F INANCIAL STATEMENTS
46
T R I LOG Y I N T E R N AT I O N A L L I M I T E D A N N UA L R E PO RT 31S T M ARCH 2014
Derivative financial instruments are initially recognised at fair value on the date a derivative contract is entered into and are re-measured at their fair value at subsequent reporting dates. The method of recognising the resulting gain or loss depends on whether the derivative is designated as a hedging instrument and, if so, the nature of the item being hedged. Up to and including 31 March 2014, the Group has not designated the forward foreign exchange contracts used as hedging instruments, therefore the derivatives do not qualify for hedge accounting.
The full fair value of a hedging derivative is classified as a non-current asset or liability when the remaining maturity of the hedged item is more than 12 months; it is classified as a current asset or liability when the remaining maturity of the hedged item is less than 12 months. Trading derivatives are classified as a current asset or liability.
Changes in the fair value of any derivative instrument that does not qualify for hedge accounting are recognised immediately in the profit and loss component of the statement of comprehensive income.
n Inventories
Raw materials and stores, work in progress and finished goods are stated at the lower of cost and net realisable value. Cost comprises direct materials, direct labour and an appropriate proportion of variable and fixed overhead expenditure, the latter being allocated on the basis of normal operating capacity. Costs are assigned to individual items of inventory on the basis of weighted average costs. Net realisable value is the estimated selling price in the ordinary course of business less the estimated costs of completion and the estimated costs necessary to make the sale.
o Investments in subsidiaries
Investments in subsidiaries in the Parent financial statements are stated at cost less impairment.
p Plant and equipment
All plant and equipment is stated at historical cost less depreciation. Historical cost includes expenditure that is directly attributable to the acquisition of the items.
Subsequent costs are included in the asset’s carrying amount or recognised as a separate asset, as appropriate, only when it is probable that future economic benefits associated with the item will flow to the Group and the cost of the item can be measured reliably. All other repairs and maintenance are charged to the statement of comprehensive income during the financial period in which they are incurred.
Depreciation is calculated using the diminishing value method to expense the cost of the assets over their useful lives. The rates are as follows:
Plant and equipment 5-67%
Furniture and office equipment 11-67%
Display equipment 13-33%
The assets’ residual values and useful lives are reviewed, and adjusted if appropriate, at each statement of financial position date.
An asset’s carrying amount is written down immediately to its recoverable amount if the asset’s carrying amount is greater than its estimated recoverable amount.
Gains and losses on disposals are determined by comparing proceeds with carrying amount. These are included in the profit and loss component of the statement of comprehensive income.
q Intangible assets
i Goodwill
Goodwill represents the excess of the cost of an acquisition over the fair value of the Group’s share of the net identifiable assets of the acquired subsidiary at the date of acquisition. Goodwill acquired in business combinations is not amortised. Instead, goodwill is tested for impairment annually, or more frequently if events or changes in circumstances indicate that it might be impaired, and is carried at cost less accumulated impairment losses. Gains and

F INANCIAL STATEMENTS
47
T R I LOG Y I N T E R N AT I O N A L L I M I T E D A N N UA L R E PO RT 31S T M ARCH 2014
losses on the disposal of an entity include the carrying amount of goodwill relating to the entity sold.
Goodwill is allocated to the cash generating units for the purpose of impairment testing and is monitored at the operating segment level.
ii Trademarks
Trademarks have a finite useful life and are carried at cost less accumulated amortisation and impairment losses. Amortisation is calculated using the straight line method to allocate the cost of trademarks over their estimated useful lives of 10 years.
iii Software and website development costs
Software and website development costs have a finite useful life. Software and website development costs are capitalised and written off over the useful economic life of 3 to 4 years.
iv Brands
Acquired brands are recorded under the heading Intangible Assets in the statement of financial position at fair value on acquisition of the brands. Where the brands have a substantial and long term sustainable value and continued investment is made in the brand e.g. through advertising expenditure, the brand is deemed to have an indefinite life and is therefore not amortised.
Brands are reviewed annually for impairment or whenever events or changes in circumstances indicate the carrying value of the brand may be impaired. No deferred tax is recognised on brands as they are deemed to have an indefinite life and therefore are not being consumed through use.
r Impairment of non financial assets
Non financial assets are reviewed for impairment whenever events or changes in circumstances indicate that the carrying amount may not be recoverable. Intangible assets that have an indefinite useful life are not subject to amortisation and are tested annually for impairment irrespective of whether any circumstances identifying a
possible impairment have been identified. An impairment loss is recognised for the amount by which the asset’s carrying amount exceeds its recoverable amount. The recoverable amount is the higher of an asset’s fair value less costs to sell and value in use. For the purposes of assessing impairment, assets are grouped at the lowest levels for which there are separately identifiable cash flows (cash generating units).
s Trade and other payables
Trade and other payables are recognised initially at fair value and subsequently measured at amortised cost using the effective interest method.
These amounts represent liabilities for goods and services provided to the Group prior to the end of financial year which are unpaid. The amounts are unsecured and are usually paid within 30 and 60 days of recognition.
t Interest bearing liabilities
Interest bearing liabilities are initially recognised at fair value, net of transaction costs incurred. Interest bearing liabilities are subsequently measured at amortised cost. Any difference between the proceeds (net of transaction costs) and the redemption amount is recognised in the profit and loss component of the statement of comprehensive income over the period of the borrowings using the effective interest method. Arrangement fees are amortised over the term of the loan facility. Other borrowing costs are expensed as incurred.
Interest bearing liabilities are classified as current liabilities unless the Group has an unconditional right to defer settlement of the liability for at least 12 months after the statement of financial position date.
u Employee benefits
i Wages and salaries, annual leave and sick leave
Liabilities for wages and salaries, including non monetary benefits, annual leave and accumulating sick leave expected to be settled within 12 months of the reporting date are recognised in other payables in respect of employees’ services up to the reporting date and are measured at the amounts expected to be paid

F INANCIAL STATEMENTS
48
T R I LOG Y I N T E R N AT I O N A L L I M I T E D A N N UA L R E PO RT 31S T M ARCH 2014
when the liabilities are settled. Liabilities for non accumulating sick leave are recognised when the leave is taken and measured at the rates paid or payable.
ii Retirement benefit obligations
Contributions to defined contribution superannuation schemes are recognised as an expense as they become payable. Prepaid contributions are recognised as an asset to the extent that a cash refund or a reduction in the future payments is available.
iii Directors’ fees
Directors can elect to take their fees in shares at average market prices for the period instead of cash (note 20). The fair value of shares issued is recognised as an expense.
v Contributed equity
Ordinary shares are classified as equity.
Incremental costs directly attributable to the issue of new shares for the acquisition of a business are shown in equity as a deduction, net of tax, from the proceeds.
w Provisions
Provisions are recognised when the Company has a present legal or constructive obligation as a result of past events; it is more likely than not that an outflow of resources will be required to settle the obligation; and the amount has been reliably estimated.
x Share schemes
The fair value of director share schemes, under which the Company receives services from directors as consideration for equity instruments of the Company, is recognised as an expense. The total amount to be expensed over the vesting period is determined by reference to the fair value of the options granted, including any equity market performance conditions and excluding the impact of any service and non-market performance vesting conditions.
Non-market performance and service conditions are included in assumptions about the number of options that
are expected to vest. The total expense is recognised over the vesting period, which is the period over which all of the specified vesting conditions are to be satisfied.
The Company revises its estimates of the number of options that are expected to vest based on the non-market vesting conditions. It recognises the impact of the revision to original estimates, if any, in the statement of comprehensive income, with a corresponding adjustment to equity over the remaining vesting period. When the options are exercised the Company issues new ordinary shares. The proceeds received net of any directly attributable transaction costs are credited to share capital.
y Standards, amendments and interpretations to existing standards that are not yet effective
Certain new standards, amendments and interpretations to existing standards have been published that are mandatory for the Group’s accounting periods beginning
on or after 1 April 2014 or later periods.
i Standard and interpretations early adopted by the Group
The Group and Company have not early adopted any new accounting standard and IFRIC interpretations in the current financial period.
ii Standards, amendments and interpretations to existing standards that are relevant to the Group, not yet effective and have not been early adopted by the Group
NZ IFRS 9, ‘Financial instruments’, addresses the classification, measurement and recognition of financial assets and financial liabilities. NZ IFRS 9 was issued in November 2009, December 2010 and December 2013. It replaces the parts of NZ IAS 39 that relate to the classification and measurement of financial instruments and hedge accounting. NZ IFRS 9 requires financial assets to be classified into two measurement categories: those measured as at fair value and those measured at amortised cost. The determination is made at initial recognition. The classification depends on the entity’s business model for managing its financial instruments and the contractual cash flow characteristics of the instrument. For financial liabilities, the standard

F INANCIAL STATEMENTS
49
T R I LOG Y I N T E R N AT I O N A L L I M I T E D A N N UA L R E PO RT 31S T M ARCH 2014
retains most of the NZ IAS 39 requirements. The main change is that, in cases where the fair value option is taken for financial liabilities, the part of a fair value change due to an entity’s own credit risk is recorded in other comprehensive income rather than the income statement, unless this creates an accounting mismatch. The new hedge accounting model more closely aligns hedge accounting with risk management activities undertaken by companies when hedging their financial and non-financial risks. The Group is yet to assess NZ IFRS 9’s full impact. The Group will also consider the impact of the remaining phases of NZ IFRS 9 when completed by the IASB.
z Segmental reporting
Operating segments are reported in a manner consistent with internal reporting provided to the chief operating decision maker. The chief operating decision maker, who is responsible for allocating resources and assessing performance of the operating segments, has been identified as the Chief Executive Officer.
3 F INANCIAL R ISK M ANAGE MENT
The Group’s activities expose it to a variety of financial risks: market risk (including currency risk and interest rate risk), credit risk and liquidity risk. The Group’s overall risk management programme focuses on the unpredictability of financial markets and seeks to minimise potential adverse effects on the financial performance of the Group. The Group uses different methods to measure different types of risk to which it is exposed. These methods include sensitivity analysis in the case of interest rate and foreign exchange risks and aging analysis for credit risk.
a Market risk
Market risk is the risk that changes in market prices, such as foreign exchange rates and interest rates, will affect the Group’s income or the value of its holdings of financial instruments. The objective of market risk management is to manage and control risk exposures within acceptable parameters while optimising the return on risk.
i Currency risk
The Group is exposed to currency risk on sales and purchases that are denominated in a currency other than the respective functional currencies of the Group’s entities, being NZ dollars (NZD) and Australian dollars (AUD). The currency risk arises primarily with respect to purchases of materials in US dollars (USD) and NZ dollars by the Australian subsidiary, and sales to international customers in US dollars (USD), GB pounds (GBP) Euros (EUR), and Japanese Yen (JPY) by the New Zealand subsidiaries.
The parent entity is exposed to currency risk on the related party receivable due from the Australian subsidiary, denominated in Australian dollars. The risk is measured using sensitivity analysis and cash flow forecasting.
After allowing for natural hedges, the Group uses forward foreign exchange contracts to manage its estimated foreign currency exposure in respect of forecast revenue received from international customers, and in respect of forecast raw material purchases.
The Group has certain investments in foreign operations whose net assets are exposed to foreign currency translation risk.
The following table summarises the Group’s exposure at the reporting date to foreign currency risk on the net monetary assets/(liabilities) of each Group entity against its respective functional currency, expressed in NZ dollars.

F INANCIAL STATEMENTS
50
T R I LOG Y I N T E R N AT I O N A L L I M I T E D A N N UA L R E PO RT 31S T M ARCH 2014
Foreign currency risk on net monetary assets/(liabilities)
Exchange rates applied
The above significant rates applied during the year.
NZD$’000
USD$’000
AUD$’000
GBP$’000
EUR$’000
JPY$’000
31 March 2014
Trilogy International Limited - - 8,258 - - -Ecoya NZ Limited - 318 2 44 50 -Ecoya Pty Limited 210 1 - - - -Trilogy Natural Products Limited - 211 950 403 196 231Trilogy International Limited Group 210 530 9,210 447 246 231
NZD$’000
USD$’000
AUD$’000
GBP$’000
EUR$’000
JPY$’000
31 March 2013
Trilogy International Limited - - 7,988 - - -Ecoya NZ Limited - 123 6,848 20 (2) -Ecoya Pty Limited 4,541 (24) - - - -Trilogy Natural Products Limited - 23 947 188 170 151Trilogy International Limited Group 4,541 122 15,783 208 168 151
AverageRate2014
AverageRate2013
ClosingRate2014
ClosingRate2013
NZD/AUD 0.885 0.789 0.937 0.804NZD/USD 0.819 0.813 0.866 0.837NZD/GBP 0.513 0.516 0.520 0.551NZD/EUR 0.609 0.632 0.630 0.653NZD/JPY 82.230 67.667 89.052 78.718

F INANCIAL STATEMENTS
51
T R I LOG Y I N T E R N AT I O N A L L I M I T E D A N N UA L R E PO RT 31S T M ARCH 2014
Sensitivity analysis – underlying exposures
A 10% weakening of the NZ dollar against the Australian dollar at 31 March 2014 would have increased/(decreased) equity and the net result for the period by the amounts shown below. Based on historical movements a 10% increase or decrease in the NZ dollar is considered to be a reasonable estimate. This analysis assumes that all other variables remain constant.
Australian dollar
The Group’s net result and equity for the period would have been $118,000 higher and $1,000,000 higher respectively (2013: $302,000 higher and $1,250,000 higher respectively). The Parent’s net result and equity for the period would have been $918,000 higher (2013: $888,000 higher).
A 10% strengthening of the NZ dollar against the Australian dollar at 31 March 2014 and 31 March 2013 would have an equal and opposite effect on the above currencies to the amounts set out above on the basis that all other variables remain constant.
The Group’s exposure to other foreign exchange movements, excluding forward foreign exchange contracts, is not material.
Sensitivity analysis – forward foreign exchange contracts
The Group is exposed to currency risk on derivative financial instruments denominated in foreign currencies.
A 10% weakening of the NZ dollar at 31 March 2014 in relation to these forward foreign exchange contracts would have decreased the Group’s equity and the net result for the period by $109,000 (2013: $361,000). The parent had no derivative financial instruments at 31 March 2014 or 31 March 2013.
A 10% strengthening of the NZ dollar at 31 March 2014 and 31 March 2013 would have an equal and opposite effect on the basis that all other variables remain constant.
ii Interest rate risk
The Group’s fair value interest rate risk at 31 March 2014 arises from bank borrowings where the interest rate is set using the customised average rate loan facility rate (CARL rate). The Group’s cash flow interest rate risk arises from bank borrowings at floating rates (floating portion of CARL). A detailed summary of the Group’s interest rate risk is given in note 18.
Sensitivity analysis
If interest rates on borrowings had been 100 basis points higher during the year, the Group’s net result and equity for the period would have been $67,000 lower (2013:$75,000 lower). Based on historical movements, a 100 basis points movement is considered to be a reasonable estimate.
A 100 basis points decrease in interest rates would have an equal and opposite effect.
iii Price risk
The Group does not enter into commodity contracts other than to meet the Group’s expected usage and sale requirements; such contracts are not settled net.
F INANCIAL STATEMENTS
52
T R I LOG Y I N T E R N AT I O N A L L I M I T E D A N N UA L R E PO RT 31S T M ARCH 2014
b Credit risk
Credit risk is the risk of financial loss to the Group if a customer or counterparty to a financial instrument fails to meet its contractual obligations. Credit risk arises from cash and cash equivalents and deposits with banks and financial institutions, as well as from the Group’s receivables due from customers. Only major banks are accepted for cash and deposit balances.
The Group has a large number of customers with only one individual customer accounting for more than 10% of the Group’s revenue. Credit risk is concentrated predominantly within Australia and New Zealand and the market for consumer products. The Group has established credit policies under which each new customer is analysed for creditworthiness before payment and delivery terms and conditions are agreed.
The Group establishes an allowance for impairment that represents its estimate of incurred losses in respect of trade and other receivables. The main components of this allowance are a specific loss component that relates to individually significant exposures, and a collective loss component established for groups of similar assets in respect of losses that have been incurred but not yet identified. The collective loss allowance is determined based on historical data of payment statistics for similar financial assets.
The maximum exposure to credit risk at the reporting date is the carrying amount of the financial assets as summarised in note 11.
c Liquidity risk
Liquidity risk is the risk that the Group will not be able to meet its financial obligations as they fall due. The Group’s approach to managing liquidity is to ensure, as far as possible, that it will always have sufficient liquidity to meet its liabilities when due, under both normal and stressed conditions, without incurring unacceptable losses or risking damage to the Group’s reputation.
The Group manages liquidity risk by continuously monitoring forecast and actual cash flows and matching the maturity profiles of financial assets and liabilities.
Maturities of financial liabilities
The following tables analyse the Group’s and the parent entity’s financial liabilities into relevant maturity groupings based on the remaining period at the reporting date to the contractual maturity date. The amounts disclosed in the table are the contractual undiscounted cash flows, including interest payments in respect of financial liabilities. Balances due within 12 months equal their carrying value as the impact of discounting is not significant. The maturity analysis of the $4,500,000 interest-bearing liabilities at 31 March 2014 assumes that no principal will be repaid until the expiration date of 30 April 2018.

F INANCIAL STATEMENTS
53
T R I LOG Y I N T E R N AT I O N A L L I M I T E D A N N UA L R E PO RT 31S T M ARCH 2014
Maturities of financial liabilities
Consolidated At 31 March 2014 notes
Less than 3 months
$’000
3 – 12months
$’000
Between1 and 2
years$’000
Between2 and 5
years$’000
Over 5years$’000
Totalcontractual
cash flows$’000
Carryingamounts
liabilities$’000
Non-derivative financial liabilities
Trade and other payables 17 2,340 - - - - 2,340 2,340
Interest bearing liabilities 18 70 209 278 5,079 - 5,636 4,500
2,410 209 278 5,079 - 7,976 6,840
ConsolidatedAt 31 March 2013 notes
Less than 3 months
$’000
3 – 12months
$’000
Between1 and 2
years$’000
Between2 and 5
years$’000
Over 5years$’000
Totalcontractual
cash flows$’000
CarryingAmounts
Liabilities$’000
Non-derivative financial liabilities
Trade and other payables 17 3,231 - - - - 3,231 3,231
Interest bearing liabilities 18 6,608 - - - - 6,608 6,576
9,839 - - - - 9,839 9,807
ParentAt 31 March 2014 notes
Less than 3 months
$’000
3 – 12months
$’000
Between1 and 2
years$’000
Between2 and 5
years$’000
Over 5years$’000
Totalcontractual
cash flows$’000
Carryingamounts
liabilities$’000
Non-derivative financial liabilities
Trade and other payables 17 320 - - - - 320 320
Interest bearing liabilities 18 70 209 278 5,079 - 5,636 4,500
390 209 278 5,079 - 5,956 4,820
ParentAt 31 March 2013 notes
Less than 3 months
$’000
3 – 12months
$’000
Between1 and 2
years$’000
Between2 and 5
years$’000
Over 5years$’000
Totalcontractual
cash flows$’000
Carryingamounts
liabilities$’000
Non-derivative financial liabilities
Trade and other payables 17 342 - - - - 342 342
Interest bearing liabilities 18 6,608 - - - - 6,608 6,576
6,950 - - - - 6,950 6,918

F INANCIAL STATEMENTS
54
T R I LOG Y I N T E R N AT I O N A L L I M I T E D A N N UA L R E PO RT 31S T M ARCH 2014
Maturities of derivative financial instruments
The Parent did not have any derivative financial liabilities at 31 March 2014 or 31 March 2013.
The table above analyses the Group’s derivative financial instruments that will be settled on a gross basis into relevant maturity groupings based on the remaining period at the statement of financial position date to the
contractual maturity date. The amounts disclosed in the table are the contractual undiscounted cash flows. They are expected to occur and affect profit or loss at various dates between statement of financial position date and the following 12 months.
Consolidatedat 31 March 2014
Less than 3months
$’000
3-12months
$’000
Forward foreign exchange contracts
Inflow 1,493 2,431Outflow (1,426) (2,338)
Consolidatedat 31 March 2013
Less than 3Months
$’000
3-12months
$’000
Forward foreign exchange contracts
Inflow 1,997 2,281Outflow (2,007) (2,289)

F INANCIAL STATEMENTS
55
T R I LOG Y I N T E R N AT I O N A L L I M I T E D A N N UA L R E PO RT 31S T M ARCH 2014
Prepayments and GST receivable do not meet the definition of a financial asset and have been excluded from the tables above.
Assets as per balance sheet notes
ConsolidatedLoans and
receivablesAt 31 March 2014
$’000
ConsolidatedMeasured at fair
value through the profit and loss
At 31 March 2014$’000
ParentLoans and
receivablesAt 31 March 2014
$’000
ParentMeasured at fair
value through the profit and loss
At 31 March 2014$’000
Trade and other receivables (net) 11 4,701 - 1 -Receivables from subsidiaries 24 - - 31,487 -Derivative financial instruments 19 - 231 - -Cash and cash equivalents 10 1,185 - 6 -
5,886 231 31,494 -
notes
ConsolidatedLoans and
receivablesAt 31 March 2013
$’000
ConsolidatedMeasured at fair
value through the profit and loss
At 31 March 2013$’000
ParentLoans and
receivablesAt 31 March 2013
$’000
ParentMeasured at fair
value through the profit and loss
At 31 March 2013$’000
Trade and other receivables (net) 11 4,223 - 1 -Receivables from subsidiaries 24 - - 33,641 -Derivative financial instruments 19 - 22 - -Cash and cash equivalents 10 1,185 - - -
5,408 22 33,642 -
d Financial instruments by category

F INANCIAL STATEMENTS
56
T R I LOG Y I N T E R N AT I O N A L L I M I T E D A N N UA L R E PO RT 31S T M ARCH 2014
d Financial instruments by category continued
Employee entitlements, GST payable and the deferred lease incentive do not meet the definition of a financial liability and have been excluded from the table above.
Liabilities as perbalance sheet notes
ConsolidatedMeasured at
amortised costAt 31 March 2014
$’000
ConsolidatedMeasured at fair
value through the profit and loss
At 31 March 2014$’000
ParentMeasured at
amortised costAt 31 March 2014
$’000
ParentMeasured at fair
value through the profit and loss
At 31 March 2014$’000
Trade payables and accrued expenses 17 1,762 - 270 -Derivative financial instruments 19 - 71 - -Interest bearing liabilities 18 4,500 - 4,500 -
6,262 71 4,770 -
notes
ConsolidatedMeasured at
amortised costAt 31 March 2013
$’000
ConsolidatedMeasured at fair
value through the profit and loss
At 31 March 2013$’000
ParentMeasured at
amortised costAt 31 March 2013
$’000
ParentMeasured at fair
value through the profit and loss
At 31 March 2013$’000
Trade payables and accrued expenses 17 2,671 - 329 -Derivative financial instruments 19 - 40 - -Interest bearing liabilities 18 6,576 - 6,576 -
9,247 40 6,905 -

F INANCIAL STATEMENTS
57
T R I LOG Y I N T E R N AT I O N A L L I M I T E D A N N UA L R E PO RT 31S T M ARCH 2014
e Fair value estimation
The Parent did not have any derivative financial instruments at 31 March 2014 or 31 March 2013.
The fair value of financial instruments traded in active markets is based on quoted market prices at the balance sheet date. These instruments are included in level 1. The Group did not have any level 1 financial instruments at 31 March 2014 (2013:nil).
The fair value of financial instruments that are not traded in an active market is determined by using valuation techniques. These valuation techniques maximise the use of observable market data where it is available and rely as little as possible on entity specific estimates. If all significant inputs required to fair value an instrument are observable, the instrument is included in level 2. The Group’s forward foreign exchange contracts are level 2 financial instruments at 31 March 2014 and 31 March 2013.
If one or more of the significant inputs is not based on observable market data, the instrument is included in level 3. The Group does not currently have any level 3 financial instruments (2013: nil).
Specific valuation techniques used to fair value instruments include:
The fair value of forward foreign exchange contracts is determined using forward exchange rates at the balance sheet date, with the resulting value discounted back to present value.
f Capital adequacy
The Board’s aim is to maintain a strong capital base to sustain future development of the business and to maintain investor and creditor confidence. During the financial year the Group raised $778,000 from the execution of Series 2 warrants (see note 20). The combination of these and the funding provided from the Bank of New Zealand gives the Group sufficient capital base to continue to grow the business.
The Group and Parent have been subject to externally imposed capital requirements regarding interest cover since 10 September 2010 in relation to the facility with Bank of New Zealand as described in Note 18. The Group and Parent have complied with these requirements for the entire period reported.
notes
Level 2Group
2014$’000
Level 2Group
2013$’000
Derivative financial instruments - assets 19 231 22Derivative financial instruments - liabilities 19 (71) (40)
160 (18)
The table below represents the Group’s assets and liabilities that are measured at fair value:

F INANCIAL STATEMENTS
58
T R I LOG Y I N T E R N AT I O N A L L I M I T E D A N N UA L R E PO RT 31S T M ARCH 2014
Estimates and judgements are continually evaluated and are based on historical experience and other factors, including expectations of future events that are believed to be reasonable under the circumstances.
The Group makes estimates and assumptions concerning the future. The resulting accounting estimates will, by definition, seldom equal the related actual results. The estimates and assumptions that have a significant risk of causing a material adjustment to the carrying amounts of assets and liabilities within the next financial year and the judgements applied are discussed below.
i Estimated impairment of goodwill and brands
The Group tests annually whether goodwill and brands have suffered any impairment, in accordance with the accounting policy stated in note 2q(i) and 2q(iv). The recoverable amounts of cash generating units have been determined based on value in use calculations. These calculations require the use of assumptions. Refer to note 16 for details of these assumptions.
ii Income taxes
Judgement is exercised in determining the timing and extent of recognition of the benefit of tax losses. The benefit of tax losses can be recognised as an asset if its recovery is ‘probable’ (more likely than not). In the absence of any track record of profitability, convincing evidence is needed of how the losses will be recovered in the future, before any deferred tax asset is recognised.
The Group has not recognised any benefit at 31 March 2014 in respect of the tax losses generated by Ecoya Pty Limited to date given that the timeframe for realising the benefit of those losses remains uncertain.
Operating segments are reported in a manner consistent with the internal reporting provided to the chief operating decision maker and the Board. The chief operating decision maker, who is responsible for allocating resources and assessing performance of the operating segments, has been identified as the Chief Executive Officer. The Group’s operating segments are ‘Home Fragrance, Bodycare’, (the Ecoya brand) and Natural Skincare (the Trilogy brand).
Management also consider the business from a geographical perspective within these two segments and have provided geographical information below.
The chief operating decision maker assesses the performance of the operating segments based on a measure of EBITDA. This measurement basis excludes fair value gains and losses on derivative financial instruments and the effects of non-recurring expenditure from operating segments. Interest income and costs are not allocated to segments as this type of activity is driven by the Group’s head office function which manages the cash position of the Group. Head office costs are allocated to segments in line with their sales.
The segment information provided to the chief operating decision maker for the reportable segments, as supplemented with information by geography, is as follows:
4 CR I T IC AL ACCOUNT ING ES T IM ATES AND JUDGE MENTS 5 SEGMENT INFOR M AT ION

F INANCIAL STATEMENTS
59
T R I LOG Y I N T E R N AT I O N A L L I M I T E D A N N UA L R E PO RT 31S T M ARCH 2014
Segment information
Year ended 31 March 2014
Australia$’000
New Zealand$’000
US$’000
UK & Ireland$’000
Rest of World$’000
Other $’000
Total$’000
Home Fragrance, Bodycare
Segment revenue 8,407 3,018 413 68 567 1,027 13,500
Revenue from external customers 8,407 3,018 413 68 567 1,027 13,500
EBITDA (4) 296 (243) (7) (55) (408) (421)Depreciation and amortisation (161) (36) - - - (150) (347)
Income tax expense - (62) - - - - (62)
Capital expenditure 81 61 - - - 55 197
Year ended 31 March 2014
Australia$’000
New Zealand$’000
US$’000
UK & Ireland$’000
Rest of World$’000
Other $’000
Total$’000
Natural Skincare
Segment revenue 4,589 5,923 315 2,190 2,494 743 16,254
Revenue from external customers 4,589 5,923 315 2,190 2,494 743 16,254
EBITDA 209 2,327 (27) 125 923 18 3,575Depreciation and amortisation - (163) - - - (57) (220)
Income tax expense (4) (121) - (3) - - (128)Capital expenditure - 63 - - - 16 79
Total revenue by geography 12,996 8,941 728 2,258 3,061 1,770 29,754

F INANCIAL STATEMENTS
60
T R I LOG Y I N T E R N AT I O N A L L I M I T E D A N N UA L R E PO RT 31S T M ARCH 2014
Segment information continued
The “Other” category displayed above refers to retail and online revenue and expenses that relate to transactions within the retail markets.
Year ended 31 March 2013
Australia$’000
New Zealand$’000
US$’000
UK & Ireland$’000
Rest of World$’000
Other $’000
Total$’000
Home Fragrance, Bodycare
Segment revenue 6,862 2,101 308 70 391 867 10,599
Revenue from external customers 6,862 2,101 308 70 391 867 10,599
EBITDA (924) (209) (625) (33) (186) (562) (2,539)Depreciation and amortisation (283) (27) - - - (97) (407)
Income tax expense - (27) - - - - (27)Capital expenditure 174 52 - - - 401 627
Year ended 31 March 2013
Australia$’000
New Zealand$’000
US$’000
UK & Ireland$’000
Rest of World$’000
Other $’000
Total$’000
Natural Skincare
Segment revenue 5,764 5,618 259 1,887 2,004 535 16,067
Revenue from external customers 5,764 5,618 259 1,887 2,004 535 16,067
EBITDA 1,268 2,279 131 347 893 (63) 4,855Depreciation and amortisation - (98) - - - (14) (112)
Income tax expense - (27) - - - - (27)Capital expenditure - 238 - - - 137 375
Total revenue by geography 12,626 7,719 567 1,957 2,395 1,402 26,666

F INANCIAL STATEMENTS
61
T R I LOG Y I N T E R N AT I O N A L L I M I T E D A N N UA L R E PO RT 31S T M ARCH 2014
Reconciliation of EBITDA to Group’s profit/(loss) before tax for the period is provided as follows:
Revenues from external customers are derived from sale of goods in the home fragrance, bodycare and natural skincare categories.
Revenues of approximately $5,020,000 (2013: $4,932,000) are derived from a single external customer. These revenues are attributable to the natural skincare segment in Australia and New Zealand.
The total of non-current assets other than deferred tax assets located in New Zealand is $16,998,000 (2013: $17,146,000), including the intangibles arising on the Trilogy acquisition in September 2010, and the total of non-current assets located in other countries is $1,966,000 (2013: $2,559,000), of which $1,963,000 (2013: $2,556,000) is in Australia.
Segment assets and liabilities are not included within the reporting to the chief operating decision maker and hence have not been included within the segment information tables above.
Year ended31 March 2014
$’000
Year ended31 March 2013
$’000
EBITDA for reportable segments 3,154 2,316Listed company costs (1,024) (973)
Group EBITDA 2,130 1,343
Gains/(losses) on derivative financial instruments 178 (45)Depreciation and amortisation (567) (519)Net finance (cost)/income (481) (691)Profit before tax 1,260 88

F INANCIAL STATEMENTS
62
T R I LOG Y I N T E R N AT I O N A L L I M I T E D A N N UA L R E PO RT 31S T M ARCH 2014
Other income
Other gains/(losses)
6 OTHER INCOME/( E XPENDITURE )
Consolidated2014
$’000
Consolidated2013
$’000
Parent2014
$’000
Parent2013
$’000
Government grants - 8 - -Transferrable tax losses (see note 24(c)) - - (11) 369
- 8 (11) 369
Consolidated2014
$’000
Consolidated2013
$’000
Parent2014
$’000
Parent2013
$’000
Foreign exchange gains/(losses) – net (134) 86 - (1)Gains/(losses) on derivative financial instruments 178 (45) - -
44 41 - (1)
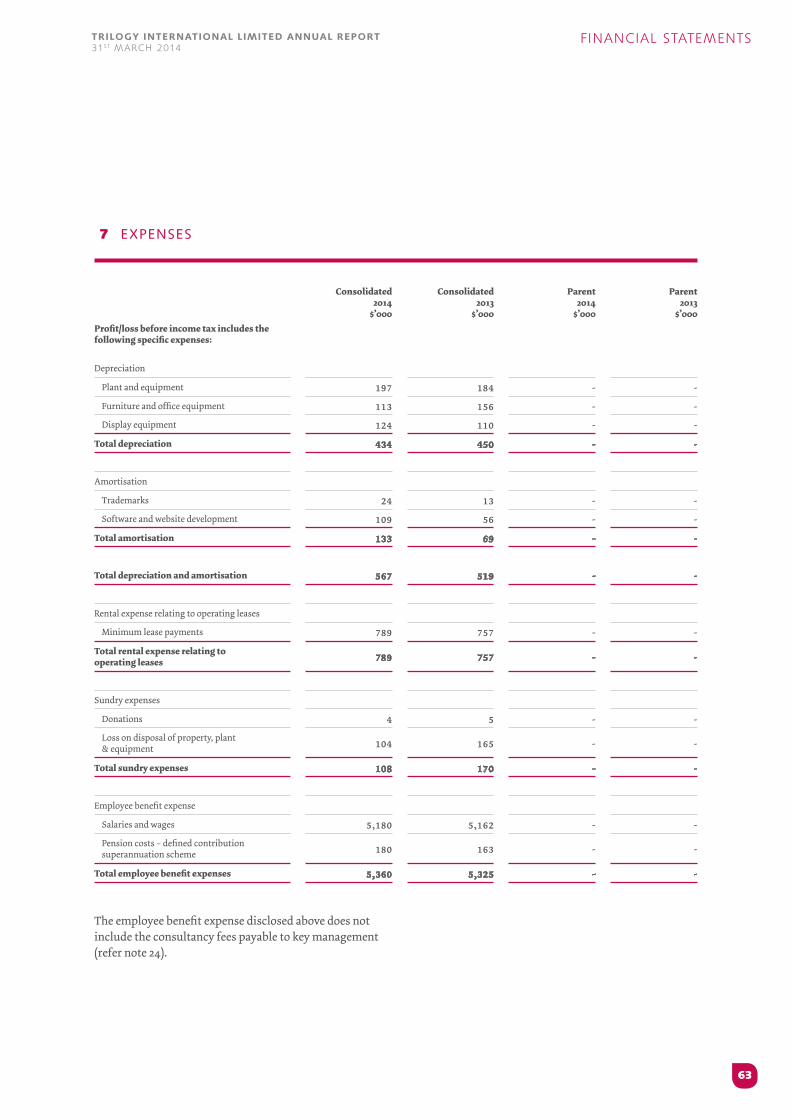
F INANCIAL STATEMENTS
63
T R I LOG Y I N T E R N AT I O N A L L I M I T E D A N N UA L R E PO RT 31S T M ARCH 2014
7 E XPENSES
The employee benefit expense disclosed above does not include the consultancy fees payable to key management (refer note 24).
Consolidated2014
$’000
Consolidated2013
$’000
Parent2014
$’000
Parent2013
$’000Profit/loss before income tax includes the following specific expenses:
Depreciation
Plant and equipment 197 184 - -Furniture and office equipment 113 156 - -Display equipment 124 110 - -
Total depreciation 434 450 - -
Amortisation
Trademarks 24 13 - -Software and website development 109 56 - -
Total amortisation 133 69 - -
Total depreciation and amortisation 567 519 - -
Rental expense relating to operating leases
Minimum lease payments 789 757 - -Total rental expense relating tooperating leases 789 757 - -
Sundry expenses
Donations 4 5 - -Loss on disposal of property, plant & equipment 104 165 - -
Total sundry expenses 108 170 - -
Employee benefit expense
Salaries and wages 5,180 5,162 - -Pension costs – defined contribution superannuation scheme 180 163 - -
Total employee benefit expenses 5,360 5,325 - -

F INANCIAL STATEMENTS
64
T R I LOG Y I N T E R N AT I O N A L L I M I T E D A N N UA L R E PO RT 31S T M ARCH 2014
Expenses: Auditors’ fees
8 F INANCE INCOME AND E XPENSES
During the year the following fees were paid or payable for services provided by the auditor of the parent entity:
Consolidated2014
$’000
Consolidated2013
$’000
Parent2014
$’000
Parent2013
$’000
(a) Assurance services
Audit and review of financial reports (note 1) 137 126 137 126Total fees 137 126 137 126
Notes:
1. the audit fee includes the fees for both the annual audit of the financial statements and the review of the interim financial statements.
Consolidated2014
$’000
Consolidated2013
$’000
Parent2014
$’000
Parent2013
$’000
Finance income
Interest received on bank balances 8 11 1 2Interest received on related party loan - - 1,114 947
Total finance income 8 11 1,115 949
Finance costs
Foreign exchange gains/(losses) on related party loan 4 (162) (1,368) (170)
Borrowings (493) (540) (493) (537)Total finance costs (489) (702) (1,861) (707)
Net finance (cost)/income (481) (691) (746) 242

F INANCIAL STATEMENTS
65
T R I LOG Y I N T E R N AT I O N A L L I M I T E D A N N UA L R E PO RT 31S T M ARCH 2014
9 INCOME TA X ( E XPENSE )/CREDI T
Consolidated2014
$’000
Consolidated2013
$’000
Parent2014
$’000
Parent2013
$’000
(a) Income tax (expense)/credit
Current tax (200) (31) - -Deferred tax (note 15) 10 (23) (118) (41)Income tax (expense)/credit (190) (54) (118) (41)
(b) Numerical reconciliation of income tax expense to prima facie tax payable
Profit/(loss) from continuing operations before income tax expense 1,260 88 (950) 436
Tax (expense)/credit calculated at applicable domestic tax rates (353) (24) 266 (122)
Foreign tax expense (10) (7) - -Tax effect of amounts which are not deductible (taxable) in calculating taxable income:
Non-deductible expenses (6) 8 (384) (56)Utilisation of tax losses not previously recognised 185 137 - 137Tax losses not recognised - (152) - -Adjustments in respect of prior years (6) (16) - -Income tax (expense)/income (190) (54) (118) (41)The applicable tax rate was 28% (2013: 28%)
(c) Imputation credits available directly and indirectly to share holders of the parent company, through:
Parent company - - - -Subsidiaries 396 373 - -
396 373 - -

F INANCIAL STATEMENTS
66
T R I LOG Y I N T E R N AT I O N A L L I M I T E D A N N UA L R E PO RT 31S T M ARCH 2014
10 C A SH AND C A SH EQUIVALENTS
11 TR ADE AND OTHER RECE IVABLES
As at 31 March 2014 cash at bank includes a bank guarantee of $89,000 (AUD $83,000) required under the terms of the Taren Point and Woollahra premises’ lease agreements (2013: $104,000, AUD $83,000). The deposit will be held for the period of the lease agreement, see note 23.
As at 31 March 2014, trade receivables of the Group of $3,997,000 (2013: $2,975,000) were fully performing. The Parent’s trade receivables of $1,000 (2013:$1,000) were fully performing.
Consolidated2014
$’000
Consolidated2013
$’000
Parent2014
$’000
Parent2013
$’000
Cash at bank and in hand 1,185 1,185 6 -
1,185 1,185 6 -
Consolidated2014
$’000
Consolidated2013
$’000
Parent2014
$’000
Parent2013
$’000
Trade receivables 4,783 4,282 1 1Provision for doubtful receivables (82) (59) - -
4,701 4,223 1 1
Amount due from related parties (see note 24) - - 484 232Prepayments 417 628 17 21GST receivable - 169 - -
5,118 5,020 502 254

F INANCIAL STATEMENTS
67
T R I LOG Y I N T E R N AT I O N A L L I M I T E D A N N UA L R E PO RT 31S T M ARCH 2014
a Impaired receivables
b Past due but not impaired receivables
As at 31 March 2014, trade receivables of $704,000 (2013: $1,248,000) were past due but not impaired. These relate to a number of customers for whom there is no recent history of default. The ageing analysis of these trade receivables is as above.
As at 31 March 2014 current trade receivables of the Group with a nominal value of $82,000 (2013: $59,000) were impaired and provided for. The amount of the provision was $82,000 (2013: $59,000) the individually impaired
receivables mainly relate to customers who are in financial difficulty or dispute. There were no impaired trade receivables for the parent in 2014 (2013: nil).
The ageing of these receivables is as follows:
Consolidated2014
$’000
Consolidated2013
$’000
Parent2014
$’000
Parent2013
$’000
31 – 60 days overdue - - - -90+ days overdue 82 59 - -
82 59 - -
Consolidated2014
$’000
Consolidated2013
$’000
Parent2014
$’000
Parent2013
$’000
1 – 30 days overdue 477 568 - -31 – 60 days overdue 161 374 - -61+ days overdue 66 306 - -
704 1,248 - -
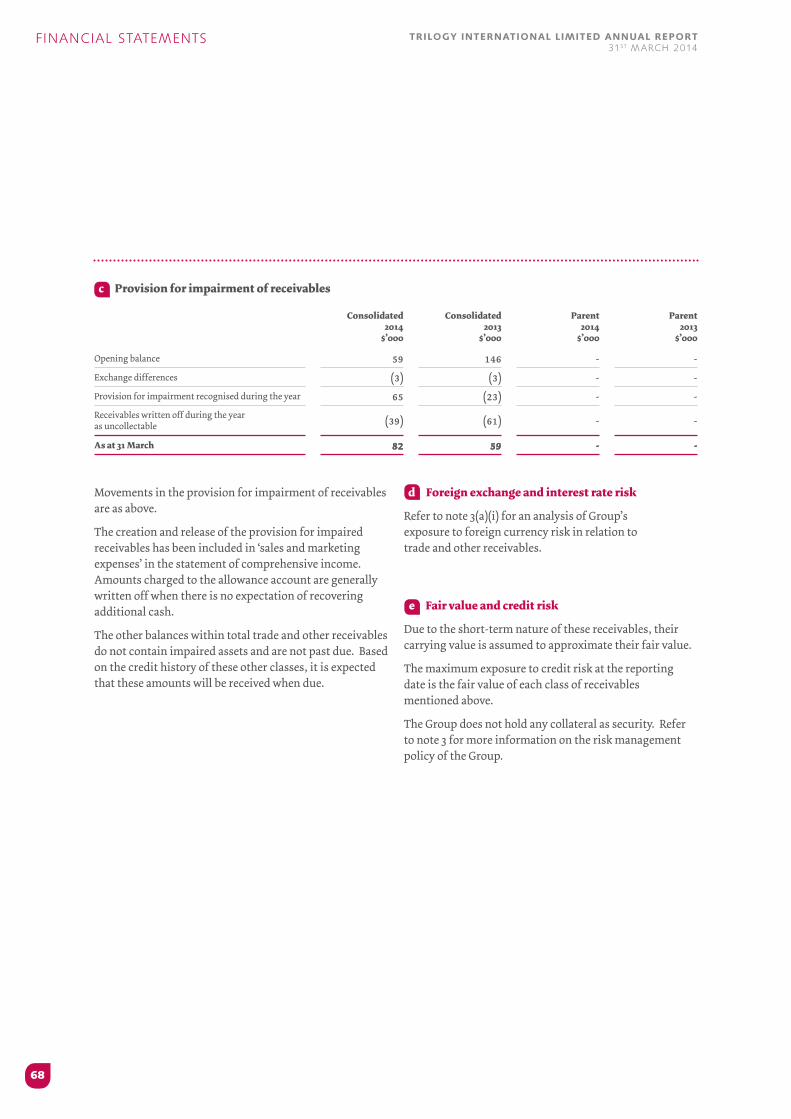
F INANCIAL STATEMENTS
68
T R I LOG Y I N T E R N AT I O N A L L I M I T E D A N N UA L R E PO RT 31S T M ARCH 2014
c Provision for impairment of receivables
Movements in the provision for impairment of receivables are as above.
The creation and release of the provision for impaired receivables has been included in ‘sales and marketing expenses’ in the statement of comprehensive income. Amounts charged to the allowance account are generally written off when there is no expectation of recovering additional cash.
The other balances within total trade and other receivables do not contain impaired assets and are not past due. Based on the credit history of these other classes, it is expected that these amounts will be received when due.
d Foreign exchange and interest rate risk
Refer to note 3(a)(i) for an analysis of Group’s exposure to foreign currency risk in relation to trade and other receivables.
e Fair value and credit risk
Due to the short-term nature of these receivables, their carrying value is assumed to approximate their fair value.
The maximum exposure to credit risk at the reporting date is the fair value of each class of receivables mentioned above.
The Group does not hold any collateral as security. Refer to note 3 for more information on the risk management policy of the Group.
Consolidated2014
$’000
Consolidated2013
$’000
Parent2014
$’000
Parent2013
$’000
Opening balance 59 146 - -Exchange differences (3) (3) - -Provision for impairment recognised during the year 65 (23) - -Receivables written off during the year as uncollectable (39) (61) - -
As at 31 March 82 59 - -
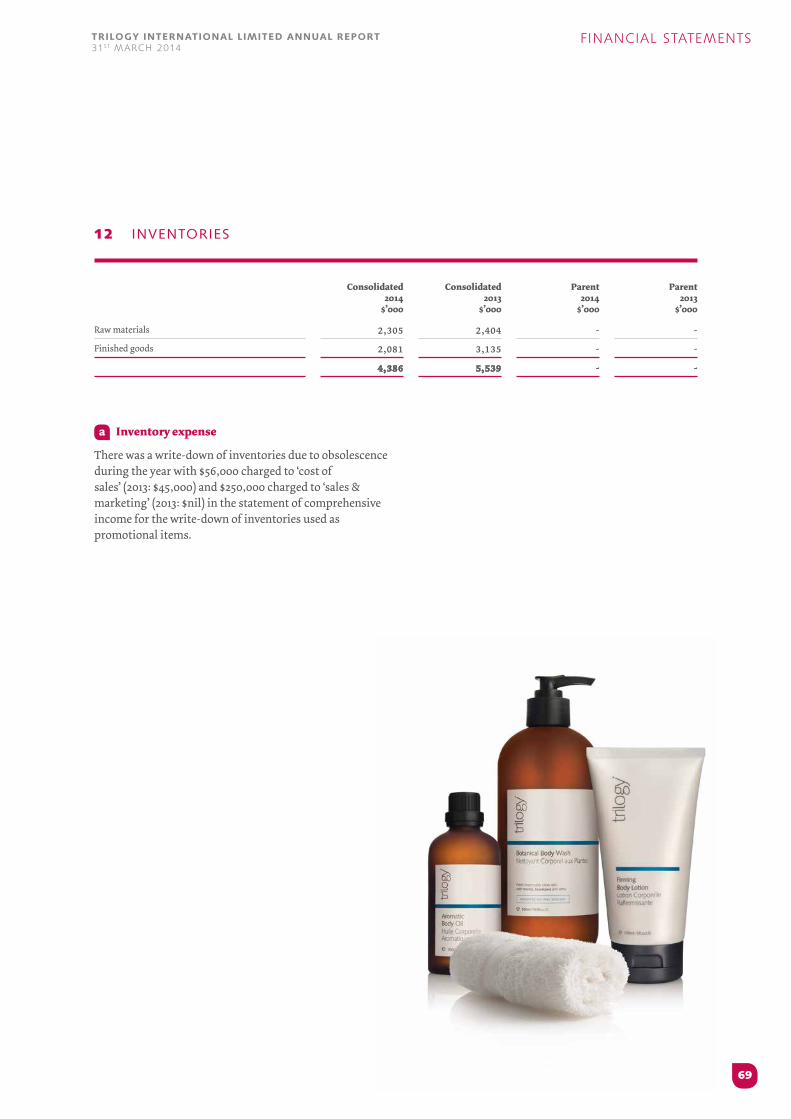
F INANCIAL STATEMENTS
69
T R I LOG Y I N T E R N AT I O N A L L I M I T E D A N N UA L R E PO RT 31S T M ARCH 2014
12 INVENTOR IES
a Inventory expense
There was a write-down of inventories due to obsolescence during the year with $56,000 charged to ‘cost of sales’ (2013: $45,000) and $250,000 charged to ‘sales & marketing’ (2013: $nil) in the statement of comprehensive income for the write-down of inventories used as promotional items.
Consolidated2014
$’000
Consolidated2013
$’000
Parent2014
$’000
Parent2013
$’000
Raw materials 2,305 2,404 - -Finished goods 2,081 3,135 - -
4,386 5,539 - -

F INANCIAL STATEMENTS
70
T R I LOG Y I N T E R N AT I O N A L L I M I T E D A N N UA L R E PO RT 31S T M ARCH 2014
Shares in subsidiaries
Investments in subsidiaries
13 SHARES IN SUBS ID IAR I ES
The consolidated financial statements incorporate the assets, liabilities and results of the above subsidiaries in accordance with the accounting policy described in note 2 (b).
Ecoya Holding Trust Limited was deregistered on 17/03/2014 and Ecoya Unit Trust was terminated on 16/12/2013.
Parent2014
$’000
Parent2013
$’000
Shares in subsidiaries at cost 3,490 3,490
Name of entity BusinessCountry of incorporation
Class ofshares
Equity holding2014
%
Equity holding2013
%
Ecoya Holding Trust Limited Non-trading Australia Ordinary - 70
Ecoya NZ Limited Trading NZ Ordinary 100 100
Ecoya Pty Limited Trading Australia Ordinary 100 100
Ecoya Unit Trust Non-trading Australia Ordinary - 70
Ecoya USA Incorporated Agency USA Ordinary 100 100
Kanara Holdings Limited Investment NZ Ordinary 100 100
Trilogy Natural Products (Aust) Pty Limited Trading Australia Ordinary 100 100
Trilogy Natural Products (UK) Limited Trading UK Ordinary 100 100
Trilogy Natural Products Limited Trading NZ Ordinary 100 100

F INANCIAL STATEMENTS
71
T R I LOG Y I N T E R N AT I O N A L L I M I T E D A N N UA L R E PO RT 31S T M ARCH 2014
14 P L ANT AND EQUIPMENT
The parent has no plant and equipment.
Consolidated
Plant and equipment
$’000
Furnitureand office
equipment$’000
Displayequipment
$’000
Motorvehicles
$’000Total$’000
Year ended 31 March 2013
Opening net book amount 1,023 570 153 21 1,767Exchange differences (21) (8) (2) - (31)Additions 307 95 349 - 751Disposals (31) (34) (36) (21) (122)Depreciation charge (184) (156) (110) - (450)Closing net book amount 1,094 467 354 - 1,915
At 31 March 2013
Cost 1,510 970 435 - 2,915Accumulated depreciation (416) (503) (81) - (1,000)Net book amount 1,094 467 354 - 1,915
Year ended 31 March 2014
Opening net book amount 1,094 467 354 - 1,915Exchange differences (143) (38) (35) - (216)Additions 86 38 97 - 221Disposals (2) (6) (83) - (91)Depreciation charge (197) (113) (124) - (434)Closing net book amount 838 348 209 - 1,395
At 31 March 2014
Cost 1,385 800 360 - 2,545Accumulated depreciation (547) (452) (151) - (1,150)Net book amount 838 348 209 - 1,395

F INANCIAL STATEMENTS
72
T R I LOG Y I N T E R N AT I O N A L L I M I T E D A N N UA L R E PO RT 31S T M ARCH 2014
15 DEFERRED TA X
Deferred income tax assets are recognised for tax loss carry forwards to the extent that the realisation of the related tax benefit through future taxable profits is probable.
a The Group
The Group has not recognised deferred income tax assets of $1,382,000 (2013: $1,928,000) in respect of losses in the Australian subsidiary amounting to $4,608,000 (2013: $6,426,000) that can be carried forward against future taxable income. These losses have no expiry date.
The Group and Parent have recognised deferred tax assets and liabilities as set out in the tables above.
As at 31 March 2014 the deferred tax assets and liabilities are considered recoverable within the next 12 months.
Consolidated Provisions
Consolidated Tax losses
ConsolidatedTotal
ParentProvisions
Parent Tax losses
ParentTotal
Deferred tax assets
At 31 March 2012 18 167 185 (2) 167 165Credited/(charged) to theincome statement 21 (41) (20) - (41) (41)
At 31 March 2013 39 126 165 (2) 126 124
Deferred tax assets
At 31 March 2013 39 126 165 (2) 126 124Credited/(charged) to theincome statement 128 (126) 2 8 (126) (118)
At 31 March 2014 167 - 167 6 - 6
Deferred tax liabilities
At 31 March 2012 (5) - (5) - - -Credited/(charged) to theincome statement (3) - (3) - - -
At 31 March 2013 (8) - (8) - - -
Deferred tax liabilities
At 31 March 2013 (8) - (8) - - -Credited/(charged) to theincome statement 8 - 8 - - -
At 31 March 2014 - - - - - -

F INANCIAL STATEMENTS
73
T R I LOG Y I N T E R N AT I O N A L L I M I T E D A N N UA L R E PO RT 31S T M ARCH 2014
16 INTANGIBLE A SSE TS
The parent has no intangible assets.
There are no internally generated assets included within intangibles.
ConsolidatedGoodwill
$’000Brand
$’000Trademarks
$’000
Software and website
development$’000
Total$’000
Year ended 31 March 2013
Opening net book amount 14,668 2,830 88 100 17,686Exchange differences (22) - - (1) (23)Disposals - - - (54) (54)Additions - - 44 207 251Amortisation charge - - (13) (57) (70)Closing net book amount 14,646 2,830 119 195 17,790
At 31 March 2013
Cost 14,646 2,830 144 277 17,897Accumulated amortisation - - (25) (82) (107)Net book amount 14,646 2,830 119 195 17,790
Year ended 31 March 2014
Opening net book amount 14,646 2,830 119 195 17,790Exchange differences (141) - - (2) (143)Disposals - - - - -Additions - - 16 39 55Amortisation charge - - (24) (109) (133)Closing net book amount 14,505 2,830 111 123 17,569
At 31 March 2014
Cost 14,505 2,830 142 268 17,745Accumulated amortisation - - (31) (145) (176)Net book amount 14,505 2,830 111 123 17,569
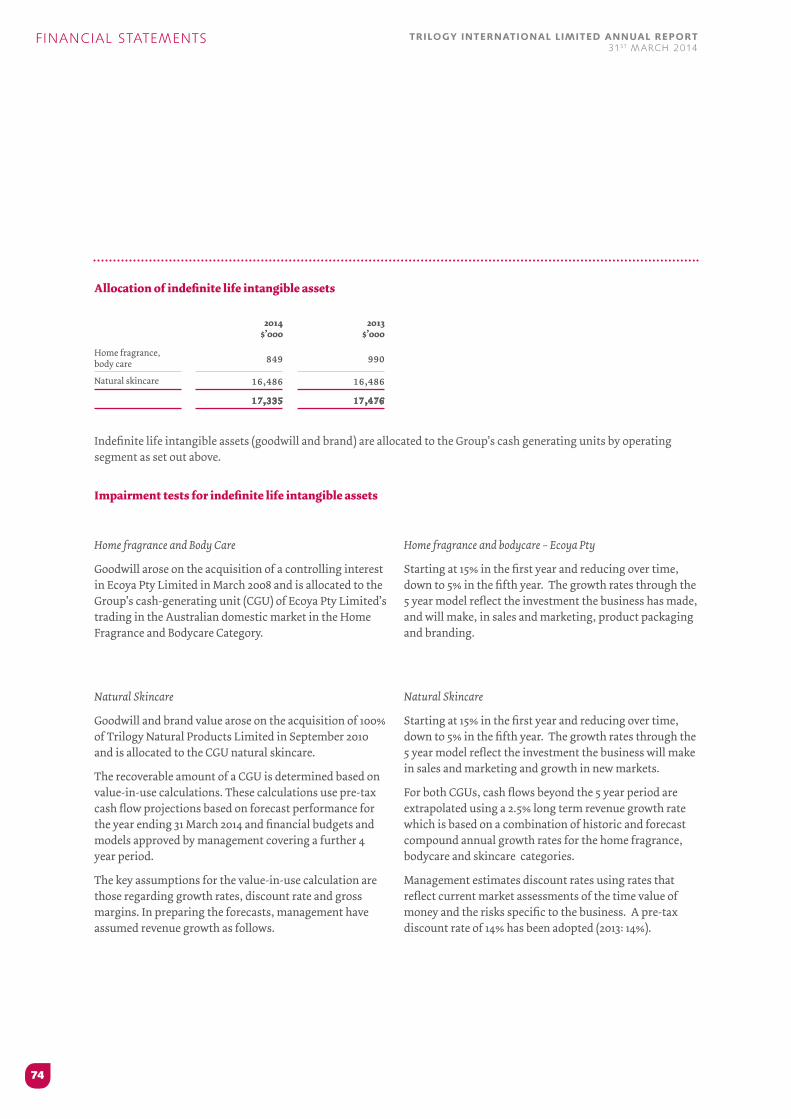
F INANCIAL STATEMENTS
74
T R I LOG Y I N T E R N AT I O N A L L I M I T E D A N N UA L R E PO RT 31S T M ARCH 2014
Indefinite life intangible assets (goodwill and brand) are allocated to the Group’s cash generating units by operating segment as set out above.
Impairment tests for indefinite life intangible assets
Allocation of indefinite life intangible assets
2014$’000
2013$’000
Home fragrance, body care 849 990
Natural skincare 16,486 16,486
17,335 17,476
Home fragrance and Body Care
Goodwill arose on the acquisition of a controlling interest in Ecoya Pty Limited in March 2008 and is allocated to the Group’s cash-generating unit (CGU) of Ecoya Pty Limited’s trading in the Australian domestic market in the Home Fragrance and Bodycare Category.
Natural Skincare
Goodwill and brand value arose on the acquisition of 100% of Trilogy Natural Products Limited in September 2010 and is allocated to the CGU natural skincare.
The recoverable amount of a CGU is determined based on value-in-use calculations. These calculations use pre-tax cash flow projections based on forecast performance for the year ending 31 March 2014 and financial budgets and models approved by management covering a further 4 year period.
The key assumptions for the value-in-use calculation are those regarding growth rates, discount rate and gross margins. In preparing the forecasts, management have assumed revenue growth as follows.
Home fragrance and bodycare – Ecoya Pty
Starting at 15% in the first year and reducing over time, down to 5% in the fifth year. The growth rates through the 5 year model reflect the investment the business has made, and will make, in sales and marketing, product packaging and branding.
Natural Skincare
Starting at 15% in the first year and reducing over time, down to 5% in the fifth year. The growth rates through the 5 year model reflect the investment the business will make in sales and marketing and growth in new markets.
For both CGUs, cash flows beyond the 5 year period are extrapolated using a 2.5% long term revenue growth rate which is based on a combination of historic and forecast compound annual growth rates for the home fragrance, bodycare and skincare categories.
Management estimates discount rates using rates that reflect current market assessments of the time value of money and the risks specific to the business. A pre-tax discount rate of 14% has been adopted (2013: 14%).

F INANCIAL STATEMENTS
75
T R I LOG Y I N T E R N AT I O N A L L I M I T E D A N N UA L R E PO RT 31S T M ARCH 2014
17 TR ADE AND OTHER PAYABLES
a Foreign currency risk
For an analysis of the sensitivity of trade and other payables to foreign currency risk refer to note 3(a)(i).
Consolidated2014
$’000
Consolidated2013
$’000
Parent2014
$’000
Parent2013
$’000
Trade payables 1,027 2,022 38 21Amount due to related parties (see note 24) 143 179 116 153
Accrued expenses 592 470 116 155GST payable 87 - 40 13Employee entitlement 491 554 10 -Deferred lease incentive - 6 - -
2,340 3,231 320 342
Consolidated2014
$’000
Consolidated2013
$’000
Parent2014
$’000
Parent2013
$’000
Australian dollars 357 527 - -United States dollars 9 30 - -New Zealand dollars 793 1,608 154 174Euros 1 10 - -Great British pounds 10 26 - -
1,170 2,201 154 174

F INANCIAL STATEMENTS
76
T R I LOG Y I N T E R N AT I O N A L L I M I T E D A N N UA L R E PO RT 31S T M ARCH 2014
18 INTERES T BE AR ING L IAB I L I T I E S
Consolidated2014
$’000
Consolidated2013
$’000
Parent2014
$’000
Parent2013
$’000
Interest bearing liability - overdraft - 76 - 76
Interest bearing liability - term loan - 6,500 - 6,500
Total current interest bearing liabilities - 6,576 - 6,576
Interest bearing liability - term loan 4,500 - 4,500 -
Total non-current interest bearing liabilities 4,500 - 4,500 -
Total interest bearing liabilities 4,500 6,576 4,500 6,576
F INANCIAL STATEMENTS
77
T R I LOG Y I N T E R N AT I O N A L L I M I T E D A N N UA L R E PO RT 31S T M ARCH 2014
On 13 May 2013, the Group agreed an updated facility with the Bank of New Zealand, refinancing the previous multi-option facility dated 29 March 2012. The new facility has an overall limit of $9,500,000 and comprises a revolving committed cash advance facility (‘CCAF’) of $2,000,000, a customised average rate loan facility (‘CARL’) of $7,000,000 and an overdraft facility of $500,000 and has an expiry date of 30 April 2018. There are no repayments due on the CCAF or CARL prior to the facility expiry date. The facility is secured by a first ranking registered and unrestricted general security agreement over the assets and undertakings of the Trilogy International Limited and Trilogy Natural Products Limited. However as this updated facility was put in place after 31 March 2013 the CARL and overdraft amounts drawn down were classified as current liabilities in the 31 March 2013 balance sheet in accordance with the 29 March 2012 facility’s repayment terms.
At 31 March 2014 the CCAF facility balance was $nil (2013: $nil).
At 31 March 2014 the CARL facility was drawn down to $4,500,000 (2013: $6,500,000). This consisted of a fixed portion of $3,000,000 with interest payable at 6.20%, and a floating portion of $1,500,000 with interest payable at 6.14% (2013: fixed portion of $2,500,000 with interest payable at 5.95%, and a floating portion of $4,000,000 with interest payable at 6.05%). The interest rate on the fixed portion was fixed for 12 months to 30 May 2014, at which time it converts to floating.
At 31 March 2014 the overdraft facility balance was $nil (2013: $76,000) with interest payable on overdrawn balances of 7.51% (2013: 5.52%).
a Fair value
The fair value of current borrowings equals their carrying amount as the impact of discounting is not significant.
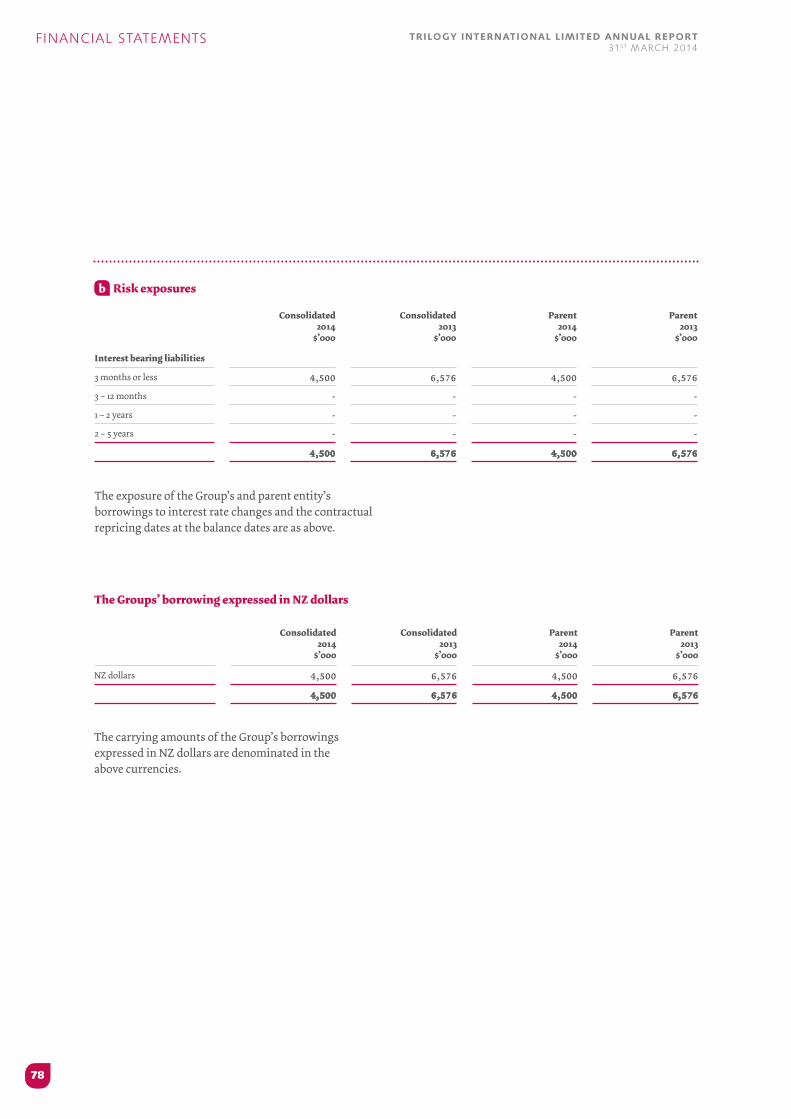
F INANCIAL STATEMENTS
78
T R I LOG Y I N T E R N AT I O N A L L I M I T E D A N N UA L R E PO RT 31S T M ARCH 2014
b Risk exposures
The exposure of the Group’s and parent entity’s borrowings to interest rate changes and the contractual repricing dates at the balance dates are as above.
The carrying amounts of the Group’s borrowings expressed in NZ dollars are denominated in the above currencies.
The Groups’ borrowing expressed in NZ dollars
Consolidated2014
$’000
Consolidated2013
$’000
Parent2014
$’000
Parent2013
$’000
Interest bearing liabilities
3 months or less 4,500 6,576 4,500 6,5763 – 12 months - - - -1 – 2 years - - - -2 – 5 years - - - -
4,500 6,576 4,500 6,576
Consolidated2014
$’000
Consolidated2013
$’000
Parent2014
$’000
Parent2013
$’000
NZ dollars 4,500 6,576 4,500 6,576
4,500 6,576 4,500 6,576

F INANCIAL STATEMENTS
79
T R I LOG Y I N T E R N AT I O N A L L I M I T E D A N N UA L R E PO RT 31S T M ARCH 2014
19 DER IVAT IVE F INANCIAL INS TRUMENTS
Consolidated2014
Assets$’000
Consolidated2014
Liabilities$’000
Parent2014
Assets$’000
Parent2014
Liabilities$’000
Forward foreign exchange contracts – Held for trading 231 71 - -
231 71 - -
Consolidated2013
Assets$’000
Consolidated2013
Liabilities$’000
Parent2013
Assets$’000
Parent2013
Liabilities$’000
Forward foreign exchange contracts – Held for trading 22 40 - -
22 40 - -
Trading derivatives are classified as a current asset or liability.
a Forward foreign exchange contracts
The notional principal amounts of the outstanding forward foreign exchange contracts at 31 March 2014 were $4,005,000 (2013:$4,278,000).
The maximum exposure to credit risk at the reporting date is the value of the derivative assets’ receivable portion for the Group of $3,924,000 (2013: $4,278,000).

F INANCIAL STATEMENTS
80
T R I LOG Y I N T E R N AT I O N A L L I M I T E D A N N UA L R E PO RT 31S T M ARCH 2014
Share capital
20 CONTR IBUTED EQUIT Y
The total authorised number of ordinary shares is 61,348,528 shares (2013: 61,180,040 shares) and the total authorised number of unlisted non-voting shares is 720,653 (2013: nil). All issued shares are fully paid.
Consolidated and Parent2014
Shares2014
$’0002013
Shares2013
$’000
Ordinary shares 61,348,528 31,635 61,180,040 31,481Unlisted non-voting shares 720,653 721 - -Authorised and issued(no par value) 62,069,181 32,356 61,180,040 31,481

F INANCIAL STATEMENTS
81
T R I LOG Y I N T E R N AT I O N A L L I M I T E D A N N UA L R E PO RT 31S T M ARCH 2014
Share capital continued
On 11 April 2012 the company issued 2,222,223 ordinary shares for $0.90 per share to two investment funds. The total issue price of $2,000,000 was settled in cash.
On 3 July 2012, following her retirement as an independent director, Collette Dinnigan purchased 225,000 ordinary shares for $1.00 per share, the issue price of $225,000 being settled in cash. The issue of these shares has been accounted for as a share-based payment, with the fair value of the shares amounting to $253,000 ($1.124 per share). The fair value was determined with reference to the market price on the grant date of 26 June 2012, discounted to allow for the terms and conditions such that these shares cannot be sold until 3 July 2013.
Warrants
During the year to 31 March 2013, 3,125 series 2 warrants were exercised for 3,125 ordinary shares.
On 15 June 2013, 777,653 series 2 warrants were exercised for 720,653 unlisted non-voting shares and 57,000 ordinary shares for total consideration amounting to $777,653, settled in cash.
Number ofordinary shares
Number of unlisted non-voting shares $’000
At 31 March 2012 58,690,568 - 29,195
Proceeds from shares allotted April 2012 2,222,223 - 2,000 Fair value of shares allotted July 2012 225,000 - 253 Proceeds from series 2 warrant allotment July 2012 3,125 - 3 Shares in lieu of directors’ fees 39,124 - 43 Share issue costs - - (13)At 31 March 2013 61,180,040 - 31,481
Proceeds from series 2 warrant allotment June 2013 57,000 720,653 778 Shares in lieu of directors’ fees 111,488 - 101 Share issue costs - - (4)At 31 March 2014 61,348,528 720,653 32,356
As part of the series 2 warrant exercise, the following shares were issued to related parties at $1 per share:
On 15 June 2013, The Business Bakery exercised 720,653 warrants for 720,653 unlisted non-voting shares. The non-voting shares have the same rights and terms and rank uniformly in all respects with ordinary shares except that they shall initially bear no voting rights. These shares can, by written notice, be reclassified as an ordinary voting share by the holder.
On 15 June 2013, interests associated with Geoff Ross exercised 24,250 warrants for 24,250 ordinary shares. An agreement to transfer 24,250 shares to The Business Bakery LP to hold and control in reliance on clause 10 of the Takeovers Code (Class Exemptions) Notice (No 2) 2001 was completed on 20 June 2013.

F INANCIAL STATEMENTS
82
T R I LOG Y I N T E R N AT I O N A L L I M I T E D A N N UA L R E PO RT 31S T M ARCH 2014
Share Based Payments
On 22 November 2013 the Company issued 200,000 options, with an exercise price of $0.80 per share to Club QT Australia Pty Ltd (an entity associated with Mandy Sigaloff, a director of Trilogy International Limited). Each ordinary share option will be converted to one ordinary share on exercise. These options vest immediately and expire on 30 September 2016. As at 31 March 2014, these options had not been exercised.
Directors’ Remuneration
Under the terms of the Company’s constitution directors can elect to take director fees in shares at average market prices for the period instead of cash. Both Richard Frank and Rob Fyfe have elected to take director fees in shares.
On 16 April 2012, 8,969 shares were issued to Rob Fyfe and 13,387 shares were issued to Richard Frank in satisfaction of director fees for the quarter 31 March 2012 net of applicable withholding taxes.
On 16 July 2012, 6,727 shares were issued to Rob Fyfe and 10,041 shares were issued to Richard Frank in satisfaction of director fees for the quarter 30 June 2012 net of applicable withholding taxes.
On 5 April 2013, 24,754 shares were issued to Rob Fyfe and 36,946 shares were issued to Richard Frank in satisfaction of director fees for the quarters ended 30 September 2012, 31 December 2012 and 31 March 2013 net of applicable withholding taxes.
On 2 October 2013, 19,524 shares were issued to Rob Fyfe and 30,264 shares were issued to Richard Frank in satisfaction of director fees for the quarters ended 30 June 2013 and 30 September 2013 net of applicable withholding taxes.
As referred above, 200,000 options were issued to Mandy Sigaloff on 22 November 2013.

F INANCIAL STATEMENTS
83
T R I LOG Y I N T E R N AT I O N A L L I M I T E D A N N UA L R E PO RT 31S T M ARCH 2014
a Reserves
21 R ESERVES AND ACCUMUL ATED LOSSES
There was no tax impact of the movement in the foreign currency translation reserve.
The foreign currency translation reserve comprises foreign exchange differences arising from the translation of the financial statements of foreign operations into New Zealand dollars and foreign exchange differences arising on the re-translation of qualifying net investment hedges (note 2(c)).
Consolidated2014
$’000
Consolidated2013
$’000
Parent2014
$’000
Parent2013
$’000
Foreign currency translation reserve (839) (65) - -Share based payment reserve 19 - 19 -
(820) (65) 19 -
(i) Foreign currency translation reserve
Opening balance (65) (2) - -Currency translation gains/(losses) (774) (63) - -Balance 31 March (839) (65) - -

F INANCIAL STATEMENTS
84
T R I LOG Y I N T E R N AT I O N A L L I M I T E D A N N UA L R E PO RT 31S T M ARCH 2014
(ii) Share based payment reserve
Consolidated2014
$’000
Consolidated2013
$’000
Parent2014
$’000
Parent2013
$’000
Opening balance - - - -Fair value of options granted 19 - 19 -Balance 31 March 19 - 19 -
2014Average exercise
price per share option
$
2014Options
2013Average exercise
price per share option
$
2013Options
Opening balance - - - -Granted 0.8 200,000 - -Balance 31 March 0.8 200,000 - -
There were 200,000 share options outstanding at the end of the year (2013 Nil) with an exercise price of $0.80 and an expiry date of 30 September 2016.
The fair value of the options granted during the period was determined using the Black-Scholes model at $0.09 per option (2013: N/A). The significant inputs into the model were a share price of $0.66 per share at grant date, the exercise price of $0.80, a volatility of 28%, an option
life of 2.7 years and a risk free rate of 3%. The volatility was measured based on a statistical analysis of daily share prices over the last 2.7 years. See Note 24 for the total expense recognised in the statement of comprehensive income for share options granted to directors. The fair value was expensed in full at the grant date as the options vested immediately.
b Accumulated losses
Consolidated2014
$’000
Consolidated2013
$’000
Parent2014
$’000
Parent2013
$’000
Opening balance (9,620) (9,654) (1,120) (1,515)Net profit/(loss) for the period attributable to equity holders of Trilogy International Limited
1,070 34 (1,068) 395
Balance 31 March (8,550) (9,620) (2,188) (1,120)
a Reserves continued

F INANCIAL STATEMENTS
85
T R I LOG Y I N T E R N AT I O N A L L I M I T E D A N N UA L R E PO RT 31S T M ARCH 2014
22 CONT INGENCIES
Commitments: Operating leases
i Operating leases
The Group leases various premises and machinery under non-cancellable operating lease agreements. The lease terms are between one and five years, and the majority of lease agreements are renewable at the end of the lease period at market rate.
The Group also leases machinery under cancellable operating lease agreements. The Group is required to give one month’s notice for termination.
Consolidated2014
$’000
Consolidated2013
$’000
Parent2014
$’000
Parent2013
$’000Commitments for minimum lease payments in relation to non-cancellable operating leases are payable as follows:
Within one year 553 610 - -Later than one but not later than five years 214 538 - -
Later than five years - - - -
767 1,148 - -
23 COM MITMENTS
As at 31 March 2014 the parent entity and the Group had no capital commitments (2013: nil).
As at 31 March 2014 the parent entity and the Group had no contingent liabilities or assets (2013: nil).
F INANCIAL STATEMENTS
86
T R I LOG Y I N T E R N AT I O N A L L I M I T E D A N N UA L R E PO RT 31S T M ARCH 2014
a Directors
The Directors during the period were:
On 6 September 2013, Mandy Sigaloff was appointed as a new Independent Director, replacing outgoing Independent Director, Rob Fyfe, who did not seek re-election to the board at the company’s annual meeting on 24 September 2013.
Date of appointment
Stephen Sinclair Chief Executive Officer 31 January 2008
Grant Baker Executive Director 31 January 2008
Geoff Ross Chairman 23 November 2009
Richard Frank Independent Director 08 February 2010
Rob Fyfe Independent Director 01 March 2010
Sarah Gibbs Non-Executive Director 07 October 2011
Mandy Sigaloff Independent Director 06 September 2013
24 R EL ATED PART Y TR ANSAC T IONS

F INANCIAL STATEMENTS
87
T R I LOG Y I N T E R N AT I O N A L L I M I T E D A N N UA L R E PO RT 31S T M ARCH 2014
b Key management and personnel compensation
Sarah Gibbs provided consulting services to the Group through an associated company, Bill & George’s Investments Limited. Independent Directors’ Fees for the period were payable to Richard Frank, Rob Fyfe and Mandy Sigaloff. Refer to note 20 for details of shares issued in lieu of fees. Under the management services agreement between Trilogy International Limited and The Business
Bakery dated 25 March 2010 Grant Baker, Stephen Sinclair and Geoff Ross provided directors and management services to the Company during the period. The Business Bakery held 49.6% of the Company’s shares at 31 March 2014 (2013: 49.1%).
Consolidated2014
$’000
Consolidated2013
$’000
Parent2014
$’000
Parent2013
$’000
Short term benefits:
Consulting fees 50 174 - -Directors’ fees (note 20) 267 327 267 327Share based payments (note 21) 19 - 19 -
Management services 455 464 - -
791 965 286 327

F INANCIAL STATEMENTS
88
T R I LOG Y I N T E R N AT I O N A L L I M I T E D A N N UA L R E PO RT 31S T M ARCH 2014
i With other related parties
During the year The Business Bakery provided rental and operational services to the Group totalling $132,000 (2013: $140,000). No marketing expenses were incurred on behalf of Trilogy International Limited during the year (2013: $22,000).
Sarah Gibbs made purchases on behalf of the Group during the year of $5,000 through her associated company, Bill & George’s Investments Limited (2013: $nil).
Mandy Sigaloff made purchases on behalf of the Group during the year of $16,000 through her associated company, ClubQT Australia Pty Limited (2013: $nil).
Craig Schweighoffer made no purchases on behalf of the Group during the year (2013: $9,000).
c Other transactionsConsolidated
2014$’000
Consolidated2013
$’000
Parent2014
$’000
Parent2013
$’000
Payables to related parties:
The Business Bakery LP (68) (70) (56) (59)Independent Directors (46) (79) (46) (79)Non-Executive Directors (28) (29) (14) (15)
(142) (178) (116) (153)

F INANCIAL STATEMENTS
89
T R I LOG Y I N T E R N AT I O N A L L I M I T E D A N N UA L R E PO RT 31S T M ARCH 2014
Parent2014
$’000
Parent2013
$’000
Receivables from subsidiaries – loan balances:
Ecoya Pty Limited 8,887 8,524Kanara Holdings Limited 7,800 10,272Trilogy Natural Products Limited 1,703 1,778Ecoya NZ Limited 12,613 12,835
31,003 33,409
Receivables from subsidiaries – trading balances:
Trilogy Natural Products Limited 484 232
484 232
ii With subsidiaries
The Company provided funding to its subsidiary in Australia during the year by way of an Australian dollar denominated loan. The loan is interest free and repayable on demand.
The Company provided funding to its subsidiaries Trilogy Natural Products Limited and Ecoya NZ
Limited during the year. These balances are repayable on demand with interest payable of 8.0% per annum.
The Company provided funding to its subsidiary Kanara Holdings Limited during the year. The loan is interest free and repayable on demand.
Parent2014
$’000
Parent2013
$’000
Intercompany charges received:
Management fees 831 1,284Interest 1,115 948Tax losses transferable to subsidiary for value (11) 369
1,935 2,601
The Company’s maximum exposure to credit risk at reporting date is the fair value of the related party receivables shown below.
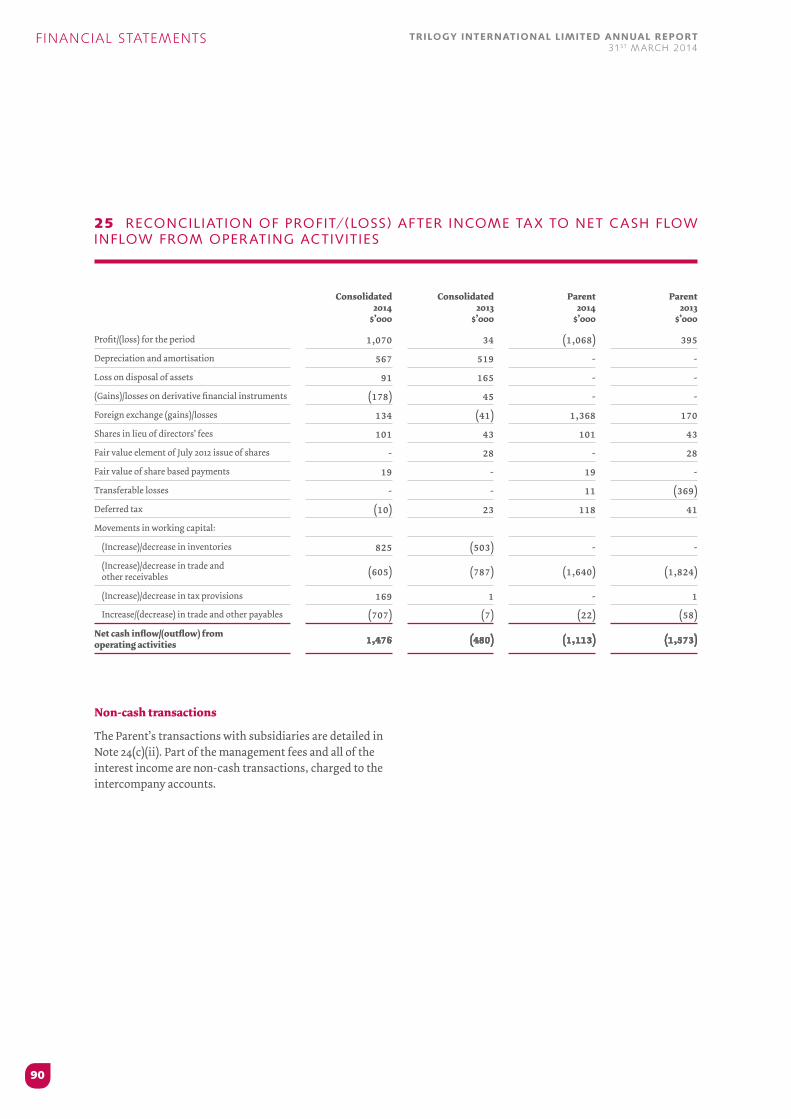
F INANCIAL STATEMENTS
90
T R I LOG Y I N T E R N AT I O N A L L I M I T E D A N N UA L R E PO RT 31S T M ARCH 2014
25 R ECONCIL IAT ION OF PROF I T/( LOSS ) AF TER INCOME TA X TO NE T C A SH F LOW INFLOW FROM OPER AT ING AC T IV I T I E S
Consolidated2014
$’000
Consolidated2013
$’000
Parent2014
$’000
Parent2013
$’000
Profit/(loss) for the period 1,070 34 (1,068) 395Depreciation and amortisation 567 519 - -Loss on disposal of assets 91 165 - -(Gains)/losses on derivative financial instruments (178) 45 - -Foreign exchange (gains)/losses 134 (41) 1,368 170Shares in lieu of directors’ fees 101 43 101 43Fair value element of July 2012 issue of shares - 28 - 28Fair value of share based payments 19 - 19 -Transferable losses - - 11 (369)Deferred tax (10) 23 118 41Movements in working capital:
(Increase)/decrease in inventories 825 (503) - -(Increase)/decrease in trade and other receivables (605) (787) (1,640) (1,824)
(Increase)/decrease in tax provisions 169 1 - 1Increase/(decrease) in trade and other payables (707) (7) (22) (58)
Net cash inflow/(outflow) from operating activities 1,476 (480) (1,113) (1,573)
Non-cash transactions
The Parent’s transactions with subsidiaries are detailed in Note 24(c)(ii). Part of the management fees and all of the interest income are non-cash transactions, charged to the intercompany accounts.
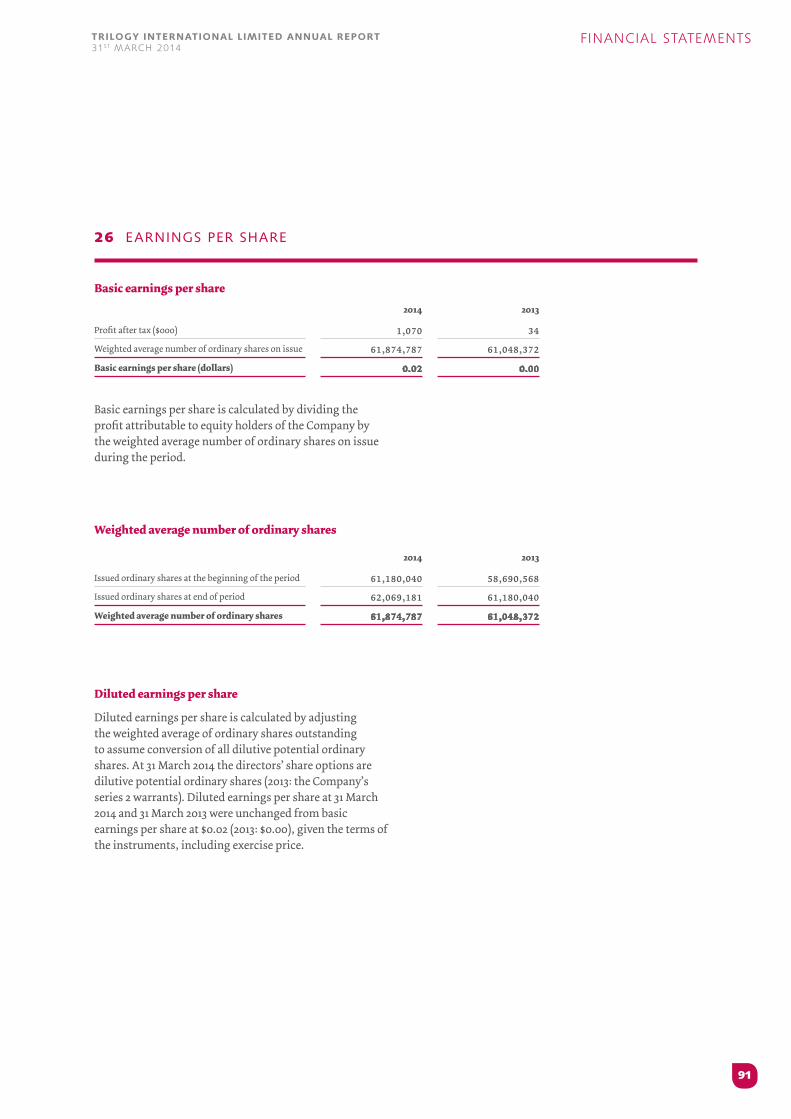
F INANCIAL STATEMENTS
91
T R I LOG Y I N T E R N AT I O N A L L I M I T E D A N N UA L R E PO RT 31S T M ARCH 2014
Basic earnings per share
Weighted average number of ordinary shares
26 E ARN INGS PER SHARE
Diluted earnings per share
Diluted earnings per share is calculated by adjusting the weighted average of ordinary shares outstanding to assume conversion of all dilutive potential ordinary shares. At 31 March 2014 the directors’ share options are dilutive potential ordinary shares (2013: the Company’s series 2 warrants). Diluted earnings per share at 31 March 2014 and 31 March 2013 were unchanged from basic earnings per share at $0.02 (2013: $0.00), given the terms of the instruments, including exercise price.
Basic earnings per share is calculated by dividing the profit attributable to equity holders of the Company by the weighted average number of ordinary shares on issue during the period.
2014 2013
Profit after tax ($000) 1,070 34Weighted average number of ordinary shares on issue 61,874,787 61,048,372Basic earnings per share (dollars) 0.02 0.00
2014 2013
Issued ordinary shares at the beginning of the period 61,180,040 58,690,568Issued ordinary shares at end of period 62,069,181 61,180,040Weighted average number of ordinary shares 61,874,787 61,048,372

F INANCIAL STATEMENTS
92
T R I LOG Y I N T E R N AT I O N A L L I M I T E D A N N UA L R E PO RT 31S T M ARCH 2014
27 E VENTS OCCURR ING AF TER THE BAL ANCE DATE
There were no events occurring after balance date which would materially affect the accuracy of these financial statements.

SHAREHOLDER & STATUTORY INFOR M ATION
93
T R I LOG Y I N T E R N AT I O N A L L I M I T E D A N N UA L R E PO RT 31S T M ARCH 2014
SHAREHOLDER & S TATUTORY INFOR M ATION


SHAREHOLDER & STATUTORY INFOR M ATION
95
T R I LOG Y I N T E R N AT I O N A L L I M I T E D A N N UA L R E PO RT 31S T M ARCH 2014
The Company’s shares are listed on the main board of the equity security market operated by NZX Limited.
The table below shows the names and holdings of the 20 largest registered holdings of quoted ordinary shares of the Company as at 2 June 2014.
in addition, the business bakery lp holds 720,653 non-voting shares in the company on this date. the non-voting shares have the same rights and terms and rank uniformly in all respects with ordinary shares except that they shall initially bear no voting rights. these shares can by written notice, be reclassified as an ordinary voting share by the holder.
Name Ordinary Shares %
The Business Bakery LP 30,088,091 49.04%Tea Custodians Limited - Nzcsd <Teac40> 5,256,271 8.57%Sarah Jane Gibbs + Independent Trust Company (2006) Limited <Sarah Jane Gibbs Family A/C> 3,201,669 5.22%
Richard Frank 1,728,506 2.82%Manical Holdings Pty Limited <Schweighoffer Family A/C> 1,593,852 2.60%Jbwere (NZ) Nominees Limited <53494> 1,527,778 2.49%Jbwere (NZ) Nominees Limited <52365 A/C> 1,333,333 2.17%Robert Ian Fyfe + Donna Leigh Fyfe + Peter Denis Brown <Fyfe Family A/C> 1,219,547 1.99%Catherine Anne De Groot + Independent Trust Company (2007 Limited <C A De Groot Family A/C> 1,150,653 1.88%
Justin Matthew Bade 1,128,731 1.84%Accident Compensation Corporation - Nzcsd <Acci40> 970,000 1.58%Stratton Sclavos 625,000 1.02%Conroy Allan Wong 445,500 0.73%Darryl Frank <Darryl B Frank Living A/C> 445,388 0.73%Paul Frank 445,388 0.73%Jbwere (Nz) Nominees Limited <53310> 444,444 0.72%David Gerald Poole + Warren James Ladbrook + Gaylene Johanne Cadwallader <Poole Family A/C> 408,000 0.67%
Custodial Services Limited <A/C 3> 254,225 0.41%Peter James Gibbs 250,000 0.41%First Nz Capital Securities Limited 238,000 0.39%Total: Top 20 Holders Of Ordinary Shares 52,754,376 85.99%Total Remaining Holders Balance 8,594,152 14.01%
61,348,528 100.00%
S TOCK E XCHANGE L IS T ING
T WENT Y L ARGES T SHAREHOLDER S

SHAREHOLDER & STATUTORY INFOR M ATION
96
T R I LOG Y I N T E R N AT I O N A L L I M I T E D A N N UA L R E PO RT 31S T M ARCH 2014
Shareholder range of units: analysis of ShareholdingAs at 2 June 2014
The above information is given pursuant to section 35F of the Securities Markets Act 1988.
The following are registered by the Company as at 2 June 2014 as Substantial Security Holders in the Company.
The total number of listed voting securities of the Company on issue at 2 June 2014 was 61,348,528 fully paid ordinary shares.
Number of Ordinary Shares %
The Business Bakery LP 30,088,091 49.04
in addition, the business bakery lp holds 720,653 non-voting shares in the company on this date. the non-voting shares have the same rights and terms and rank uniformly in all respects with ordinary shares except that they shall initially bear no voting rights. these shares can by written notice, be reclassified as an ordinary voting share by the holder.
Range Sum of Units Sum of % of Units Sum of Holder Count Holder Count %
1 to 999 25,864 0.04% 47 6.19%1,000 to 1,999 161,108 0.26% 130 17.13%2,000 to 4,999 536,525 0.87% 185 24.37%5,000 to 9,999 897,226 1.46% 143 18.84%10,000 to 49,999 3,523,947 5.74% 199 26.22%50,000 to 99,999 1,491,635 2.43% 22 2.90%100,000 to 499,999 4,888,792 7.97% 21 2.77%500,000 to 999,999 1,595,000 2.60% 2 0.26%1,000,000 to 9,999,999,999 48,228,431 78.61% 10 1.32%
61,348,528 100.00% 759 100.00%
SPRE AD OF SECUR I T Y HOLDER S
SUBS TANT IAL SECUR I T Y HOLDER S

SHAREHOLDER & STATUTORY INFOR M ATION
97
T R I LOG Y I N T E R N AT I O N A L L I M I T E D A N N UA L R E PO RT 31S T M ARCH 2014
S TATE MENT OF D IREC TOR S ’ R ELE VANT INTERES TS
DIREC TOR S ’ R E MUNER AT ION & OTHER BENEF I T S
Ordinary Shares Non-Voting Shares Share Options
Geoff Ross (1) 30,269,341 720,653 -Grant Baker(2) 30,088,091 720,653 -Stephen Sinclair (3) 30,107,342 720,653 -Sarah Gibbs 3,201,669 - -Rich Frank (4) 1,751,582 - -Mandy Sigaloff - - 200,000
(1) Relevant interest in shares held by The Business Bakery LP as a result of a limited partnership interest and shares held as registered holder and trustee for associated family trust.
(2) Relevant interest in shares held by The Business Bakery LP as a result of a limited partnership interest.
(3) Relevant interest in shares held by The Business Bakery LP as a result of a limited partnership interest and shares held by sons George Sinclair, Harry Sinclair and Oliver Sinclair.
(4) Relevant interest in shares held as registered holder and beneficial owner and registered holder and bare trustee for family trust.
Directors held the following relevant interests in equity securities in the Company as at 31 March 2014.
Details of directors’ remuneration and value of other benefits received for services to the Company for the year ended on 31 March 2014 are as shown in the table above.
Under the management services agreement between the Company and The Business Bakery dated 25 March 2010 Grant Baker, Stephen Sinclair and Geoff Ross provided directors and management services to the Company during the period.
Rich Frank and Mandy Sigaloff were considered to be independent directors and Geoff Ross, Grant Baker, Stephen Sinclair and Sarah Gibbs were not considered to be independent directors as at 31 March 2014.
$Nature ofRemuneration
Geoff Ross, Grant Baker and Stephen Sinclair 580,000 Management and directors’ fees
Rich Frank 44,925 Directors’ fees
Rob Fyfe (resigned 24/09/2013) 22,439 Directors’ fees
Mandy Sigaloff 48,430 Share based payments and directors’ fees
Sarah Gibbs 94,753 Consulting and directors’ fees
790,547
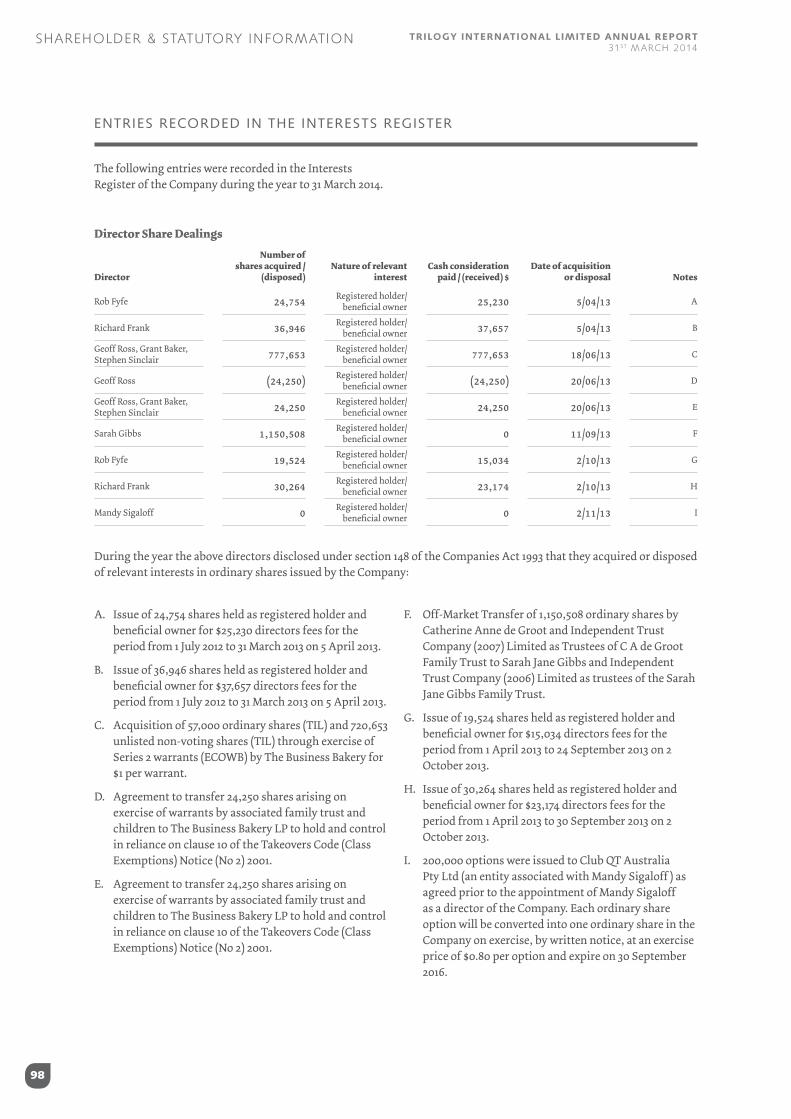
SHAREHOLDER & STATUTORY INFOR M ATION
98
T R I LOG Y I N T E R N AT I O N A L L I M I T E D A N N UA L R E PO RT 31S T M ARCH 2014
The following entries were recorded in the Interests Register of the Company during the year to 31 March 2014.
During the year the above directors disclosed under section 148 of the Companies Act 1993 that they acquired or disposed of relevant interests in ordinary shares issued by the Company:
A. Issue of 24,754 shares held as registered holder and beneficial owner for $25,230 directors fees for the period from 1 July 2012 to 31 March 2013 on 5 April 2013.
B. Issue of 36,946 shares held as registered holder and beneficial owner for $37,657 directors fees for the period from 1 July 2012 to 31 March 2013 on 5 April 2013.
C. Acquisition of 57,000 ordinary shares (TIL) and 720,653 unlisted non-voting shares (TIL) through exercise of Series 2 warrants (ECOWB) by The Business Bakery for $1 per warrant.
D. Agreement to transfer 24,250 shares arising on exercise of warrants by associated family trust and children to The Business Bakery LP to hold and control in reliance on clause 10 of the Takeovers Code (Class Exemptions) Notice (No 2) 2001.
E. Agreement to transfer 24,250 shares arising on exercise of warrants by associated family trust and children to The Business Bakery LP to hold and control in reliance on clause 10 of the Takeovers Code (Class Exemptions) Notice (No 2) 2001.
F. Off-Market Transfer of 1,150,508 ordinary shares by Catherine Anne de Groot and Independent Trust Company (2007) Limited as Trustees of C A de Groot Family Trust to Sarah Jane Gibbs and Independent Trust Company (2006) Limited as trustees of the Sarah Jane Gibbs Family Trust.
G. Issue of 19,524 shares held as registered holder and beneficial owner for $15,034 directors fees for the period from 1 April 2013 to 24 September 2013 on 2 October 2013.
H. Issue of 30,264 shares held as registered holder and beneficial owner for $23,174 directors fees for the period from 1 April 2013 to 30 September 2013 on 2 October 2013.
I. 200,000 options were issued to Club QT Australia Pty Ltd (an entity associated with Mandy Sigaloff ) as agreed prior to the appointment of Mandy Sigaloff as a director of the Company. Each ordinary share option will be converted into one ordinary share in the Company on exercise, by written notice, at an exercise price of $0.80 per option and expire on 30 September 2016.
Director
Number of shares acquired /
(disposed)Nature of relevant
interestCash consideration
paid / (received) $Date of acquisition
or disposal Notes
Rob Fyfe 24,754 Registered holder/beneficial owner 25,230 5/04/13 A
Richard Frank 36,946 Registered holder/beneficial owner 37,657 5/04/13 B
Geoff Ross, Grant Baker, Stephen Sinclair 777,653 Registered holder/
beneficial owner 777,653 18/06/13 C
Geoff Ross (24,250) Registered holder/beneficial owner (24,250) 20/06/13 D
Geoff Ross, Grant Baker, Stephen Sinclair 24,250 Registered holder/
beneficial owner 24,250 20/06/13 E
Sarah Gibbs 1,150,508 Registered holder/beneficial owner 0 11/09/13 F
Rob Fyfe 19,524 Registered holder/beneficial owner 15,034 2/10/13 G
Richard Frank 30,264 Registered holder/beneficial owner 23,174 2/10/13 H
Mandy Sigaloff 0 Registered holder/beneficial owner 0 2/11/13 I
ENTR I ES RECORDED IN THE INTERES TS REG IS TER
Director Share Dealings

SHAREHOLDER & STATUTORY INFOR M ATION
99
T R I LOG Y I N T E R N AT I O N A L L I M I T E D A N N UA L R E PO RT 31S T M ARCH 2014
The remuneration of Independent Directors is recorded in the interests register. All Independent Directors receive an annual fee of A$40,000 with the exception of Mandy Sigaloff who receives NZ$50,000. Actual fees received in the year 31 March 2014 are stated above under the heading “Directors’ Remuneration and Other Benefits.”
The Business Bakery LP (associated with Executive Directors Grant Baker, Geoff Ross and Stephen Sinclair) is paid fees in connection with the Executive Director services provided on its behalf by Grant Baker, Geoff Ross and Stephen Sinclair pursuant to a consultancy agreement dated 25 March 2010. Total payments made under this agreement during the year ended 31 March 2014 were NZ$580,000.
Bill & George’s Investments Ltd (associated with Non-Executive Director Sarah Gibbs) is paid fees pursuant to a Consulting agreement dated 9 January 2012 (which commenced 1 January 2012). Bill and George’s Investments Ltd also receives Directors’ fee on behalf of Sarah Gibbs based on an annual fee of A$40,000. Total payments made under these agreements during the year were $94,753.
On 22 November 2013 the Company issued 200,000 options, with an exercise price of $0.80 per share to Club QT Australia Pty Ltd (an entity associated with Mandy Sigaloff, a director of Trilogy International Limited). Each ordinary share option will be converted to one ordinary share on exercise. These options vest immediately and expire on 30 September 2016. As at 31 March 2014, these options had not been exercised.
The company entered into an indemnity in favour of its directors under a deed dated 25 March 2010. The deed was subsequently amended on 27 April 2010.
The following represents the interests of Directors in other companies as disclosed to the Company and entered in the Interests Register:
Sarah Gibbs
The Cosmetic, Toiletry and Fragrance Association, Director.
Export New Zealand Board, Director.
Marmot Capital (GP) Limited & Marmot Capital Limited, Investment Committee Member.
New Zealand Extracts Ltd, Director (resigned 26/02/2014).
Positively Wellington Trust, Trustee.
Geoff Ross
The Business Bakery LP, Director of general partner and limited partner through associated family trust.
Moa Group Limited, Director.
Grant Baker
The Business Bakery LP, Director of general partner and limited partner through associated family trust.
Dorchester Pacific Limited, Director.
Moa Group Limited, Director.
Stephen Sinclair
The Business Bakery LP, Director of general partner and limited partner through associated family trust.
Dorchester Pacific Limited, Alternate Director.
Mandy Sigaloff
ClubQT Australia Pty Ltd, Director.
OTHER D IREC TOR SH IP S D IREC TOR S ’ R E MUNER AT ION
SHARE BA SED PAYMENTS
INDE MNIT Y & INSUR ANCE

SHAREHOLDER & STATUTORY INFOR M ATION
100
T R I LOG Y I N T E R N AT I O N A L L I M I T E D A N N UA L R E PO RT 31S T M ARCH 2014
Remuneration Range$NZ Number of Employees
100,000 – 110,000 4
110,000 – 120,000 4
120,000 – 130,000 1
130,000 – 140,000 1
140,000 – 150,000 2
150,000 – 160,000 1
160,000 – 170,000 1170,000 – 180,000 2180,000 – 190,000 1190,000 – 200,000 1
The Company does not have a formal diversity policy. However it recognises the wide-ranging benefits that diversity brings to an organisation and its workplaces.
As at 31 March 2014, and 31 March 2013 the gender balance of the Company’s Directors, Officers and Employees is as below.
During the year, the number of employees, not being Directors of the Company, who received remuneration and the value of other benefits exceeding NZ$100,000 was as follows:
2014 Directors Officers Employees
No. % No. % No. %
Female 2 33% 5 63% 75 82%Male 4 67% 3 38% 17 18%Total 6 100% 8 100% 92 100%
2013 Directors Officers Employees
No. % No. % No. %
Female 1 17% 5 63% 72 81%Male 5 83% 3 38% 17 19%Total 6 100% 8 100% 89 100%
E MPLOYEES ’ R E MUNER AT ION
DIVER S I T Y POL IC Y
SHAREHOLDER & STATUTORY INFOR M ATION
101
T R I LOG Y I N T E R N AT I O N A L L I M I T E D A N N UA L R E PO RT 31S T M ARCH 2014
None were obtained.
The amounts payable to PricewaterhouseCoopers as auditor of the Company are as set out in the notes to the financial statements.
NZ X WA IVER S OBTA INED DUR ING THE YE AR TO 31 M ARCH 2014
AUDIT F EES

SHAREHOLDER & STATUTORY INFOR M ATION
102
T R I LOG Y I N T E R N AT I O N A L L I M I T E D A N N UA L R E PO RT 31S T M ARCH 2014
T R I - N E X T - 0 1 0 4 - 1 2 0 1 4 - 0 2 - 2 7 T 1 0 : 3 1 : 5 3 + 1 3 : 0 0

CORPOR ATE D IRECTORY& SHAREHOLDER INFOR M ATION
103
T R I LOG Y I N T E R N AT I O N A L L I M I T E D A N N UA L R E PO RT 31S T M ARCH 2014
CORPOR ATE D IREC TORY & SHAREHOLDER INFOR M ATION

CORPOR ATE D IRECTORY& SHAREHOLDER INFOR M ATION
104
T R I LOG Y I N T E R N AT I O N A L L I M I T E D A N N UA L R E PO RT 31S T M ARCH 2014

CORPOR ATE D IRECTORY& SHAREHOLDER INFOR M ATION
105
T R I LOG Y I N T E R N AT I O N A L L I M I T E D A N N UA L R E PO RT 31S T M ARCH 2014
Registered Office and Address for Service
Level 1, Union Fish Building 116-118 Quay Street, Auckland 1010 Telephone: +64 9 367 9464 Facsimile: +64 9 367 9473 Website: www.trilogyproducts.com/investors
Auditor
PricewaterhouseCoopers
Banker
Bank of New Zealand
Solicitor
Chapman Tripp
Directors
Mr Grant Baker Executive Director Appointed 31 January 2008
Mr Stephen Sinclair Chief Executive Officer Appointed 31 January 2008
Mr Geoff Ross Chairman Appointed 23 November 2009
Mr Rich Frank Independent Director Appointed 8 February 2010
Ms Sarah Gibbs Non- Executive Director Appointed 7 October 2011
Ms Mandy Sigaloff Independent Director Appointed 6 September 2013
CORPOR ATE D IREC TORY

CORPOR ATE D IRECTORY& SHAREHOLDER INFOR M ATION
106
T R I LOG Y I N T E R N AT I O N A L L I M I T E D A N N UA L R E PO RT 31S T M ARCH 2014
SHAREHOLDER INFOR M AT ION
Company Publications
The Company informs investors of the Company’s business and operations by issuing an Annual Report and an Interim Report.
Financial Calendar
Half year results announced ............................. November Half year report ................................................. December End of financial year .............................................31 March Annual results announced .......................................... May Annual report ..............................................................June
Enquiries
Shareholders with enquiries about transactions or change of address should contact Computershare Investor Services on +64 9 488 8777.
Other questions should be directed to the Company at the registered address.
Share Register
Computershare Investor Services Limited Level 2, 159 Hurstmere Road Takapuna, North Shore City 0622 Private Bag 92 119, Auckland 1142, New Zealand Telephone : +64 9 488 8777 Facsimile : +64 9 488 8787
Stock Exchange
The Company’s shares trade on the NZSX market operated by NZX Limited under the code TIL.

T R I LOG Y I N T E R N AT I O N A L L I M I T E D A N N UA L R E PO RT 31S T M ARCH 2014
H IGHL IGHTS
107
GRE AT MOM ENTS ARE BORN FROM
G R E AT O PPO RT U N I T I ES .
