ceer benchmarking report on the quality of electricity supply 2011
DESCRIPTION
CEER Benchmarking Report ON THE QUALITY OF ELECTRICITY SUPPLY 2011TRANSCRIPT
5TH CEER BENCHMARKING REPORT
ON THE QUALITY OF ELECTRICITY SUPPLY2011

5th CEER Benchmarking Report on the Quality of Electricity Supply 2011

5th CEER Benchmarking Report on the Quality of Electricity Supply iii
Preface
Preface
European Energy Regulators, working through the Council of European Energy Regulators (CEER), promote well-functioning and competitive EU energy markets so that consumers get fair prices, the widest choice of supplier and the best quality of supply possible. This quality can be measured by the number and duration of power cuts; the power surges or dips which affect our electronic equipment; or the timeliness and efficiency of the customer service provided by electricity companies.
As part of our joint efforts to facilitate the creation of a single, competitive, efficient and sustainable EU internal energy market, since 2001 we have undertaken in depth benchmarking and analysis of the quality of electricity supply in Europe, with a focus on three types of quality: continuity of supply, voltage quality and commercial quality. Indeed, as energy regulators, one of our duties is to ensure that energy companies are providing value for money for a quality product (both technically and commercially). Monitoring the quality of supply is an essential tool in the overall monitoring of a functioning electricity market, and it is our job to strike a balance between cost efficiency and quality of supply, using a variety of regulatory instruments.
Through our series of Benchmarking Reports on the Quality of Electricity Supply, CEER seeks to dissemi-nate information on the regulation of quality of supply and on the effects produced by this regulation in individual countries. It is as much an exercise in sharing good practices as it is in promoting continuing improvements to European energy regulation and quality standards. Over the years, we can see a positive trend across Europe towards improved quality and regulation in this area and we firmly believe that our col-lective work has greatly contributed to such developments.
We are very pleased that our commitment to detailed and extensive analysis of these issues continues to grow and expand. In this 5th edition, we have introduced information from ten new countries, with several case studies on the situation in Switzerland and a dedicated annex on quality of supply in the nine Energy Community contracting parties. In keeping with our dedication to the importance of the quality of the supply of electricity, the report analyses progress made since the last edition (4th Report) in 2008 and provides a series of concrete recommendations for further improvements in the regulation of the quality of electricity supply.
We hope you will find the data and analysis of interest and that the report is useful for your work. Should you require greater insight into any part of this report, we invite you to contact CEER or your national energy regulators for further information.
The Lord MoggCEER PresidentBrussels, April 2012
5th CEER Benchmarking Report on the Quality of Electricity Supply iv
List of abbreviations
List of abbreviations
Term Definition
ACER Agency for the Cooperation of Energy RegulatorsAEEG Autorità per l'energia elettrica e il gas (Italian energy regulator)AIT Average Interruption TimeAMI Advanced Metering InfrastructureAMM Automated Meter ManagementASIDI Average System Interruption Duration IndexASIFI Average System Interruption Frequency IndexBR (CEER) Benchmarking Report (on Quality of Electricity Supply)CAIDI Customer Average Interruption Duration IndexCAIFI Customer Average Interruption Frequency IndexCEE Central East EuropeCEER Council of European Energy RegulatorsCEMI Customer Experiencing Multiple Interruptions (Sweden)CENELEC European Committee for Electrotechnical StandardizationCI Customer Interruptions (United Kingdom, Ireland)CIGRE International Council on Large Electric SystemsCIRED International Conference on Electricity DistributionCML Customer Minutes Lost (United Kingdom, Ireland)CoS Continuity of SupplyCP Contracting PartyCQ Commercial QualityCRM Customer Relationship ManagementCTAIDI Customer Total Average Interruption Duration IndexDMS Distribution Management SystemDNO Distribution Network OperatorDSO Distribution System OperatorECRB Energy Community Regulatory BoardEHV Extra High Voltage ElCom Eidgenössische Elektrizitätskommission (Swiss National Regulator Authority)EMC Electromagnetic compatibilityEnC Energy CommunityEND Energy Not DistributedENS Energy Not SuppliedERSE Entidade Reguladora dos Serviços Energéticos / Energy Services Regulatory Authority
(Portuguese National Regulatory Authority)EQS TF (CEER) Electricity Quality of Supply and Smart Grids Task ForceERGEG European Regulators Group for Electricity and GasEU European UnionEURELECTRIC Eurelectric - Union of the electricity industryGGP Guidelines of Good PracticeGIS Geographic Information SystemGS Guaranteed StandardHV High VoltageIEC International Electrotechnical CommissionIEEE (formerly) Institute of Electrical and Electronics Engineers LV Low VoltageMAIFI Momentary Average Interruption Frequency IndexMAIFIE Momentary Average Interruption Event Frequency IndexMO Meter OperatorMV Medium VoltageNA Not Applicable
NIEPI “Equivalent number of interruptions related to the installed capacity” (Spain, Portugal)
5th CEER Benchmarking Report on the Quality of Electricity Supply v
List of abbreviations
Term Definition
NRA National Regulatory AuthorityNVE Norges Vassdrags - og Energidirektorat (Norwegian energy regulator)OAR Other Available RequirementOfgem Office of Gas and Electricity Markets (Great Britain energy regulator)OM Only MonitoringOS Overall StandardPQ Power Qualityr.m.s. Root mean squareRAs Regulatory AuthoritiesR-ENS Regulated Energy Not Supplied (Italy)SAIDI System Average Interruption Duration IndexSAIFI System Average Interruption Frequency IndexSCADA Supervisory Control and Data AcquisitionSEE South East EuropeSP SupplierSsc Short circuit powerTHD Total Harmonic DistortionTIEPI “Equivalent interruption time related to the installed capacity” (Spain, Portugal)T-SAIDI Transformer System Average Interruption Duration Index (Finland)T-SAIFI Transformer System Average Interruption Frequency Index (Finland)TSO Transmission System OperatorUCTE Union for the Coordination of the Transmission of ElectricityUn Nominal voltageUSP Universal SupplierVQ Voltage QualityVQM Voltage Quality MonitoringVQMS Voltage Quality Monitoring SystemVSE Association of Swiss Electricity Companieswd working day
5th CEER Benchmarking Report on the Quality of Electricity Supply vi
List of Country Abbreviations used in the Report
List of Country Abbreviations used in the Report
Abbreviation Full country name
AL AlbaniaAT AustriaBE BelgiumBA Bosnia and HerzegovinaBG BulgariaHR CroatiaCY CyprusCZ Czech RepublicDK DenmarkEE EstoniaFI FinlandFR FranceDE GermanyGR GreeceHU HungaryIS IcelandIE IrelandIT ItalyLV LatviaLT LithuaniaLU LuxembourgMK The Former Yugoslav Republic of Macedonia (FYR of Macedonia)MT MaltaME MontenegroNL The NetherlandsNO NorwayPL PolandPT PortugalRO RomaniaRS SerbiaSK Slovak RepublicSI SloveniaES SpainSE SwedenUA UkraineUNMIK The United Nations Interim Administration Mission in Kosovo UK United Kingdom (GB is used for Great Britain: England, Scotland and Wales)
5th CEER Benchmarking Report on the Quality of Electricity Supply vii
List of references
List of references
Reports and documents by the European Energy Regulators
[1] “Quality of Electricity Supply: Initial Benchmarking on Actual Levels, Standards and Regulatory Strategies”, April 2001.
http://www.energy-regulators.eu/portal/page/portal/EER_HOME/EER_PUBLICATIONS/CEER_PAPERS/Electricity/2001/1ST_CEER_
BENCHMARKING_REPORT_QUALITY_OF_SUZPPLY.PDF
[2] “2nd Benchmarking Report on Quality of Electricity Supply”, September 2003.http://www.energy-regulators.eu/portal/page/portal/EER_HOME/EER_PUBLICATIONS/CEER_PAPERS/Electricity/2003/2ND_
BENCHMARKING_REPORT_FINAL_VERSION.PDF
http://www.energy-regulators.eu/portal/page/portal/EER_HOME/EER_PUBLICATIONS/CEER_PAPERS/Electricity/2003/2ND_
BENCHMARKING_REPORT_FINAL_VERSION_ANNEX.PDF
[3] “3rd Benchmarking Report on Quality of Electricity Supply 2005”, December 2005, Ref. C05-QOS-01-03.http://www.energy-regulators.eu/portal/page/portal/EER_HOME/EER_PUBLICATIONS/CEER_PAPERS/Electricity/2005/
CEER_3RDBR-QOES_2005-12-06.PDF
[4] “4th Benchmarking Report on Quality of Electricity Supply”, December 2008, Ref. C08-EQS-24-04.http://www.energy-regulators.eu/portal/page/portal/EER_HOME/EER_PUBLICATIONS/CEER_PAPERS/Electricity/2008/C08-EQS-24-
04_4th%20Benchmarking%20Report%20EQS_10-Dec-2008_re.pdf
[5] “Position Paper on Smart Grids - An ERGEG Conclusions Paper”, 10 June 2010, Ref: E10-EQS-38-05.http://www.energy-regulators.eu/portal/page/portal/EER_HOME/EER_PUBLICATIONS/CEER_PAPERS/Electricity/2010/E10-
EQS-38-05_SmartGrids_Conclusions_10-Jun-2010_Corrigendum.pdf
[6] “Guidelines of Good Practice on Estimation of Costs due to Electricity Interruptions and Voltage Disturbances”, 7 December 2010, Ref: C10-EQS-41-03.http://www.energy-regulators.eu/portal/page/portal/EER_HOME/EER_PUBLICATIONS/CEER_PAPERS/Electricity/2010/C10-
EQS-41-03_GGP%20interuptions%20and%20voltage_7-Dec-2010.pdf
[7] “CEER status review of regulatory approaches to smart electricity grids”, 6 July 2011, Ref: C11-EQS-45-04.http://www.energy-regulators.eu/portal/page/portal/EER_HOME/EER_PUBLICATIONS/CEER_PAPERS/Electricity/2011/C11-
EQS-45-04_SmartGridsApproach_6%20July%202011.pdf
[8] “GGP on Customer Complaint Handling, Reporting and Classification”, 10 June 2010, Ref: E10-CEM-33-05.http://www.energy-regulators.eu/portal/page/portal/EER_HOME/EER_PUBLICATIONS/CEER_PAPERS/Customers/Tab1/E10-
CEM-33-05_GGP-ComplaintHandling_10-Jun-2010.pdf
[9] “Status Review of the Implementation of the GGP on Complaint Handling, Reporting and Classification as of 1 January 2011”, 5 September 2011, Ref: C11-CEM-45-03.http://www.energy-regulators.eu/portal/page/portal/EER_HOME/EER_PUBLICATIONS/CEER_PAPERS/Customers/Tab2/C11-
CEM-45-03_SR-GGP-Complaint%20Handling_05-Sept-2011.pdf
[10] “GGP on Regulatory Aspects of Smart Metering for Electricity and Gas”, February 2011, Ref. E10-RMF-29-05.http://www.energy-regulators.eu/portal/page/portal/EER_HOME/EER_PUBLICATIONS/CEER_PAPERS/Customers/Tab2/E10-
RMF-29-05_GGP_SM_8-Feb-2011.pdf
5th CEER Benchmarking Report on the Quality of Electricity Supply viii
List of references
[11] Towards Voltage Quality Regulation in Europe – An ERGEG Conclusions Paper, 18 July 2007, Ref. E07-EQS-15-03.http://www.energy-regulators.eu/portal/page/portal/EER_HOME/EER_PUBLICATIONS/CEER_PAPERS/Electricity/2007/E07-
EQS-15-03.pdf
Other activities and papers by CEER members
[12] E. Fumagalli, L. Lo Schiavo, F. Delestre, “Service quality regulation in electricity distribution and retail”, Springer, 2007.
[13] CEER-Eurelectric workshop on Voltage Quality Monitoring in Brussels on 18 November 2009. http://www.energy-regulators.eu/portal/page/portal/EER_HOME/EER_WORKSHOP/CEER-ERGEG%20EVENTS/Electricity/
Voltage%20Quality%20Monitoring%20Workshop%202009
[14] K. Brekke, J. Esteves, M. Bollen, L. Lo Schiavo, F. Villa, G. Reti, A. Haber, A. Falcão, T. Westergaard, R. Kolessar, “The CEER and the 4th benchmarking report on quality of electricity supply”, International Conference on Power Engineering, Energy and Electric Drives, March 2009, Lisbon.
[15] A. Falcão, M. Bollen, “Exceptional events and force majeure events and their use in the electricity sector”, Paper 233, CIRED International Conference on Electricity Distribution, Prague, June 2009.http://www.cired.be/CIRED09/pdfs/CIRED2009_0233_Paper.pdf
[16] K. Brekke, J. Esteves, A. Falcão, M. Bollen, L. Lo Schiavo, F. Villa, G. Reti, A. Haber, T. Westergaard, R. Kolessar, “Monitoring of and regulations on quality of electricity supply in european countries”, Paper 911, CIRED International Conference on Electricity Distribution, Prague, June 2009.http://www.cired.be/CIRED09/pdfs/CIRED2009_0911_Paper.pdf
[17] K. Brekke, L. Lo Schiavo, F. Villa, A. Haber, R.Kolessar, T. Westergaard, J. Esteves, A. Falcão, M. Bollen, G. Reti, “Monitoramento e regulamentação da qualidade da energia elétrica”, EM, July 2010, pp. 138-147.
[18] K. Brekke, R. Vailati, D. Torstensson, M. Steiner, A. Falcão, “CEER Recommendations on Estimation of Costs due to Electricity Interruptions and Voltage Disturbances”, CIRED International Conference on Electricity Distribution, Frankfurt, June 2011.
[19] J. Esteves, K. Brekke, K. Niall, M. Delfanti, M. Bollen; “Voltage quality monitoring, dips classification and responsibility sharing”; in Proc. 11th (Electrical Power Quality and Utilization International Conference (EPQU 2011); October 2011.
Other references
[20] SINTEF Energy Research, “Study on estimation of costs due to electricity interruptions and voltage disturbances” TR F6978, December 2010.h tt p : / / w w w. e n e r g y - r e g u l a t o r s . e u / p o r t a l / p a g e / p o r t a l / E E R _ HO M E / E E R _ P U B L I C AT I O N S / C E E R _ PA P E RS /
Electricity/2010/2010-12-07%20Study%20on%20estimation%20of%20costs%20due%20to%20electricity%20interruptions%20
and%20voltage%20disturbances.pdf
[21] CENELEC, “Interruption indexes”, Technical Report TR 50555, 2010.
[22] CENELEC, EN 50160, “Voltage characteristics of electricity supplied by public electricity networks”, 2010.
5th CEER Benchmarking Report on the Quality of Electricity Supply ix
List of references
[23] IEEE, “IEEE Guide for Electric Power Distribution Reliability Indices”, Std. 1366-2003, 14 May 2004.
[24] G. Carpinelli, P. Caramia, P. Verde, P. Varilone, R. Chiumeo, I. Mastrandrea, F. Tarsia, ”A global index for discrete voltage disturbances”, 9th Int. Conf. Electrical Power Quality and Utilization, Barcelona, Spain, October 2007.
[25] CIGRE Technical Brochure TB 412, “Voltage dip immunity of equipment and installations”, April 2010.www.e-cigre.org www.uie.org
[26] Directive 2004/108/EC of the European Parliament and of the Council of 15 December 2004 on the approximation of the laws of the Member States relating to electromagnetic compatibility and repealing Directive 89/336/EEC (“EMC Directive”).
[27] Directive 2009/72/EC of the European parliament and of the Council of 13 July 2009 concerning common rules for the internal market in electricity and repealing Directive 2003/54/EC (“Third Package”).
[28] Proposal for a Regulation of the European Parliament and of the Council on European Standardisation and amending Council Directives 89/686/EEC and 93/15/EEC and Directives 94/9/EC, 94/25/EC, 95/16/EC, 97/23/EC, 98/34/EC, 2004/22/EC, 2007/23/EC, 2009/105/EC and 2009/23/EC of the European Parliament and of the Council, Brussels, COM(2011) 315, 1 June 2011.
[29] IEC 61000: Electromagnetic compatibility (EMC) – Part 2-8, Voltage dips and short interruptions on public electric power systems with statistical measurement results.
[30] EN 61000: Electromagnetic compatibility (EMC) – Part 4-11, Voltage dips, short interruptions and voltage variations immunity tests.
[31] EN 61000: Electromagnetic compatibility (EMC) – Part 4-30: Testing and measurement techniques – Power quality measurement methods.
[32] CENELEC TR 50422, “Guide for the application of the European Standard EN 50160”, December 2003.
[33] EURELECTRIC, “Power Quality Monitoring EURELECTRIC Views”, November 2009.http://www2.eurelectric.org/DocShareNoFrame/Docs/2/KIGJEMBBMPJFGGHEPPEFLGHEPDBG9YW3BN434LUJ5E5T/
Eurelectric/docs/DLS/2009-11-06_-_EURELECTRIC_View_on_PQM_formatted_FINAL-2009-030-1001-01-E.pdf
[34] IEEE Std. 1346-1998, “Recommended practice for evaluating electric power system compatibility with electronics process equipment”.
[35] CIGRE/CIRED Working Group C4.07, “Power Quality Indices and Objectives”, CIGRE Technical Brochure TB 261, 2004.
[36] H. Seljeseth, 2010, “Måling og rapportering av spenningskvalitet” (“Monitoring and reporting of voltage quality, in Norwegian”) TR A6903, SINTEF Energy Research, Trondheim, Norway.
[37] M.H.J. Bollen, I.Y.H. Gu, “Signal processing of power quality disturbances”, Wiley, 2006.
[38] IEC 61000: Electromagnetic compatibility (EMC) – Part 3-6, Assessment of distortion limits for distorting loads in MV and HV power systems.
5th CEER Benchmarking Report on the Quality of Electricity Supply x
List of references
[39] EN 61000: Electromagnetic compatibility (EMC) – Part 3-7, Assessment of emission limits for fluctuating loads in MV and HV power systems.
[40] EN 61000: Electromagnetic compatibility (EMC) – Part 3-13: Assessment of emission limits for the connection of unbalanced installations to MV, HV and EHV power systems.
[41] EN 61000: Electromagnetic compatibility (EMC) – Part 4-34: Testing and measurement techniques - Voltage dips, short interruptions and voltage variations immunity tests for equipment with mains current more than 16 A per phase.
[42] R. Chiumeo, C. Gandolfi, L. Garbero, L. Tenti, “The Italian MV network dip performance characterization by contour charts as defined by UIE/CIGRE’/CIRED WG-C4.110”, International Conference on Renewable Energies and Power Quality, ICREPQ’11, Las Palmas de Gran Canaria, 13-15 April 2011, paper 323.
[43] R. Chiumeo, L. Garbero, L. Tenti, C. Gandolfi, M. de Nigris “The voltage dip performance assessment of the Italian MV network through global indices”, 21st International Conference on Electricity Distribution, CIRED 2011, Frankfurt, 6-9 June 2011, paper 0886.
5th CEER Benchmarking Report on the Quality of Electricity Supply xi
CEER
CEER
The Council of European Energy Regulators (CEER) is the voice of Europe’s national regulators of electric-ity and gas at EU and international level. Through CEER, a not-for-profit association, the national regulators cooperate and exchange best practice. A key objective of CEER is to facilitate the creation of a single, com-petitive, efficient and sustainable EU internal energy market that works in the public interest.
CEER works closely with (and supports) the Agency for the Cooperation of Energy Regulators (ACER). ACER, which has its seat in Ljubljana, is an EU Agency with its own staff and resources. CEER, based in Brussels, deals with many complementary (and not overlapping) issues to ACER’s work such as international issues, smart grids, sustainability and customer issues.
The work of CEER is structured according to a number of working groups and task forces, composed of staff members of the national energy regulatory authorities, and supported by the CEER Secretariat.
This report was prepared by the Electricity Quality of Supply and Smart Grids Task Force of CEER’s Electric-ity Working Group.
5th CEER Benchmarking Report on the Quality of Electricity Supply xii
Table of contents
Table of contents
Preface iii
LIST Of aBBreVIaTIONS iv LIST Of cOUNTrY aBBreVIaTIONS USeD IN THe rePOrT vi
LIST Of refereNceS vii
ceer xi
1. INTrODUcTION 2
2. cONTINUITY Of SUPPLY 42.1 What is Continuity of Supply and why is it important to regulate it? 42.2 Main Conclusions from Past Activities of the European Energy Regulators on Continuity of
Supply 52.3 Structure of the Chapter on Continuity of Supply 62.4 Continuity of Supply Monitoring 6
2.4.1 Definitions and types of interruptions monitored 62.4.2 Planned (notified) interruptions 82.4.3 Voltage levels monitored 122.4.4 Level of detail in the calculated indicator 132.4.5 Measurement techniques 16
2.5 Continuity of Supply Indicators 202.5.1 Long interruptions 222.5.2 Short and transient interruptions 242.5.3 Discussion of the different indicators 24
2.6 Analysis of Continuity by National Data 252.6.1 Unplanned long interruptions, excluding exceptional events 262.6.2 Unplanned long interruptions, all events 282.6.3 Short interruptions 282.6.4 Planned (notified) interruptions 302.6.5 Interruptions on the transmission networks 32
2.7 Analysis of Continuity by Disaggregated Data 332.7.1 Interruptions in rural and urban networks 332.7.2 Interruptions originating on different voltage levels 342.7.3 Technical characteristics of electricity networks 352.7.4 Correlation between interruptions and undergrounding - Preliminary remarks 372.7.5 Correlation between interruptions and undergrounding - Results 38
2.8 Standards and Incentives in Continuity of Supply Regulation 402.8.1 Introduction 402.8.2 Measurement of quality levels: a prerequisite for quality regulation 412.8.3 Regulation at system level and reward/penalty regimes 412.8.4 Regulation at single-user level and economic compensation 512.8.5 Historic evolution of existing incentive/penalty regimes and experiences 532.8.6 Expected developments in continuity of supply and quality incentives 54
2.9 Findings and Recommendations on Continuity of Supply 54
5th CEER Benchmarking Report on the Quality of Electricity Supply xiii
Table of contents
3 VOLTAGE QUALITY 603.1 What is Voltage Quality and why is it important to regulate it? 603.2 Main Conclusions from Past Activities of the European Energy Regulators on Voltage Quality 613.3 Structure of the Chapter on Voltage Quality 643.4 Voltage Quality Legislation, Regulation and Standardisation 64
3.4.1 Improvements to the new version of EN 50160 643.4.2 Limits for voltage disturbances in the new version of EN 50160 653.4.3 National legislation and regulations that differ from EN 50160 653.4.4 Obligations for monitoring voltage quality 683.4.5 Individual voltage quality verification 683.4.6 Individual information on voltage quality 703.4.7 Emission limits 71
3.5 Voltage Quality Monitoring Systems and Data 733.5.1 Development of voltage quality monitoring systems 743.5.2 Smart meters and voltage quality monitoring 803.5.3 Indicators for voltage dips 813.5.4 Actual data on voltage dips 843.5.5 Publication of voltage quality data 86
3.6 Findings and Recommendations on Voltage Quality 87
4 COMMERCIAL QUALITY 924.1 What is Commercial Quality and why is it important to regulate it? 924.2 Main Conclusions from Past Activities of the European Energy Regulators on Commercial Quality 934.3 Structure of the Chapter on Commercial Quality 944.4 Main Aspects of Commercial Quality 95
4.4.1 Main groups of commercial quality aspects 954.4.2 Commercial quality standards and their definitions 954.4.3 How to regulate commercial quality 97
4.5 Main Results of Benchmarking Commercial Quality Standards 974.5.1 Commercial quality standards applied 974.5.2 Group I: Connection 1004.5.3 Group II: Customer care 1024.5.4 Group III: Technical service 1034.5.5 Group IV: Metering and billing 1054.5.6 Compensations to customers 107
4.6 Actual Levels of Commercial Quality 1074.7 Summary of Benchmarking Results 1094.8 Findings and Recommendations on Commercial Quality 111
ANNEX TO CHAPTER 2 ON CONTINUITY OF SUPPLY: DATA 114
ANNEX TO CHAPTER 3 ON VOLTAGE QUALITY: DATA 130Part 1 of the Annex to Chapter 3 – National legislation and regulations that differ from EN 50160 130Part 2 of the Annex to Chapter 3 – Voltage quality data 134
ANNEX TO CHAPTER 4 ON COMMERCIAL QUALITY 146Part 1 of the Annex to Chapter 4 – Commercial quality regulation 147Part 2 of the Annex to Chapter 4 – Commercial quality data 164
ANNEX ON THE 5TH CEER BENCHMARKING REPORT - QUALITY OF ELECTRICITY SUPPLY IN THE ENERGY COMMUNITY 174
1 Introduction 1741.1 The Energy Community 1741.2 Scope 175
5th CEER Benchmarking Report on the Quality of Electricity Supply xiv
1.3 Methodology 1751.4 Acknowledgements 175
2 Continuity of Supply 1762.1 Introduction 1762.2 Continuity of Supply Monitoring 177
2.2.1 Types of Interruptions Monitored 1772.2.2 Planned and Unplanned Interruptions 1782.2.3 Voltage Levels Monitored 1812.2.4 Classification of the Cause of Interruption 1822.2.5 Exceptional Events 182
2.3 Continuity of Supply Indicators 1852.3.1 Level of Details of the Calculated Indicator 1852.3.2 Indices for Long and Short Interruptions 186
2.4 Analysis of Data on Continuity of Supply 1882.4.1 Interruptions Originated on Different Voltage Levels 1902.4.2 Evaluation of the Impact of Exceptional Events 1912.4.3 Unplanned Long Interruptions - All Events 1932.4.4 Planned Long Interruptions - All Events 1942.4.5 Continuity of Supply on Transmission Level 1962.4.6 Network Characteristics 1972.4.7 Correlation between Continuity of Supply and Network Characteristics 198
2.5 On-Site Audits on Continuity Data 1982.6 Continuity Standards and Incentive Schemes 1992.7 Expected Developments on Continuity of Supply Regulation 2022.8 Findings and Recommendations on Continuity of Supply 202
3 Voltage Quality 2103.1 Introduction 2103.2 Voltage Quality Legislation, Regulation and Standardisation 210
3.2.1 Introducing EN 50160 2103.2.2 Legislations and Regulations that differ from EN 50160 2113.2.3 Obligations for Monitoring Voltage Quality 2123.2.4 Individual Voltage Quality Verification 2133.2.5 Individual Information on Voltage Quality 2133.2.6 Emission Limits 214
3.3 Voltage Quality Monitoring Systems and Data 2153.3.1 Development of Voltage Quality Monitoring Systems 2153.3.2 Smart Meters and Voltage Quality Monitoring 2153.3.3 Data Collection, Aggregation and Publication from Voltage Quality
Monitoring System 2153.3.4 Actual Data for Voltage Dips, other VQ Parameters and Mitigation
Measures 2153.4 Findings and Recommendations on Voltage Quality 215
4 Commercial Quality 2194.1 Introduction 2194.2 Overview of Commercial Quality Standards in CPs 2194.3 Main Results of Benchmarking Commercial Quality Standards 221
4.3.1 Group I – Connection 2214.3.2 Group II – Customer Care 2214.3.3 Group III – Technical Service 2224.3.4 Group IV – Billing and Metering 223
4.4 Findings and Recommendations on Commercial Quality 225APPENDIX A – ANNEX TO CHAPTER “QUALITY OF SUPPLY” 228APPENDIX B – LIST OF TABLES 233APPENDIX C – LIST OF FIGURES 234
Table of contents
5th CEER Benchmarking Report on the Quality of Electricity Supply xv
Table of tables
Table of tables
Table 2.1 Definitions of long, short and transient interruptions 7Table 2.2 Planned and unplanned interruptions - definitions and rules 8Table 2.3 Voltage levels monitored in the different countries 12Table 2.4 Level of detail in the presentation of the indicators in the different countries 13Table 2.5 Measurement techniques for long and short interruptions 16Table 2.6 Monitoring long interruptions in the different countries 20Table 2.7 Indices used in the different countries to quantify long interruptions 22Table 2.8 Indices for short and transient interruptions in the different countries which monitor them 24Table 2.9 Actual data for short interruptions (average number of short interruptions per year,
decimals as reported by the responding countries) Note: voltage levels at which interruptions originate: E - EHV; H - HV; M - MV; L - LV 30
Table 2.10 Actual data for Energy Not Supplied (MWh) due to interruptions in transmission networks (excluding exceptional events) 32
Table 2.11 Actual data for Average Interruption Time (in minutes per year) due to interruptions in transmission networks (excluding exceptional events) 32
Table 2.12 Definitions of urban, suburban and rural areas in use in 5 European countries 33Table 2.13 Average distribution of incidents according to their voltage level, weighted by the number
of network users affected and the duration of the interruption, in several European countries 34
Table 2.14 Contribution to SAIFI according to the voltage level of incidents - Average distribution of incidents according to their voltage level, without exceptional events, weighted by the number of network users affected, in several European countries 35
Table 2.15 Length of circuits in European countries 36Table 2.16 Continuity of supply regulation at system-level 42Table 2.17 Standards for which economic compensation applies 51Table 2.18 Compensation levels in The Netherlands 52Table 3.1 Main activities of the European Energy Regulators on voltage quality 62Table 3.2 Main conclusions of surveys on costs due to poor voltage quality (source: CEER 4th
Benchmarking Report) 63Table 3.3 Standard EN 50160 - summary 65Table 3.4 Voltage quality regulation differing from EN 50160 – supply voltage variations 66Table 3.5 Voltage quality regulation differing from EN 50160 – other variations 66Table 3.6 Voltage quality regulation differing from EN 50160 – events 67Table 3.7 Measurement obligations 68Table 3.8 Individual voltage quality monitoring 69Table 3.9 Penalties for customers 72Table 3.10 Monitoring systems in operation: number of measuring units at different voltage levels 74Table 3.11 Voltage disturbances currently continuously monitored in different European countries
(voltages: L-low, M-medium, H-high, E-extra high, or All levels) 78Table 3.12 Initiatives for VQ monitoring and purposes (when not due to complaints) 79Table 3.13 Responsibility for voltage quality monitoring costs 80Table 3.14 Smart meters and voltage quality monitoring 80Table 3.15 Classification of voltage dips according to the standard EN 50160 82Table 3.16 Number of major dips in different countries (events per monitor-year) 85Table 3.17 Publication of voltage quality data 86Table 4.1 Commercial quality standards surveyed 96Table 4.2 Summary of countries which adopt commercial quality standards 98Table 4.3 Number of commercial quality standards (GS, OS, OAR, OM) in force per group and per
company type 99
5th CEER Benchmarking Report on the Quality of Electricity Supply xvi
Table of tables
Table 4.4 Number of commercial quality standards surveyed, per country and per type of requirement 99
Table 4.5 Commercial quality standards for connection-related activities 100Table 4.6 Examples of criteria by which the standard I.2 “Time for cost estimation for simple
works” and compensation can be distinguished 101Table 4.7 Examples of criteria by which the standard I.3 “Time for connecting new customers to
the network” and compensation can be distinguished 101Table 4.8 Commercial quality standards for customer care related activities 102Table 4.9 Examples for the regulation of customer contacts other than in writing 103Table 4.10 Commercial quality standards for technical customer service 104Table 4.11 Examples of criteria by which the standard III.9 “Time until the start of the restoration
of supply following failure of fuse of DSO” and compensation can be distinguished 104Table 4.12 Examples of the criteria by which the standard III.11 “Time until the restoration of
supply in case of unplanned interruption” and compensation can be distinguished 105Table 4.13 Commercial quality standards for metering and billing (household, LV only) 106Table 4.14 Examples of the criteria by which the standard IV.14 “Time for restoration of power
supply following disconnection due to non-payment” and compensation can be distinguished 106
Table 4.15 Compensations due if commercial quality guaranteed standards are not fulfilled 107Table 4.16 Average non-compliance percentage by countries 108Table 4.17 Number of countries where commercial quality standards are in force (per type of
standard, referring only to activities of DSOs) 110Table 4.18 Commercial quality standards applied by the CEER countries per type of standard and
question groups 111Table A2.1.1 Unplanned interruptions excluding exceptional events - Minutes lost per year (1999-2010) 115Table A2.1.2 Unplanned interruptions excluding exceptional events - Interruptions per year (1999-2010) 116Table A2.1.3 Unplanned interruptions including all events - Minutes lost per year (1999-2010) 117Table A2.1.4 Unplanned interruptions including all events - Interruptions per year (1999-2010) 118Table A2.1.5 Planned interruptions - Minutes lost per year (1999-2010) 119Table A2.1.6 Planned interruptions - Interruptions per year (1999-2010) 120Table A2.1.7 Unplanned interruptions excluding exceptional events – different areas
Minutes lost per year (1999-2010) 121Table A2.1.8 Unplanned interruptions excluding exceptional events – different areas
Interruptions per year (1999-2010) 122Table A2.1.9 Definitions and methods for exceptional events 123Table A3.1 The average number of voltage dips per year in the transmission networks in France in 2008 134Table A3.2 The 95th percentile of voltage dips per year in the transmission networks in France in 2008 134Table A3.3 The average number of voltage dips per year in the transmission networks in France in 2009 134Table A3.4 The 95th percentile of voltage dips per year in the transmission networks in France in 2009 135Table A3.5 The average number of voltage dips per year in the transmission networks in France in 2010 135Table A3.6 The 95th percentile of voltage dips per year in the transmission networks in France in 2010 135Table A3.7 The average number of voltage dips per year in the LV network in Hungary in 2009 135Table A3.8 The average number of voltage dips per year in the MV network in Hungary in 2009 136Table A3.9 The average number of voltage dips per year at MV busbars of HV/MV substations
in Italy in 2008 (10% sample of the Italian networks) 136Table A3.10 The average number of voltage dips per year at MV busbars of HV/MV substations
in Italy in 2009 (10% sample of the Italian networks) 136Table A3.11 The average number of voltage dips per year at MV busbars of HV/MV substations in
Italy in 2010 (10% sample of the Italian networks) 136Table A3.12 The average number of voltage dips per year recorded in 90 HV sites (150 kV and 132 kV,
excluding EHV sites) in Italy in 2010 - MONO-PHASE dips and POLY-PHASE dips 139Table A3.13 The average number of voltage dips per year in the HV network in The Netherlands
in 2007 139
5th CEER Benchmarking Report on the Quality of Electricity Supply xvii
Table of tables
Table A3.14 The average number of voltage dips per year in the HV network in The Netherlands in 2008 139
Table A3.15 The average number of voltage dips per year in the HV network in The Netherlands in 2009 140
Table A3.16 The average number of voltage dips per year in the HV network in The Netherlands in 2010 140
Table A3.17 The average number of voltage dips per year in the transmission network (60 kV) in Portugal in 2007 140
Table A3.18 The average number of voltage dips per year in the transmission network (60 and 150 kV) in Portugal in 2008 141
Table A3.19 The highest number of voltage dips at any one particular location of a total of 7 connection points in the transmission network (60 and 150 kV) in Portugal in 2008 141
Table A3.20 The average number of voltage dips at 7 connection points in the transmission network (60 and 150 kV) in Portugal in 2009 141
Table A3.21 The highest number of voltage dips at any one particular location of a total of 7 connection points in the transmission network (60 and 150 kV) in Portugal in 2009 142
Table A3.22 Voltage quality data in the HV network (110 kV) in Slovenia in 2008 143Table A3.23 Voltage quality data in the HV network (110 kV) in Slovenia in 2009 143Table A3.24 Voltage quality data in the MV networks (10, 20 and 35 kV) in Slovenia in 2008 143Table A3.25 Voltage quality data in the MV networks (10, 20 and 35 kV) in Slovenia in 2009 143Table A3.26 The number of voltage dips and swells in the HV network (110 kV) in Slovenia in 2008 144Table A3.27 The number of voltage dips and swells in the HV network (110 kV) in Slovenia in 2009 144Table A3.28 The number of voltage dips and swells in the MV networks (10, 20 and 35 kV) in
Slovenia in 2008 144Table A3.29 The number of voltage dips and swells in the MV networks (10, 20 and 35 kV) in
Slovenia in 2009 144Table A3.30 Voltage quality data in the transmission network of the TSO in Slovenia in 2008
and 2009 145Table A3.31 The number of voltage dips and swells in the transmission network of the TSO in
Slovenia in 2008 and 2009 145Table A4.1.1 Time for response to customer claim for network connection 147Table A4.1.2 Time for cost estimation for simple works 148Table A4.1.3 Time for connecting new customers to the network 149Table A4.1.4 Time for disconnection upon customer’s request 150Table A4.1.5 Punctuality of appointments with customers 151Table A4.1.6 Response time to customer complaints and enquiries (Including voltage issues and
interruptions) 152Table A4.1.6a Time for answering the voltage complaint 153Table A4.1.6b Time for answering the interruption complaint 154Table A4.1.7 Response time to questions in relation to costs and payments (excluding connection) 155Table A4.1.8 Time between the date of the answer to the VQ complaint and the elimination of the
problem 156Table A4.1.9 Time until the start of the restoration of supply following failure of fuse of DSO 157Table A4.1.10 Time for giving information in advance of a planned interruption 158Table A4.1.11 Time until the restoration of supply in case of unplanned interruption 159Table A4.1.12 Time for meter inspection in case of meter failure 160Table A4.1.13 Time from notice to pay until disconnection 161Table A4.1.14 Time for restoration of power supply following disconnection due to non-payment 162Table A4.1.15 Yearly number of meter readings by the designated company 163Table A4.2.1 Time for response to customer claim for network connection 164Table A4.2.2 Time for cost estimation for simple works 164Table A4.2.3 Time for connecting new customers to the network 165Table A4.2.4 Time for disconnection upon customer’s request 166Table A4.2.5 Punctuality of appointments with customers 166
5th CEER Benchmarking Report on the Quality of Electricity Supply xviii
Table of tables
Table A4.2.6 Response time to customer complaints and enquiries (Including voltage issues and interruptions) 167
Table A4.2.6a Time for answering the voltage complaint 168Table A4.2.6b Time for answering the interruption complaint 168Table A4.2.7 Response time to questions in relation to costs and payments (excluding connection) 169Table A4.2.8 Time between the date of the answer to the VQ complaint and the elimination of the
problem 169Table A4.2.9 Time until the start of the restoration of supply following failure of fuse of DSO 170Table A4.2.10 Time for giving information in advance of a planned interruption 170Table A4.2.11 Time until the restoration of supply in case of unplanned interruption 171Table A4.2.12 Time for meter inspection in case of meter failure 172Table A4.2.13 Time from notice to pay until disconnection 172Table A4.2.14 Time for restoration of power supply following disconnection due to non-payment 173Table A4.2.15 Yearly number of meter readings by the designated company 173
5th CEER Benchmarking Report on the Quality of Electricity Supply xix
Table of figures
Figure 1.1 Active contribution to the CEER Benchmarking Reports over its four editions (2001-2008) 2Figure 1.2 Active contribution to this edition of the 5th Benchmarking Report (2011) 3Figure 2.1 Unplanned long interruptions excluding exceptional events; minutes lost per year (1999 -
2010). The voltage level (EHV, HV, MV, LV) relates to where the incidents occur 27Figure 2.2 Unplanned long interruptions excluding exceptional events; number of interruptions per
year (1999 - 2010). The voltage level (EHV, HV, MV, LV) relates to where the incidents occur 27
Figure 2.3 Unplanned long interruptions including all events; minutes lost per year (1999 - 2010). The voltage level (EHV, HV, MV, LV) relates to where the incidents occur 29
Figure 2.4 Unplanned long interruptions including all events; number of interruptions per year (1999 - 2010). The voltage level (EHV, HV, MV, LV) relates to where the incidents occur 29
Figure 2.5 Planned interruptions: minutes lost per year (1999-2010). The voltage level (EHV, HV, MV, LV) relates to where the incidents occur 31
Figure 2.6 Planned interruptions: number of interruptions per year (1999 - 2010). The voltage level (EHV, HV, MV, LV) relates to where the incidents occur 31
Figure 2.7 comparison of unplanned interruption values between different areas in 5 countries; minutes lost per year (1999 - 2010). The voltage level (LV, MV, HV) relates to where the incidents occur 33
Figure 2.8 Comparison of unplanned interruption values between different areas in 5 countries; number of interruptions per year (1999-2010). The voltage level (LV, MV, HV) relates to where the incidents occur 34
Figure 2.9 Length of cable and overhead line Low Voltage (LV) circuits in European countries 35Figure 2.10 Length of cable and overhead line Medium Voltage (MV) circuits in European countries 36Figure 2.11 Statistical correlation between the percentage of underground cables in Medium Voltage
(MV) networks and density in European countries 37Figure 2.12 Statistical correlation between the percentage of underground cables in MV networks
and “total SAIDI” (unplanned SAIDI including exceptional events plus planned SAIDI) averaged over 3 years, in Europe 39
Figure 2.13 Statistical correlation between the percentage of underground cables in MV networks and “total SAIDI” (unplanned SAIDI including exceptional events plus planned SAIDI), averaged over 3 years, without Austria,Estonia, Finland, Poland and Spain 40
Figure 2.14 Portuguese incentive scheme, a) transmission level, b) distribution level 48Figure 3.1. Classification of voltage dips in 3 areas, up to and including 45 kV (left), and above
45 kV (right) 67Figure 3.2 An example for supply voltage variations in Switzerland 77Figure 3.3. Indicative responsibility-sharing curve for voltage dips 85Figure A2.1 Statistical correlation between the percentage of underground cables in MV networks
“SAIDI” (unplanned SAIDI without exceptional events plus planned SAIDI) in France 126Figure A.2.2 Relation between the total SAIDI and the percentage of underground cables for DSOs
in Sweden 127Figure A.2.3 Relationship between total SAIDI and customer density for DSOs in Sweden 128Figure A.2.4 Growth in underground networks in Sweden, 1998-2010 128Figure A3.1 Distribution of voltage dips in Italy 95%-sites year 2009 137Figure A3.2 Distribution of voltage dips in Italy 50%-sites year 2009 137Figure A3.3 Distribution of voltage dips in Italy 95%-sites year 2010 138Figure A3.4 Distribution of voltage dips in Italy: 50%-sites year 2010 138Figure A3.5 A schematic map of the distribution areas of the five DSOs in Slovenia 142
Table of figures
5th CEER Benchmarking Report on the Quality of Electricity Supply xx
Table of case studies
Case Study 1 Continuity of supply monitoring and indicators in Switzerland 18Case Study 2 Statistical correlation between the percentage of underground MV cables and
continuity of supply - Analysis of local data regarding the situation in France 126Case Study 3 Continuity of supply in Sweden 127Case Study 4 Voltage dip regulation in Sweden 67Case Study 5 Customer compensation in Hungary for supply voltage variations 69Case Study 6 Information provided to customers about past (or expected future) voltage quality
levels in Norway 70Case Study 7 Information provided to customers in Slovenia 71Case Study 8 Maximum level of current emissions for harmonics in France 72Case Study 9 The roles of the stakeholders with respect to emission limits for customers 73Case Study 10 Voltage quality monitoring in Switzerland 77Case Study 11 Calculation of voltage dip indices for transmission networks in Italy 83Case Study 12 Proposed voltage dip indices for distribution networks in Italy 84
Table of case studies

5th CEER Benchmarking Report on the Quality of Electricity Supply 2
Background
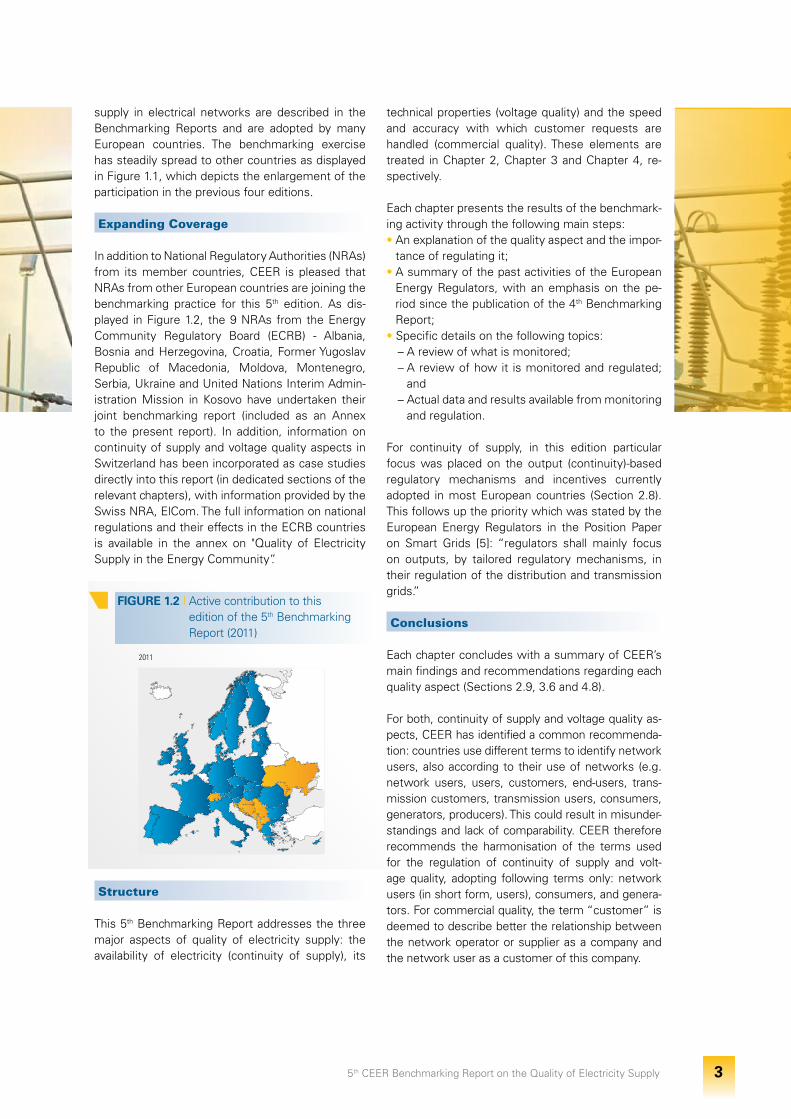
The Council of European Energy Regulators (CEER) periodically surveys and analyses the quality of electricity supply in its member countries. These surveys and analyses take the form of CEER Bench-marking Reports on Quality of Electricity Supply (hereafter Benchmarking Reports). The first report was issued in 2001 [1], followed by the second, third and fourth editions in 2003, 2005 and 2008 respectively [2] [3] [4].
CEER recommended the following activities in the First Benchmarking Report:
• publication of the report to promote discussion of quality of supply regulation amongst EU and non-EU Regulatory Authorities;
• submission of the findings for discussion at inter-national conferences on regulatory issues;
• enlargement of the membership (6 countries) to include other countries.
The publication of these Benchmarking Reports, us-ing a minimum common structure through all the editions, has facilitated the availability of informa-tion on the regulation of quality of supply and on the effects produced by this regulation in each country. As a result, good practices for regulating quality of
Introduction
1.
2001 2003 2005 2008
FIGURE 1.1 I Active contribution to the CEER Benchmarking Reports over its four editions (2001-2008)
5th CEER Benchmarking Report on the Quality of Electricity Supply 3
supply in electrical networks are described in the Benchmarking Reports and are adopted by many European countries. The benchmarking exercise has steadily spread to other countries as displayed in Figure 1.1, which depicts the enlargement of the participation in the previous four editions.
Expanding Coverage
In addition to National Regulatory Authorities (NRAs) from its member countries, CEER is pleased that NRAs from other European countries are joining the benchmarking practice for this 5th edition. As dis-played in Figure 1.2, the 9 NRAs from the Energy Community Regulatory Board (ECRB) - Albania, Bosnia and Herzegovina, Croatia, Former Yugoslav Republic of Macedonia, Moldova, Montenegro, Serbia, Ukraine and United Nations Interim Admin-istration Mission in Kosovo have undertaken their joint benchmarking report (included as an Annex to the present report). In addition, information on continuity of supply and voltage quality aspects in Switzerland has been incorporated as case studies directly into this report (in dedicated sections of the relevant chapters), with information provided by the Swiss NRA, ElCom. The full information on national regulations and their effects in the ECRB countries is available in the annex on "Quality of Electricity Supply in the Energy Community”.
2011
FIGURE 1.2 I Active contribution to this edition of the 5th Benchmarking Report (2011)
Structure
This 5th Benchmarking Report addresses the three major aspects of quality of electricity supply: the availability of electricity (continuity of supply), its
technical properties (voltage quality) and the speed and accuracy with which customer requests are handled (commercial quality). These elements are treated in Chapter 2, Chapter 3 and Chapter 4, re-spectively.
Each chapter presents the results of the benchmark-ing activity through the following main steps:• An explanation of the quality aspect and the impor-
tance of regulating it;• A summary of the past activities of the European
Energy Regulators, with an emphasis on the pe-riod since the publication of the 4th Benchmarking Report;
• Specific details on the following topics:– A review of what is monitored;– A review of how it is monitored and regulated;
and– Actual data and results available from monitoring
and regulation.
For continuity of supply, in this edition particular focus was placed on the output (continuity)-based regulatory mechanisms and incentives currently adopted in most European countries (Section 2.8). This follows up the priority which was stated by the European Energy Regulators in the Position Paper on Smart Grids [5]: “regulators shall mainly focus on outputs, by tailored regulatory mechanisms, in their regulation of the distribution and transmission grids.”
Conclusions
Each chapter concludes with a summary of CEER’s main findings and recommendations regarding each quality aspect (Sections 2.9, 3.6 and 4.8).
For both, continuity of supply and voltage quality as-pects, CEER has identified a common recommenda-tion: countries use different terms to identify network users, also according to their use of networks (e.g. network users, users, customers, end-users, trans-mission customers, transmission users, consumers, generators, producers). This could result in misunder-standings and lack of comparability. CEER therefore recommends the harmonisation of the terms used for the regulation of continuity of supply and volt-age quality, adopting following terms only: network users (in short form, users), consumers, and genera-tors. For commercial quality, the term “customer” is deemed to describe better the relationship between the network operator or supplier as a company and the network user as a customer of this company.
5th CEER Benchmarking Report on the Quality of Electricity Supply 4
2.1. What is Continuity of Supply and why is important to regulate it?
Continuity of supply concerns interruptions in elec-tricity supply. In other words, it focuses on the events during which the voltage at the supply termi-nals of a network user drops to zero or nearly (prac-tically) zero1. Continuity of supply can be described by various quality dimensions. The ones most com-monly used are number of interruptions per year, unavailability (interrupted minutes per year) and en-ergy not supplied (ENS) per year.
Network users expect a high continuity of supply2 at an affordable price. The fewer the interruptions and the shorter these interruptions are, the better the continuity is from the viewpoint of the network user. Therefore, one of the roles of network opera-tors (formerly of electric utilities) is to optimise the continuity performance of their distribution and/or transmission network in a cost effective manner. The role of the regulators in a monopolistic network condition is to ensure that this optimisation is car-
ried out in a correct way taking into account the us-ers’ expectations and their willingness to pay.
Continuity of supply indices3 are traditionally impor-tant tools for making decisions on the management of distribution and transmission networks. Accord-ing to the quality dimensions above, regulatory in-struments now mostly focus on accurately defined continuity of supply indices of ‘frequency’ of inter-ruptions, ‘duration’ of interruptions and ‘energy not supplied’ due to interruptions. These instruments normally complement incentive regulation, which (ei-ther in the form of price or revenue-cap mechanisms) is commonly used across Europe at present. Incen-tive regulation provides a motivation to increase eco-nomic efficiency over time. However, it also carries a risk that network operators could refrain from carry-ing out investments and proper operational arrange-ments for better continuity, in order to lower their costs and increase their efficiency. To account for this drawback in incentive regulation, a large number of European regulators adopt regulatory instruments to maintain or improve the continuity of supply.
Continuity of Supply
2.
1. According to EN 50160 [22].2. The terms ‘availability of electricity supply’ and ‘reliability of supply’ can be used with the same meaning as continuity of supply. However, this
report adopts the term ‘continuity of supply’ as in the previous CEER Benchmarking Reports.3. In broader terms, continuity of supply indices can be ‘performance indicators’ or ‘output measures’ of network planning, asset management and
operation.
5th CEER Benchmarking Report on the Quality of Electricity Supply 5
2.2. Main Conclusions from Past Activities of the European Energy Regulators on Continuity of Supply
The 1st Benchmarking Report (2001) identified the two main features of continuity of supply regulation as: • guaranteeing that each user can be provided with
at least a minimum level of quality; and • promoting quality improvement across the sys-
tem.
The comparative analysis of available measurement and continuity of supply regulation in the 1st Bench-marking Report shows that regulators have gener-ally approached continuity issues starting with long interruptions affecting low voltage (LV) network users and treating planned and unplanned interrup-tions separately. In several countries, both the num-ber and the duration of interruptions are available, but the choice of the indicator used varies by coun-try and in many countries short interruptions are (or will be) recorded as well. Different approaches to continuity of supply regulation (and in particular the different continuity indicators and standards adopt-ed, recording methodologies used) combined with different geographical, meteorological and network characteristics, make benchmarking of actual levels of continuity of supply difficult. CEER stated in the 1st Benchmarking Report that regulators need to pay attention to implementation and control issues and identified the most important implementation and control issues:
• regular internal audits by distribution companies and sample audits by the regulator; and
• accuracy and precision indicators to assist in auditing and to inform decisions about sanctions.
In the 2nd Benchmarking Report, the number of countries included in the comparison was ex-tended and the comparisons were more detailed. Distinctions were made between planned and un-planned interruptions, different voltage levels and load density areas as well as a classification of the interruption by its cause. It was noted that further harmonisation of data and definitions between regulators remained necessary. For unplanned in-terruptions in the years 1999-2001, it was shown that some countries with historically good continu-ity of supply levels were experiencing more and longer interruptions. On the contrary, some coun-tries with historically lower continuity of supply showed significant improvements.
The 2nd Benchmarking Report also concluded that no relevant signals of decreases in quality of sup-ply were emerging in European countries even after the privatisation of utilities, increasing supply com-petition, price-cap regulation for monopolistic activi-ties and legal unbundling of businesses.
A number of encouraging trends were also ob-served in the 3rd Benchmarking Report:
• The duration of unplanned interruptions showed (for most countries) a significant downward trend;
• The number of unplanned interruptions showed (for most countries) a downward trend;
• Excluding exceptional events from unplanned performance figures highlighted the significant improvements being made by many European countries in terms of both the duration and the number of interruptions;
• Countries with previously low levels for duration and number of interruptions were able to make further improvements;
• The number of short interruptions had generally not risen despite an increased move to automa-tion and remote control techniques.
CEER concluded in the 2nd and 3rd Benchmarking Reports that audit procedures had been put in place in almost all countries that adopted reward/penalty schemes, as measurement rules and audit proce-dures become more important when some kind of economic incentive is used for continuity of supply.
The handbook on “Service quality regulation in elec-tricity distribution and retail” (developed in 2006 as a joint effort by CEER and the Florence School of Regulation) [12] listed five main ingredients for quality of supply regulation based on 5 to 10-year existing practices (in most cases from the field of continuity of supply):
• Fair and simple regulatory instruments, with clear rules on data measurement and collection;
• Adjustments of the regulatory schemes to the specific industrial and institutional factors of each country;
• Gradual approach in implementing regulatory schemes;
• Periodic evaluation and revision of the continuity regulation, with enlargements and adaptations over time but in a stable - as possible - regulatory framework;
• Efficient outcomes from an open dialogue between the regulator, the regulated companies and the net-work users, including learning from mistakes.
5th CEER Benchmarking Report on the Quality of Electricity Supply 6
2. Continuity of Supply
The 4th Benchmarking Report introduced precise definitions of continuity indicators in order to en-sure an appropriate homogeneity between Europe-an countries. Very detailed chapters on exceptional events and a short presentation of on-site audits on continuity data were also added.
Harmonising the regulation of quality of electricity supply requires common measurement of indica-tors, harmonised monitoring systems, harmonised techniques for cost estimation studies and a quanti-fication of the valuation of quality in its three dimen-sions (not only for continuity). With a view to opti-mally updating and upgrading regulatory practices which promote a single European electricity mar-ket, such harmonisation would be best undertaken at the same time as the deployment of new “smart grid” technologies. CEER has made progress in this area since the 4th Benchmarking Report, with the commissioning of a consultancy report: “Study on Estimation of costs due to electricity interruptions and voltage disturbances” elaborated by SINTEF [20] and with the publication of CEER’s “Guidelines of Good Practice on Estimation of Costs due to Electricity Interruptions and Voltage Disturbances” (2010) [6]. Two key messages emerged:
• Results from cost-estimation studies on costs due to electricity interruptions are of key impor-tance in order to be able to set proper incentives for continuity of supply; and
• The CEER Guidelines of Good Practice (GGP) should be used as a reference when performing a nationwide cost-estimation study, always taking into account country-specific issues and needs.
CEER representatives contributed significantly to the CENELEC technical report CLC/TR 50555:2010 “Interruption indexes” [21], issued in 2010, cover-ing guidance on how to calculate continuity of sup-ply indices as well as recommendations on a set of indices System Average Interruption Duration Index (SAIDI), System Average Interruption Frequency Index (SAIFI) and Momentary Average Interruption Frequency Index (MAIFI) suitable for pan-European benchmarking of distribution network performanc-es. This report was prepared with substantial refer-ences to previous CEER benchmarking reports on quality of electricity supply. The technical report was designed to be a first step towards benchmarking the interruption performance of European coun-tries. The report recognised that rules on the aggre-gation of interruptions, in particular short interrup-
tions, have not been considered and that it might be necessary to describe aggregation rules in a second version of the technical report.
2.3. Structure of the Chapter on Continuity of Supply
This chapter benchmarks the rules and adopted in-dicators to measure continuity of supply. Next, the chapter analyses the continuity of supply data pro-vided by CEER countries, first through a compari-son of national data and second through a detailed analysis of disaggregated data. Lastly, the chapter focuses on continuity standards and incentives which are (or are expected to be) adopted in CEER countries. In conclusion, CEER provides its findings and recommendations on continuity of supply.
The chapter on continuity of supply is based on in-put from 26 CEER countries (as reported): Austria, Bulgaria, Cyprus, the Czech Republic, Denmark, Es-tonia, Finland, France, Germany, Greece, Hungary, Ireland, Italy, Latvia, Lithuania, Luxembourg, The Netherlands, Norway, Poland, Portugal, Romania, the Slovak Republic, Slovenia, Spain, Sweden and the United Kingdom4. For most of these countries, a detailed look at the existing quality regulation re-gime is available in Section 2.8.3.
2.4. Continuity of Supply Monitoring
Continuity of supply refers to the availability of elec-tricity to all network users. All countries who par-ticipated in this survey stated that continuity of sup-ply is monitored within their electricity networks country-wide. This monitoring is done in differenty ways in different countries. Differences vary from the kind of interruptions monitored and the level of detail being reported to the interpretation and high-lighting of various indicators. The methods used for monitoring in the different countries are presented in this section.
2.4.1. Definitions and types of interruptions monitored
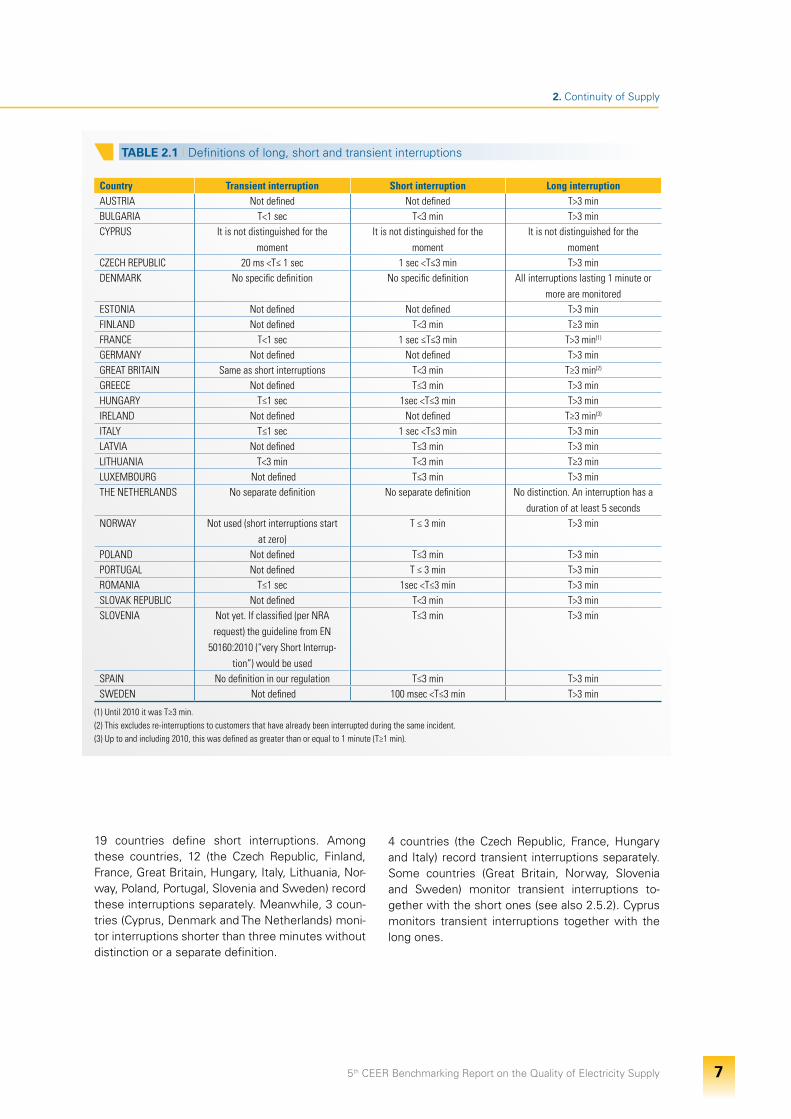
In the following table (Table 2.1), differences in defi-nitions for long, short and transient interruptions (concerning mainly the specifications for duration of an interruption) are reported for different countries.
4. Throughout this report, data for the United Kingdom is listed as Great Britain (GB).
5th CEER Benchmarking Report on the Quality of Electricity Supply 7
2. Continuity of Supply
19 countries define short interruptions. Among these countries, 12 (the Czech Republic, Finland, France, Great Britain, Hungary, Italy, Lithuania, Nor-way, Poland, Portugal, Slovenia and Sweden) record these interruptions separately. Meanwhile, 3 coun-tries (Cyprus, Denmark and The Netherlands) moni-tor interruptions shorter than three minutes without distinction or a separate definition.
4 countries (the Czech Republic, France, Hungary and Italy) record transient interruptions separately. Some countries (Great Britain, Norway, Slovenia and Sweden) monitor transient interruptions to-gether with the short ones (see also 2.5.2). Cyprus monitors transient interruptions together with the long ones.
TABLE 2.1 I Definitions of long, short and transient interruptions
Country Transient interruption Short interruption Long interruptionAUSTRIA Not defined Not defined T>3 min BULGARIA T<1 sec T<3 min T>3 min CYPRUS It is not distinguished for the
moment It is not distinguished for the
moment It is not distinguished for the
momentCZECH REPUBLIC 20 ms <T≤ 1 sec 1 sec <T≤3 min T>3 min DENMARK No specific definition No specific definition All interruptions lasting 1 minute or
more are monitored ESTONIA Not defined Not defined T>3 min FINLAND Not defined T<3 min T≥3 min FRANCE T<1 sec 1 sec ≤T≤3 min T>3 min(1)
GERMANY Not defined Not defined T>3 min GREAT BRITAIN Same as short interruptions T<3 min T≥3 min(2)
GREECE Not defined T≤3 min T>3 min HUNGARY T≤1 sec 1sec <T≤3 min T>3 min IRELAND Not defined Not defined T≥3 min(3)
ITALY T≤1 sec 1 sec <T≤3 min T>3 min LATVIA Not defined T≤3 min T>3 min LITHUANIA T<3 min T<3 min T≥3 min LUXEMBOURG Not defined T≤3 min T>3 min THE NETHERLANDS No separate definition No separate definition No distinction. An interruption has a
duration of at least 5 secondsNORWAY Not used (short interruptions start
at zero)T ≤ 3 min T>3 min
POLAND Not defined T≤3 min T>3 min PORTUGAL Not defined T ≤ 3 min T>3 minROMANIA T≤1 sec 1sec <T≤3 min T>3 min SLOVAK REPUBLIC Not defined T<3 min T>3 min SLOVENIA Not yet. If classified (per NRA
request) the guideline from EN 50160:2010 (“very Short Interrup-
tion”) would be used
T≤3 min T>3 min
SPAIN No definition in our regulation T≤3 min T>3 min SWEDEN Not defined 100 msec <T≤3 min T>3 min
(1) Until 2010 it was T≥3 min.(2) This excludes re-interruptions to customers that have already been interrupted during the same incident.(3) Up to and including 2010, this was defined as greater than or equal to 1 minute (T≥1 min).
5th CEER Benchmarking Report on the Quality of Electricity Supply 8
2. Continuity of Supply
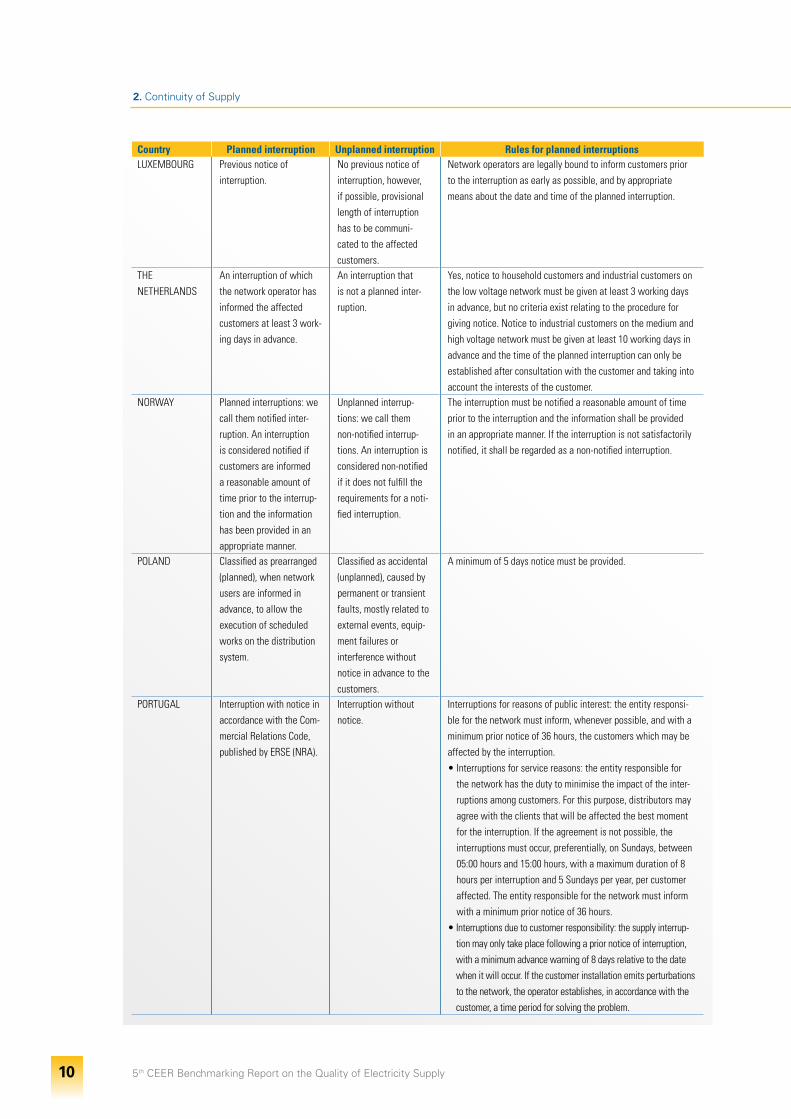
2.4.2. Planned (notified) interruptions
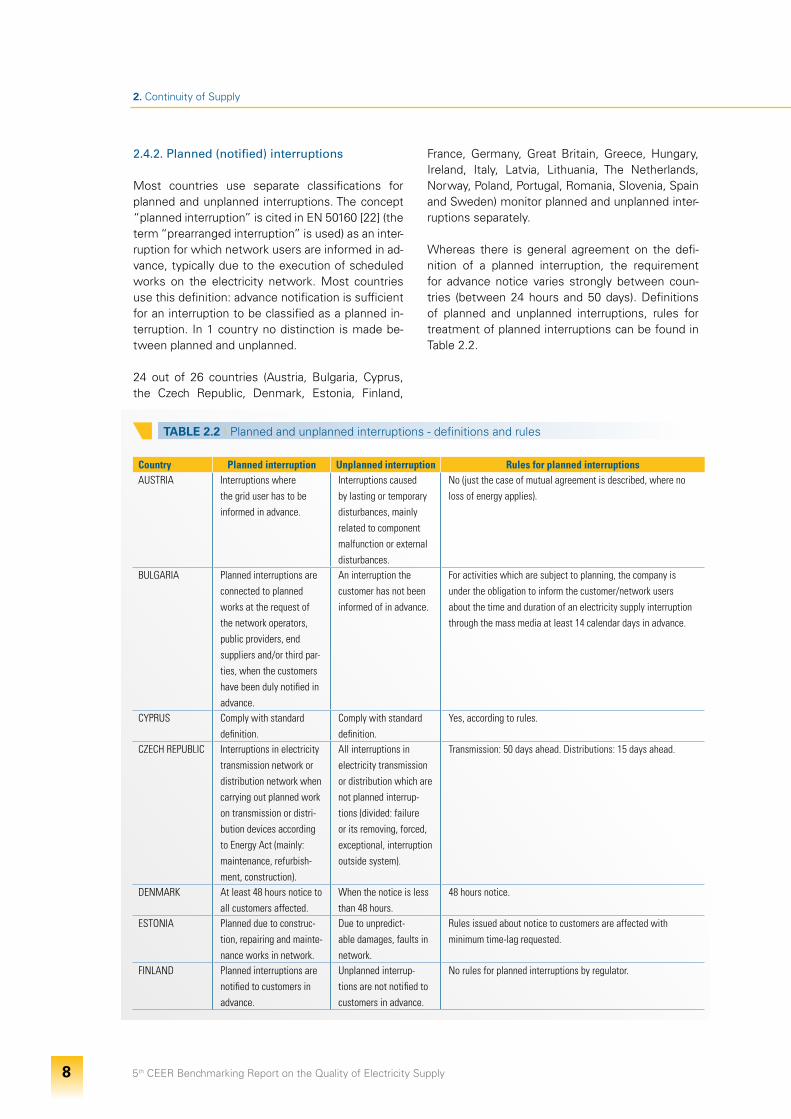
Most countries use separate classifications for planned and unplanned interruptions. The concept “planned interruption” is cited in EN 50160 [22] (the term “prearranged interruption” is used) as an inter-ruption for which network users are informed in ad-vance, typically due to the execution of scheduled works on the electricity network. Most countries use this definition: advance notification is sufficient for an interruption to be classified as a planned in-terruption. In 1 country no distinction is made be-tween planned and unplanned.
24 out of 26 countries (Austria, Bulgaria, Cyprus, the Czech Republic, Denmark, Estonia, Finland,
France, Germany, Great Britain, Greece, Hungary, Ireland, Italy, Latvia, Lithuania, The Netherlands, Norway, Poland, Portugal, Romania, Slovenia, Spain and Sweden) monitor planned and unplanned inter-ruptions separately.
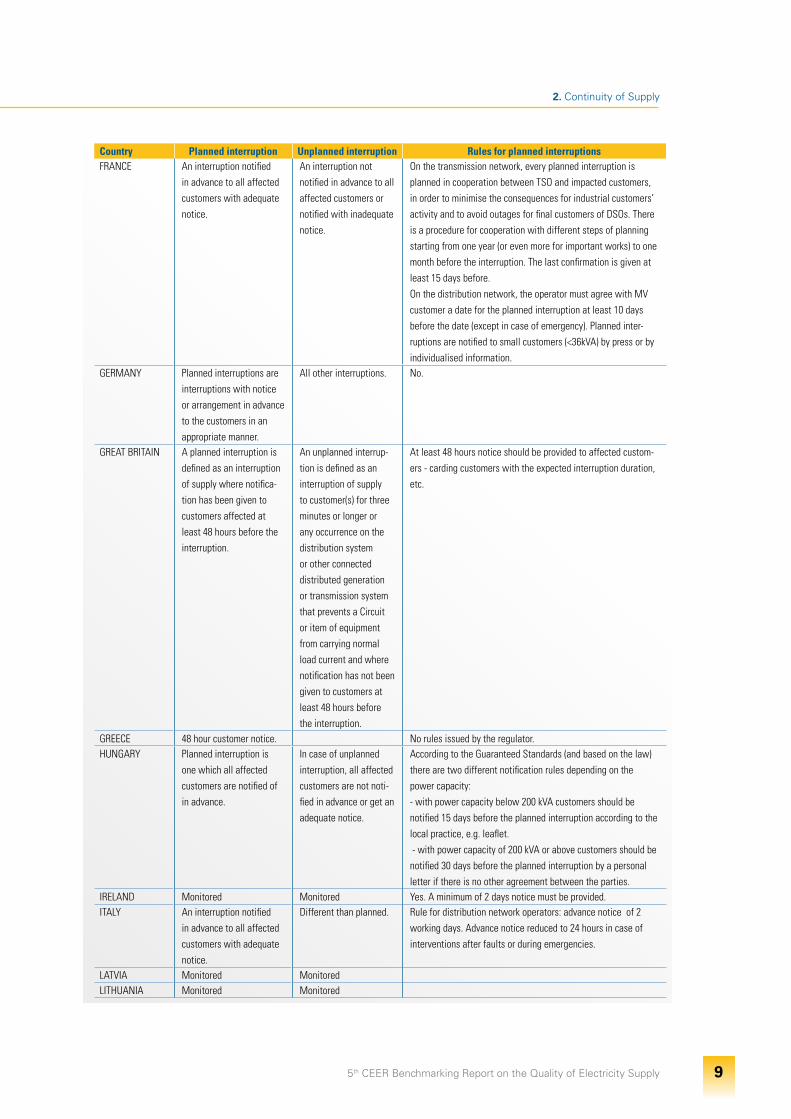
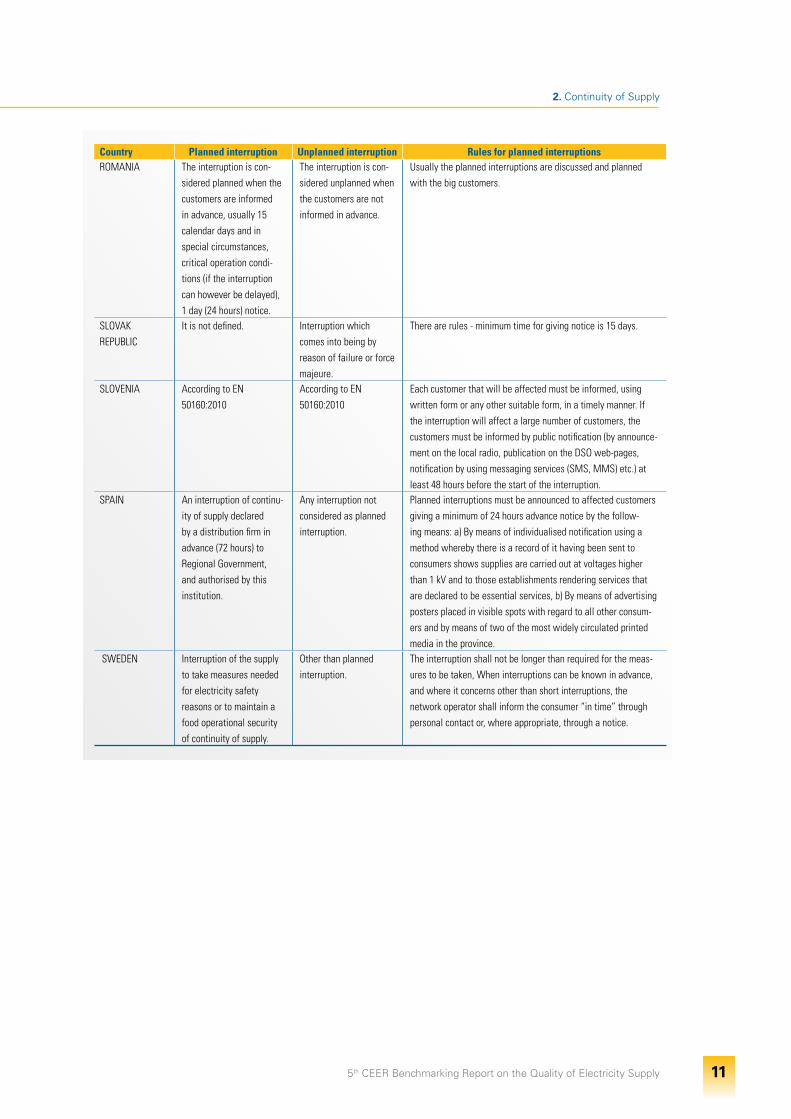
Whereas there is general agreement on the defi-nition of a planned interruption, the requirement for advance notice varies strongly between coun-tries (between 24 hours and 50 days). Definitions of planned and unplanned interruptions, rules for treatment of planned interruptions can be found in Table 2.2.
TABLE 2.2 I Planned and unplanned interruptions - definitions and rules
Country Planned interruption Unplanned interruption Rules for planned interruptionsAUSTRIA Interruptions where
the grid user has to be informed in advance.
Interruptions caused by lasting or temporary disturbances, mainly related to component malfunction or external disturbances.
No (just the case of mutual agreement is described, where no loss of energy applies).
BULGARIA Planned interruptions are connected to planned works at the request of the network operators, public providers, end suppliers and/or third par-ties, when the customers have been duly notified in advance.
An interruption the customer has not been informed of in advance.
For activities which are subject to planning, the company is under the obligation to inform the customer/network users about the time and duration of an electricity supply interruption through the mass media at least 14 calendar days in advance.
CYPRUS Comply with standard definition.
Comply with standard definition.
Yes, according to rules.
CZECH REPUBLIC Interruptions in electricity transmission network or distribution network when carrying out planned work on transmission or distri-bution devices according to Energy Act (mainly: maintenance, refurbish-ment, construction).
All interruptions in electricity transmission or distribution which are not planned interrup-tions (divided: failure or its removing, forced, exceptional, interruption outside system).
Transmission: 50 days ahead. Distributions: 15 days ahead.
DENMARK At least 48 hours notice to all customers affected.
When the notice is less than 48 hours.
48 hours notice.
ESTONIA Planned due to construc-tion, repairing and mainte-nance works in network.
Due to unpredict-able damages, faults in network.
Rules issued about notice to customers are affected with minimum time-lag requested.
FINLAND Planned interruptions are notified to customers in advance.
Unplanned interrup-tions are not notified to customers in advance.
No rules for planned interruptions by regulator.
5th CEER Benchmarking Report on the Quality of Electricity Supply 9
2. Continuity of Supply
Country Planned interruption Unplanned interruption Rules for planned interruptionsFRANCE An interruption notified
in advance to all affected customers with adequate notice.
An interruption not notified in advance to all affected customers or notified with inadequate notice.
On the transmission network, every planned interruption is planned in cooperation between TSO and impacted customers, in order to minimise the consequences for industrial customers’ activity and to avoid outages for final customers of DSOs. There is a procedure for cooperation with different steps of planning starting from one year (or even more for important works) to one month before the interruption. The last confirmation is given at least 15 days before. On the distribution network, the operator must agree with MV customer a date for the planned interruption at least 10 days before the date (except in case of emergency). Planned inter-ruptions are notified to small customers (<36kVA) by press or by individualised information.
GERMANY Planned interruptions are interruptions with notice or arrangement in advance to the customers in an appropriate manner.
All other interruptions. No.
GREAT BRITAIN A planned interruption is defined as an interruption of supply where notifica-tion has been given to customers affected at least 48 hours before the interruption.
An unplanned interrup-tion is defined as an interruption of supply to customer(s) for three minutes or longer or any occurrence on the distribution system or other connected distributed generation or transmission system that prevents a Circuit or item of equipment from carrying normal load current and where notification has not been given to customers at least 48 hours before the interruption.
At least 48 hours notice should be provided to affected custom-ers - carding customers with the expected interruption duration, etc.
GREECE 48 hour customer notice. No rules issued by the regulator. HUNGARY Planned interruption is
one which all affected customers are notified of in advance.
In case of unplanned interruption, all affected customers are not noti-fied in advance or get an adequate notice.
According to the Guaranteed Standards (and based on the law) there are two different notification rules depending on the power capacity: - with power capacity below 200 kVA customers should be notified 15 days before the planned interruption according to the local practice, e.g. leaflet. - with power capacity of 200 kVA or above customers should be notified 30 days before the planned interruption by a personal letter if there is no other agreement between the parties.
IRELAND Monitored Monitored Yes. A minimum of 2 days notice must be provided. ITALY An interruption notified
in advance to all affected customers with adequate notice.
Different than planned. Rule for distribution network operators: advance notice of 2 working days. Advance notice reduced to 24 hours in case of interventions after faults or during emergencies.
LATVIA Monitored MonitoredLITHUANIA Monitored Monitored
5th CEER Benchmarking Report on the Quality of Electricity Supply 10
2. Continuity of Supply
Country Planned interruption Unplanned interruption Rules for planned interruptionsLUXEMBOURG Previous notice of
interruption. No previous notice of interruption, however, if possible, provisional length of interruption has to be communi-cated to the affected customers.
Network operators are legally bound to inform customers prior to the interruption as early as possible, and by appropriate means about the date and time of the planned interruption.
THE NETHERLANDS
An interruption of which the network operator has informed the affected customers at least 3 work-ing days in advance.
An interruption that is not a planned inter-ruption.
Yes, notice to household customers and industrial customers on the low voltage network must be given at least 3 working days in advance, but no criteria exist relating to the procedure for giving notice. Notice to industrial customers on the medium and high voltage network must be given at least 10 working days in advance and the time of the planned interruption can only be established after consultation with the customer and taking into account the interests of the customer.
NORWAY Planned interruptions: we call them notified inter-ruption. An interruption is considered notified if customers are informed a reasonable amount of time prior to the interrup-tion and the information has been provided in an appropriate manner.
Unplanned interrup-tions: we call them non-notified interrup-tions. An interruption is considered non-notified if it does not fulfill the requirements for a noti-fied interruption.
The interruption must be notified a reasonable amount of time prior to the interruption and the information shall be provided in an appropriate manner. If the interruption is not satisfactorily notified, it shall be regarded as a non-notified interruption.
POLAND Classified as prearranged (planned), when network users are informed in advance, to allow the execution of scheduled works on the distribution system.
Classified as accidental (unplanned), caused by permanent or transient faults, mostly related to external events, equip-ment failures or interference without notice in advance to the customers.
A minimum of 5 days notice must be provided.
PORTUGAL Interruption with notice in accordance with the Com-mercial Relations Code, published by ERSE (NRA).
Interruption without notice.
Interruptions for reasons of public interest: the entity responsi-ble for the network must inform, whenever possible, and with a minimum prior notice of 36 hours, the customers which may be affected by the interruption.• Interruptions for service reasons: the entity responsible for
the network has the duty to minimise the impact of the inter-ruptions among customers. For this purpose, distributors may agree with the clients that will be affected the best moment for the interruption. If the agreement is not possible, the interruptions must occur, preferentially, on Sundays, between 05:00 hours and 15:00 hours, with a maximum duration of 8 hours per interruption and 5 Sundays per year, per customer affected. The entity responsible for the network must inform with a minimum prior notice of 36 hours.
• Interruptions due to customer responsibility: the supply interrup-tion may only take place following a prior notice of interruption, with a minimum advance warning of 8 days relative to the date when it will occur. If the customer installation emits perturbations to the network, the operator establishes, in accordance with the customer, a time period for solving the problem.
5th CEER Benchmarking Report on the Quality of Electricity Supply 11
2. Continuity of Supply
Country Planned interruption Unplanned interruption Rules for planned interruptionsROMANIA The interruption is con-
sidered planned when the customers are informed in advance, usually 15 calendar days and in special circumstances, critical operation condi-tions (if the interruption can however be delayed), 1 day (24 hours) notice.
The interruption is con-sidered unplanned when the customers are not informed in advance.
Usually the planned interruptions are discussed and planned with the big customers.
SLOVAK REPUBLIC
It is not defined. Interruption which comes into being by reason of failure or force majeure.
There are rules - minimum time for giving notice is 15 days.
SLOVENIA According to EN 50160:2010
According to EN 50160:2010
Each customer that will be affected must be informed, using written form or any other suitable form, in a timely manner. If the interruption will affect a large number of customers, the customers must be informed by public notification (by announce-ment on the local radio, publication on the DSO web-pages, notification by using messaging services (SMS, MMS) etc.) at least 48 hours before the start of the interruption.
SPAIN An interruption of continu-ity of supply declared by a distribution firm in advance (72 hours) to Regional Government, and authorised by this institution.
Any interruption not considered as planned interruption.
Planned interruptions must be announced to affected customers giving a minimum of 24 hours advance notice by the follow-ing means: a) By means of individualised notification using a method whereby there is a record of it having been sent to consumers shows supplies are carried out at voltages higher than 1 kV and to those establishments rendering services that are declared to be essential services, b) By means of advertising posters placed in visible spots with regard to all other consum-ers and by means of two of the most widely circulated printed media in the province.
SWEDEN Interruption of the supply to take measures needed for electricity safety reasons or to maintain a food operational security of continuity of supply.
Other than planned interruption.
The interruption shall not be longer than required for the meas-ures to be taken, When interruptions can be known in advance, and where it concerns other than short interruptions, the network operator shall inform the consumer “in time” through personal contact or, where appropriate, through a notice.
5th CEER Benchmarking Report on the Quality of Electricity Supply 12
2. Continuity of Supply
TABLE 2.3 I Voltage levels monitored in the different countries
Country LV MV HV TransmissionAUSTRIA X X XBULGARIA X X X XCYPRUS X X X XCZECH REPUBLIC X X X XDENMARK X X XESTONIA X X XFINLAND X X XFRANCE X X X XGERMANY X X X XGREAT BRITAIN X X X XGREECE X X X XHUNGARY X X X XIRELAND X X XITALY X X X XLATVIA X X XLITHUANIA X X XLUXEMBOURG X X X XTHE NETHERLANDS X X X XNORWAY X X X(3)
POLAND X X X XPORTUGAL X X(1) X XROMANIA X X X XSLOVAK REPUBLIC X X X XSLOVENIA X(2) X XSPAIN X X X XSWEDEN X X X X
(1) Only long interruptions monitored in distribution.(2) Monitoring on the specified levels is required and applied in general, however, the data is not aggregated per particular voltage level (for purposes of reporting). Data
is reported per specified network element (i.e. MV feeder, connection point etc.) and can be processed ex post as needed.(3) All network above 33 kV (33-420 kV) is included in the HV category.
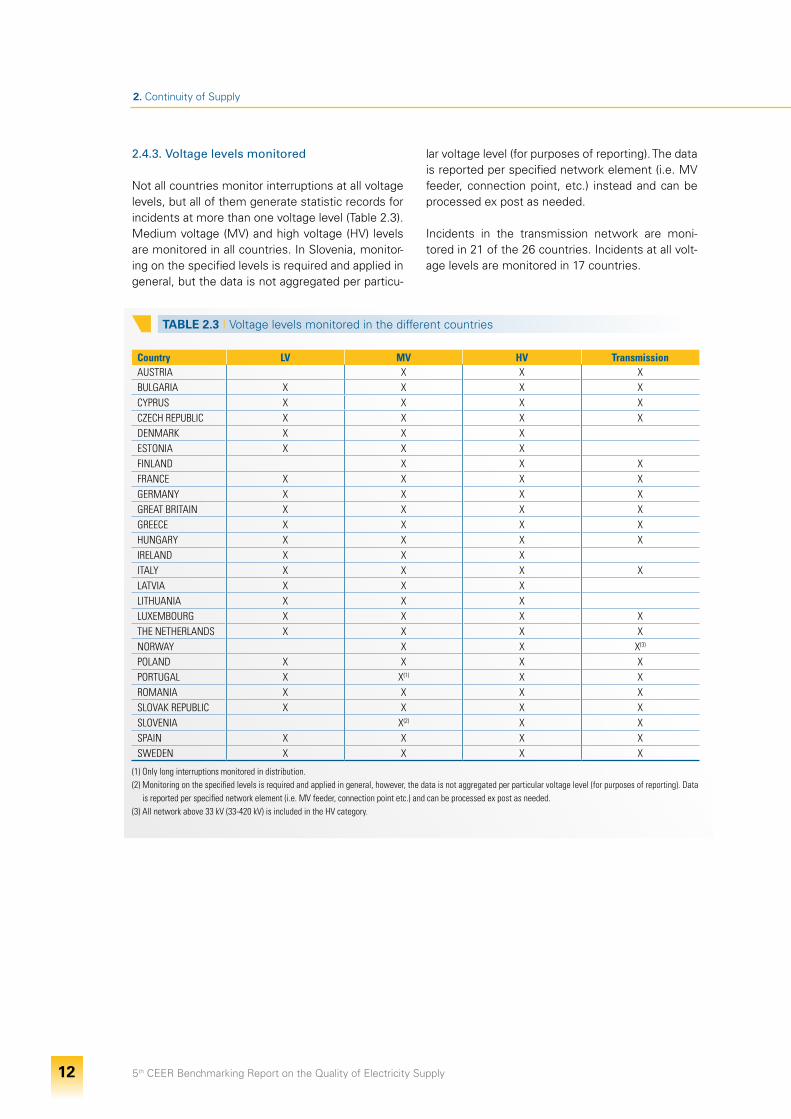
2.4.3. Voltage levels monitored
Not all countries monitor interruptions at all voltage levels, but all of them generate statistic records for incidents at more than one voltage level (Table 2.3). Medium voltage (MV) and high voltage (HV) levels are monitored in all countries. In Slovenia, monitor-ing on the specified levels is required and applied in general, but the data is not aggregated per particu-
lar voltage level (for purposes of reporting). The data is reported per specified network element (i.e. MV feeder, connection point, etc.) instead and can be processed ex post as needed.
Incidents in the transmission network are moni-tored in 21 of the 26 countries. Incidents at all volt-age levels are monitored in 17 countries.
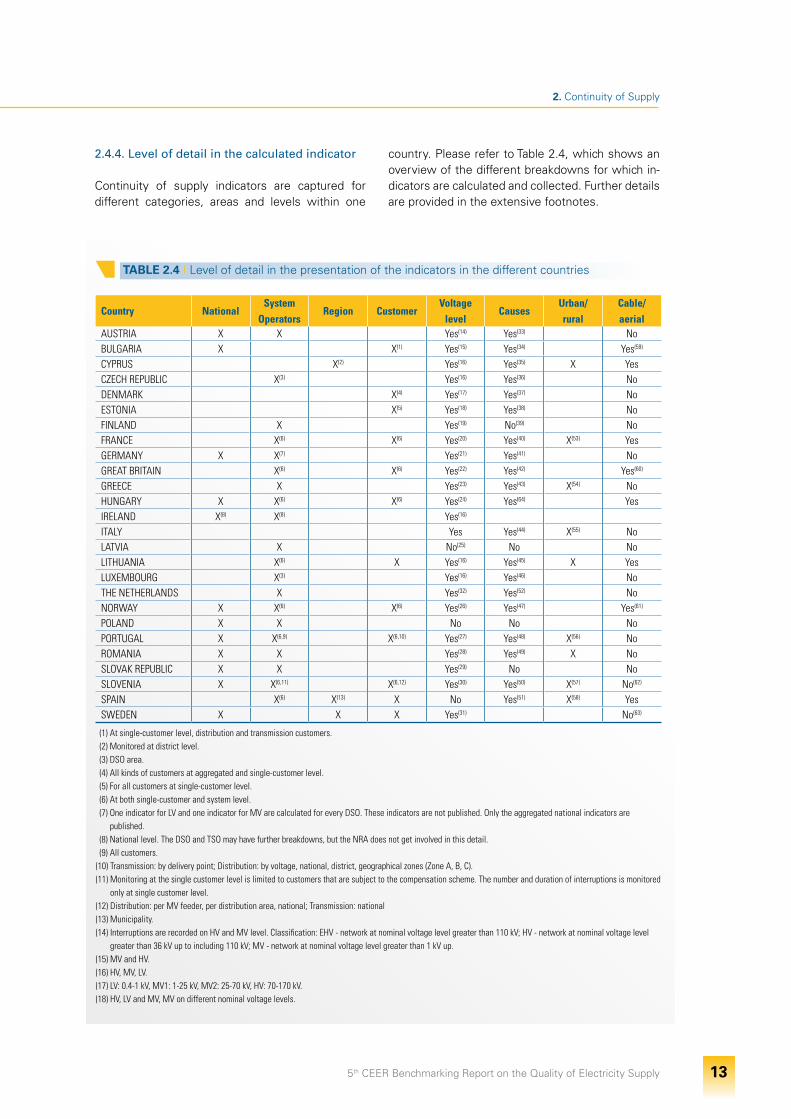
5th CEER Benchmarking Report on the Quality of Electricity Supply 13
2. Continuity of Supply
2.4.4. Level of detail in the calculated indicator
Continuity of supply indicators are captured for different categories, areas and levels within one
country. Please refer to Table 2.4, which shows an overview of the different breakdowns for which in-dicators are calculated and collected. Further details are provided in the extensive footnotes.
TABLE 2.4 I Level of detail in the presentation of the indicators in the different countries
Country NationalSystem
OperatorsRegion Customer
Voltage level
CausesUrban/ rural
Cable/ aerial
AUSTRIA X X Yes(14) Yes(33) No BULGARIA X X(1) Yes(15) Yes(34) Yes(59)
CYPRUS X(2) Yes(16) Yes(35) X Yes CZECH REPUBLIC X(3) Yes(16) Yes(36) No DENMARK X(4) Yes(17) Yes(37) No ESTONIA X(5) Yes(18) Yes(38) No FINLAND X Yes(19) No(39) No FRANCE X(6) X(6) Yes(20) Yes(40) X(53) Yes GERMANY X X(7) Yes(21) Yes(41) No GREAT BRITAIN X(6) X(6) Yes(22) Yes(42) Yes(60)
GREECE X Yes(23) Yes(43) X(54) No HUNGARY X X(6) X(6) Yes(24) Yes(64) Yes IRELAND X(8) X(8) Yes(16) ITALY Yes Yes(44) X(55) No LATVIA X No(25) No No LITHUANIA X(6) X Yes(16) Yes(45) X Yes LUXEMBOURG X(3) Yes(16) Yes(46) No THE NETHERLANDS X Yes(32) Yes(52) No NORWAY X X(6) X(6) Yes(26) Yes(47) Yes(61)
POLAND X X No No No PORTUGAL X X(6,9) X(6,10) Yes(27) Yes(48) X(56) No ROMANIA X X Yes(28) Yes(49) X No SLOVAK REPUBLIC X X Yes(29) No No SLOVENIA X X(6,11) X(6,12) Yes(30) Yes(50) X(57) No(62)
SPAIN X(6) X(13) X No Yes(51) X(58) Yes SWEDEN X X X Yes(31) No(63)
(1) At single-customer level, distribution and transmission customers.(2) Monitored at district level.(3) DSO area.(4) All kinds of customers at aggregated and single-customer level. (5) For all customers at single-customer level.(6) At both single-customer and system level.(7) One indicator for LV and one indicator for MV are calculated for every DSO. These indicators are not published. Only the aggregated national indicators are
published.(8) National level. The DSO and TSO may have further breakdowns, but the NRA does not get involved in this detail. (9) All customers.
(10) Transmission: by delivery point; Distribution: by voltage, national, district, geographical zones (Zone A, B, C).(11) Monitoring at the single customer level is limited to customers that are subject to the compensation scheme. The number and duration of interruptions is monitored
only at single customer level. (12) Distribution: per MV feeder, per distribution area, national; Transmission: national(13) Municipality.(14) Interruptions are recorded on HV and MV level. Classification: EHV - network at nominal voltage level greater than 110 kV; HV - network at nominal voltage level
greater than 36 kV up to including 110 kV; MV - network at nominal voltage level greater than 1 kV up.(15) MV and HV.(16) HV, MV, LV.(17) LV: 0.4-1 kV, MV1: 1-25 kV, MV2: 25-70 kV, HV: 70-170 kV.(18) HV, LV and MV, MV on different nominal voltage levels.
5th CEER Benchmarking Report on the Quality of Electricity Supply 14
2. Continuity of Supply
(19) TSO and regional network operators: 400 kV, 220 kV, 110 kV and DSOs: 1-70 kV. (20) EHV+HV, MV, LV.(21) EHV: Network at nominal voltage level greater than 125 kV; HV: Distribution network at nominal voltage level greater than 72.5 kV up to including 125 kV; MV:
Distribution network at nominal voltage level greater than 1 kV up to including 72.5 kV; LV: Distribution network at nominal voltage level ≤ 1 kV. Data are gathered for all voltage levels but indicators are only calculated and published for LV and MV.
(22) For unplanned incidents: -132 kV damage and non-damage; -EHV (66 kV-22 kV) damage and non-damage; -HV (20 kV-1 kV). LV non-damage; LV Overhead Mains – damage; LV Underground Mains – damage; LV Switchgear – damage; LV Services overhead (excl cut-outs) – damage; LV Services underground (excl cut-outs) – damage. For planned incidents: Planned EHV; Planned HV Pole Mounted/Overhead; Planned HV Ground Mounted/Underground; Planned LV Pole Mounted/Overhead; Planned LV Ground Mounted/Underground. Incidents on the systems of NGC or the transmission companies (in Scotland); Incidents on the systems of distributed generators; and Incidents on any other connected systems – which should be identified.
(23) Interruptions originated at: (a) MV; (b) LV.(24) LV, MV, HV and Transmission system. Interruptions are recorded according to the voltage level of the network, but LV interruptions are only recorded if a consumer
reports it. Distribution level: LV: 0.4 kV, MV: 10-35 kV, HV: 120 kV; Transmission level: 220 kV-750 kV.(25) Interruptions monitored only at specific voltage levels.(26) [<1-22] kV; [33-110] kV; [132] kV; [220-300] kV; 420 kV.(27) Very High Voltage (Urms > 110 kV): 400 kV, 220 kV, 150 kV, 130 kV; HV (45 kV < Urms ≤ 110 kV): 60 kV; MV (1 kV < Urms ≤ 45 kV): 30 kV, 15 kV, 10 kV, 6 kV; LV (Urms ≤ 1 kV): 230 V.(28) Transmission level EHU:220-750 kV, distribution level: HV: 110 kV; MV:1-60 kV; LV: max 1 kV.(29) TSO 220 and 400 kV, DSO VN>1 kV, NN<1 kV.(30) EHV, HV (TSO) and MV (DSO) origins are covered. LV is planned to be covered starting in 2013. Additionally on the MV level, we are recording the interruptions
according to the observation point (MV feeder of the substation). (31) Separation between distribution (0.4 – 20 (130) kV) and regional networks (40 kV- 130 kV).(32) The TSO and DSOs record the exact voltage level at the location of origin of the interruption, but this is later aggregated at the level of LV, MV and HV networks for
publication in the media and for reporting to the regulator.(33) Planned (mutual); unplanned (force majeure, damage caused by third party, system operator internal) interruption of supply.(34) A) Planned interruptions - for planned activities; B) Unplanned interruptions - due to breakdowns, disturbances, etc.; due to/caused by TSO; - due to/caused by
third parties; - due to/caused by force majeure.(35) Planned Interruptions (Expansion of network, maintenance, rectification of network after a fault.) Unplanned Interruptions (Operational reason, weather, related
human error, equipment failure.).(36) Categories of interruption: 1. Unplanned interruptions; 1.1 Faults; 1.1.1. Caused by failure of equipment in Transmission Network or Distribution Network, or during
its operation; 1.1.1.1. Under standard weather conditions; 1.1.1.2. Under severe weather conditions; 1.1.2. Caused by third party interference; 1.2 Enforced; 1.3 Exceptional; 1.4 Caused by event outside of network or by producer; 2. Planned interruptions
(37) Interruptions recorded by number and duration. Classification of causes: Planned 50%; Unplanned 100%; 3. part 10%; Force majeure 0%; Outside own voltage level(38) List of 60 different types of causes, 2 levels what and why happened.(39) Recording: planned and unplanned interruptions in network operators own network. (40) Atmospheric events (lightning, snow, wind…), equipment failures (line, substation…), vegetation contact, human operation cause, customer installation cause,
third party cause, non-identified cause… (41) 1. atmospherical influence; 2. caused by third party; 3. responsibility of the network operator; 4. others; 5. feedback effects caused in other networks; 6. exchange
of meter; 7. force majeure.(42) Categories: Lightning; Rain; Snow and Ice; Freezing Fog & Frost; Wind and gale (including windborne material); Condensation; Corrosion; Mechanical shock or
vibration; Ground subsidence; Flooding; Fire not due to faults; Growing or Falling Trees; Windborne Material, Disruption of intended indoor environment, Falling live trees (not felled), Falling dead trees (not felled), Growing trees, Corrosion due to atmosphere/environment, Birds (including swans and geese), Vermin, wild animals and insects, Farm and domestic animals, Wilful damage, interference or theft. Accidental Contact, Damage or Interference by: Cable TV companies or their contractor; Public Telecoms Operator (eg. BT, Mercury etc) or their contractors; Gas Company or their contractors; water/sewage companies or their contractors; highway authorities or their contractors; farm workers or farm implements; aircraft or unmanned balloons; private individuals (excl. Aircraft/Balloons/Leisure Pursuits); unknown third parties; local building authorities or their contractors; private developers or their contractors; leisure pursuits; other third parties; and DNOC or their contractors. Switching error by DNOC staff, Testing or commissioning error by DNOC staff, Incorrect or inadequate system records, circuit labelling or identification, Corrosion due to Bi-Metal Contact, Incorrect application of equipment by DNOC staff, Faulty installation or construction by DNOC staff, Load current above previous assessment, Incorrect or Unsuitable protection settings or fuse rating, Unsuitable protection settings, Solar Heat, Inadequate rupturing or short circuit capacity, Deterioration due to ageing or wear (excluding corrosion), Fault on equipment faulting adjacent equipment, Unsuitable paralleling conditions, Failure of infeed from Adjacent Distribution Network, Operational or safety restriction, Extension of Fault Zone due to Fault Switching (including ASC held faults), Inadequate or faulty maintenance, Extension of Fault Zone due to incorrect operation of equipment (includes slow opening CB’s), Failure of Supply from Generating Company or NGC, Switching Error by Contractors, Testing or commissioning error by Contractors, Incorrect application of equipment by Contractors, Faulty Installation or Construction by Contractors, Fault on customers network causing operation of Network Protection. Interruption to remove local generator or restore temporary connections (where in use >18 hours), Local generation failure (isolated system), Distribution equipment affected by National Grid Company personnel or equipment, Distribution equipment affected by private generator or authorised electricity operator (not NGC), Faulty Classification: For each recorded incident the DNOs have to record a cause code as the reason for the incident. So if there was an incident due to a branch hitting a line and causing an interruption for customers, the DNO would put the cause code in the reporting template against this incident.
(43) Unplanned interruptions: 1. External (due to transmission system infeed loss, fires, floods etc); 2. Due to exceptional weather conditions; 3. Other. Planned interrup-tions: 1. System development works; 2. Maintenance works; 3. Repair work.
(44) Category: For transmission, there are four macro-categories: lack of system adequacy, force majeure, external causes (i.e. users), TSO causes. For distribution, there are three macro-categories: force majeure, external causes (i.e. users), DNO causes. Classification: For transmission, there is a 2nd level classification (about 15 causes) and 3rd level classification (about 50 causes). For distribution, a 2nd level classification was recently proposed to enter into force in 2012 (about 20 causes).
5th CEER Benchmarking Report on the Quality of Electricity Supply 15
2. Continuity of Supply
(45) 1. Force majeure; 2. External causes; 3. Causes attributable to system operator responsibility; 4. Non - identified causes.(46) Currently under redefinition; (more detailed regulations will enter in force in the beginning of the second quarter of 2011). (47) Main categories: 1- surroundings; 2- people (staff); 3- people (others); 4- operational stress; 5- technical equipment; 6- design/ installation; 7- others; 8- cause
unknown. These main categories are further divided into subcategories. In audits, NVE emphasises the importance of trying to avoid using the category “cause unknown”.
(48) The Commercial Relations Code, published by ERSE, establishes the situation in which supply can be interrupted (some of them are planned and others unplanned): Force majeure, due to the customer, security reasons, working reasons and public interest. Related to unplanned interruptions, the network operators included more category causes. It is possible to identify the following types of causes: internal related to the network operator, external related to the network operator, related to the equipment, human, maintenance, environmental...
(49) a. planned; b. unplanned due to force majeure; c. unplanned due to customers; d. unplanned excluding b and c. (50) No cause categories are applied. Classification: All interruptions must be classified into one of the categories. Unidentified causes are attributed to the DSO/TSO
(responsibility of DSO/TSO). Slovenia doesn’t categorise the cause of short interruptions.(51) For planned interruptions: transmission and distribution. For unplanned interruptions: Third party, generation, transmission, force majure, distribution.(52) Manufacturer, network design, assembly, operation, aging/wear, external influence (e.g. excavation works), soil movement, moisture, weather, operational stress,
internal defect, unknown. (53) There are three types of areas: 1. Zone A: customers living in or close to large cities (>100,000 inhabitants); 2. Zone B: customers living in or close to medium cities
(>10,000 inhabitants); 3. Rural zone.(54) No classification exists for urban and rural areas. The criteria for the definition of a distribution area are administrative. (55) Urban: cities more 50,000 inhabitants; Mid: 5,000 < inh. < 50,000; Rural: villages less 5,000 inhabitants.(56) Since 2006: Zone A (Urban): main cities and localities with more than 25,000 customers; Zone B (Semi-urban): locality with less than 25,000 and more than 2,500 customers; Zone C (Rural): locality with less than 2,500 customers.(57) Each MV feeder is classified by type (urban, mixed, rural): urban type: 2/3 of all connected customers must be located in urban settlements; rural type: 2/3 of all connected customers must be located outside the urban settlements; mixed type: cannot be classified as one of the above types. The classification of settlements is based on the standardised methodology defined by Statistical Office of the Republic of Slovenia (“Urban settlements in the Republic of Slovenia”, 2003): the combined criteria is applied, using a threshold of 3,000 inhabitants for an urban settlement as a “core” criteria. Three additional criteria are applied allowing even smaller settle-ments to classify into urban in case they have a surplus of registered workplaces over the number of active (employed) persons.(58) Urban: Supplies > 20,000 (Capital Cities Included); Rural: 200 < Supplies < 2,000.(59) There is interruption data available for cable, overhead lines, transformer stations and substations.(60) Overhead lines; Underground cables; Submarine cables; Ground-mounted circuit breakers; All other ground-mounted switchgear; Pole- or structure-mounted circuit
breakers; All other pole- or structure-mounted switchgear; Ground-mounted power transformers, reactors.(61) Data are also reported separately for different network IDs: distribution network - overhead lines, distribution network - cables, distribution network - mixed, re-
gional grid and central grid. In this context, networks mean installation components protected by the same circuit breaker/fuse. Definition of Network IDs: Distribu-tion network: network with a nominal voltage up to and including 22 kV (included LV), unless otherwise decided; Overhead line distribution network: network where more than 90% of the network consists of overhead lines (measured in km); Cable distribution network: network where more than 90% of the network consists of cable (measured in km); Mixed distribution network: network which consists of less than 90% overhead lines and cables (measured in km); Regional grid: network between the central grid and the distribution network; Central grid: installations in the network at a voltage level of 132 kV or higher that are defined as installa-tions in the central grid (individual decision by the regulator). Each reporting point (and each customer) is defined with a network ID.
(62) Following characteristics of the electricity network that is correlated with the continuity data are used: - percentage of underground cable; - percentage of overhead lines.
(63) Characteristics for the electricity network that can be correlated with the continuity data are percentage of underground cable and percentage of overhead lines. (64) The classification of causes is made by the DSOs.
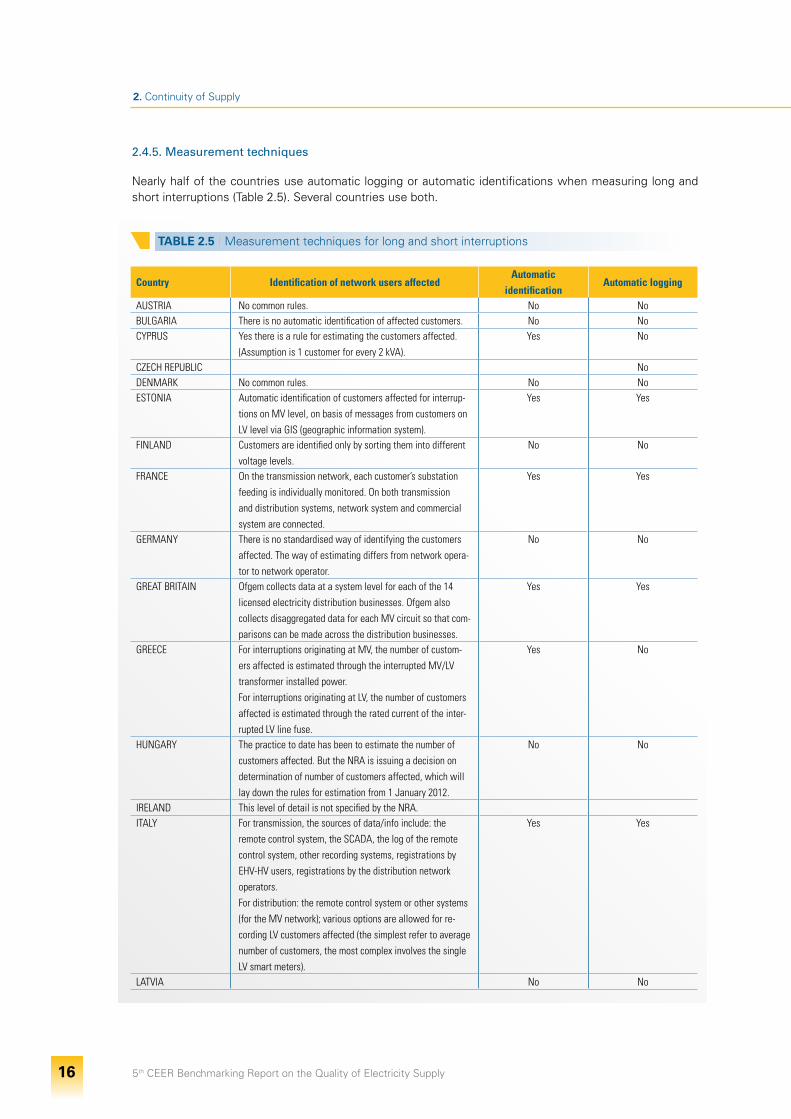
5th CEER Benchmarking Report on the Quality of Electricity Supply 16
2. Continuity of Supply
2.4.5. Measurement techniques
Nearly half of the countries use automatic logging or automatic identifications when measuring long and short interruptions (Table 2.5). Several countries use both.
TABLE 2.5 I Measurement techniques for long and short interruptions
Country Identification of network users affectedAutomatic
identificationAutomatic logging
AUSTRIA No common rules. No NoBULGARIA There is no automatic identification of affected customers. No NoCYPRUS Yes there is a rule for estimating the customers affected.
(Assumption is 1 customer for every 2 kVA). Yes No
CZECH REPUBLIC NoDENMARK No common rules. No NoESTONIA Automatic identification of customers affected for interrup-
tions on MV level, on basis of messages from customers on LV level via GIS (geographic information system).
Yes Yes
FINLAND Customers are identified only by sorting them into different voltage levels.
No No
FRANCE On the transmission network, each customer’s substation feeding is individually monitored. On both transmission and distribution systems, network system and commercial system are connected.
Yes Yes
GERMANY There is no standardised way of identifying the customers affected. The way of estimating differs from network opera-tor to network operator.
No No
GREAT BRITAIN Ofgem collects data at a system level for each of the 14 licensed electricity distribution businesses. Ofgem also collects disaggregated data for each MV circuit so that com-parisons can be made across the distribution businesses.
Yes Yes
GREECE For interruptions originating at MV, the number of custom-ers affected is estimated through the interrupted MV/LV transformer installed power.For interruptions originating at LV, the number of customers affected is estimated through the rated current of the inter-rupted LV line fuse.
Yes No
HUNGARY The practice to date has been to estimate the number of customers affected. But the NRA is issuing a decision on determination of number of customers affected, which will lay down the rules for estimation from 1 January 2012.
No No
IRELAND This level of detail is not specified by the NRA. ITALY For transmission, the sources of data/info include: the
remote control system, the SCADA, the log of the remote control system, other recording systems, registrations by EHV-HV users, registrations by the distribution network operators.For distribution: the remote control system or other systems (for the MV network); various options are allowed for re-cording LV customers affected (the simplest refer to average number of customers, the most complex involves the single LV smart meters).
Yes Yes
LATVIA No No
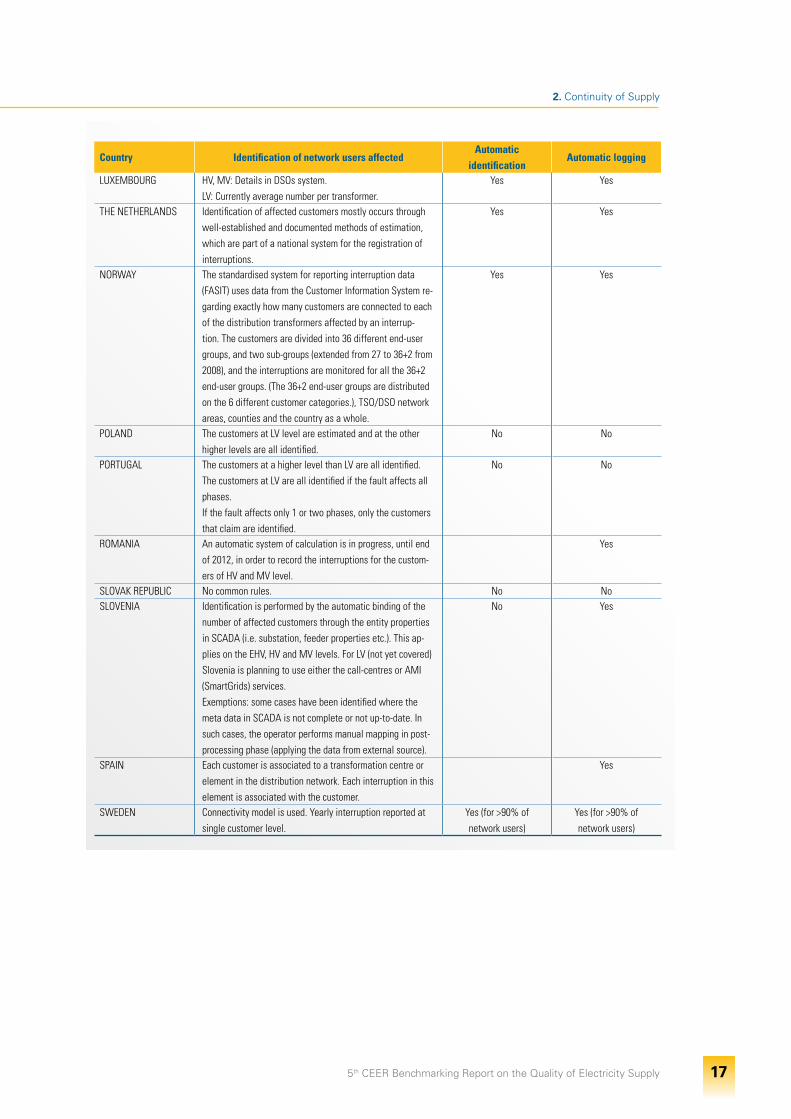
5th CEER Benchmarking Report on the Quality of Electricity Supply 17
2. Continuity of Supply
Country Identification of network users affectedAutomatic
identificationAutomatic logging
LUXEMBOURG HV, MV: Details in DSOs system.LV: Currently average number per transformer.
Yes Yes
THE NETHERLANDS Identification of affected customers mostly occurs through well-established and documented methods of estimation, which are part of a national system for the registration of interruptions.
Yes Yes
NORWAY The standardised system for reporting interruption data (FASIT) uses data from the Customer Information System re-garding exactly how many customers are connected to each of the distribution transformers affected by an interrup-tion. The customers are divided into 36 different end-user groups, and two sub-groups (extended from 27 to 36+2 from 2008), and the interruptions are monitored for all the 36+2 end-user groups. (The 36+2 end-user groups are distributed on the 6 different customer categories.), TSO/DSO network areas, counties and the country as a whole.
Yes Yes
POLAND The customers at LV level are estimated and at the other higher levels are all identified.
No No
PORTUGAL The customers at a higher level than LV are all identified.The customers at LV are all identified if the fault affects all phases.If the fault affects only 1 or two phases, only the customers that claim are identified.
No No
ROMANIA An automatic system of calculation is in progress, until end of 2012, in order to record the interruptions for the custom-ers of HV and MV level.
Yes
SLOVAK REPUBLIC No common rules. No NoSLOVENIA Identification is performed by the automatic binding of the
number of affected customers through the entity properties in SCADA (i.e. substation, feeder properties etc.). This ap-plies on the EHV, HV and MV levels. For LV (not yet covered) Slovenia is planning to use either the call-centres or AMI (SmartGrids) services.Exemptions: some cases have been identified where the meta data in SCADA is not complete or not up-to-date. In such cases, the operator performs manual mapping in post-processing phase (applying the data from external source).
No Yes
SPAIN Each customer is associated to a transformation centre or element in the distribution network. Each interruption in this element is associated with the customer.
Yes
SWEDEN Connectivity model is used. Yearly interruption reported at single customer level.
Yes (for >90% of network users)
Yes (for >90% of network users)
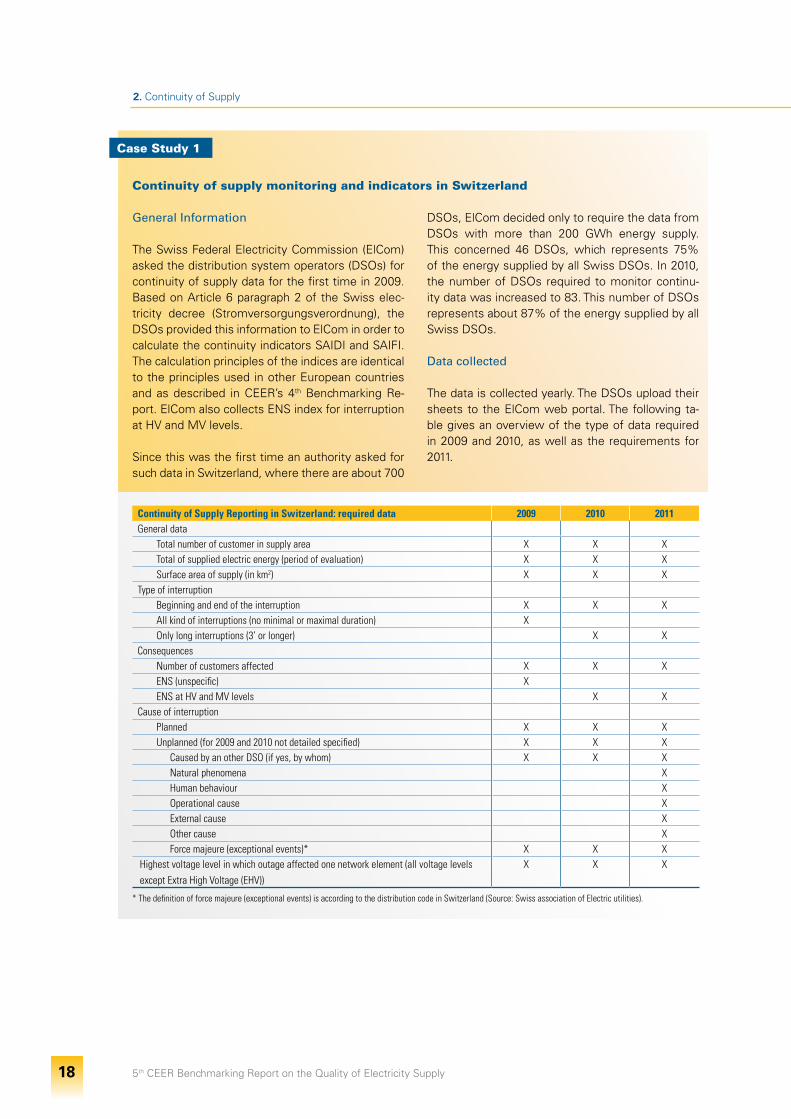
5th CEER Benchmarking Report on the Quality of Electricity Supply 18
2. Continuity of Supply
Continuity of supply monitoring and indicators in Switzerland
General Information
The Swiss Federal Electricity Commission (ElCom) asked the distribution system operators (DSOs) for continuity of supply data for the first time in 2009. Based on Article 6 paragraph 2 of the Swiss elec-tricity decree (Stromversorgungsverordnung), the DSOs provided this information to ElCom in order to calculate the continuity indicators SAIDI and SAIFI. The calculation principles of the indices are identical to the principles used in other European countries and as described in CEER’s 4th Benchmarking Re-port. ElCom also collects ENS index for interruption at HV and MV levels.
Since this was the first time an authority asked for such data in Switzerland, where there are about 700
DSOs, ElCom decided only to require the data from DSOs with more than 200 GWh energy supply. This concerned 46 DSOs, which represents 75% of the energy supplied by all Swiss DSOs. In 2010, the number of DSOs required to monitor continu-ity data was increased to 83. This number of DSOs represents about 87% of the energy supplied by all Swiss DSOs.
Data collected
The data is collected yearly. The DSOs upload their sheets to the ElCom web portal. The following ta-ble gives an overview of the type of data required in 2009 and 2010, as well as the requirements for 2011.
Continuity of Supply Reporting in Switzerland: required data 2009 2010 2011General data
Total number of customer in supply area X X XTotal of supplied electric energy (period of evaluation) X X XSurface area of supply (in km2) X X X
Type of interruptionBeginning and end of the interruption X X XAll kind of interruptions (no minimal or maximal duration) XOnly long interruptions (3’ or longer) X X
ConsequencesNumber of customers affected X X XENS (unspecific) XENS at HV and MV levels X X
Cause of interruptionPlanned X X XUnplanned (for 2009 and 2010 not detailed specified) X X X
Caused by an other DSO (if yes, by whom) X X XNatural phenomena XHuman behaviour XOperational cause XExternal cause XOther cause XForce majeure (exceptional events)* X X X
Highest voltage level in which outage affected one network element (all voltage levels except Extra High Voltage (EHV))
X X X
* The definition of force majeure (exceptional events) is according to the distribution code in Switzerland (Source: Swiss association of Electric utilities).
Case Study 1
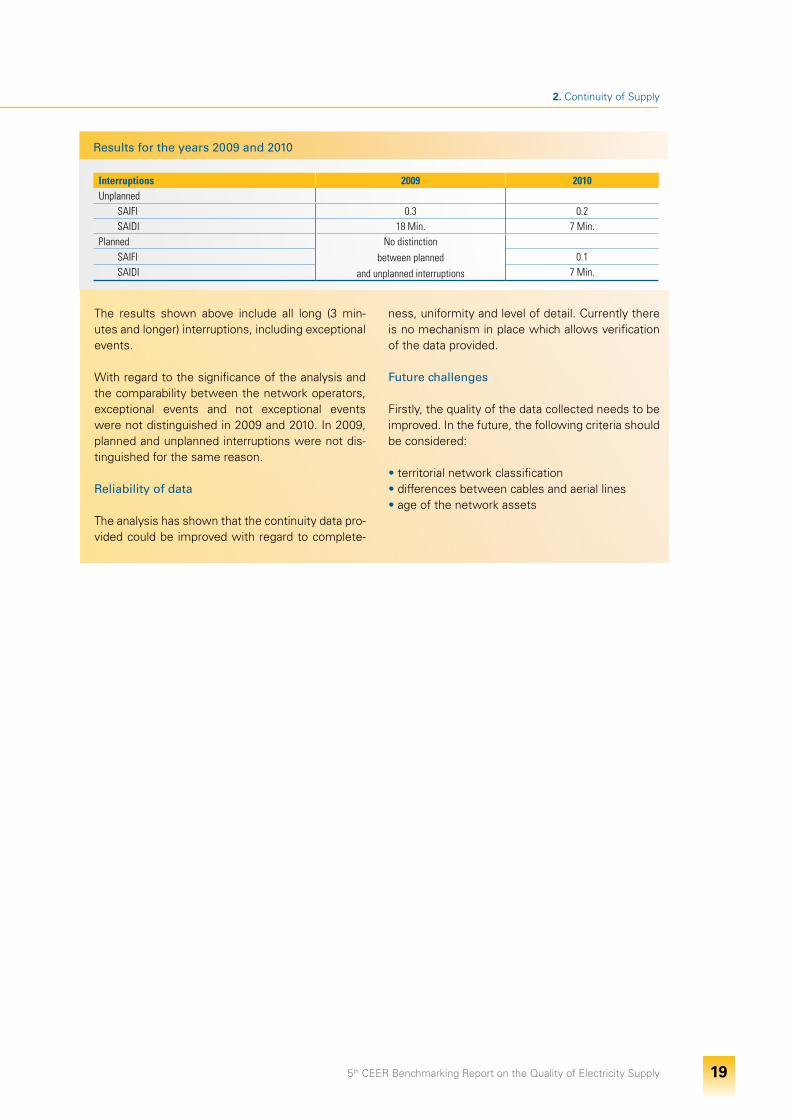
5th CEER Benchmarking Report on the Quality of Electricity Supply 19
2. Continuity of Supply
Results for the years 2009 and 2010
Interruptions 2009 2010Unplanned
SAIFI 0.3 0.2SAIDI 18 Min. 7 Min.
Planned No distinctionbetween planned
and unplanned interruptions
SAIFI 0.1SAIDI 7 Min.
The results shown above include all long (3 min-utes and longer) interruptions, including exceptional events.
With regard to the significance of the analysis and the comparability between the network operators, exceptional events and not exceptional events were not distinguished in 2009 and 2010. In 2009, planned and unplanned interruptions were not dis-tinguished for the same reason.
Reliability of data
The analysis has shown that the continuity data pro-vided could be improved with regard to complete-
ness, uniformity and level of detail. Currently there is no mechanism in place which allows verification of the data provided.
Future challenges
Firstly, the quality of the data collected needs to be improved. In the future, the following criteria should be considered:
• territorial network classification• differences between cables and aerial lines • age of the network assets
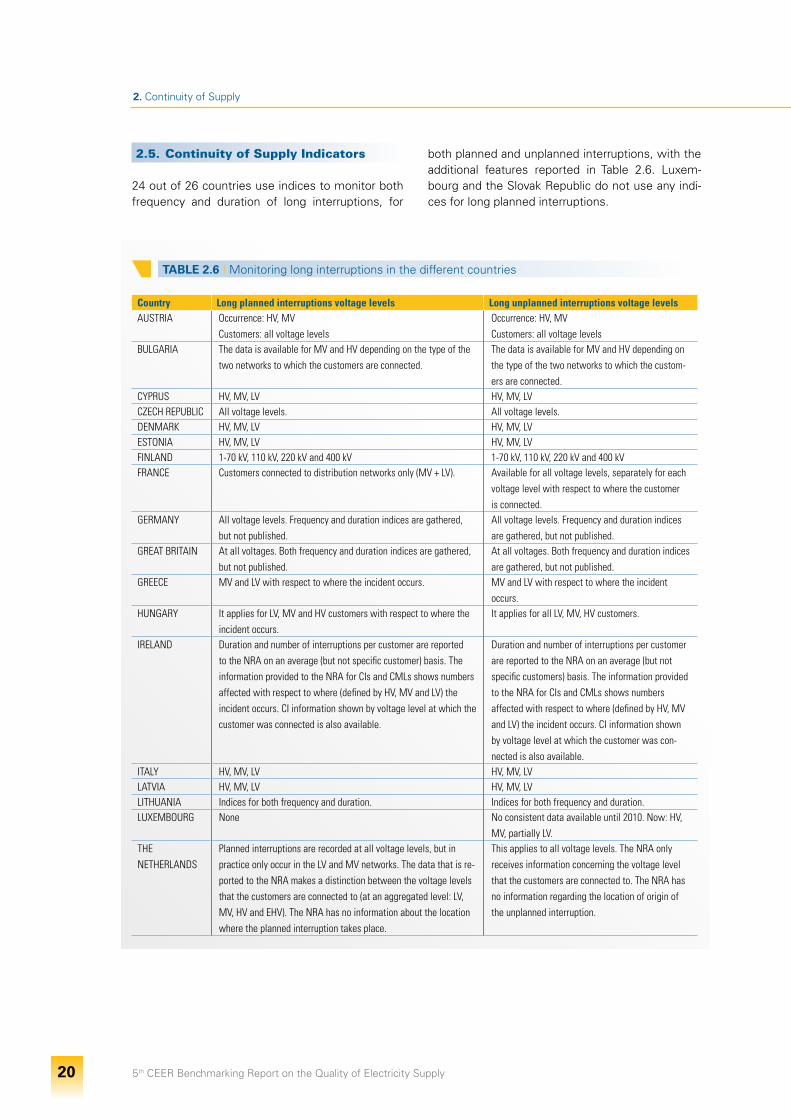
5th CEER Benchmarking Report on the Quality of Electricity Supply 20
2. Continuity of Supply
TABLE 2.6 I Monitoring long interruptions in the different countries
Country Long planned interruptions voltage levels Long unplanned interruptions voltage levelsAUSTRIA Occurrence: HV, MV
Customers: all voltage levelsOccurrence: HV, MVCustomers: all voltage levels
BULGARIA The data is available for MV and HV depending on the type of the two networks to which the customers are connected.
The data is available for MV and HV depending on the type of the two networks to which the custom-ers are connected.
CYPRUS HV, MV, LV HV, MV, LVCZECH REPUBLIC All voltage levels. All voltage levels.DENMARK HV, MV, LV HV, MV, LVESTONIA HV, MV, LV HV, MV, LVFINLAND 1-70 kV, 110 kV, 220 kV and 400 kV 1-70 kV, 110 kV, 220 kV and 400 kVFRANCE Customers connected to distribution networks only (MV + LV). Available for all voltage levels, separately for each
voltage level with respect to where the customer is connected.
GERMANY All voltage levels. Frequency and duration indices are gathered, but not published.
All voltage levels. Frequency and duration indices are gathered, but not published.
GREAT BRITAIN At all voltages. Both frequency and duration indices are gathered, but not published.
At all voltages. Both frequency and duration indices are gathered, but not published.
GREECE MV and LV with respect to where the incident occurs. MV and LV with respect to where the incident occurs.
HUNGARY It applies for LV, MV and HV customers with respect to where the incident occurs.
It applies for all LV, MV, HV customers.
IRELAND Duration and number of interruptions per customer are reported to the NRA on an average (but not specific customer) basis. The information provided to the NRA for CIs and CMLs shows numbers affected with respect to where (defined by HV, MV and LV) the incident occurs. CI information shown by voltage level at which the customer was connected is also available.
Duration and number of interruptions per customer are reported to the NRA on an average (but not specific customers) basis. The information provided to the NRA for CIs and CMLs shows numbers affected with respect to where (defined by HV, MV and LV) the incident occurs. CI information shown by voltage level at which the customer was con-nected is also available.
ITALY HV, MV, LV HV, MV, LVLATVIA HV, MV, LV HV, MV, LVLITHUANIA Indices for both frequency and duration. Indices for both frequency and duration.LUXEMBOURG None No consistent data available until 2010. Now: HV,
MV, partially LV.THE NETHERLANDS
Planned interruptions are recorded at all voltage levels, but in practice only occur in the LV and MV networks. The data that is re-ported to the NRA makes a distinction between the voltage levels that the customers are connected to (at an aggregated level: LV, MV, HV and EHV). The NRA has no information about the location where the planned interruption takes place.
This applies to all voltage levels. The NRA only receives information concerning the voltage level that the customers are connected to. The NRA has no information regarding the location of origin of the unplanned interruption.
2.5. Continuity of Supply Indicators
24 out of 26 countries use indices to monitor both frequency and duration of long interruptions, for
both planned and unplanned interruptions, with the additional features reported in Table 2.6. Luxem-bourg and the Slovak Republic do not use any indi-ces for long planned interruptions.
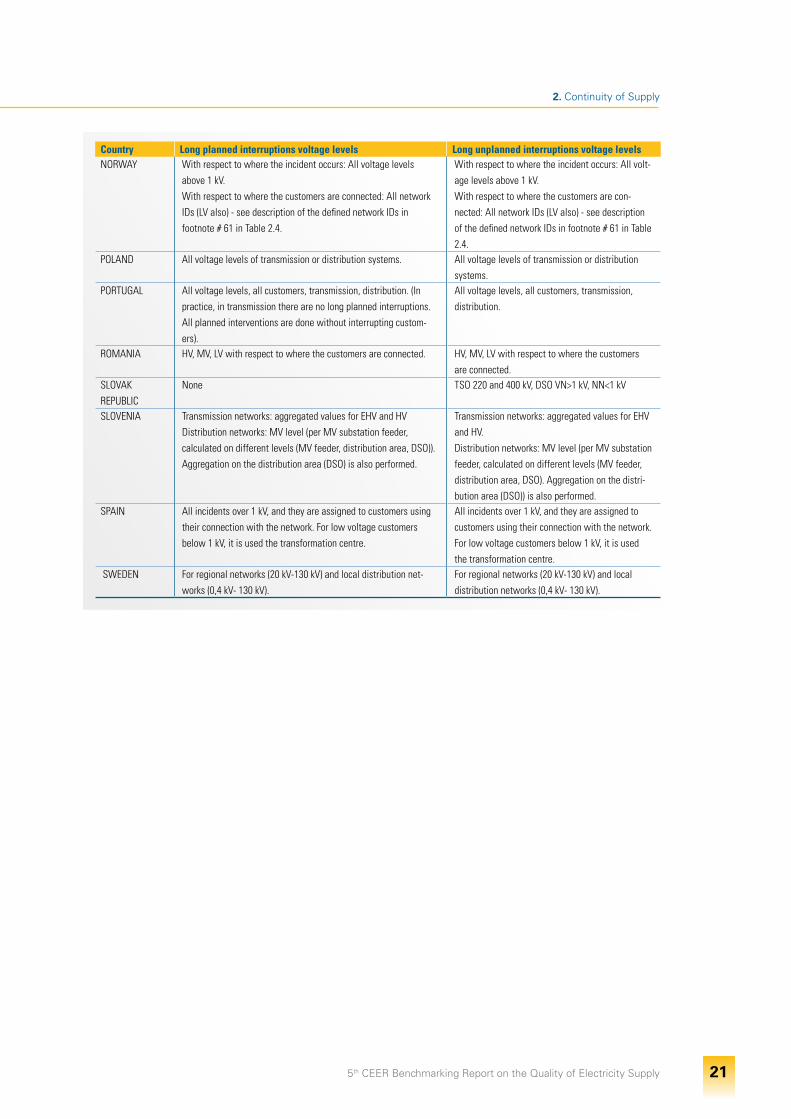
5th CEER Benchmarking Report on the Quality of Electricity Supply 21
2. Continuity of Supply
Country Long planned interruptions voltage levels Long unplanned interruptions voltage levelsNORWAY With respect to where the incident occurs: All voltage levels
above 1 kV.With respect to where the customers are connected: All network IDs (LV also) - see description of the defined network IDs in footnote # 61 in Table 2.4.
With respect to where the incident occurs: All volt-age levels above 1 kV.With respect to where the customers are con-nected: All network IDs (LV also) - see description of the defined network IDs in footnote # 61 in Table 2.4.
POLAND All voltage levels of transmission or distribution systems. All voltage levels of transmission or distribution systems.
PORTUGAL All voltage levels, all customers, transmission, distribution. (In practice, in transmission there are no long planned interruptions. All planned interventions are done without interrupting custom-ers).
All voltage levels, all customers, transmission, distribution.
ROMANIA HV, MV, LV with respect to where the customers are connected. HV, MV, LV with respect to where the customers are connected.
SLOVAK REPUBLIC
None TSO 220 and 400 kV, DSO VN>1 kV, NN<1 kV
SLOVENIA Transmission networks: aggregated values for EHV and HVDistribution networks: MV level (per MV substation feeder, calculated on different levels (MV feeder, distribution area, DSO)). Aggregation on the distribution area (DSO) is also performed.
Transmission networks: aggregated values for EHV and HV.Distribution networks: MV level (per MV substation feeder, calculated on different levels (MV feeder, distribution area, DSO). Aggregation on the distri-bution area (DSO)) is also performed.
SPAIN All incidents over 1 kV, and they are assigned to customers using their connection with the network. For low voltage customers below 1 kV, it is used the transformation centre.
All incidents over 1 kV, and they are assigned to customers using their connection with the network. For low voltage customers below 1 kV, it is used the transformation centre.
SWEDEN For regional networks (20 kV-130 kV) and local distribution net-works (0,4 kV- 130 kV).
For regional networks (20 kV-130 kV) and local distribution networks (0,4 kV- 130 kV).
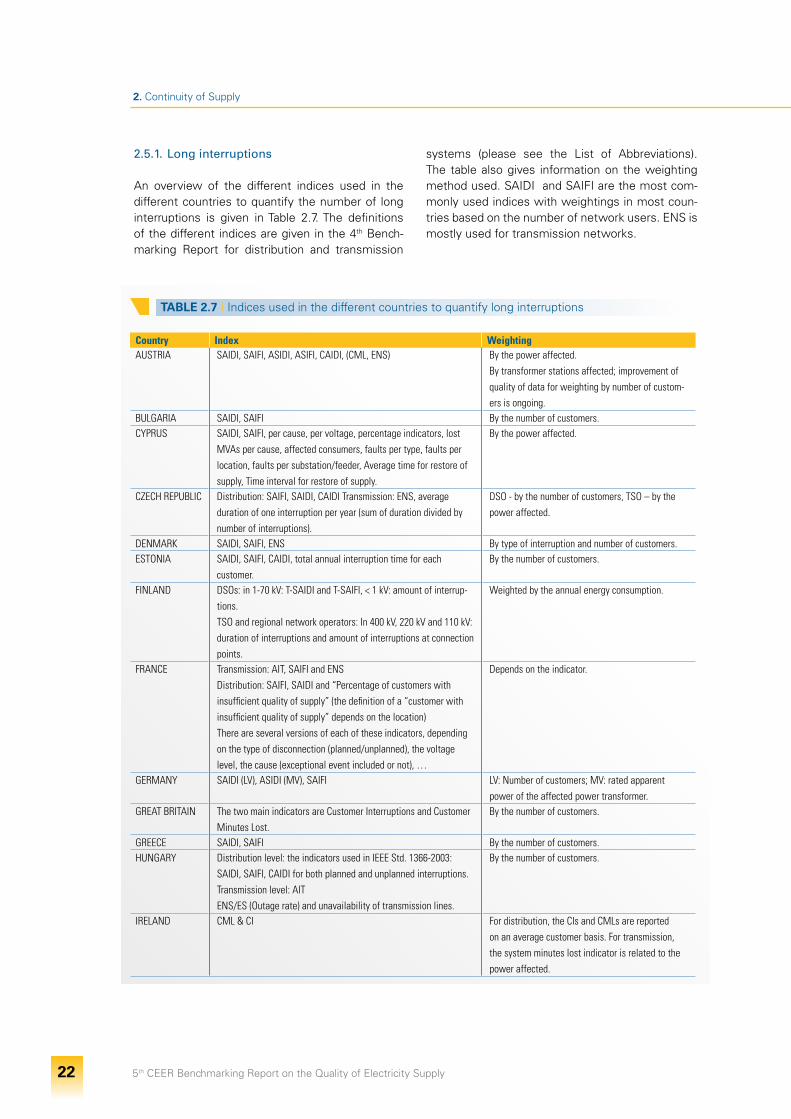
5th CEER Benchmarking Report on the Quality of Electricity Supply 22
2. Continuity of Supply
2.5.1. Long interruptions
An overview of the different indices used in the different countries to quantify the number of long interruptions is given in Table 2.7. The definitions of the different indices are given in the 4th Bench-marking Report for distribution and transmission
systems (please see the List of Abbreviations). The table also gives information on the weighting method used. SAIDI and SAIFI are the most com-monly used indices with weightings in most coun-tries based on the number of network users. ENS is mostly used for transmission networks.
TABLE 2.7 I Indices used in the different countries to quantify long interruptions
Country Index WeightingAUSTRIA SAIDI, SAIFI, ASIDI, ASIFI, CAIDI, (CML, ENS) By the power affected.
By transformer stations affected; improvement of quality of data for weighting by number of custom-ers is ongoing.
BULGARIA SAIDI, SAIFI By the number of customers.CYPRUS SAIDI, SAIFI, per cause, per voltage, percentage indicators, lost
MVAs per cause, affected consumers, faults per type, faults per location, faults per substation/feeder, Average time for restore of supply, Time interval for restore of supply.
By the power affected.
CZECH REPUBLIC Distribution: SAIFI, SAIDI, CAIDI Transmission: ENS, average duration of one interruption per year (sum of duration divided by number of interruptions).
DSO - by the number of customers, TSO – by the power affected.
DENMARK SAIDI, SAIFI, ENS By type of interruption and number of customers.ESTONIA SAIDI, SAIFI, CAIDI, total annual interruption time for each
customer.By the number of customers.
FINLAND DSOs: in 1-70 kV: T-SAIDI and T-SAIFI, < 1 kV: amount of interrup-tions.TSO and regional network operators: In 400 kV, 220 kV and 110 kV: duration of interruptions and amount of interruptions at connection points.
Weighted by the annual energy consumption.
FRANCE Transmission: AIT, SAIFI and ENSDistribution: SAIFI, SAIDI and “Percentage of customers with insufficient quality of supply” (the definition of a “customer with insufficient quality of supply” depends on the location)There are several versions of each of these indicators, depending on the type of disconnection (planned/unplanned), the voltage level, the cause (exceptional event included or not), …
Depends on the indicator.
GERMANY SAIDI (LV), ASIDI (MV), SAIFI LV: Number of customers; MV: rated apparent power of the affected power transformer.
GREAT BRITAIN The two main indicators are Customer Interruptions and Customer Minutes Lost.
By the number of customers.
GREECE SAIDI, SAIFI By the number of customers.HUNGARY Distribution level: the indicators used in IEEE Std. 1366-2003:
SAIDI, SAIFI, CAIDI for both planned and unplanned interruptions.Transmission level: AIT ENS/ES (Outage rate) and unavailability of transmission lines.
By the number of customers.
IRELAND CML & CI For distribution, the CIs and CMLs are reported on an average customer basis. For transmission, the system minutes lost indicator is related to the power affected.
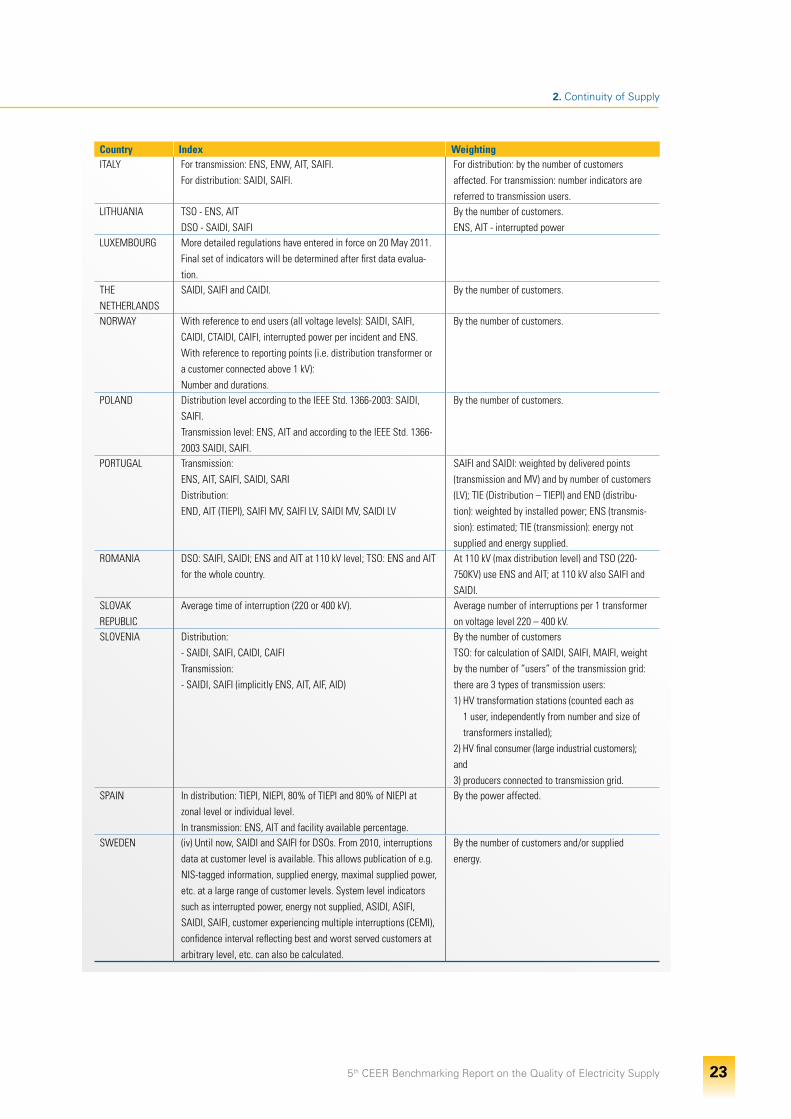
5th CEER Benchmarking Report on the Quality of Electricity Supply 23
2. Continuity of Supply
Country Index WeightingITALY For transmission: ENS, ENW, AIT, SAIFI.
For distribution: SAIDI, SAIFI.For distribution: by the number of customers affected. For transmission: number indicators are referred to transmission users.
LITHUANIA TSO - ENS, AITDSO - SAIDI, SAIFI
By the number of customers.ENS, AIT - interrupted power
LUXEMBOURG More detailed regulations have entered in force on 20 May 2011. Final set of indicators will be determined after first data evalua-tion.
THE NETHERLANDS
SAIDI, SAIFI and CAIDI. By the number of customers.
NORWAY With reference to end users (all voltage levels): SAIDI, SAIFI, CAIDI, CTAIDI, CAIFI, interrupted power per incident and ENS.With reference to reporting points (i.e. distribution transformer or a customer connected above 1 kV):Number and durations.
By the number of customers.
POLAND Distribution level according to the IEEE Std. 1366-2003: SAIDI, SAIFI.Transmission level: ENS, AIT and according to the IEEE Std. 1366-2003 SAIDI, SAIFI.
By the number of customers.
PORTUGAL Transmission:ENS, AIT, SAIFI, SAIDI, SARIDistribution:END, AIT (TIEPI), SAIFI MV, SAIFI LV, SAIDI MV, SAIDI LV
SAIFI and SAIDI: weighted by delivered points (transmission and MV) and by number of customers (LV); TIE (Distribution – TIEPI) and END (distribu-tion): weighted by installed power; ENS (transmis-sion): estimated; TIE (transmission): energy not supplied and energy supplied.
ROMANIA DSO: SAIFI, SAIDI; ENS and AIT at 110 kV level; TSO: ENS and AIT for the whole country.
At 110 kV (max distribution level) and TSO (220-750KV) use ENS and AIT; at 110 kV also SAIFI and SAIDI.
SLOVAK REPUBLIC
Average time of interruption (220 or 400 kV). Average number of interruptions per 1 transformer on voltage level 220 – 400 kV.
SLOVENIA Distribution:- SAIDI, SAIFI, CAIDI, CAIFITransmission:- SAIDI, SAIFI (implicitly ENS, AIT, AIF, AID)
By the number of customersTSO: for calculation of SAIDI, SAIFI, MAIFI, weight by the number of “users” of the transmission grid: there are 3 types of transmission users:1) HV transformation stations (counted each as
1 user, independently from number and size of transformers installed);
2) HV final consumer (large industrial customers); and 3) producers connected to transmission grid.
SPAIN In distribution: TIEPI, NIEPI, 80% of TIEPI and 80% of NIEPI at zonal level or individual level.In transmission: ENS, AIT and facility available percentage.
By the power affected.
SWEDEN (iv) Until now, SAIDI and SAIFI for DSOs. From 2010, interruptions data at customer level is available. This allows publication of e.g. NIS-tagged information, supplied energy, maximal supplied power, etc. at a large range of customer levels. System level indicators such as interrupted power, energy not supplied, ASIDI, ASIFI, SAIDI, SAIFI, customer experiencing multiple interruptions (CEMI), confidence interval reflecting best and worst served customers at arbitrary level, etc. can also be calculated.
By the number of customers and/or supplied energy.
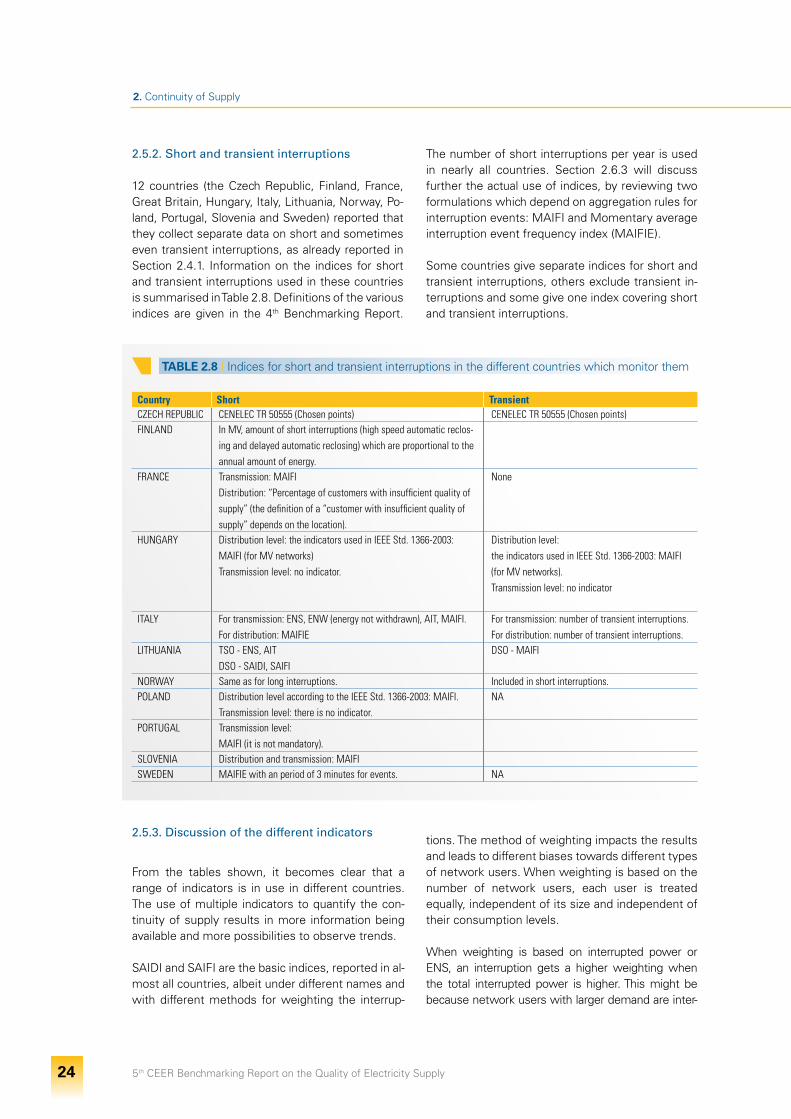
5th CEER Benchmarking Report on the Quality of Electricity Supply 24
2. Continuity of Supply
2.5.2. Short and transient interruptions
12 countries (the Czech Republic, Finland, France, Great Britain, Hungary, Italy, Lithuania, Norway, Po-land, Portugal, Slovenia and Sweden) reported that they collect separate data on short and sometimes even transient interruptions, as already reported in Section 2.4.1. Information on the indices for short and transient interruptions used in these countries is summarised in Table 2.8. Definitions of the various indices are given in the 4th Benchmarking Report.
TABLE 2.8 I Indices for short and transient interruptions in the different countries which monitor them
Country Short TransientCZECH REPUBLIC CENELEC TR 50555 (Chosen points) CENELEC TR 50555 (Chosen points) FINLAND In MV, amount of short interruptions (high speed automatic reclos-
ing and delayed automatic reclosing) which are proportional to the annual amount of energy.
FRANCE Transmission: MAIFIDistribution: “Percentage of customers with insufficient quality of supply” (the definition of a “customer with insufficient quality of supply” depends on the location).
None
HUNGARY Distribution level: the indicators used in IEEE Std. 1366-2003: MAIFI (for MV networks)Transmission level: no indicator.
Distribution level:the indicators used in IEEE Std. 1366-2003: MAIFI (for MV networks).Transmission level: no indicator
ITALY For transmission: ENS, ENW (energy not withdrawn), AIT, MAIFI.For distribution: MAIFIE
For transmission: number of transient interruptions.For distribution: number of transient interruptions.
LITHUANIA TSO - ENS, AITDSO - SAIDI, SAIFI
DSO - MAIFI
NORWAY Same as for long interruptions. Included in short interruptions. POLAND Distribution level according to the IEEE Std. 1366-2003: MAIFI.
Transmission level: there is no indicator.NA
PORTUGAL Transmission level: MAIFI (it is not mandatory).
SLOVENIA Distribution and transmission: MAIFI SWEDEN MAIFIE with an period of 3 minutes for events. NA
The number of short interruptions per year is used in nearly all countries. Section 2.6.3 will discuss further the actual use of indices, by reviewing two formulations which depend on aggregation rules for interruption events: MAIFI and Momentary average interruption event frequency index (MAIFIE).
Some countries give separate indices for short and transient interruptions, others exclude transient in-terruptions and some give one index covering short and transient interruptions.
2.5.3. Discussion of the different indicators
From the tables shown, it becomes clear that a range of indicators is in use in different countries. The use of multiple indicators to quantify the con-tinuity of supply results in more information being available and more possibilities to observe trends.
SAIDI and SAIFI are the basic indices, reported in al-most all countries, albeit under different names and with different methods for weighting the interrup-
tions. The method of weighting impacts the results and leads to different biases towards different types of network users. When weighting is based on the number of network users, each user is treated equally, independent of its size and independent of their consumption levels.
When weighting is based on interrupted power or ENS, an interruption gets a higher weighting when the total interrupted power is higher. This might be because network users with larger demand are inter-
5th CEER Benchmarking Report on the Quality of Electricity Supply 25
2. Continuity of Supply
rupted or because the interruption takes place during a period of higher consumption. Weighting based on contracted power, rated power or annual power con-sumption makes the contribution of an incident during high load the same as an incident during low load.
Any weighting based on power and energy is bi-ased towards network users with larger demand. As these users typically suffer fewer and shorter in-terruptions, this is expected to result in somewhat lower values for frequency and duration of interrup-tions than weighting based on number of network users.
Weighting based on number of distribution trans-formers is biased towards network users served from smaller distribution transformers. As smaller transformers are typically used in rural networks, where the number of interruptions is higher, weight-ing based on the number of distribution transform-ers is expected to result in somewhat higher values for frequency and duration of interruptions than weighting based on number of network users.
Indices like ENS or energy not distributed (END) give a somewhat better indication of the conse-quences of an interruption than SAIFI or SAIDI. It should be kept in mind, however, that the under-lying assumptions are an extreme simplification of the actual consequences of interruptions. It is not possible to exactly measure the ENS, as there is no energy consumption during the interruptions.
It should be noted that the value of ENS depends on annual energy consumption and cannot be used for comparison purposes when considering the actual value in MWh. However, by calculating ENS relative to the energy supplied a comparison can be made given that the ENS has been calculated using the same method.
The indices Customer Average Interruption Fre-quency Index (CAIFI) and Customer Total Average Interruption Duration Index (CTAIDI) give a better impression of the continuity of supply as experi-enced by those network users that actually expe-rience at least one interruption. The differences in value between SAIFI and CAIFI, and between SAIDI and CTAIDI, give an impression of the spread in the number of interruptions between different network users. The distribution of number of interruptions experienced by each individual user gives this infor-mation in a more direct way, but results in more indicators, making comparisons and trend analysis more complicated.
2.6. Analysis of Continuity by National Data
European countries use different indicators and dif-ferent weighting methods when evaluating interrup-tions. Two main groups of indicators - “minutes lost per year” (SAIDI, Customer Minutes Lost (CML), Average System Interruption Duration Index (ASIDI), Transformer System Average Interruption Duration Index (T-SAIDI) or “Equivalent interruption time re-lated to the installed capacity” (TIEPI)) and “number of interruptions per year” (SAIFI, Customer interrup-tions (CI), Average System Interruption Frequency Index (ASIFI), Transformer System Average Interrup-tion Frequency Index (T-SAIFI), or “Equivalent num-ber of interruptions related to the installed capac-ity” (NIEPI)) - are collected by countries and partly presented in this chapter. Their values are compared over a number of years.
In addition to the monitoring of duration and fre-quency of interruptions, one can also examine whether the interruptions were planned or un-planned. For more information, please refer to Sec-tion 2.4.2 where the definitions of planned and un-planned interruptions are listed by country, as well as the rules issued on the notice to the affected network user for planned interruptions (minimum time-requested, procedures for giving notice, etc.). Which occurrences are considered an exceptional event is determined can be done in different ways. Some countries have a more statistical approach and others focus their definition on the causes of exceptional events. More information on this topic can be found in the Annex to Chapter 2 on Continu-ity of Supply data.
When interpreting the results and especially when comparing between countries, one should consider the differences in calculation of the indices and in the voltage levels at which incidents are monitored. Despite the difference in names and calculation methods between countries, the results are shown in the same diagrams.
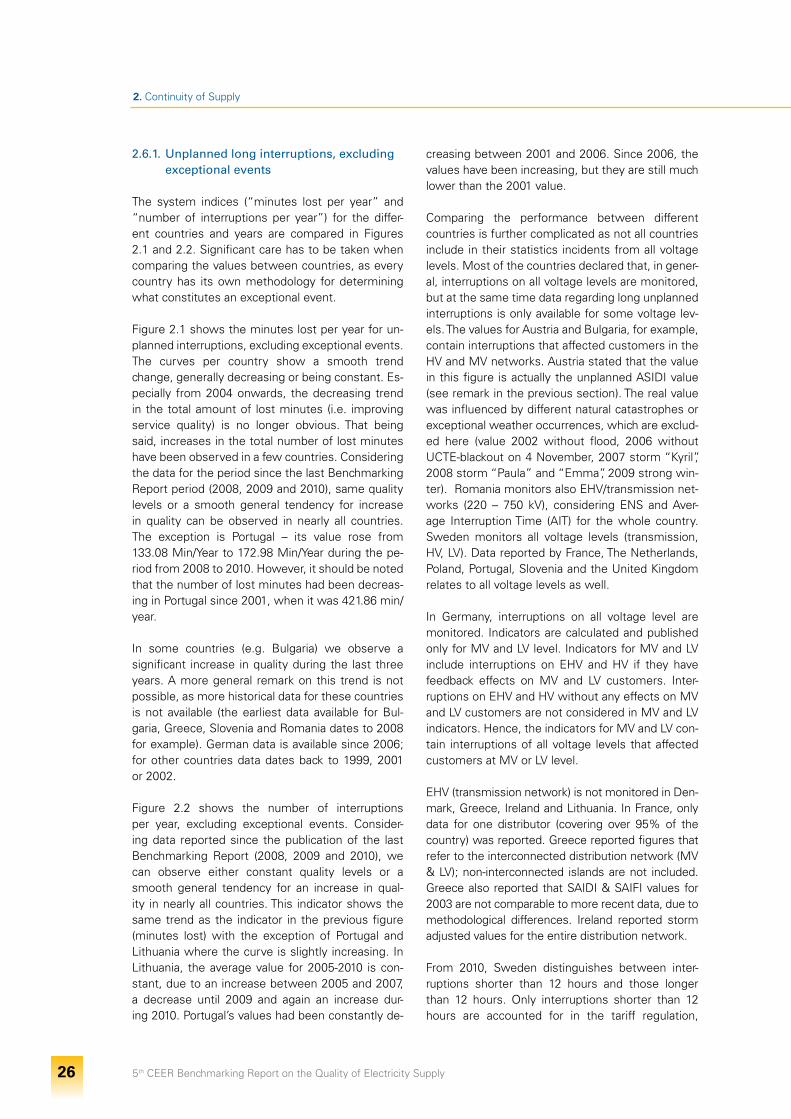
5th CEER Benchmarking Report on the Quality of Electricity Supply 26
2. Continuity of Supply
2.6.1. Unplanned long interruptions, excluding exceptional events
The system indices (“minutes lost per year” and “number of interruptions per year”) for the differ-ent countries and years are compared in Figures 2.1 and 2.2. Significant care has to be taken when comparing the values between countries, as every country has its own methodology for determining what constitutes an exceptional event.
Figure 2.1 shows the minutes lost per year for un-planned interruptions, excluding exceptional events. The curves per country show a smooth trend change, generally decreasing or being constant. Es-pecially from 2004 onwards, the decreasing trend in the total amount of lost minutes (i.e. improving service quality) is no longer obvious. That being said, increases in the total number of lost minutes have been observed in a few countries. Considering the data for the period since the last Benchmarking Report period (2008, 2009 and 2010), same quality levels or a smooth general tendency for increase in quality can be observed in nearly all countries. The exception is Portugal – its value rose from 133.08 Min/Year to 172.98 Min/Year during the pe-riod from 2008 to 2010. However, it should be noted that the number of lost minutes had been decreas-ing in Portugal since 2001, when it was 421.86 min/year.
In some countries (e.g. Bulgaria) we observe a significant increase in quality during the last three years. A more general remark on this trend is not possible, as more historical data for these countries is not available (the earliest data available for Bul-garia, Greece, Slovenia and Romania dates to 2008 for example). German data is available since 2006; for other countries data dates back to 1999, 2001 or 2002.
Figure 2.2 shows the number of interruptions per year, excluding exceptional events. Consider-ing data reported since the publication of the last Benchmarking Report (2008, 2009 and 2010), we can observe either constant quality levels or a smooth general tendency for an increase in qual-ity in nearly all countries. This indicator shows the same trend as the indicator in the previous figure (minutes lost) with the exception of Portugal and Lithuania where the curve is slightly increasing. In Lithuania, the average value for 2005-2010 is con-stant, due to an increase between 2005 and 2007, a decrease until 2009 and again an increase dur-ing 2010. Portugal’s values had been constantly de-
creasing between 2001 and 2006. Since 2006, the values have been increasing, but they are still much lower than the 2001 value.
Comparing the performance between different countries is further complicated as not all countries include in their statistics incidents from all voltage levels. Most of the countries declared that, in gener-al, interruptions on all voltage levels are monitored, but at the same time data regarding long unplanned interruptions is only available for some voltage lev-els. The values for Austria and Bulgaria, for example, contain interruptions that affected customers in the HV and MV networks. Austria stated that the value in this figure is actually the unplanned ASIDI value (see remark in the previous section). The real value was influenced by different natural catastrophes or exceptional weather occurrences, which are exclud-ed here (value 2002 without flood, 2006 without UCTE-blackout on 4 November, 2007 storm “Kyril”, 2008 storm “Paula” and “Emma”, 2009 strong win-ter). Romania monitors also EHV/transmission net-works (220 – 750 kV), considering ENS and Aver-age Interruption Time (AIT) for the whole country. Sweden monitors all voltage levels (transmission, HV, LV). Data reported by France, The Netherlands, Poland, Portugal, Slovenia and the United Kingdom relates to all voltage levels as well.
In Germany, interruptions on all voltage level are monitored. Indicators are calculated and published only for MV and LV level. Indicators for MV and LV include interruptions on EHV and HV if they have feedback effects on MV and LV customers. Inter-ruptions on EHV and HV without any effects on MV and LV customers are not considered in MV and LV indicators. Hence, the indicators for MV and LV con-tain interruptions of all voltage levels that affected customers at MV or LV level.
EHV (transmission network) is not monitored in Den-mark, Greece, Ireland and Lithuania. In France, only data for one distributor (covering over 95% of the country) was reported. Greece reported figures that refer to the interconnected distribution network (MV & LV); non-interconnected islands are not included. Greece also reported that SAIDI & SAIFI values for 2003 are not comparable to more recent data, due to methodological differences. Ireland reported storm adjusted values for the entire distribution network.
From 2010, Sweden distinguishes between inter-ruptions shorter than 12 hours and those longer than 12 hours. Only interruptions shorter than 12 hours are accounted for in the tariff regulation,
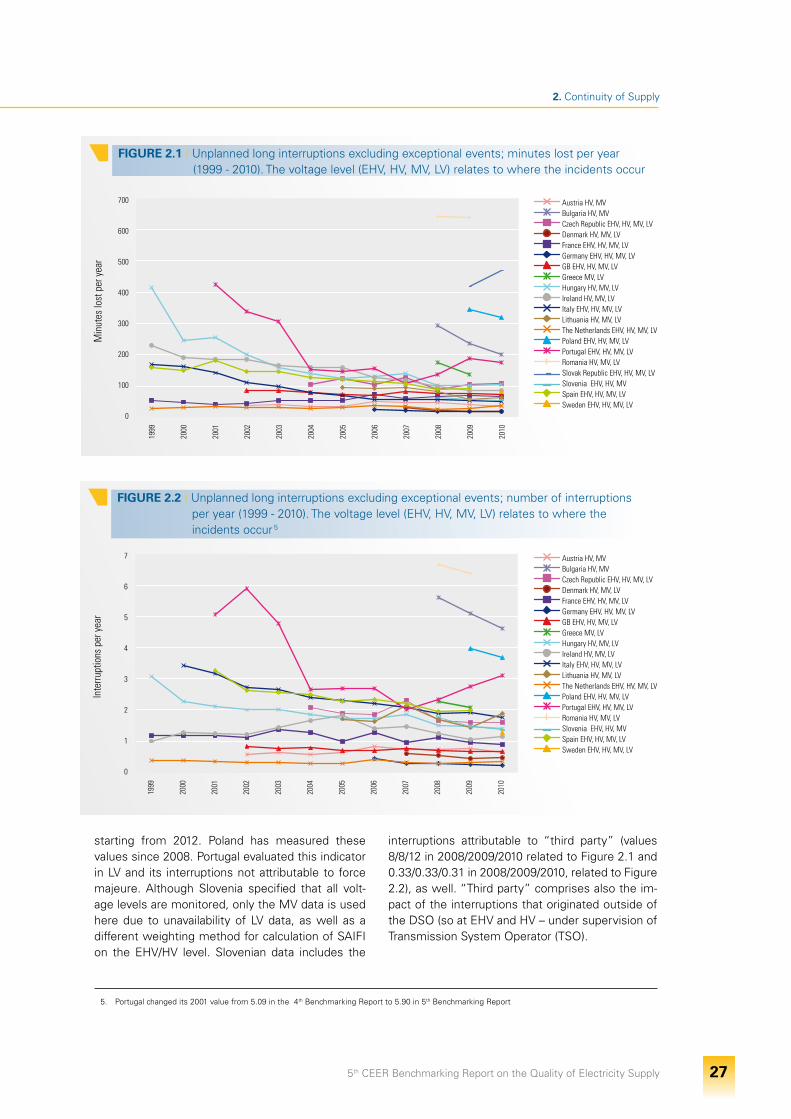
5th CEER Benchmarking Report on the Quality of Electricity Supply 27
2. Continuity of Supply
700
600
500
400
300
200
100
0
1999
2000
2001
2002
2003
2004
2005
2006
2007
2008
2009
2010
Min
utes
lost
per
yea
r
Austria HV, MV Bulgaria HV, MV Czech Republic EHV, HV, MV, LV Denmark HV, MV, LV France EHV, HV, MV, LV Germany EHV, HV, MV, LV GB EHV, HV, MV, LV Greece MV, LV Hungary HV, MV, LV Ireland HV, MV, LV Italy EHV, HV, MV, LV Lithuania HV, MV, LV The Netherlands EHV, HV, MV, LV Poland EHV, HV, MV, LV Portugal EHV, HV, MV, LV Romania HV, MV, LV Slovak Republic EHV, HV, MV, LV Slovenia EHV, HV, MV Spain EHV, HV, MV, LV Sweden EHV, HV, MV, LV
FIGURE 2.1 I Unplanned long interruptions excluding exceptional events; minutes lost per year (1999 - 2010). The voltage level (EHV, HV, MV, LV) relates to where the incidents occur
7
6
5
4
3
2
1
0
1999
2000
2001
2002
2003
2004
2005
2006
2007
2008
2009
2010
Inte
rrupt
ions
per
yea
r
Austria HV, MV Bulgaria HV, MV Czech Republic EHV, HV, MV, LV Denmark HV, MV, LV France EHV, HV, MV, LV Germany EHV, HV, MV, LV GB EHV, HV, MV, LV Greece MV, LV Hungary HV, MV, LV Ireland HV, MV, LV Italy EHV, HV, MV, LV Lithuania HV, MV, LV The Netherlands EHV, HV, MV, LV Poland EHV, HV, MV, LV Portugal EHV, HV, MV, LV Romania HV, MV, LV Slovenia EHV, HV, MV Spain EHV, HV, MV, LV Sweden EHV, HV, MV, LV
FIGURE 2.2 I Unplanned long interruptions excluding exceptional events; number of interruptions per year (1999 - 2010). The voltage level (EHV, HV, MV, LV) relates to where the incidents occur 5
5. Portugal changed its 2001 value from 5.09 in the 4th Benchmarking Report to 5.90 in 5th Benchmarking Report
starting from 2012. Poland has measured these values since 2008. Portugal evaluated this indicator in LV and its interruptions not attributable to force majeure. Although Slovenia specified that all volt-age levels are monitored, only the MV data is used here due to unavailability of LV data, as well as a different weighting method for calculation of SAIFI on the EHV/HV level. Slovenian data includes the
interruptions attributable to “third party” (values 8/8/12 in 2008/2009/2010 related to Figure 2.1 and 0.33/0.33/0.31 in 2008/2009/2010, related to Figure 2.2), as well. “Third party” comprises also the im-pact of the interruptions that originated outside of the DSO (so at EHV and HV – under supervision of Transmission System Operator (TSO).
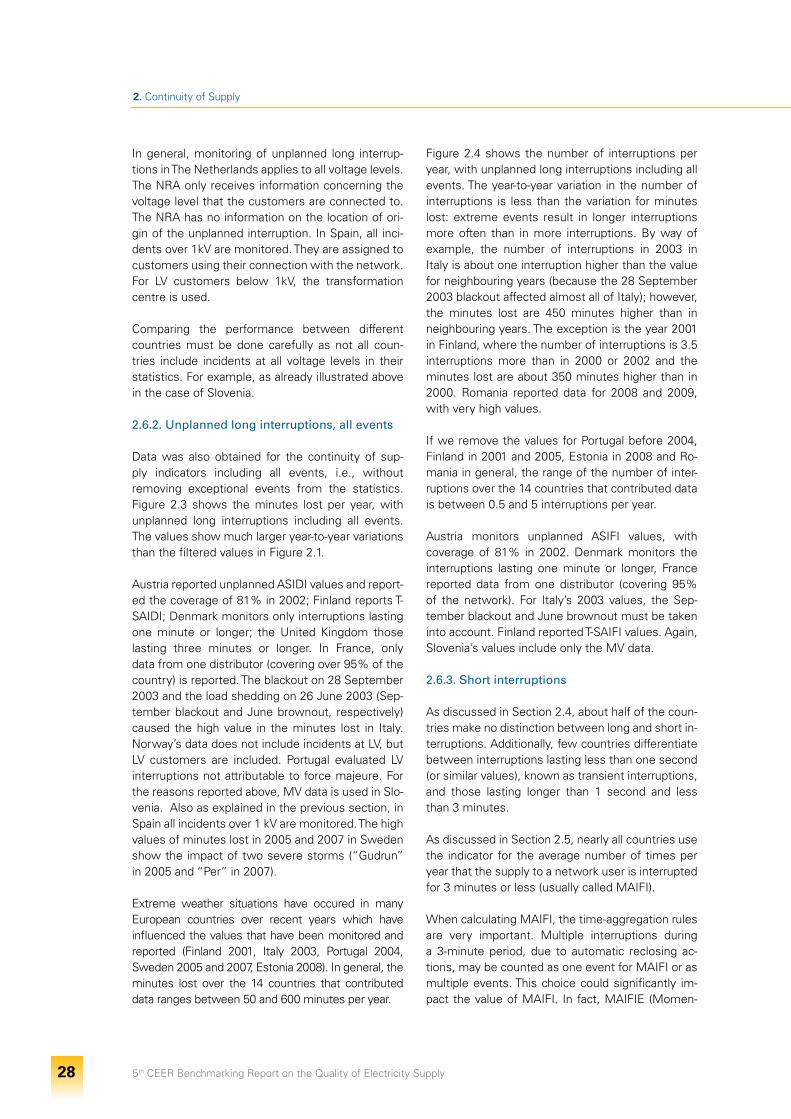
5th CEER Benchmarking Report on the Quality of Electricity Supply 28
2. Continuity of Supply
In general, monitoring of unplanned long interrup-tions in The Netherlands applies to all voltage levels. The NRA only receives information concerning the voltage level that the customers are connected to. The NRA has no information on the location of ori-gin of the unplanned interruption. In Spain, all inci-dents over 1kV are monitored. They are assigned to customers using their connection with the network. For LV customers below 1kV, the transformation centre is used.
Comparing the performance between different countries must be done carefully as not all coun-tries include incidents at all voltage levels in their statistics. For example, as already illustrated above in the case of Slovenia.
2.6.2. Unplanned long interruptions, all events
Data was also obtained for the continuity of sup-ply indicators including all events, i.e., without removing exceptional events from the statistics. Figure 2.3 shows the minutes lost per year, with unplanned long interruptions including all events. The values show much larger year-to-year variations than the filtered values in Figure 2.1.
Austria reported unplanned ASIDI values and report-ed the coverage of 81% in 2002; Finland reports T-SAIDI; Denmark monitors only interruptions lasting one minute or longer; the United Kingdom those lasting three minutes or longer. In France, only data from one distributor (covering over 95% of the country) is reported. The blackout on 28 September 2003 and the load shedding on 26 June 2003 (Sep-tember blackout and June brownout, respectively) caused the high value in the minutes lost in Italy. Norway’s data does not include incidents at LV, but LV customers are included. Portugal evaluated LV interruptions not attributable to force majeure. For the reasons reported above, MV data is used in Slo-venia. Also as explained in the previous section, in Spain all incidents over 1 kV are monitored. The high values of minutes lost in 2005 and 2007 in Sweden show the impact of two severe storms (“Gudrun” in 2005 and “Per” in 2007).
Extreme weather situations have occured in many European countries over recent years which have influenced the values that have been monitored and reported (Finland 2001, Italy 2003, Portugal 2004, Sweden 2005 and 2007, Estonia 2008). In general, the minutes lost over the 14 countries that contributed data ranges between 50 and 600 minutes per year.
Figure 2.4 shows the number of interruptions per year, with unplanned long interruptions including all events. The year-to-year variation in the number of interruptions is less than the variation for minutes lost: extreme events result in longer interruptions more often than in more interruptions. By way of example, the number of interruptions in 2003 in Italy is about one interruption higher than the value for neighbouring years (because the 28 September 2003 blackout affected almost all of Italy); however, the minutes lost are 450 minutes higher than in neighbouring years. The exception is the year 2001 in Finland, where the number of interruptions is 3.5 interruptions more than in 2000 or 2002 and the minutes lost are about 350 minutes higher than in 2000. Romania reported data for 2008 and 2009, with very high values.
If we remove the values for Portugal before 2004, Finland in 2001 and 2005, Estonia in 2008 and Ro-mania in general, the range of the number of inter-ruptions over the 14 countries that contributed data is between 0.5 and 5 interruptions per year.
Austria monitors unplanned ASIFI values, with coverage of 81% in 2002. Denmark monitors the interruptions lasting one minute or longer, France reported data from one distributor (covering 95% of the network). For Italy’s 2003 values, the Sep-tember blackout and June brownout must be taken into account. Finland reported T-SAIFI values. Again, Slovenia’s values include only the MV data.
2.6.3. Short interruptions
As discussed in Section 2.4, about half of the coun-tries make no distinction between long and short in-terruptions. Additionally, few countries differentiate between interruptions lasting less than one second (or similar values), known as transient interruptions, and those lasting longer than 1 second and less than 3 minutes.
As discussed in Section 2.5, nearly all countries use the indicator for the average number of times per year that the supply to a network user is interrupted for 3 minutes or less (usually called MAIFI).
When calculating MAIFI, the time-aggregation rules are very important. Multiple interruptions during a 3-minute period, due to automatic reclosing ac-tions, may be counted as one event for MAIFI or as multiple events. This choice could significantly im-pact the value of MAIFI. In fact, MAIFIE (Momen-
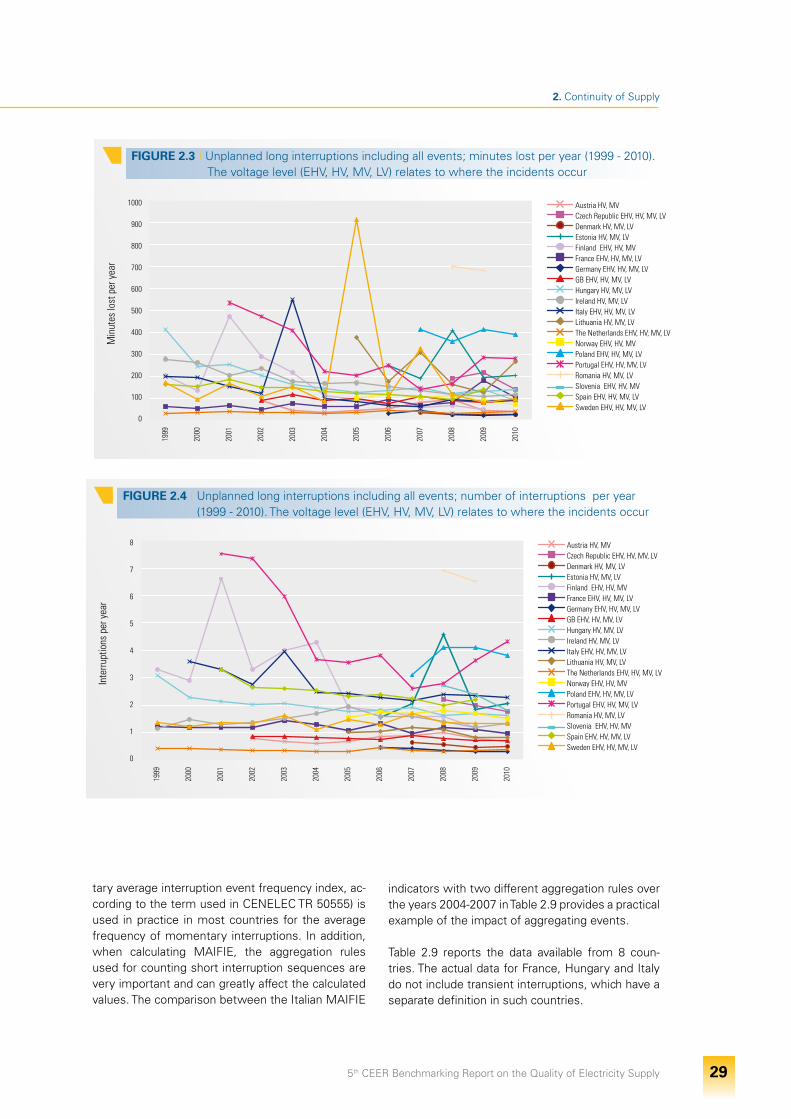
5th CEER Benchmarking Report on the Quality of Electricity Supply 29
2. Continuity of Supply
8
7
6
5
4
3
2
1
0
1999
2000
2001
2002
2003
2004
2005
2006
2007
2008
2009
2010
Inte
rrupt
ions
per
yea
r
Austria HV, MV Czech Republic EHV, HV, MV, LV Denmark HV, MV, LV Estonia HV, MV, LV Finland EHV, HV, MV France EHV, HV, MV, LV Germany EHV, HV, MV, LV GB EHV, HV, MV, LV Hungary HV, MV, LV Ireland HV, MV, LV Italy EHV, HV, MV, LV Lithuania HV, MV, LV The Netherlands EHV, HV, MV, LV Norway EHV, HV, MV Poland EHV, HV, MV, LV Portugal EHV, HV, MV, LV Romania HV, MV, LV Slovenia EHV, HV, MV Spain EHV, HV, MV, LV Sweden EHV, HV, MV, LV
FIGURE 2.4 I Unplanned long interruptions including all events; number of interruptions per year (1999 - 2010). The voltage level (EHV, HV, MV, LV) relates to where the incidents occur
1000
900
800
700
600
500
400
300
200
100
0
1999
2000
2001
2002
2003
2004
2005
2006
2007
2008
2009
2010
Min
utes
lost
per
yea
r
Austria HV, MV Czech Republic EHV, HV, MV, LV Denmark HV, MV, LV Estonia HV, MV, LV Finland EHV, HV, MV France EHV, HV, MV, LV Germany EHV, HV, MV, LV GB EHV, HV, MV, LV Hungary HV, MV, LV Ireland HV, MV, LV Italy EHV, HV, MV, LV Lithuania HV, MV, LV The Netherlands EHV, HV, MV, LV Norway EHV, HV, MV Poland EHV, HV, MV, LV Portugal EHV, HV, MV, LV Romania HV, MV, LV Slovenia EHV, HV, MV Spain EHV, HV, MV, LV Sweden EHV, HV, MV, LV
FIGURE 2.3 I Unplanned long interruptions including all events; minutes lost per year (1999 - 2010). The voltage level (EHV, HV, MV, LV) relates to where the incidents occur
tary average interruption event frequency index, ac-cording to the term used in CENELEC TR 50555) is used in practice in most countries for the average frequency of momentary interruptions. In addition, when calculating MAIFIE, the aggregation rules used for counting short interruption sequences are very important and can greatly affect the calculated values. The comparison between the Italian MAIFIE
indicators with two different aggregation rules over the years 2004-2007 in Table 2.9 provides a practical example of the impact of aggregating events.
Table 2.9 reports the data available from 8 coun-tries. The actual data for France, Hungary and Italy do not include transient interruptions, which have a separate definition in such countries.
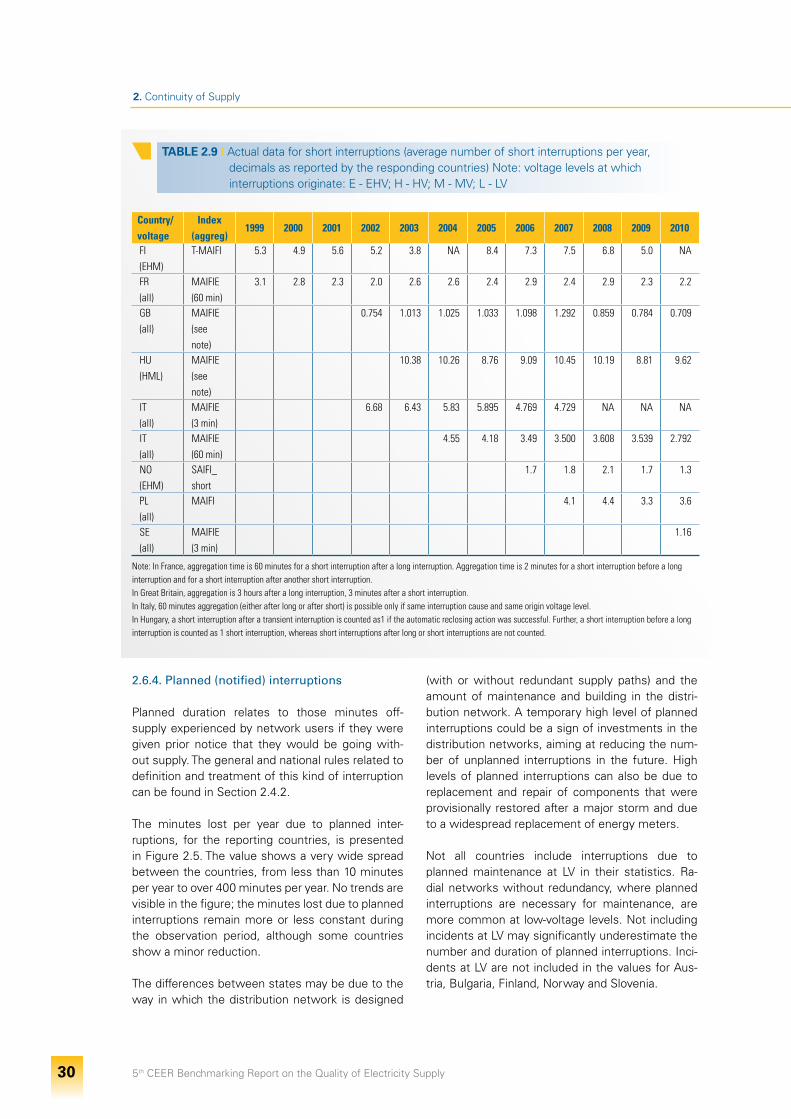
5th CEER Benchmarking Report on the Quality of Electricity Supply 30
2. Continuity of Supply
TABLE 2.9 I Actual data for short interruptions (average number of short interruptions per year, decimals as reported by the responding countries) Note: voltage levels at which interruptions originate: E - EHV; H - HV; M - MV; L - LV
Country/voltage
Index(aggreg)
1999 2000 2001 2002 2003 2004 2005 2006 2007 2008 2009 2010
FI(EHM)
T-MAIFI 5.3 4.9 5.6 5.2 3.8 NA 8.4 7.3 7.5 6.8 5.0 NA
FR(all)
MAIFIE (60 min)
3.1 2.8 2.3 2.0 2.6 2.6 2.4 2.9 2.4 2.9 2.3 2.2
GB(all)
MAIFIE (see note)
0.754 1.013 1.025 1.033 1.098 1.292 0.859 0.784 0.709
HU(HML)
MAIFIE(see note)
10.38 10.26 8.76 9.09 10.45 10.19 8.81 9.62
IT(all)
MAIFIE(3 min)
6.68 6.43 5.83 5.895 4.769 4.729 NA NA NA
IT(all)
MAIFIE (60 min)
4.55 4.18 3.49 3.500 3.608 3.539 2.792
NO(EHM)
SAIFI_short
1.7 1.8 2.1 1.7 1.3
PL(all)
MAIFI 4.1 4.4 3.3 3.6
SE(all)
MAIFIE(3 min)
1.16
Note: In France, aggregation time is 60 minutes for a short interruption after a long interruption. Aggregation time is 2 minutes for a short interruption before a long interruption and for a short interruption after another short interruption.In Great Britain, aggregation is 3 hours after a long interruption, 3 minutes after a short interruption.In Italy, 60 minutes aggregation (either after long or after short) is possible only if same interruption cause and same origin voltage level. In Hungary, a short interruption after a transient interruption is counted as1 if the automatic reclosing action was successful. Further, a short interruption before a long interruption is counted as 1 short interruption, whereas short interruptions after long or short interruptions are not counted.
2.6.4. Planned (notified) interruptions
Planned duration relates to those minutes off-supply experienced by network users if they were given prior notice that they would be going with-out supply. The general and national rules related to definition and treatment of this kind of interruption can be found in Section 2.4.2.
The minutes lost per year due to planned inter-ruptions, for the reporting countries, is presented in Figure 2.5. The value shows a very wide spread between the countries, from less than 10 minutes per year to over 400 minutes per year. No trends are visible in the figure; the minutes lost due to planned interruptions remain more or less constant during the observation period, although some countries show a minor reduction.
The differences between states may be due to the way in which the distribution network is designed
(with or without redundant supply paths) and the amount of maintenance and building in the distri-bution network. A temporary high level of planned interruptions could be a sign of investments in the distribution networks, aiming at reducing the num-ber of unplanned interruptions in the future. High levels of planned interruptions can also be due to replacement and repair of components that were provisionally restored after a major storm and due to a widespread replacement of energy meters.
Not all countries include interruptions due to planned maintenance at LV in their statistics. Ra-dial networks without redundancy, where planned interruptions are necessary for maintenance, are more common at low-voltage levels. Not including incidents at LV may significantly underestimate the number and duration of planned interruptions. Inci-dents at LV are not included in the values for Aus-tria, Bulgaria, Finland, Norway and Slovenia.
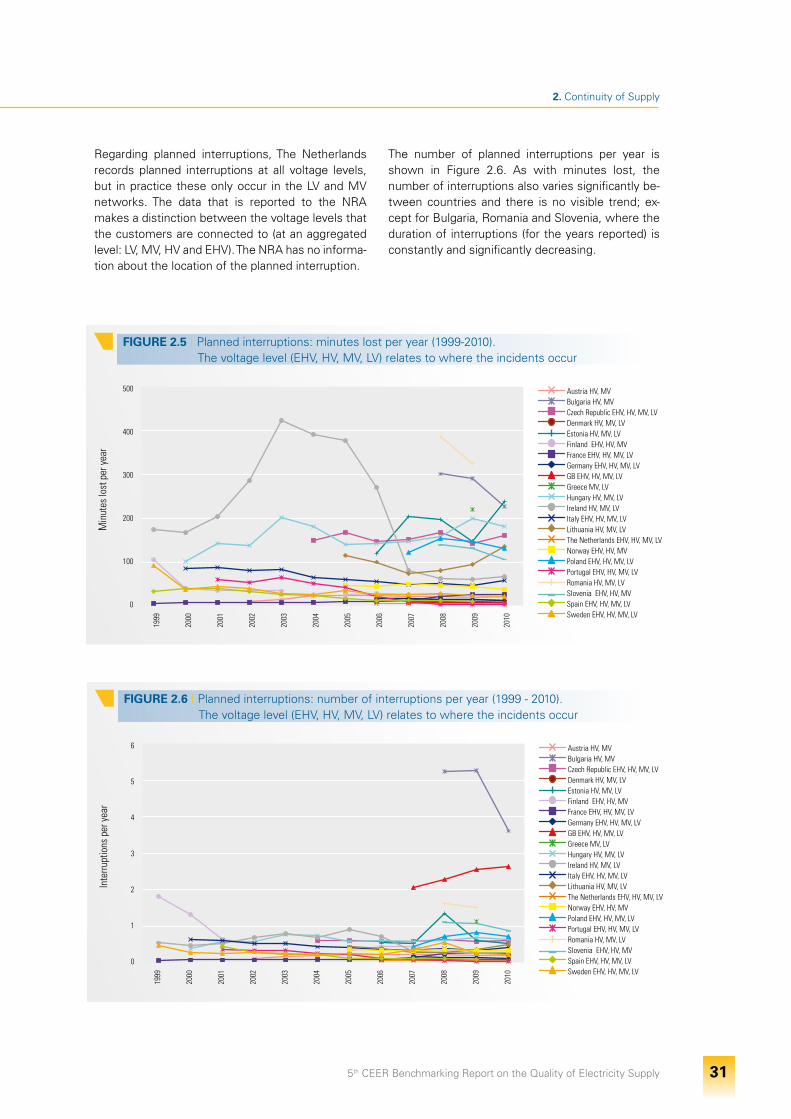
5th CEER Benchmarking Report on the Quality of Electricity Supply 31
2. Continuity of Supply
Regarding planned interruptions, The Netherlands records planned interruptions at all voltage levels, but in practice these only occur in the LV and MV networks. The data that is reported to the NRA makes a distinction between the voltage levels that the customers are connected to (at an aggregated level: LV, MV, HV and EHV). The NRA has no informa-tion about the location of the planned interruption.
The number of planned interruptions per year is shown in Figure 2.6. As with minutes lost, the number of interruptions also varies significantly be-tween countries and there is no visible trend; ex-cept for Bulgaria, Romania and Slovenia, where the duration of interruptions (for the years reported) is constantly and significantly decreasing.
500
400
300
200
100
0
1999
2000
2001
2002
2003
2004
2005
2006
2007
2008
2009
2010
Min
utes
lost
per
yea
r
Austria HV, MV Bulgaria HV, MV Czech Republic EHV, HV, MV, LV Denmark HV, MV, LV Estonia HV, MV, LV Finland EHV, HV, MV France EHV, HV, MV, LV Germany EHV, HV, MV, LV GB EHV, HV, MV, LV Greece MV, LV Hungary HV, MV, LV Ireland HV, MV, LV Italy EHV, HV, MV, LV Lithuania HV, MV, LV The Netherlands EHV, HV, MV, LV Norway EHV, HV, MV Poland EHV, HV, MV, LV Portugal EHV, HV, MV, LV Romania HV, MV, LV Slovenia EHV, HV, MV Spain EHV, HV, MV, LV Sweden EHV, HV, MV, LV
FIGURE 2.5 I Planned interruptions: minutes lost per year (1999-2010). The voltage level (EHV, HV, MV, LV) relates to where the incidents occur
6
5
4
3
2
1
0
1999
2000
2001
2002
2003
2004
2005
2006
2007
2008
2009
2010
Inte
rrupt
ions
per
yea
r
Austria HV, MV Bulgaria HV, MV Czech Republic EHV, HV, MV, LV Denmark HV, MV, LV Estonia HV, MV, LV Finland EHV, HV, MV France EHV, HV, MV, LV Germany EHV, HV, MV, LV GB EHV, HV, MV, LV Greece MV, LV Hungary HV, MV, LV Ireland HV, MV, LV Italy EHV, HV, MV, LV Lithuania HV, MV, LV The Netherlands EHV, HV, MV, LV Norway EHV, HV, MV Poland EHV, HV, MV, LV Portugal EHV, HV, MV, LV Romania HV, MV, LV Slovenia EHV, HV, MV Spain EHV, HV, MV, LV Sweden EHV, HV, MV, LV
FIGURE 2.6 I Planned interruptions: number of interruptions per year (1999 - 2010). The voltage level (EHV, HV, MV, LV) relates to where the incidents occur
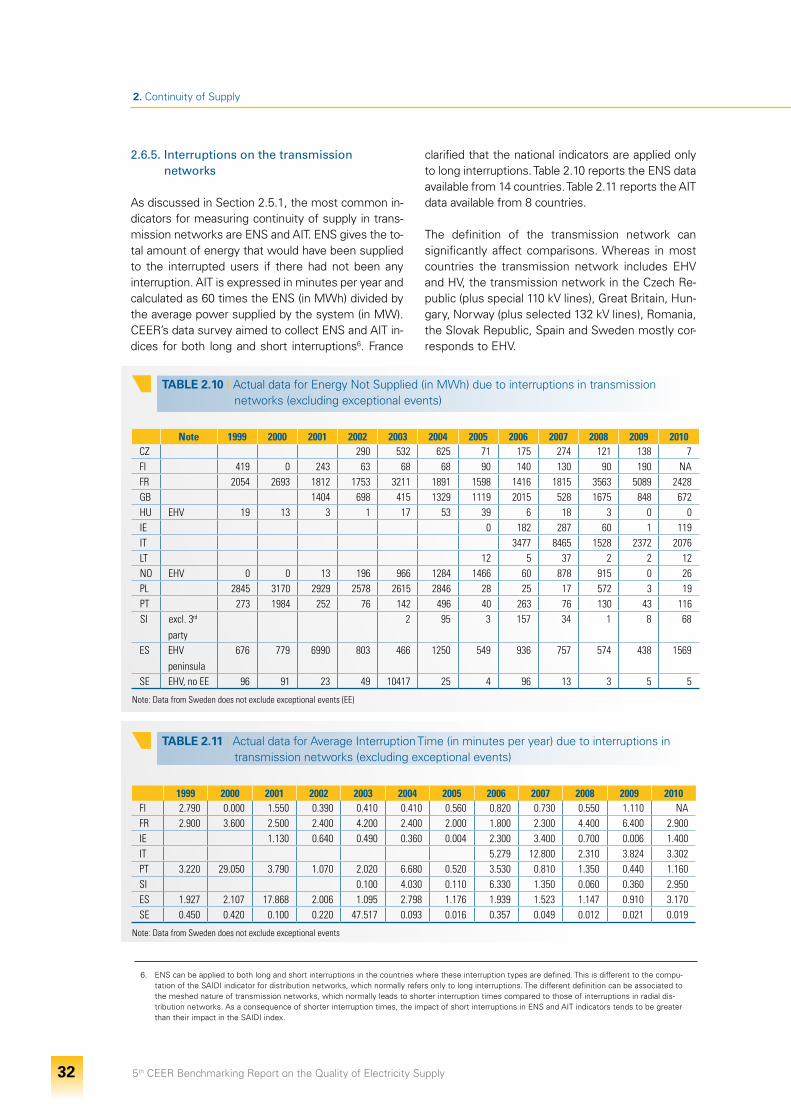
5th CEER Benchmarking Report on the Quality of Electricity Supply 32
2. Continuity of Supply
2.6.5. Interruptions on the transmission networks
As discussed in Section 2.5.1, the most common in-dicators for measuring continuity of supply in trans-mission networks are ENS and AIT. ENS gives the to-tal amount of energy that would have been supplied to the interrupted users if there had not been any interruption. AIT is expressed in minutes per year and calculated as 60 times the ENS (in MWh) divided by the average power supplied by the system (in MW). CEER’s data survey aimed to collect ENS and AIT in-dices for both long and short interruptions6. France
6. ENS can be applied to both long and short interruptions in the countries where these interruption types are defined. This is different to the compu-tation of the SAIDI indicator for distribution networks, which normally refers only to long interruptions. The different definition can be associated to the meshed nature of transmission networks, which normally leads to shorter interruption times compared to those of interruptions in radial dis-tribution networks. As a consequence of shorter interruption times, the impact of short interruptions in ENS and AIT indicators tends to be greater than their impact in the SAIDI index.
TABLE 2.10 I Actual data for Energy Not Supplied (in MWh) due to interruptions in transmission networks (excluding exceptional events)
Note 1999 2000 2001 2002 2003 2004 2005 2006 2007 2008 2009 2010CZ 290 532 625 71 175 274 121 138 7FI 419 0 243 63 68 68 90 140 130 90 190 NAFR 2054 2693 1812 1753 3211 1891 1598 1416 1815 3563 5089 2428GB 1404 698 415 1329 1119 2015 528 1675 848 672HU EHV 19 13 3 1 17 53 39 6 18 3 0 0IE 0 182 287 60 1 119IT 3477 8465 1528 2372 2076LT 12 5 37 2 2 12NO EHV 0 0 13 196 966 1284 1466 60 878 915 0 26PL 2845 3170 2929 2578 2615 2846 28 25 17 572 3 19PT 273 1984 252 76 142 496 40 263 76 130 43 116SI excl. 3rd
party2 95 3 157 34 1 8 68
ES EHV peninsula
676 779 6990 803 466 1250 549 936 757 574 438 1569
SE EHV, no EE 96 91 23 49 10417 25 4 96 13 3 5 5
Note: Data from Sweden does not exclude exceptional events (EE)
TABLE 2.11 I Actual data for Average Interruption Time (in minutes per year) due to interruptions in transmission networks (excluding exceptional events)
1999 2000 2001 2002 2003 2004 2005 2006 2007 2008 2009 2010FI 2.790 0.000 1.550 0.390 0.410 0.410 0.560 0.820 0.730 0.550 1.110 NAFR 2.900 3.600 2.500 2.400 4.200 2.400 2.000 1.800 2.300 4.400 6.400 2.900IE 1.130 0.640 0.490 0.360 0.004 2.300 3.400 0.700 0.006 1.400IT 5.279 12.800 2.310 3.824 3.302PT 3.220 29.050 3.790 1.070 2.020 6.680 0.520 3.530 0.810 1.350 0.440 1.160SI 0.100 4.030 0.110 6.330 1.350 0.060 0.360 2.950ES 1.927 2.107 17.868 2.006 1.095 2.798 1.176 1.939 1.523 1.147 0.910 3.170SE 0.450 0.420 0.100 0.220 47.517 0.093 0.016 0.357 0.049 0.012 0.021 0.019
Note: Data from Sweden does not exclude exceptional events
clarified that the national indicators are applied only to long interruptions. Table 2.10 reports the ENS data available from 14 countries. Table 2.11 reports the AIT data available from 8 countries.
The definition of the transmission network can significantly affect comparisons. Whereas in most countries the transmission network includes EHV and HV, the transmission network in the Czech Re-public (plus special 110 kV lines), Great Britain, Hun-gary, Norway (plus selected 132 kV lines), Romania, the Slovak Republic, Spain and Sweden mostly cor-responds to EHV.
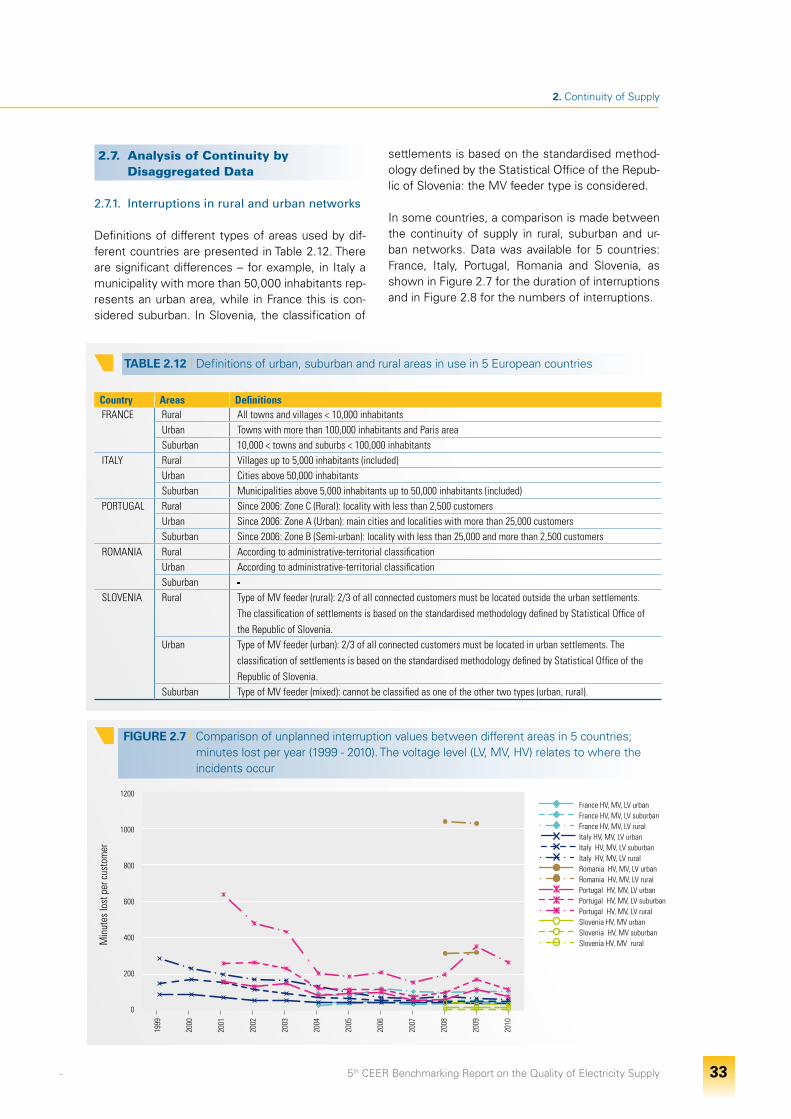
5th CEER Benchmarking Report on the Quality of Electricity Supply 33
2. Continuity of Supply
2.7. Analysis of Continuity by Disaggregated Data
2.7.1. Interruptions in rural and urban networks
Definitions of different types of areas used by dif-ferent countries are presented in Table 2.12. There are significant differences – for example, in Italy a municipality with more than 50,000 inhabitants rep-resents an urban area, while in France this is con-sidered suburban. In Slovenia, the classification of
TABLE 2.12 I Definitions of urban, suburban and rural areas in use in 5 European countries
Country Areas DefinitionsFRANCE Rural All towns and villages < 10,000 inhabitants
Urban Towns with more than 100,000 inhabitants and Paris areaSuburban 10,000 < towns and suburbs < 100,000 inhabitants
ITALY Rural Villages up to 5,000 inhabitants (included)Urban Cities above 50,000 inhabitants Suburban Municipalities above 5,000 inhabitants up to 50,000 inhabitants (included)
PORTUGAL Rural Since 2006: Zone C (Rural): locality with less than 2,500 customers Urban Since 2006: Zone A (Urban): main cities and localities with more than 25,000 customers Suburban Since 2006: Zone B (Semi-urban): locality with less than 25,000 and more than 2,500 customers
ROMANIA Rural According to administrative-territorial classificationUrban According to administrative-territorial classification Suburban -
SLOVENIA Rural Type of MV feeder (rural): 2/3 of all connected customers must be located outside the urban settlements. The classification of settlements is based on the standardised methodology defined by Statistical Office of the Republic of Slovenia.
Urban Type of MV feeder (urban): 2/3 of all connected customers must be located in urban settlements. The classification of settlements is based on the standardised methodology defined by Statistical Office of the Republic of Slovenia.
Suburban Type of MV feeder (mixed): cannot be classified as one of the other two types (urban, rural).
settlements is based on the standardised method-ology defined by the Statistical Office of the Repub-lic of Slovenia: the MV feeder type is considered.
In some countries, a comparison is made between the continuity of supply in rural, suburban and ur-ban networks. Data was available for 5 countries: France, Italy, Portugal, Romania and Slovenia, as shown in Figure 2.7 for the duration of interruptions and in Figure 2.8 for the numbers of interruptions.
1200
1000
800
600
400
200
0
1999
2000
2001
2002
2003
2004
2005
2006
2007
2008
2009
2010
Min
utes
lost
per
cus
tom
er
France HV, MV, LV urban France HV, MV, LV suburban France HV, MV, LV rural
Italy HV, MV, LV urban Italy HV, MV, LV suburban
Italy HV, MV, LV rural Romania HV, MV, LV urban Romania HV, MV, LV rural Portugal HV, MV, LV urban Portugal HV, MV, LV suburban Portugal HV, MV, LV rural Slovenia HV, MV urban Slovenia HV, MV suburban Slovenia HV, MV rural
FIGURE 2.7 I Comparison of unplanned interruption values between different areas in 5 countries; minutes lost per year (1999 - 2010). The voltage level (LV, MV, HV) relates to where the incidents occur
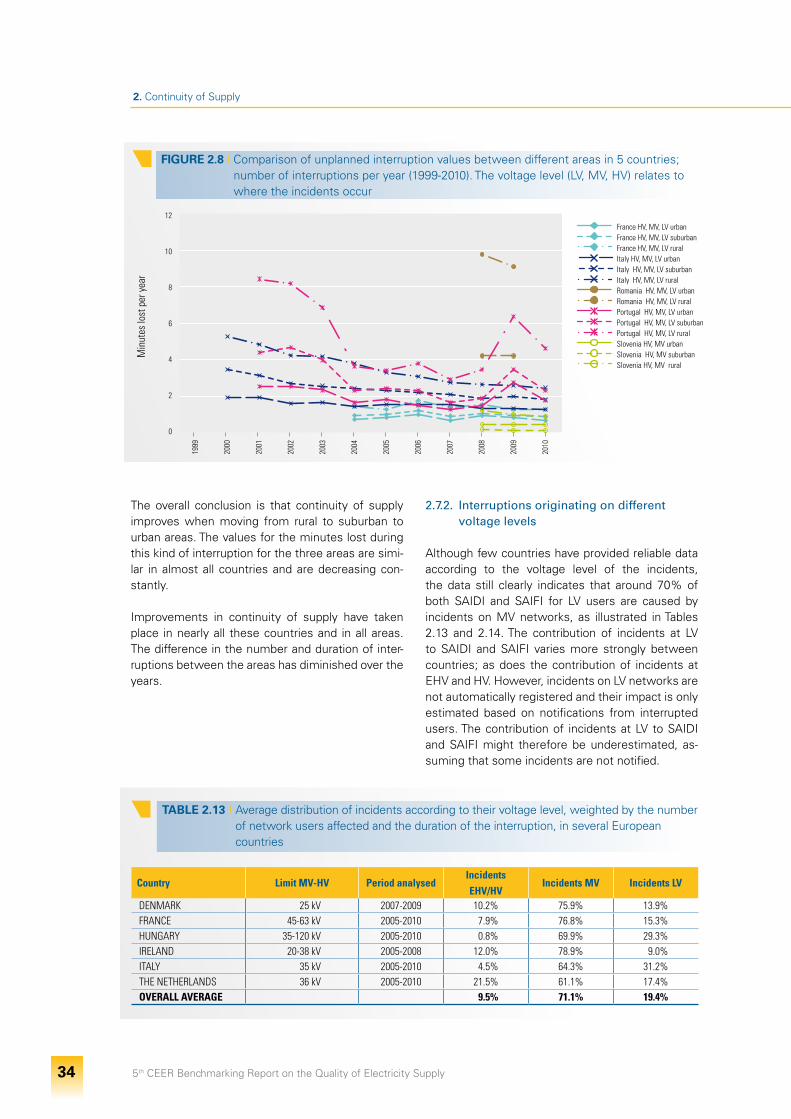
5th CEER Benchmarking Report on the Quality of Electricity Supply 34
2. Continuity of Supply
12
10
8
6
4
2
0
1999
2000
2001
2002
2003
2004
2005
2006
2007
2008
2009
2010
Min
utes
lost
per
yea
r
France HV, MV, LV urban France HV, MV, LV suburban France HV, MV, LV rural
Italy HV, MV, LV urban Italy HV, MV, LV suburban
Italy HV, MV, LV rural Romania HV, MV, LV urban Romania HV, MV, LV rural Portugal HV, MV, LV urban Portugal HV, MV, LV suburban Portugal HV, MV, LV rural Slovenia HV, MV urban Slovenia HV, MV suburban Slovenia HV, MV rural
FIGURE 2.8 I Comparison of unplanned interruption values between different areas in 5 countries; number of interruptions per year (1999-2010). The voltage level (LV, MV, HV) relates to where the incidents occur
The overall conclusion is that continuity of supply improves when moving from rural to suburban to urban areas. The values for the minutes lost during this kind of interruption for the three areas are simi-lar in almost all countries and are decreasing con-stantly.
Improvements in continuity of supply have taken place in nearly all these countries and in all areas. The difference in the number and duration of inter-ruptions between the areas has diminished over the years.
2.7.2. Interruptions originating on different voltage levels
Although few countries have provided reliable data according to the voltage level of the incidents, the data still clearly indicates that around 70% of both SAIDI and SAIFI for LV users are caused by incidents on MV networks, as illustrated in Tables 2.13 and 2.14. The contribution of incidents at LV to SAIDI and SAIFI varies more strongly between countries; as does the contribution of incidents at EHV and HV. However, incidents on LV networks are not automatically registered and their impact is only estimated based on notifications from interrupted users. The contribution of incidents at LV to SAIDI and SAIFI might therefore be underestimated, as-suming that some incidents are not notified.
TABLE 2.13 I Average distribution of incidents according to their voltage level, weighted by the number of network users affected and the duration of the interruption, in several European countries
Country Limit MV-HV Period analysedIncidents EHV/HV
Incidents MV Incidents LV
DENMARK 25 kV 2007-2009 10.2% 75.9% 13.9%FRANCE 45-63 kV 2005-2010 7.9% 76.8% 15.3%HUNGARY 35-120 kV 2005-2010 0.8% 69.9% 29.3%IRELAND 20-38 kV 2005-2008 12.0% 78.9% 9.0%ITALY 35 kV 2005-2010 4.5% 64.3% 31.2%THE NETHERLANDS 36 kV 2005-2010 21.5% 61.1% 17.4%OVERALL AVERAGE 9.5% 71.1% 19.4%
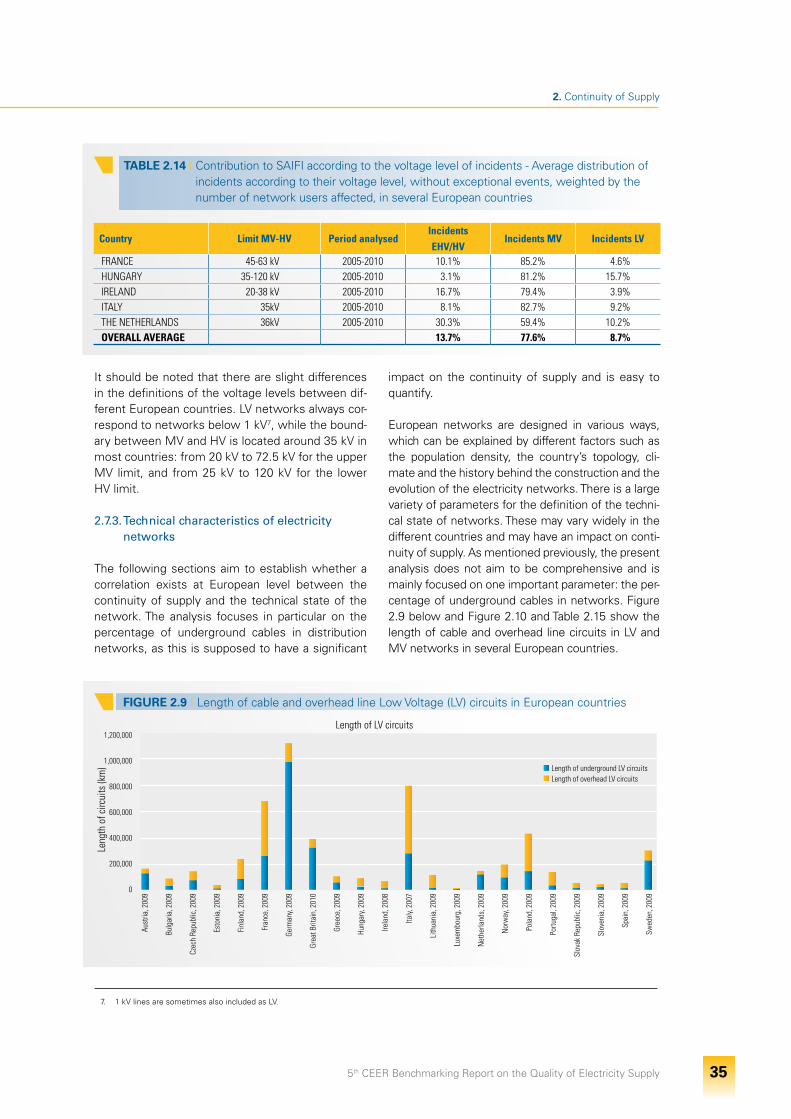
5th CEER Benchmarking Report on the Quality of Electricity Supply 35
2. Continuity of Supply
TABLE 2.14 I Contribution to SAIFI according to the voltage level of incidents - Average distribution of incidents according to their voltage level, without exceptional events, weighted by the number of network users affected, in several European countries
Country Limit MV-HV Period analysedIncidents EHV/HV
Incidents MV Incidents LV
FRANCE 45-63 kV 2005-2010 10.1% 85.2% 4.6%HUNGARY 35-120 kV 2005-2010 3.1% 81.2% 15.7%IRELAND 20-38 kV 2005-2010 16.7% 79.4% 3.9%ITALY 35kV 2005-2010 8.1% 82.7% 9.2%THE NETHERLANDS 36kV 2005-2010 30.3% 59.4% 10.2%OVERALL AVERAGE 13.7% 77.6% 8.7%
It should be noted that there are slight differences in the definitions of the voltage levels between dif-ferent European countries. LV networks always cor-respond to networks below 1 kV7, while the bound-ary between MV and HV is located around 35 kV in most countries: from 20 kV to 72.5 kV for the upper MV limit, and from 25 kV to 120 kV for the lower HV limit.
2.7.3. Tech nical characteristics of electricity networks
The following sections aim to establish whether a correlation exists at European level between the continuity of supply and the technical state of the network. The analysis focuses in particular on the percentage of underground cables in distribution networks, as this is supposed to have a significant
impact on the continuity of supply and is easy to quantify.
European networks are designed in various ways, which can be explained by different factors such as the population density, the country’s topology, cli-mate and the history behind the construction and the evolution of the electricity networks. There is a large variety of parameters for the definition of the techni-cal state of networks. These may vary widely in the different countries and may have an impact on conti-nuity of supply. As mentioned previously, the present analysis does not aim to be comprehensive and is mainly focused on one important parameter: the per-centage of underground cables in networks. Figure 2.9 below and Figure 2.10 and Table 2.15 show the length of cable and overhead line circuits in LV and MV networks in several European countries.
1,200,000
1,000,000
800,000
600,000
400,000
200,000
0
Aust
ria, 2
009
Bulg
aria
, 200
9
Czec
h Re
publ
ic, 2
009
Esto
nia,
200
9
Finl
and,
200
9
Fran
ce, 2
009
Germ
any,
2009
Grea
t Brit
ain,
201
0
Gree
ce, 2
009
Hung
ary,
2009
Irela
nd, 2
008
Italy,
200
7
Lith
uani
a, 2
009
Luxe
mbo
urg,
200
9
Net
herla
nds,
200
9
Nor
way
, 200
9
Pola
nd, 2
009
Portu
gal,
2009
Slov
ak R
epub
lic, 2
009
Slov
enia
, 200
9
Spai
n, 2
009
Swed
en, 2
009
Leng
th o
f circ
uits
(km
) Length of underground LV circuits Length of overhead LV circuits
FIGURE 2.9 I Length of cable and overhead line Low Voltage (LV) circuits in European countries
7. 1 kV lines are sometimes also included as LV.
Length of LV circuits
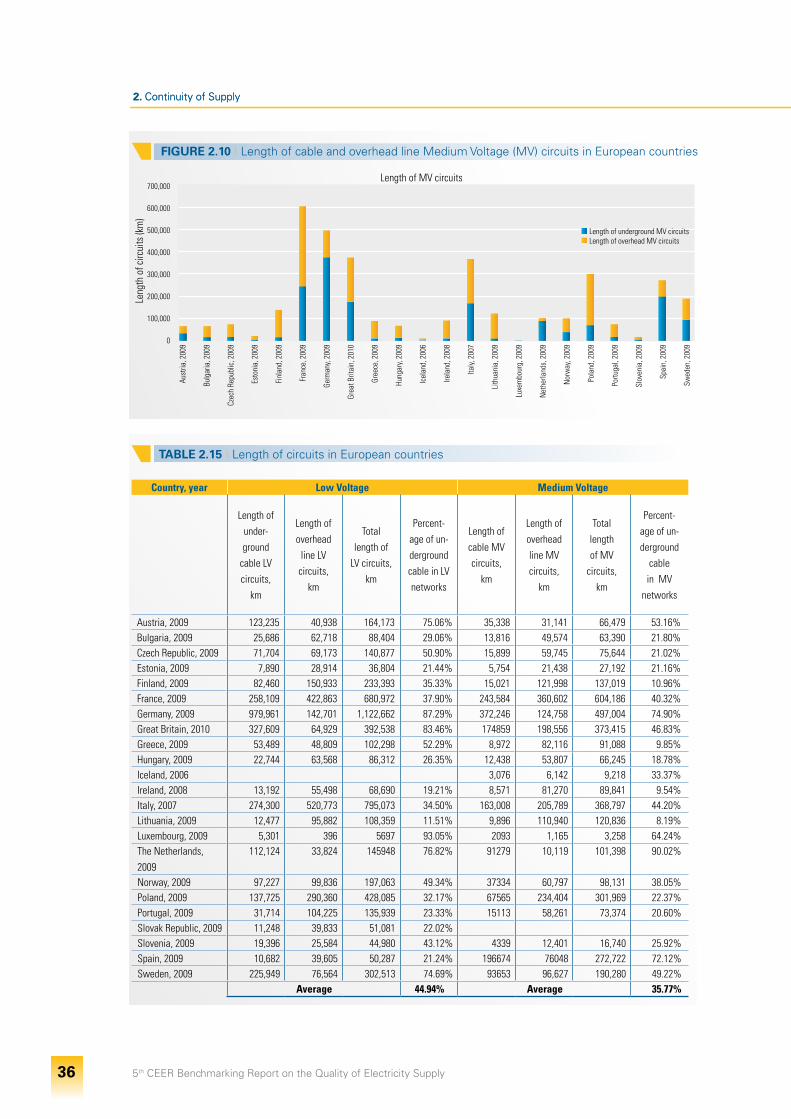
5th CEER Benchmarking Report on the Quality of Electricity Supply 36
2. Continuity of Supply 2. Continuity of Supply
TABLE 2.15 I Length of circuits in European countries
Country, year Low Voltage Medium Voltage
Length of under-ground
cable LV circuits,
km
Length of overhead
line LV circuits,
km
Total length of
LV circuits, km
Percent-age of un-derground cable in LV networks
Length of cable MV circuits,
km
Length of overhead line MV circuits,
km
Total length of MV
circuits, km
Percent-age of un-derground
cable in MV
networks
Austria, 2009 123,235 40,938 164,173 75.06% 35,338 31,141 66,479 53.16%Bulgaria, 2009 25,686 62,718 88,404 29.06% 13,816 49,574 63,390 21.80%Czech Republic, 2009 71,704 69,173 140,877 50.90% 15,899 59,745 75,644 21.02%Estonia, 2009 7,890 28,914 36,804 21.44% 5,754 21,438 27,192 21.16%Finland, 2009 82,460 150,933 233,393 35.33% 15,021 121,998 137,019 10.96%France, 2009 258,109 422,863 680,972 37.90% 243,584 360,602 604,186 40.32%Germany, 2009 979,961 142,701 1,122,662 87.29% 372,246 124,758 497,004 74.90%Great Britain, 2010 327,609 64,929 392,538 83.46% 174859 198,556 373,415 46.83%Greece, 2009 53,489 48,809 102,298 52.29% 8,972 82,116 91,088 9.85%Hungary, 2009 22,744 63,568 86,312 26.35% 12,438 53,807 66,245 18.78%Iceland, 2006 3,076 6,142 9,218 33.37%Ireland, 2008 13,192 55,498 68,690 19.21% 8,571 81,270 89,841 9.54%Italy, 2007 274,300 520,773 795,073 34.50% 163,008 205,789 368,797 44.20%Lithuania, 2009 12,477 95,882 108,359 11.51% 9,896 110,940 120,836 8.19%Luxembourg, 2009 5,301 396 5697 93.05% 2093 1,165 3,258 64.24%The Netherlands, 2009
112,124 33,824 145948 76.82% 91279 10,119 101,398 90.02%
Norway, 2009 97,227 99,836 197,063 49.34% 37334 60,797 98,131 38.05%Poland, 2009 137,725 290,360 428,085 32.17% 67565 234,404 301,969 22.37%Portugal, 2009 31,714 104,225 135,939 23.33% 15113 58,261 73,374 20.60%Slovak Republic, 2009 11,248 39,833 51,081 22.02%Slovenia, 2009 19,396 25,584 44,980 43.12% 4339 12,401 16,740 25.92%Spain, 2009 10,682 39,605 50,287 21.24% 196674 76048 272,722 72.12%Sweden, 2009 225,949 76,564 302,513 74.69% 93653 96,627 190,280 49.22%
Average 44.94% Average 35.77%
700,000
600,000
500,000
400,000
300,000
200,000
100,000
0
Aust
ria, 2
009
Bulg
aria
, 200
9
Czec
h Re
publ
ic, 2
009
Esto
nia,
200
9
Finl
and,
200
9
Fran
ce, 2
009
Germ
any,
2009
Grea
t Brit
ain,
201
0
Gree
ce, 2
009
Hung
ary,
2009
Icel
and,
200
6
Irela
nd, 2
008
Italy,
200
7
Lith
uani
a, 2
009
Luxe
mbo
urg,
200
9
Net
herla
nds,
200
9
Nor
way
, 200
9
Pola
nd, 2
009
Portu
gal,
2009
Slov
enia
, 200
9
Spai
n, 2
009
Swed
en, 2
009
Leng
th o
f circ
uits
(km
)
Length of underground MV circuits Length of overhead MV circuits
FIGURE 2.10 I Length of cable and overhead line Medium Voltage (MV) circuits in European countries
Length of MV circuits
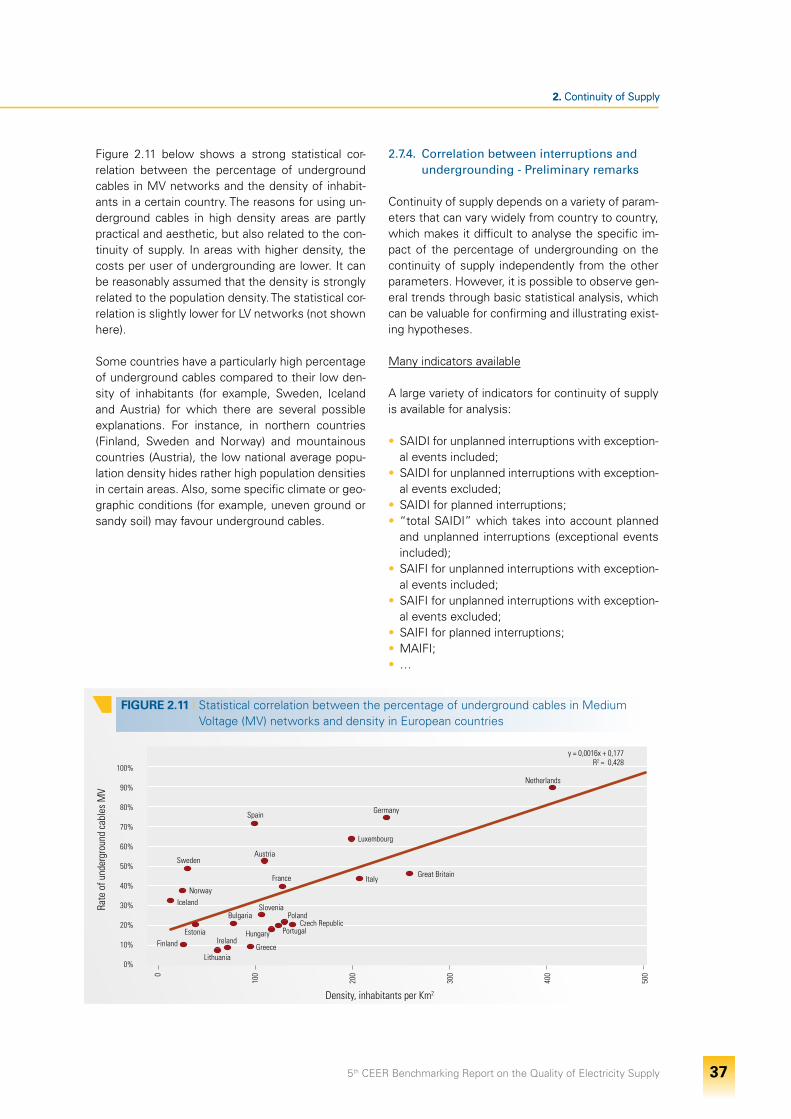
5th CEER Benchmarking Report on the Quality of Electricity Supply 37
2. Continuity of Supply 2. Continuity of Supply
Figure 2.11 below shows a strong statistical cor-relation between the percentage of underground cables in MV networks and the density of inhabit-ants in a certain country. The reasons for using un-derground cables in high density areas are partly practical and aesthetic, but also related to the con-tinuity of supply. In areas with higher density, the costs per user of undergrounding are lower. It can be reasonably assumed that the density is strongly related to the population density. The statistical cor-relation is slightly lower for LV networks (not shown here).
Some countries have a particularly high percentage of underground cables compared to their low den-sity of inhabitants (for example, Sweden, Iceland and Austria) for which there are several possible explanations. For instance, in northern countries (Finland, Sweden and Norway) and mountainous countries (Austria), the low national average popu-lation density hides rather high population densities in certain areas. Also, some specific climate or geo-graphic conditions (for example, uneven ground or sandy soil) may favour underground cables.
2.7.4. Correlation between interruptions and undergrounding - Preliminary remarks
Continuity of supply depends on a variety of param-eters that can vary widely from country to country, which makes it difficult to analyse the specific im-pact of the percentage of undergrounding on the continuity of supply independently from the other parameters. However, it is possible to observe gen-eral trends through basic statistical analysis, which can be valuable for confirming and illustrating exist-ing hypotheses.
Many indicators available
A large variety of indicators for continuity of supply is available for analysis:
•SAIDI for unplanned interruptions with exception-al events included;
• SAIDI for unplanned interruptions with exception-al events excluded;
• SAIDI for planned interruptions;• “total SAIDI” which takes into account planned
and unplanned interruptions (exceptional events included);
• SAIFI for unplanned interruptions with exception-al events included;
• SAIFI for unplanned interruptions with exception-al events excluded;
• SAIFI for planned interruptions;• MAIFI;• …
FIGURE 2.11 I Statistical correlation between the percentage of underground cables in Medium Voltage (MV) networks and density in European countries
100%
90%
80%
70%
60%
50%
40%
30%
20%
10%
0%
Rate
of u
nder
grou
nd c
able
s M
V
0
100
200
300
400
500
Density, inhabitants per Km2
y = 0,0016x + 0,177R2 = 0,428
France Great BritainItaly
Norway
Spain
Netherlands
Austria
Portugal
Germany
Luxembourg
Sweden
Czech RepublicHungary
IrelandFinland
Lithuania
BulgariaSlovenia
Poland
Greece
Iceland
Estonia
5th CEER Benchmarking Report on the Quality of Electricity Supply 38
2. Continuity of Supply
For each indicator, several years of data are avail-able. Especially if exceptional events are included, it might be advisable to use an average over several years instead of the values for one particular year. This would increase the stability of the indicator. Also, as most interruptions are caused by incidents on MV networks, the percentage of underground cables in MV networks should be preferred, even though it appears that the results for both percent-ages on MV and LV networks do not differ signifi-cantly.
CEER’s analysis is based mostly on SAIDI since it is available in almost every country and is a good indi-cator for evaluating the continuity of supply in dis-tribution networks. In most countries, SAIDI takes into account all incidents regardless of the voltage level in which they occur. However, some countries do not take into account incidents in LV networks. In such countries, SAIDI is somewhat underestimat-ed. As Finland and Spain do not calculate SAIDI, it is assumed that T SAIDI in Finland and TIEPI in Spain (both equivalent to ASIDI, weighted by rated power) are valid estimates. However, it is noteworthy that ASIDI is generally lower than SAIDI, considering the actual difference between ASIDI and SAIDI in both Austria and France. SAIFI is also investigated, but to a lesser extent.
Important reservations
Several important reservations must be made re-garding the analysis.
Firstly, the present chapter focuses on under-grounding and therefore does not allow compari-sons with various other actions that could be ben-eficial to continuity of supply. These actions include for instance the improvement of the redundancy of the networks and the allocation of more resources to preventive maintenance, such as monitoring of the networks, replacement of old or weak compo-nents by more robust ones or trimming of trees.
Moreover, this chapter does not include a cost-benefit analysis of the impact of the percentage of underground cables on the level of continuity of supply. Therefore, no conclusion can be drawn regarding the cost-benefit balance of underground-ing the networks for the sole purpose of improving continuity of supply. Incidentally, if it is generally ac-cepted that undergrounding the networks improves continuity of supply, it is also often accepted that its cost-benefit balance is in general rather low com-
pared to some other possible solutions, as under-grounding is very expensive.
Also, it is important to note that a strong statisti-cal correlation between two indicators does not imply that one is the main cause of the other. In the present case, the many parameters that impact the continuity of supply are correlated to a certain extent. Case study 2 in Annex to chapter 2 on Con-tinuity of supply discusses that in France, the main reason for the high availability of networks in urban areas is not the high percentage of underground cables, even though there is indeed a much higher percentage of underground cables in urban areas than in rural areas. Case study 3 provides an exam-ple of how underground cabling relates to SAIDI and population density in Sweden. It is not possible to class any European country as a totally rural or urban area, but it is likely that the population density is positively correlated with most parameters that improve the continuity of supply, including the per-centage of underground cables. As a consequence, it is difficult to assess precisely the specific impact of the percentage of underground cables on conti-nuity of supply.
2.7.5. Correlation between interruptions and undergrounding - Results
Similar results regardless of the indicator
The use of linear regression provides rather similar results for most indicators. Even if datasets are too small to give robust results (there are 18 replies), there is still a noticeable trend, which tends to con-firm existing statements regarding underground cables:
• underground cables are protected from several very common causes of incident, and therefore have a lower failure rate (number of failures per year) than overhead lines;
• in particular, they are far less prone to widespread failures, mostly caused by storms, than overhead lines;
• they do have several downsides: they are more difficult to repair, sometimes damaged by earth-works and more affected by some specific natu-ral events (for example floods and earthquakes), even though these events are generally rare;
• the downsides are not sufficient to offset the benefits, and continuity of supply benefits from undergrounding.
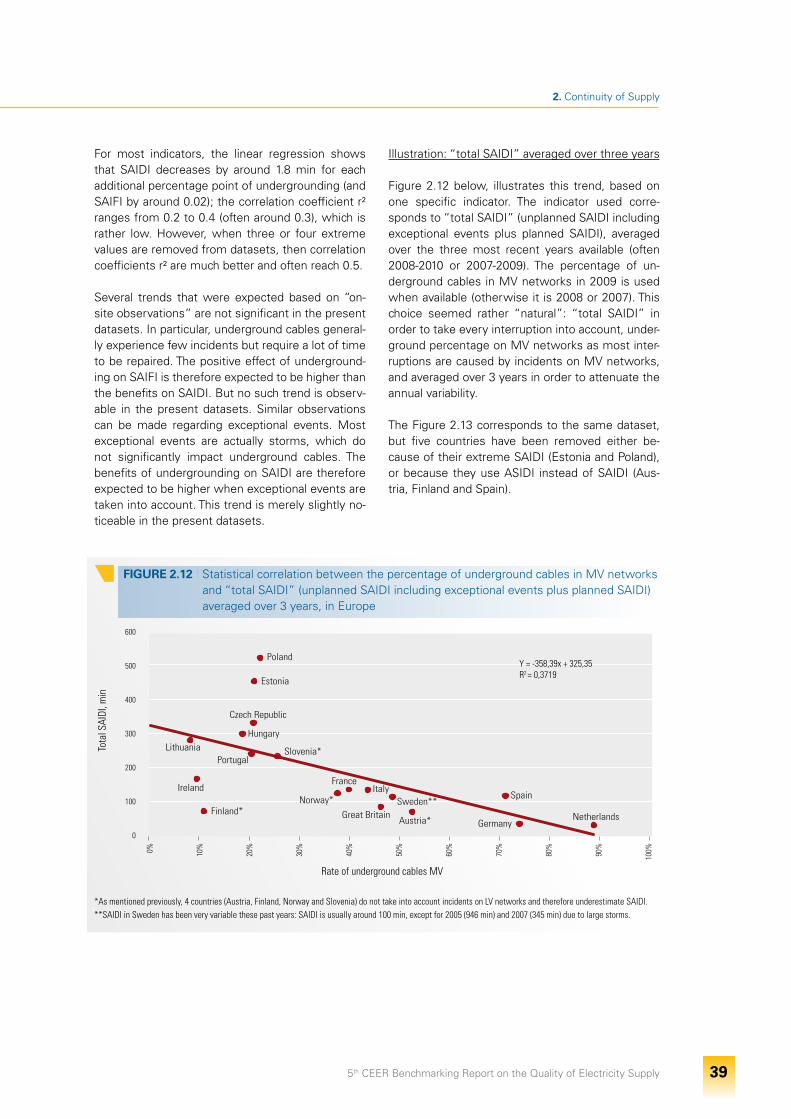
5th CEER Benchmarking Report on the Quality of Electricity Supply 39
2. Continuity of Supply
FIGURE 2.12 I Statistical correlation between the percentage of underground cables in MV networks and “total SAIDI” (unplanned SAIDI including exceptional events plus planned SAIDI) averaged over 3 years, in Europe
600
500
400
300
200
100
0
Tota
l SAI
DI, m
in
0% 10%
20%
30%
40%
50%
60%
70%
80%
90%
100%
Rate of underground cables MV
Poland
Estonia
Czech Republic
Ireland
Hungary Lithuania
Finland* Sweden**
Spain
Great Britain NetherlandsGermany
Portugal Slovenia*
Norway* Italy
France
Austria*
Illustration: “total SAIDI” averaged over three years
Figure 2.12 below, illustrates this trend, based on one specific indicator. The indicator used corre-sponds to “total SAIDI” (unplanned SAIDI including exceptional events plus planned SAIDI), averaged over the three most recent years available (often 2008-2010 or 2007-2009). The percentage of un-derground cables in MV networks in 2009 is used when available (otherwise it is 2008 or 2007). This choice seemed rather “natural”: “total SAIDI” in order to take every interruption into account, under-ground percentage on MV networks as most inter-ruptions are caused by incidents on MV networks, and averaged over 3 years in order to attenuate the annual variability.
The Figure 2.13 corresponds to the same dataset, but five countries have been removed either be-cause of their extreme SAIDI (Estonia and Poland), or because they use ASIDI instead of SAIDI (Aus-tria, Finland and Spain).
For most indicators, the linear regression shows that SAIDI decreases by around 1.8 min for each additional percentage point of undergrounding (and SAIFI by around 0.02); the correlation coefficient r² ranges from 0.2 to 0.4 (often around 0.3), which is rather low. However, when three or four extreme values are removed from datasets, then correlation coefficients r² are much better and often reach 0.5.
Several trends that were expected based on “on-site observations” are not significant in the present datasets. In particular, underground cables general-ly experience few incidents but require a lot of time to be repaired. The positive effect of underground-ing on SAIFI is therefore expected to be higher than the benefits on SAIDI. But no such trend is observ-able in the present datasets. Similar observations can be made regarding exceptional events. Most exceptional events are actually storms, which do not significantly impact underground cables. The benefits of undergrounding on SAIDI are therefore expected to be higher when exceptional events are taken into account. This trend is merely slightly no-ticeable in the present datasets.
Y = -358,39x + 325,35R2 = 0,3719
*As mentioned previously, 4 countries (Austria, Finland, Norway and Slovenia) do not take into account incidents on LV networks and therefore underestimate SAIDI.**SAIDI in Sweden has been very variable these past years: SAIDI is usually around 100 min, except for 2005 (946 min) and 2007 (345 min) due to large storms.
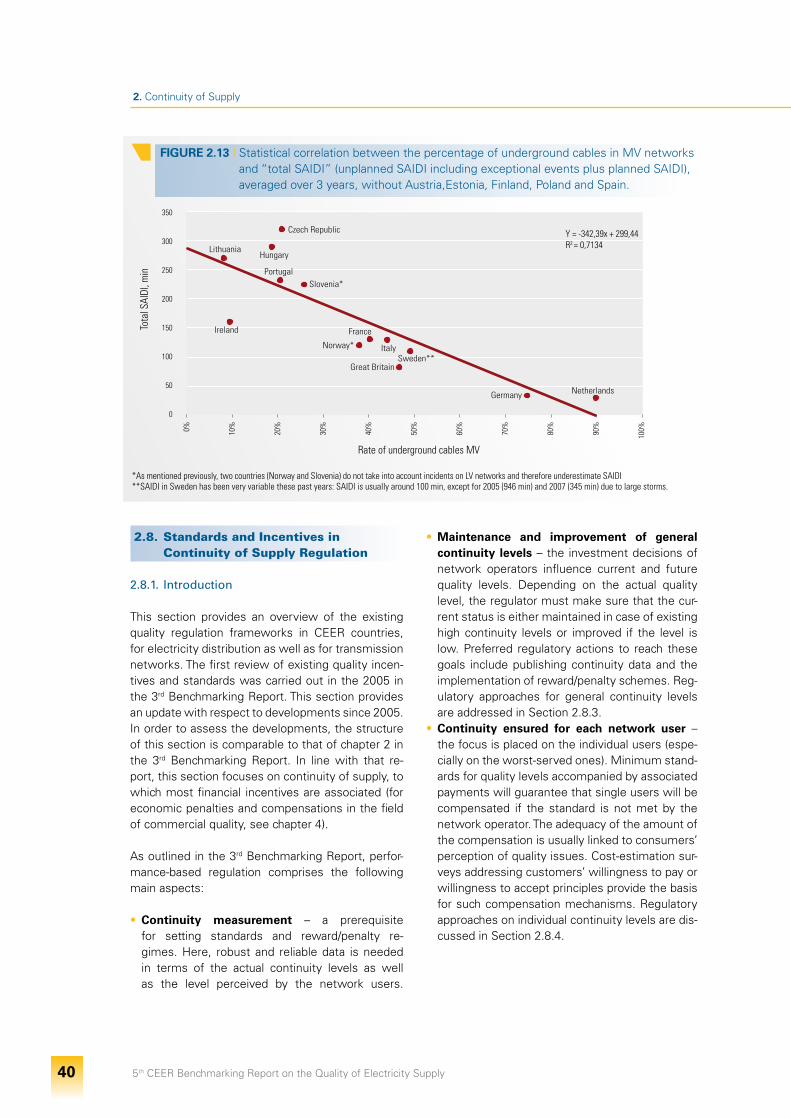
5th CEER Benchmarking Report on the Quality of Electricity Supply 40
2. Continuity of Supply
FIGURE 2.13 I Statistical correlation between the percentage of underground cables in MV networks and “total SAIDI” (unplanned SAIDI including exceptional events plus planned SAIDI), averaged over 3 years, without Austria,Estonia, Finland, Poland and Spain.
350
300
250
200
150
100
50
0
Tota
l SAI
DI, m
in
0% 10%
20%
30%
40%
50%
60%
70%
80%
90%
100%
Rate of underground cables MV
Czech Republic
Ireland
Hungary Lithuania
Sweden** Great Britain
Netherlands Germany
Portugal Slovenia*
Norway* Italy
France
*As mentioned previously, two countries (Norway and Slovenia) do not take into account incidents on LV networks and therefore underestimate SAIDI **SAIDI in Sweden has been very variable these past years: SAIDI is usually around 100 min, except for 2005 (946 min) and 2007 (345 min) due to large storms.
2.8. Standards and Incentives in Continuity of Supply Regulation
2.8.1. Introduction
This section provides an overview of the existing quality regulation frameworks in CEER countries, for electricity distribution as well as for transmission networks. The first review of existing quality incen-tives and standards was carried out in the 2005 in the 3rd Benchmarking Report. This section provides an update with respect to developments since 2005. In order to assess the developments, the structure of this section is comparable to that of chapter 2 in the 3rd Benchmarking Report. In line with that re-port, this section focuses on continuity of supply, to which most financial incentives are associated (for economic penalties and compensations in the field of commercial quality, see chapter 4).
As outlined in the 3rd Benchmarking Report, perfor-mance-based regulation comprises the following main aspects:
• Continuity measurement – a prerequisite for setting standards and reward/penalty re-gimes. Here, robust and reliable data is needed in terms of the actual continuity levels as well as the level perceived by the network users.
• Maintenance and improvement of general continuity levels – the investment decisions of network operators influence current and future quality levels. Depending on the actual quality level, the regulator must make sure that the cur-rent status is either maintained in case of existing high continuity levels or improved if the level is low. Preferred regulatory actions to reach these goals include publishing continuity data and the implementation of reward/penalty schemes. Reg-ulatory approaches for general continuity levels are addressed in Section 2.8.3.
• Continuity ensured for each network user – the focus is placed on the individual users (espe-cially on the worst-served ones). Minimum stand-ards for quality levels accompanied by associated payments will guarantee that single users will be compensated if the standard is not met by the network operator. The adequacy of the amount of the compensation is usually linked to consumers’ perception of quality issues. Cost-estimation sur-veys addressing customers’ willingness to pay or willingness to accept principles provide the basis for such compensation mechanisms. Regulatory approaches on individual continuity levels are dis-cussed in Section 2.8.4.
Y = -342,39x + 299,44R2 = 0,7134
5th CEER Benchmarking Report on the Quality of Electricity Supply 41
2. Continuity of Supply
Most importantly, this section places a special focus on general experiences and those implementation processes as well as possible future improvements of the systems in place. This might be of great as-sistance for NRAs that plan to introduce (or review) a quality regulation regime in the future.
2.8.2. Measurement of quality levels: a prerequisite for quality regulation
The measurement of actual continuity levels through indicators and standards constitutes the basis for regulating continuity and quality of supply as a whole. In general, the actual measurement of continuity can be performed on two different levels, namely system level and user-specific level. While the measurement at system level is usually done on an aggregate basis, measurement at user level is usually based on surveys asking customers about their satisfaction, expectations, willingness to pay for high quality or willingness to accept low qual-ity levels. As is to be expected, private households and business or industrial consumers can have di-verging interests and therefore they will probably also have diverging views regarding the required quality of electricity supply. The implementation of adequate measurement systems is essential for setting standards and incentives at both measure-ment levels.
The most common indicators for measuring dura-tion and frequency of continuity of supply are SAIDI and SAIFI for distribution networks and ENS and AIT for transmission networks. The measurement of interruptions should cover all network levels. Please refer to Sections 2.4-2.6 for further details regarding the use of indicators and measurement.
As mentioned in Section 2.2, CEER addressed this topic in 2010 in its “Guidelines of Good Practice on Estimation of Costs due to Electricity Interruptions and Voltage Disturbances” , including a consultancy review of many studies in European countries and elsewhere. Moreover, the performance indicator on the ‘measured satisfaction of grid users for the “grid” services they receive’ is included in the list of potential output measures for future networks. The CEER Smart Grids Status Review (2011) [7] re-ports national examples of implementation of these measures.
2.8.3. Regulation at system level and reward / penalty regimes
The following section provides an overview of the existing quality incentive schemes in various CEER countries. It also illustrates which indicators and standards are used in this regard. In addition, the economic effects and outcomes of the regulatory actions are addressed. General reward or pen-alty schemes or incentives to optimise continu-ity of supply levels have been introduced in 15 of the 26 countries that provided feedback: Bulgaria, Denmark, Finland, France, Great Britain, Hungary, Ireland, Italy, Lithuania, The Netherlands, Norway, Portugal, Slovenia, Spain and Sweden. However, the use of rewards, penalties and a combination of those differs among countries and is also applied differently to the transmission and the distribution levels. Penalties are usually coupled with rewards and are mostly applied to distribution networks. No country relies exclusively on rewarding companies for the improvement of continuity of supply levels. Table 2.16 reveals that countries do not use on the same indicators. Lithuania has a continuity of sup-ply scheme in place, but a detailed description of the incentives was not available. Most of the coun-tries which have not yet implemented a continu-ity of supply scheme have plans or the intention to introduce such a regime (i.e. Austria, the Czech Republic, Germany, Greece, Luxembourg and Ro-mania). Of these countries, Germany has plans to apply a scheme starting at the beginning of 2012 (see Section 2.8.6. for further details).
Quality as a regulatory element has been imple-mented in several regimes across Europe, with incentive schemes being the most common ones. The main intention is to keep quality levels at a socio-economically acceptable level and therefore maintaining or improving the existing levels might be on the regulator’s radar. Nevertheless, the input-output relationship has to be considered – if the quality level is already very high, then a further im-provement might be very costly for the consumer. Existing schemes in 15 countries are reviewed be-low. The analysis focuses on transmission and dis-tribution networks separately.
Bulgaria uses a combination of penalties and incen-tives for continuity regulation for distribution com-panies (no existing scheme for the transmission level) on the basis of SAIFI and SAIDI indicators. Each year, the level of the indicators is determined according to a standardised calculation method
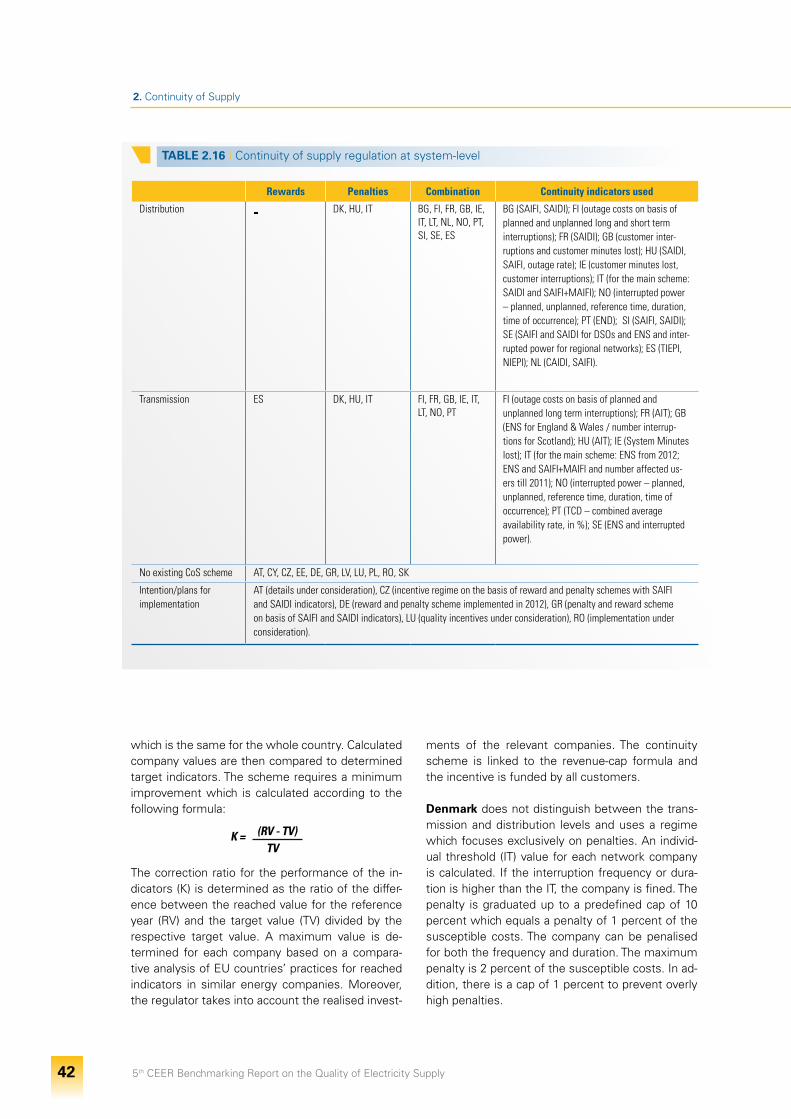
5th CEER Benchmarking Report on the Quality of Electricity Supply 42
2. Continuity of Supply
TABLE 2.16 I Continuity of supply regulation at system-level
Rewards Penalties Combination Continuity indicators used
Distribution - DK, HU, IT BG, FI, FR, GB, IE, IT, LT, NL, NO, PT, SI, SE, ES
BG (SAIFI, SAIDI); FI (outage costs on basis of planned and unplanned long and short term interruptions); FR (SAIDI); GB (customer inter-ruptions and customer minutes lost); HU (SAIDI, SAIFI, outage rate); IE (customer minutes lost, customer interruptions); IT (for the main scheme: SAIDI and SAIFI+MAIFI); NO (interrupted power – planned, unplanned, reference time, duration, time of occurrence); PT (END); SI (SAIFI, SAIDI); SE (SAIFI and SAIDI for DSOs and ENS and inter-rupted power for regional networks); ES (TIEPI, NIEPI); NL (CAIDI, SAIFI).
Transmission ES DK, HU, IT FI, FR, GB, IE, IT, LT, NO, PT
FI (outage costs on basis of planned and unplanned long term interruptions); FR (AIT); GB (ENS for England & Wales / number interrup-tions for Scotland); HU (AIT); IE (System Minutes lost); IT (for the main scheme: ENS from 2012; ENS and SAIFI+MAIFI and number affected us-ers till 2011); NO (interrupted power – planned, unplanned, reference time, duration, time of occurrence); PT (TCD – combined average availability rate, in %); SE (ENS and interrupted power).
No existing CoS scheme AT, CY, CZ, EE, DE, GR, LV, LU, PL, RO, SK
Intention/plans for implementation
AT (details under consideration), CZ (incentive regime on the basis of reward and penalty schemes with SAIFI and SAIDI indicators), DE (reward and penalty scheme implemented in 2012), GR (penalty and reward scheme on basis of SAIFI and SAIDI indicators), LU (quality incentives under consideration), RO (implementation under consideration).
which is the same for the whole country. Calculated company values are then compared to determined target indicators. The scheme requires a minimum improvement which is calculated according to the following formula:
K = (RV - TV)TV
The correction ratio for the performance of the in-dicators (K) is determined as the ratio of the differ-ence between the reached value for the reference year (RV) and the target value (TV) divided by the respective target value. A maximum value is de-termined for each company based on a compara-tive analysis of EU countries’ practices for reached indicators in similar energy companies. Moreover, the regulator takes into account the realised invest-
ments of the relevant companies. The continuity scheme is linked to the revenue-cap formula and the incentive is funded by all customers.
Denmark does not distinguish between the trans-mission and distribution levels and uses a regime which focuses exclusively on penalties. An individ-ual threshold (IT) value for each network company is calculated. If the interruption frequency or dura-tion is higher than the IT, the company is fined. The penalty is graduated up to a predefined cap of 10 percent which equals a penalty of 1 percent of the susceptible costs. The company can be penalised for both the frequency and duration. The maximum penalty is 2 percent of the susceptible costs. In ad-dition, there is a cap of 1 percent to prevent overly high penalties.
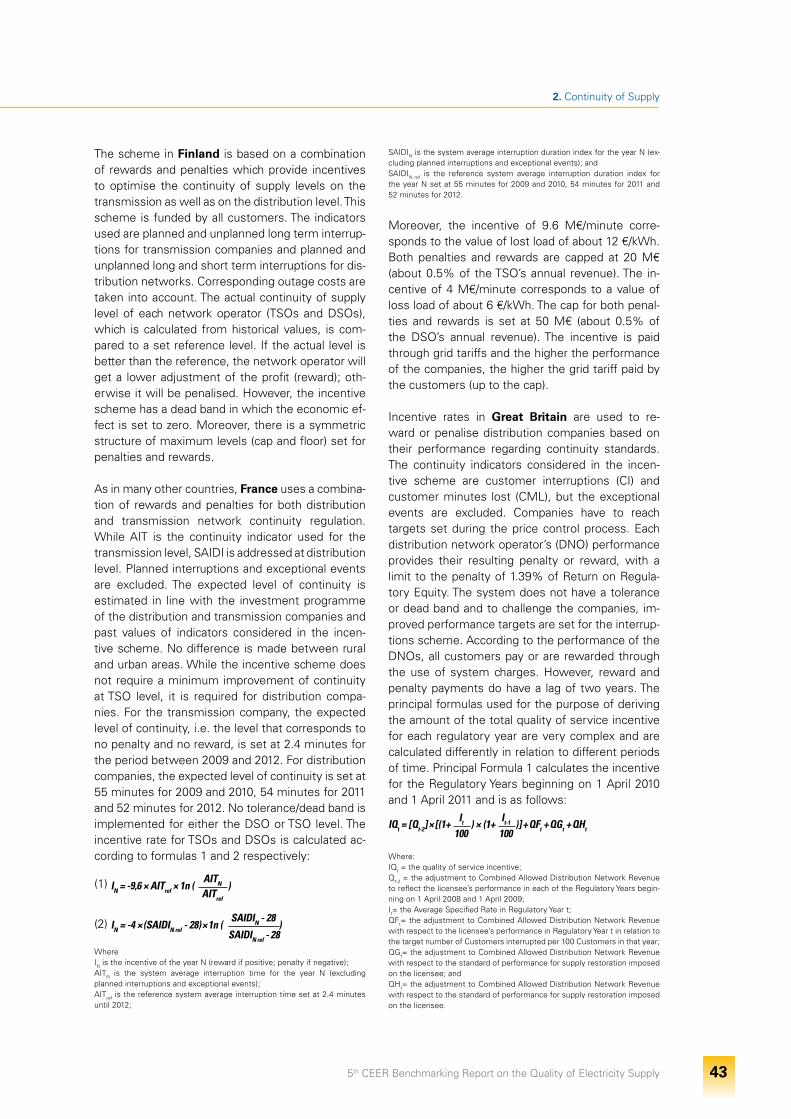
5th CEER Benchmarking Report on the Quality of Electricity Supply 43
2. Continuity of Supply
The scheme in Finland is based on a combination of rewards and penalties which provide incentives to optimise the continuity of supply levels on the transmission as well as on the distribution level. This scheme is funded by all customers. The indicators used are planned and unplanned long term interrup-tions for transmission companies and planned and unplanned long and short term interruptions for dis-tribution networks. Corresponding outage costs are taken into account. The actual continuity of supply level of each network operator (TSOs and DSOs), which is calculated from historical values, is com-pared to a set reference level. If the actual level is better than the reference, the network operator will get a lower adjustment of the profit (reward); oth-erwise it will be penalised. However, the incentive scheme has a dead band in which the economic ef-fect is set to zero. Moreover, there is a symmetric structure of maximum levels (cap and floor) set for penalties and rewards.
As in many other countries, France uses a combina-tion of rewards and penalties for both distribution and transmission network continuity regulation. While AIT is the continuity indicator used for the transmission level, SAIDI is addressed at distribution level. Planned interruptions and exceptional events are excluded. The expected level of continuity is estimated in line with the investment programme of the distribution and transmission companies and past values of indicators considered in the incen-tive scheme. No difference is made between rural and urban areas. While the incentive scheme does not require a minimum improvement of continuity at TSO level, it is required for distribution compa-nies. For the transmission company, the expected level of continuity, i.e. the level that corresponds to no penalty and no reward, is set at 2.4 minutes for the period between 2009 and 2012. For distribution companies, the expected level of continuity is set at 55 minutes for 2009 and 2010, 54 minutes for 2011 and 52 minutes for 2012. No tolerance/dead band is implemented for either the DSO or TSO level. The incentive rate for TSOs and DSOs is calculated ac-cording to formulas 1 and 2 respectively:
(1) IN = -9,6 × AITref × 1n ( )
AITN
AITref
(2) IN = -4 × (SAIDIN ref - 28) × 1n ( )
SAIDIN - 28
SAIDIN ref - 28WhereIN is the incentive of the year N (reward if positive; penalty if negative); AITN is the system average interruption time for the year N (excluding planned interruptions and exceptional events); AITref is the reference system average interruption time set at 2.4 minutes until 2012;
SAIDIN is the system average interruption duration index for the year N (ex-cluding planned interruptions and exceptional events); and SAIDIN ref is the reference system average interruption duration index for the year N set at 55 minutes for 2009 and 2010, 54 minutes for 2011 and 52 minutes for 2012.
Moreover, the incentive of 9.6 M€/minute corre-sponds to the value of lost load of about 12 €/kWh. Both penalties and rewards are capped at 20 M€ (about 0.5% of the TSO’s annual revenue). The in-centive of 4 M€/minute corresponds to a value of loss load of about 6 €/kWh. The cap for both penal-ties and rewards is set at 50 M€ (about 0.5% of the DSO’s annual revenue). The incentive is paid through grid tariffs and the higher the performance of the companies, the higher the grid tariff paid by the customers (up to the cap).
Incentive rates in Great Britain are used to re-ward or penalise distribution companies based on their performance regarding continuity standards. The continuity indicators considered in the incen-tive scheme are customer interruptions (CI) and customer minutes lost (CML), but the exceptional events are excluded. Companies have to reach targets set during the price control process. Each distribution network operator’s (DNO) performance provides their resulting penalty or reward, with a limit to the penalty of 1.39% of Return on Regula-tory Equity. The system does not have a tolerance or dead band and to challenge the companies, im-proved performance targets are set for the interrup-tions scheme. According to the performance of the DNOs, all customers pay or are rewarded through the use of system charges. However, reward and penalty payments do have a lag of two years. The principal formulas used for the purpose of deriving the amount of the total quality of service incentive for each regulatory year are very complex and are calculated differently in relation to different periods of time. Principal Formula 1 calculates the incentive for the Regulatory Years beginning on 1 April 2010 and 1 April 2011 and is as follows:
IQt = [Qt-2] × [(1+ It
100) × (1+
It-1
100)] + QFt + QGt + QHt
Where:IQt = the quality of service incentive; Qt-2 = the adjustment to Combined Allowed Distribution Network Revenue to reflect the licensee’s performance in each of the Regulatory Years begin-ning on 1 April 2008 and 1 April 2009; It= the Average Specified Rate in Regulatory Year t;QFt= the adjustment to Combined Allowed Distribution Network Revenue with respect to the licensee’s performance in Regulatory Year t in relation to the target number of Customers interrupted per 100 Customers in that year; QGt= the adjustment to Combined Allowed Distribution Network Revenue with respect to the standard of performance for supply restoration imposed on the licensee; and QHt= the adjustment to Combined Allowed Distribution Network Revenue with respect to the standard of performance for supply restoration imposed on the licensee.
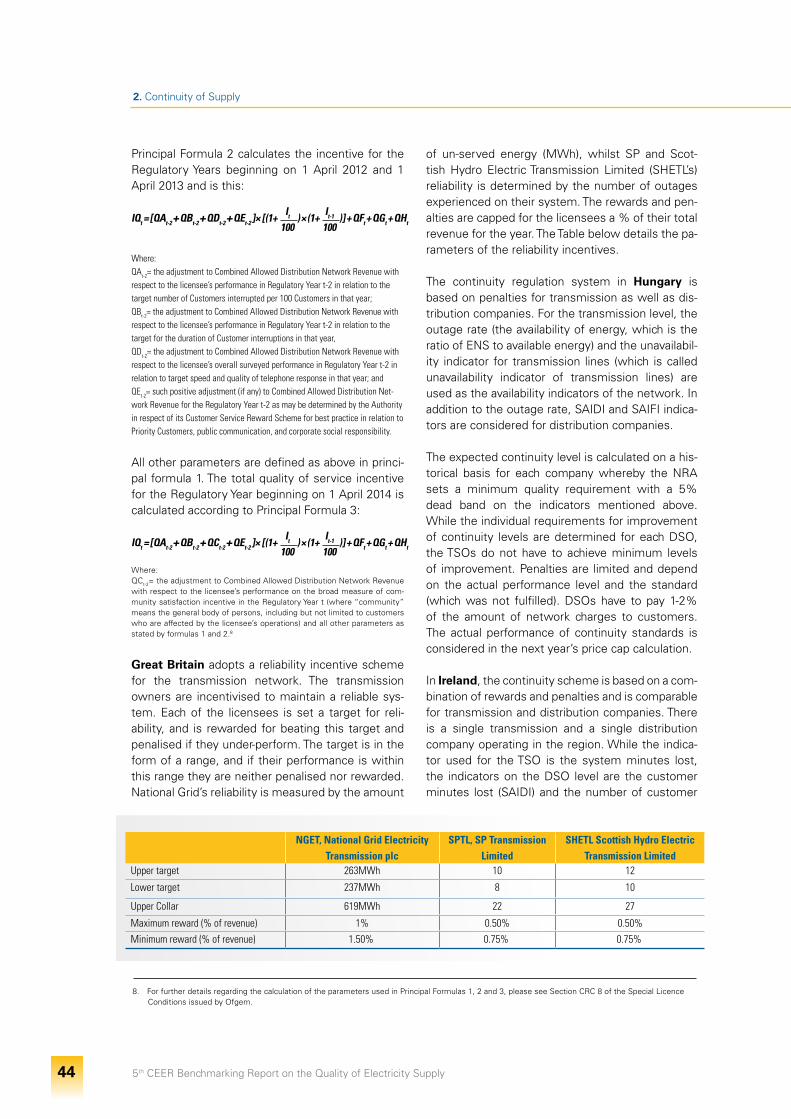
5th CEER Benchmarking Report on the Quality of Electricity Supply 44
2. Continuity of Supply
Principal Formula 2 calculates the incentive for the Regulatory Years beginning on 1 April 2012 and 1 April 2013 and is this:
IQt = [QAt-2 + QBt-2 + QDt-2 + QEt-2 ]× [(1+ It
100) × (1+
It-1
100)] + QFt + QGt + QHt
Where:QAt-2= the adjustment to Combined Allowed Distribution Network Revenue with respect to the licensee’s performance in Regulatory Year t-2 in relation to the target number of Customers interrupted per 100 Customers in that year; QBt-2= the adjustment to Combined Allowed Distribution Network Revenue with respect to the licensee’s performance in Regulatory Year t-2 in relation to the target for the duration of Customer interruptions in that year, QDt-2= the adjustment to Combined Allowed Distribution Network Revenue with respect to the licensee’s overall surveyed performance in Regulatory Year t-2 in relation to target speed and quality of telephone response in that year; and QEt-2= such positive adjustment (if any) to Combined Allowed Distribution Net-work Revenue for the Regulatory Year t-2 as may be determined by the Authority in respect of its Customer Service Reward Scheme for best practice in relation to Priority Customers, public communication, and corporate social responsibility.
All other parameters are defined as above in princi-pal formula 1. The total quality of service incentive for the Regulatory Year beginning on 1 April 2014 is calculated according to Principal Formula 3:
IQt = [QAt-2 + QBt-2 + QCt-2 + QEt-2 ]× [(1+ It
100) × (1+
It-1
100)] + QFt + QGt + QHt
Where:QCt-2= the adjustment to Combined Allowed Distribution Network Revenue with respect to the licensee’s performance on the broad measure of com-munity satisfaction incentive in the Regulatory Year t (where “community” means the general body of persons, including but not limited to customers who are affected by the licensee’s operations) and all other parameters as stated by formulas 1 and 2.8
Great Britain adopts a reliability incentive scheme for the transmission network. The transmission owners are incentivised to maintain a reliable sys-tem. Each of the licensees is set a target for reli-ability, and is rewarded for beating this target and penalised if they under-perform. The target is in the form of a range, and if their performance is within this range they are neither penalised nor rewarded. National Grid’s reliability is measured by the amount
NGET, National Grid Electricity Transmission plc
SPTL, SP Transmission Limited
SHETL Scottish Hydro Electric Transmission Limited
Upper target 263MWh 10 12
Lower target 237MWh 8 10
Upper Collar 619MWh 22 27
Maximum reward (% of revenue) 1% 0.50% 0.50%
Minimum reward (% of revenue) 1.50% 0.75% 0.75%
of un-served energy (MWh), whilst SP and Scot-tish Hydro Electric Transmission Limited (SHETL’s) reliability is determined by the number of outages experienced on their system. The rewards and pen-alties are capped for the licensees a % of their total revenue for the year. The Table below details the pa-rameters of the reliability incentives.
The continuity regulation system in Hungary is based on penalties for transmission as well as dis-tribution companies. For the transmission level, the outage rate (the availability of energy, which is the ratio of ENS to available energy) and the unavailabil-ity indicator for transmission lines (which is called unavailability indicator of transmission lines) are used as the availability indicators of the network. In addition to the outage rate, SAIDI and SAIFI indica-tors are considered for distribution companies.
The expected continuity level is calculated on a his-torical basis for each company whereby the NRA sets a minimum quality requirement with a 5% dead band on the indicators mentioned above. While the individual requirements for improvement of continuity levels are determined for each DSO, the TSOs do not have to achieve minimum levels of improvement. Penalties are limited and depend on the actual performance level and the standard (which was not fulfilled). DSOs have to pay 1-2% of the amount of network charges to customers. The actual performance of continuity standards is considered in the next year’s price cap calculation.
In Ireland, the continuity scheme is based on a com-bination of rewards and penalties and is comparable for transmission and distribution companies. There is a single transmission and a single distribution company operating in the region. While the indica-tor used for the TSO is the system minutes lost, the indicators on the DSO level are the customer minutes lost (SAIDI) and the number of customer
8. For further details regarding the calculation of the parameters used in Principal Formulas 1, 2 and 3, please see Section CRC 8 of the Special Licence Conditions issued by Ofgem.
5th CEER Benchmarking Report on the Quality of Electricity Supply 45
2. Continuity of Supply
interruptions (SAIFI). For the TSO, the NRA sets an incentive target for a two year period. Considering that system minutes lost (SML) values have varied significantly in the past years, a ‘dead-band’ is ap-plied to the incentive where no payment or penalty will accrue. The TSO gains a revenue incentive if it manages to bring SML under a certain point set by the NRA. If SML is above the point set by the NRA, the TSO pays a penalty. The targets for the SML incentive are set through reviewing SML results and discussing the expected SML results for the forthcoming year with the TSO. Thus, the incentive scheme does not require a minimum improvement. The level of the reward depends on the amount by which the TSO has beaten the target. Each percent-age point of over/under achievement is rewarded by a fixed amount on a symmetrical basis for both rewards and penalties (no use of a dead-band). The most recent incentive period (2009/2010) had a cen-tral target of 3.5 SML with an upper maximal value of 5.5 SML and a lower bound of 1.5 SML.
As part of the first two revenue controls for the dis-tribution level, covering the period between 2001 and 2010, financial incentives were used to reduce the annual average number of minutes for which each customer’s electricity supply was interrupted (see http://www.cer.ie for further details). There was a financial reward/penalty associated with ex-ceeding/failing the set target values (planned and unplanned interruptions) for each year. While there has been an improvement in performance over the period, leading to payments in 2007 and 2008, (the first year of the control period 2006 to 2010) the DSO did not meet its targets in 2006 and was pe-nalised accordingly. A similar mechanism as the one in the previous control periods has been included for the revenue control 2011 to 2015. The mecha-nism foresees that both the number of CI and the CML are reduced over time. The level of the re-ward/penalty depends on the amount by which the DSO has beaten/missed the target. Each percent-age point over/under achievement is rewarded by a fixed amount. The annual payment/penalty for CI is limited to 1.5% of total annual DSO revenue. This limit is set at a level to ensure the payment is suf-ficient to incentivise the DSO while also ensuring the reward/penalty is not overly onerous on either the DSO or its customers. The continuity scheme is linked to the revenue cap mechanism for the trans-mission and distribution business. The annual pay-ments and penalties are calculated each year and
added or deducted from the annual revenues the companies can collect from their customers.
In Italy, there are several incentives schemes for distribution and for transmission. Several indicators are adopted accordingly. Two main schemes for distribution, with rewards and penalties, relate to SAIDI and to the sum of SAIFI and MAIFI. The first one (SAIDI-based) has been in place since 2000. The second one (on SAIFI + MAIFI) has been en-forced since 2008. Planned interruptions and force majeure events are excluded.
Such schemes refer to past continuity performance and aim towards a 12-year convergence of common targets for continuity levels across 350 territories in Italy (which are differentiated as urban, suburban, rural areas). This implies a requirement to improve for the territories with bad continuity and a require-ment to maintain for those ones with good continu-ity, e.g. the long term target is 25 minutes for urban territories, 40 minutes for suburban territories and 60 minutes for rural territories.
Actual levels are based on a two year rolling aver-age. The slope of the rewards and penalties is sym-metrical. Further details on the use of customer surveys on cost of interruptions in order to set the slope are available in the CEER GGP on Estimation of Costs due to Electricity Interruptions and Volt-age Disturbances. The mean figures of the Value of Lost Load (for the SAIDI-based scheme) are set at 10,800 €/MWh not supplied for LV domestic users and at 21,600 €/MWh for other users. A joint cap of rewards, a joint floor of penalties and dead-bands are used in the schemes.
Next, a penalty-only scheme for distribution is at-tached to the number of interruptions for each MV user during a year. The scheme applies for SAIFI in the period 2006-2011 and for the sum of SAIFI and MAIFI from 2012 on. It applies partly as a system-level penalty and partly as individual compensation for MV users (see Section 2.8.4).
Last, a penalty-only scheme for distribution de-pends on the number of LV users affected by a single interruption lasting more than 8 hours. It has been in force since 2008. The number of LV users with long interruptions is multiplied by 70€ per user in order to determine the annual penalty.
5th CEER Benchmarking Report on the Quality of Electricity Supply 46
2. Continuity of Supply
The main (reward/penalty) scheme adopted in Italy for the transmission network reliability from 2008 until 2011 is based on actual measurements of three indicators: the first is similar to ENS, the second is the number of interruptions per transmission net-work user, and the third is the number of NTG users with zero interruptions/year. The economic effect of the scheme is proportional to the performance improvement in the actual levels of the indicators with respect to yearly objectives pre-defined for the whole period on the basis of historical values. From 2012, the scheme is being modified by using only the regulated energy not supplied (R-ENS). The term ‘regulated’ refers to the limitation func-tion which was adopted in order to deal both with Transmission Major Incidents, by smoothing their effect. Taking into account the different choice of indicators and the end of the first regulatory period, the Value of Lost Load is expected to increase up to 40,000 €/MWh (whereas the value in the years 2008-2011 was 15,000 €/MWh). The main transmis-sion scheme excludes interruptions due to:
• the automatic intervention of under-frequency load shedding schemes as a consequence of disturbances originating in neighbouring intercon-nected countries;
• preventive load shedding (communicated at least one day in advance adopting defined procedures) as a consequence of expected lack of generation adequacy;
• forced line outages due to public orders (e.g. in case of fire when switching off the HV circuits if demanded by police or fire corps);
• extreme disaster situations (e.g. earthquakes);• intentional damages (e.g. terrorist attacks).
Next, a penalty-only scheme for transmission de-pends on ENS to the transmission user due to single interruptions lasting more than 2 hours. It is in force since 2008. The portion of ENS (after two hours) is multiplied by 10,000 €/MWh in order to determine the annual penalty.
Lastly, since 2008 the Italian TSO has to contrib-ute to the distribution penalty-only schemes as a proportion to its own responsibility. This applies for the very long interruptions and for the number of interruptions per year per MV network users. If a MV user is affected by five interruptions with four interruptions originating at the distribution opera-tor and one at the transmission operator, economic compensation is provided 80% by the DSO, 20% by the TSO.
In Lithuania, rewards or penalties are linked to a price cap formula via a quality factor and are adjust-ed every three years. Thus, the incentive is funded by all customers via network tariffs.
While in The Netherlands there is no quality regu-lation implemented on the transmission level, the distribution level has a scheme based on the combi-nation of rewards and penalties. Each DSO is com-pared to the average value of the quality level of supply and receives a reward or penalty depending on whether it performed better or worse than the average. The average continuity level achieved by all DSOs is used as a standard for the quality fac-tor. Thus, the incentives are equal to the difference between the actual performance level (the value of the quality level of the DSO) and the standard (the average value of the quality level of all DSOs). The scheme does not require a minimum improvement and no distinction is made between urban and rural areas. The valuation of the quality level of supply is based on a cost estimation survey and based on the SAIFI and Customer Average Interruption Duration Index (CAIDI) indicators. The reward or penalty is an incentive to each DSO to deliver the optimal level of continuity of supply. The incentive scheme is based on a formula set by law:
TIt = 1 + (CPIt - X + Q)
100 * TIt-1
Where:TI = total income of the DSO in a particular year t;CPIt = the consumer price index in year t;Q = the quality factor; andX = the efficiency factor.
Thus, the continuity incentive is part of the for-mula which determines the total income of a DSO. The total income of a DSO is then used to set the prices (price-cap regulation). The continuity-incentive scheme is linked to the price control formula (since the efficiency factor and the quality factor are both in the same formula) to determine the total income of the DSOs. The efficiency factor is derived by consid-ering the average costs of all DSOs as efficient and the quality factor is derived by considering the aver-age value of quality as the standard. Thus, each DSO has to balance efficiency and quality in such a way that the optimal level for both will be reached. If a DSO performs better than average, all of its custom-ers pay a somewhat higher tariff. If a DSO performs worse than average, all of its customers pay a some-what lower tariff. The total reward or penalty of the Q factor is maximised at 5% of the total income of the DSO but this cap or floor has not been reached yet.
5th CEER Benchmarking Report on the Quality of Electricity Supply 47
2. Continuity of Supply
The Norwegian quality of supply regulation has been developed gradually since the Energy Act en-tered into force in 1991. Mandatory monitoring and reporting of long interruptions (> 3 min) started in 1995, while the monitoring of standardisation of the estimation of ENS started in 2000. This laid the foun-dation for introducing quality dependent revenue caps and the cost of energy not supplied (CENS) ar-rangement in 2001. Reporting of short interruptions (< 3 min) and interrupted power became mandatory in 2006. The interruption cost assessment has, up to 2009, been based on long interruptions and fixed cost rates for an average interruption duration and referred to a specific time of the year, week and period of the day. The interruption cost assessment in the period 2001-2008 was in principle determined according to:
C*j = cref* × r × Pj
Where:C*j= interruption cost for an interruption at time j (NOK);C ref * = fixed cost rate in NOK/kWh at reference time, for an average dura-tion at 2.85 hrs for non-notified and 1.3 hrs for notified interruptions respec-tively.
After eight years experience with fixed cost rates irrespective of duration and time of occurrence of interruptions, the cost assessment was changed to incorporate these aspects. The CENS arrangement from 2009 comprises both short and long interrup-tions based on the mandatory reporting of interrup-tions. The cost of a single interruption is calculated using the following method, taking duration and time of occurrence of the interruption into account:
Cj = cref (r) × ƒCh × ƒCd × ƒCm × Pref
Where: Cj = interruption cost for an interruption at time j (NOK);cref(r) = cost rate in NOK/kW for duration r;Pref = Interrupted power in kW at reference time;fCh, fCd, fCm = correction factors for time of occurrence (hour, day, month) per customer group.
The cost functions and correction factors are given for each of the six customer groups in the regula-tions (agriculture, residential, industry, commer-cial, public, large industry). The monthly variation is represented by a factor per month. There are three factors describing the weekly variation divided in Mondays through Fridays, Saturdays and Sundays/holidays, respectively. The daily variation is sepa-rated in six periods of the day. If the duration of an interruption affects more than one of the periods covered by the correction factors, a weighted aver-age for the time periods should be used. If the inter-ruption is planned and communicated to customers
a reasonable amount of time prior to the interrup-tion, six reduction factors are defined for Cj, one for each customer group. CENS is not paid to the customers directly but is linked to the implemented revenue cap formula. The companies may, however, enter into individual agreements with customers for direct payment of CENS. Such agreements are only allowed for customers with an expected use of electricity above 400,000 kWh per year and require agreed-upon cost rates for non-notified and notified interruption of varying interruption durations. Fur-ther, the cost rates must be calculated based on the expected costs for the specific customer and the agreement shall include any assumption upon which the calculation is based. Generally, interrup-tion costs are included in the cost base for the cal-culation in the revenue cap and are also included in the benchmarking. All costs in the revenue cap are historic costs from two years earlier, as are the interruption costs. The allowed revenue for a com-pany in a certain year is that year’s revenue cap mi-nus the actual interruption costs in that year.
Portugal also relies on a combination of rewards and penalties for transmission and DSOs. The rel-evant indicator for the transmission level is the ‘combined average availability rate’, expressed in % (Tcd). The incentive is symmetric and tied to a tar-get/reference value of Tcd (Tcdref) with a dead band being addressed as well. The scheme is illustrated by Figure 2.14.
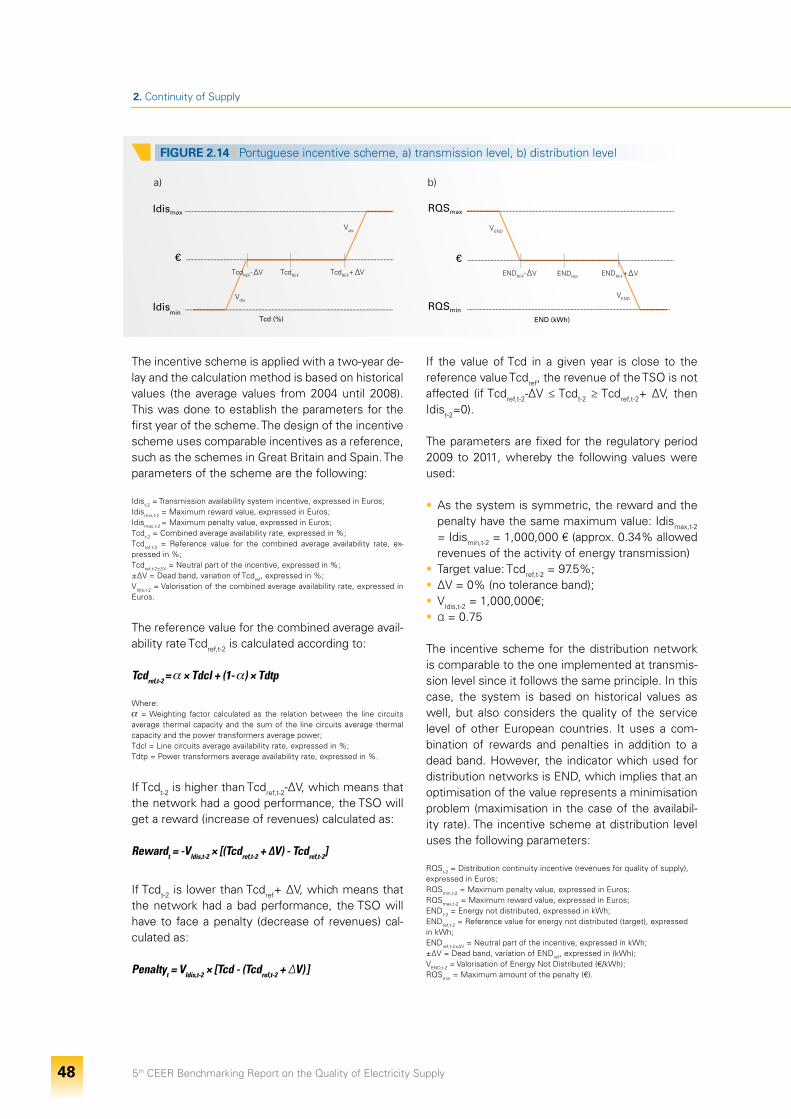
5th CEER Benchmarking Report on the Quality of Electricity Supply 48
2. Continuity of Supply
FIGURE 2.14 I Portuguese incentive scheme, a) transmission level, b) distribution level
RQSmax
€
RQSmin
VEND
ENDREF- V ENDREF
END (kWh)
ENDREF+ V
VEND
Idismax
Idis
€
Tcd (%)
Vdis
Vdis
TcdREF- V TcdREF TcdREF+ V
a) b)
The incentive scheme is applied with a two-year de-lay and the calculation method is based on historical values (the average values from 2004 until 2008). This was done to establish the parameters for the first year of the scheme. The design of the incentive scheme uses comparable incentives as a reference, such as the schemes in Great Britain and Spain. The parameters of the scheme are the following:
Idist-2 = Transmission availability system incentive, expressed in Euros;Idismin,t-2 = Maximum reward value, expressed in Euros;Idismax,t-2 = Maximum penalty value, expressed in Euros;Tcdt-2 = Combined average availability rate, expressed in %;Tcdref,t-2 = Reference value for the combined average availability rate, ex-pressed in %;Tcdref,t-2±ΔV = Neutral part of the incentive, expressed in %;±ΔV = Dead band, variation of Tcdref, expressed in %;VIdis,t-2 = Valorisation of the combined average availability rate, expressed in Euros.
The reference value for the combined average avail-ability rate Tcdref,t-2 is calculated according to:
Tcdref,t-2 = × Tdcl + (1- ) × Tdtp
Where: = Weighting factor calculated as the relation between the line circuits
average thermal capacity and the sum of the line circuits average thermal capacity and the power transformers average power;Tdcl = Line circuits average availability rate, expressed in %;Tdtp = Power transformers average availability rate, expressed in %.
If Tcdt-2 is higher than Tcdref,t-2-ΔV, which means that the network had a good performance, the TSO will get a reward (increase of revenues) calculated as:
Rewardt = -VIdis,t-2 × [(Tcdref,t-2 + ∆V) - Tcdref,t-2]
If Tcdt-2 is lower than Tcdref+ ΔV, which means that the network had a bad performance, the TSO will have to face a penalty (decrease of revenues) cal-culated as:
Penaltyt = VIdis,t-2 × [Tcd - (Tcdref,t-2 + ΔV) ]
If the value of Tcd in a given year is close to the reference value Tcdref, the revenue of the TSO is not affected (if Tcdref,t-2-ΔV ≤ Tcdt-2 ≥ Tcdref,t-2+ ΔV, then Idist-2=0).
The parameters are fixed for the regulatory period 2009 to 2011, whereby the following values were used:
• As the system is symmetric, the reward and the penalty have the same maximum value: Idismax,t-2 = Idismin,t-2 = 1,000,000 € (approx. 0.34% allowed revenues of the activity of energy transmission)
• Target value: Tcdref,t-2 = 97.5%;• ΔV = 0% (no tolerance band);• VIdis,t-2 = 1,000,000€;• α = 0.75
The incentive scheme for the distribution network is comparable to the one implemented at transmis-sion level since it follows the same principle. In this case, the system is based on historical values as well, but also considers the quality of the service level of other European countries. It uses a com-bination of rewards and penalties in addition to a dead band. However, the indicator which used for distribution networks is END, which implies that an optimisation of the value represents a minimisation problem (maximisation in the case of the availabil-ity rate). The incentive scheme at distribution level uses the following parameters:
RQSt-2 = Distribution continuity incentive (revenues for quality of supply), expressed in Euros;RQSmin,t-2 = Maximum penalty value, expressed in Euros;RQSmax,t-2 = Maximum reward value, expressed in Euros;ENDt-2 = Energy not distributed, expressed in kWh;ENDref,t-2 = Reference value for energy not distributed (target), expressed in kWh;ENDref,t-2±ΔV = Neutral part of the incentive, expressed in kWh;±ΔV = Dead band, variation of ENDref, expressed in (kWh);VEND,t-2 = Valorisation of Energy Not Distributed (€/kWh);RQSmin = Maximum amount of the penalty (€).
Δ Δ Δ Δ
min
5th CEER Benchmarking Report on the Quality of Electricity Supply 49
2. Continuity of Supply
The reference value for the combined average avail-ability rate ENDref,t-2 is calculated according to:
ENDref,t-2 = × EDt-2
Where:
β: Rate of non-availability;
ED: Energy supplied in the year.
If ENDt-2 is lower than ENDref,t-2-ΔV, which means that the network had a good performance, the DSO will get a reward (increase of revenues) calculated as:
Rewardt = -VEND,t-2 × [(ENDref,t-2 + ∆V) - ENDt-2]
If ENDt-2 is higher than ENDref,t-2+ ΔV, which means that the network had a bad performance, the DSO will have to face a penalty (decrease of revenues) calculated as:
Penaltyt = VEND,t-2 × [(ENDref,t-2 + ΔV) - END ]
If the value of END in a given year is close to the reference value ENdref,t-2, the revenue of the DSO is not affected (if ENDref,t-2-ΔV ≤ ENDt-2≤ENDref,t-2+ ΔV, then RQSt-2=0).
The scheme for the distribution network has been adapted in the past, i.e. the incentive scheme de-mands some improvements over time. The param-eters for the 2003-2005 period were the following:
• Reward and penalty with the same value: RQSmax,t-2 = RQSmin,t-2 = 5,000,000€ (approx. 0.55% allowed revenues of the activity of energy distribution)
• Target: ENDref,t-2 = 0.0004 × EDt-2
• Tolerance band: ±ΔV = 0.12 × ENDref,t-2
The tolerance band was set considering the histori-cal values of END and making sensitivity analyses about the impact of different values for the dead band. It takes into consideration that is not possible to exactly reach the reference value.
The scheme has been adopted according to the following changes:
2006: TIEPIref = 92% TIEPI 2004;2007: TIEPIref = 92% TIEPI 2006;2008: TIEPIref = 92% TIEPI 2007;2009: TIEPIref = 94% TIEPI 2008;2010: TIEPIref = 94% TIEPI 2009;2011: TIEPIref = 94% TIEPI 2010
Where:END = ED x TIEPI / T
Slovenia also uses a combination of rewards and penalties for continuity regulation of distribution networks. The scheme is fully flexible regarding the indicators used, the levels of penalties and re-wards, quality classes, dead bands, etc. In general, the parameters and indicators are specified for one regulatory period but can be extended as needed. For the regulatory period 2011-2012, the indicators considered are the SAIDI and SAIFI values.
The structure of the incentive scheme is defined through a mathematical model based on a set of lin-ear functions applied in different areas (the so-called “method of classes with interpolation on their bor-ders”). It is defined and applied separately for each distribution area (in the current regulatory period it is not applied to a particular area type (urban, mixed, rural)). A certain constant band (constant economic effect) is applied for each quality class and a linear function is defined in the range between the qual-ity classes. This is introduced for the same reason as in the case of a so-called dead-band: to avoid its effect on the tariff level (optimising the admin-istrative costs) caused by non-structural changes in level of continuity of supply (i.e. stochastic vari-ations around the reference of a certain class). It is defined by the reference standards calculated each year by applying the requested improvement on the initial (starting) level of the continuity of sup-ply using SAIDI and SAIFI. Improvements in con-tinuity levels are demanded on a yearly basis, as long as the long-term reference level has not been reached. However, the reward/penalty scheme is capped and also floored (to a certain percentage of controlled costs for O&M). Capping is applied since the NRA has not yet completely verified/validated the customer information on the marginal valuation of quality. The incentive scheme is floored to 2% (penalty) and capped to 0% (reward) of controlled operation and maintenance costs. The rewards are not applied due to the fact that the NRA hadn’t ob-tained legal powers to perform “on-site” audits in the past. Sufficient legal powers have been assured since 1 January 2011. The quality scheme is linked via a “quality factor” (“q”) to the implemented rev-enue cap scheme (building blocks approach) for the period 2010-2012. The revenue is calculated accord-ing to the following formula:
Rcy ≤ (1 + ƒ(CPI) - ƒ(x) ± ƒ(q))Rpy ±∆C
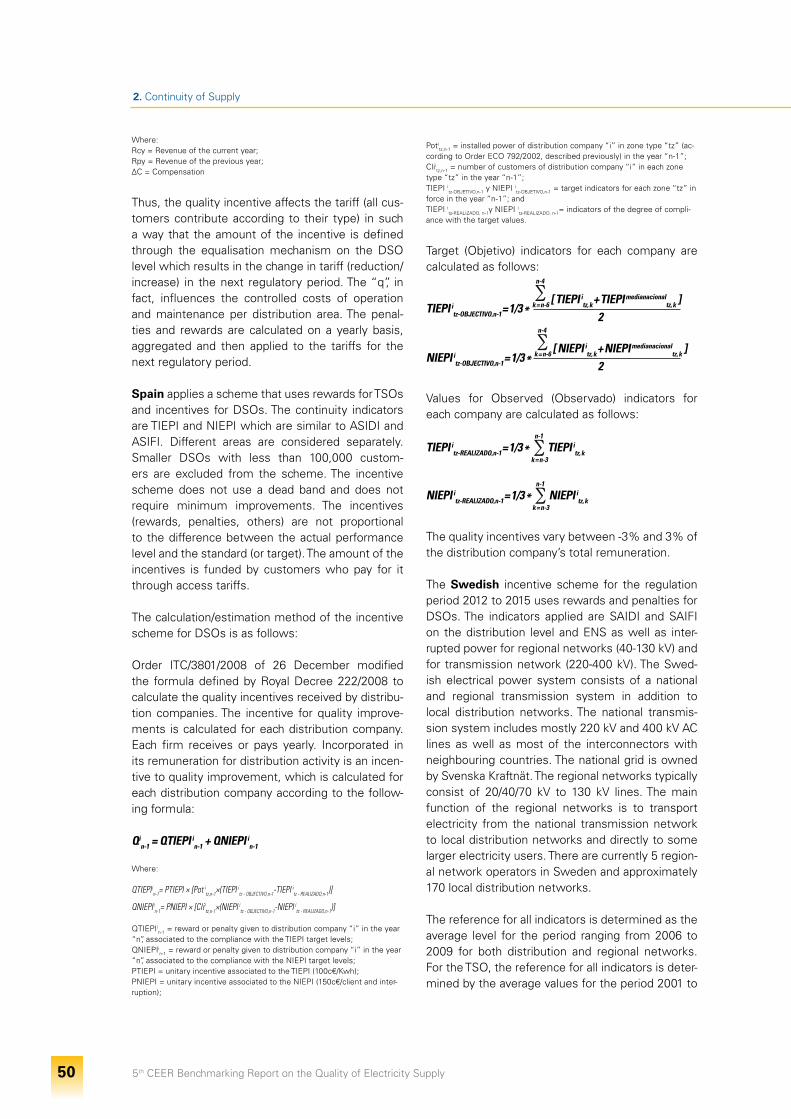
5th CEER Benchmarking Report on the Quality of Electricity Supply 50
2. Continuity of Supply
Where: Rcy = Revenue of the current year; Rpy = Revenue of the previous year; ΔC = Compensation
Thus, the quality incentive affects the tariff (all cus-tomers contribute according to their type) in such a way that the amount of the incentive is defined through the equalisation mechanism on the DSO level which results in the change in tariff (reduction/increase) in the next regulatory period. The “q”, in fact, influences the controlled costs of operation and maintenance per distribution area. The penal-ties and rewards are calculated on a yearly basis, aggregated and then applied to the tariffs for the next regulatory period.
Spain applies a scheme that uses rewards for TSOs and incentives for DSOs. The continuity indicators are TIEPI and NIEPI which are similar to ASIDI and ASIFI. Different areas are considered separately. Smaller DSOs with less than 100,000 custom-ers are excluded from the scheme. The incentive scheme does not use a dead band and does not require minimum improvements. The incentives (rewards, penalties, others) are not proportional to the difference between the actual performance level and the standard (or target). The amount of the incentives is funded by customers who pay for it through access tariffs.
The calculation/estimation method of the incentive scheme for DSOs is as follows:
Order ITC/3801/2008 of 26 December modified the formula defined by Royal Decree 222/2008 to calculate the quality incentives received by distribu-tion companies. The incentive for quality improve-ments is calculated for each distribution company. Each firm receives or pays yearly. Incorporated in its remuneration for distribution activity is an incen-tive to quality improvement, which is calculated for each distribution company according to the follow-ing formula:
Qin-1 = QTIEPI in-1 + QNIEPI in-1
Where:
QTIEPI in-1= PTIEPI × [Pot itz,n-1×(TIEPI itz - OBJECTIVO,n-1-TIEPI itz - REALIZADO,n-1)]
QNIEPI in-1= PNIEPI × [Cliitz,n-1×(NIEPI itz - OBJECTIVO,n-1-NIEPI itz - REALIZADO,n-1)]
QTIEPIin-1 = reward or penalty given to distribution company “i” in the year
“n”, associated to the compliance with the TIEPI target levels; QNIEPIi
n-1 = reward or penalty given to distribution company “i” in the year “n”, associated to the compliance with the NIEPI target levels; PTIEPI = unitary incentive associated to the TIEPI (100c€/Kwh);PNIEPI = unitary incentive associated to the NIEPI (150c€/client and inter-ruption);
Potitz,n-1 = installed power of distribution company “i” in zone type “tz” (ac-
cording to Order ECO 792/2002, described previously) in the year “n-1”; Cliitz,n-1 = number of customers of distribution company “i” in each zone type “tz” in the year “n-1”;TIEPI i
tz-OBJETIVO,n-1 y NIEPI itz-OBJETIVO,n-1 = target indicators for each zone “tz” in
force in the year “n-1”; and TIEPI i
tz-REALIZADO, n-1y NIEPI itz-REALIZADO, n-1= indicators of the degree of compli-
ance with the target values.
Target (Objetivo) indicators for each company are calculated as follows:
TIEPI itz-OBJECTIVO,n-1 = 1/3 *
n-4
k = n-6 [ TIEPI itz, k + TIEPI medianacionaltz, k
]2
NIEPI itz-OBJECTIVO,n-1 = 1/3 *
n-4
k = n-6 [ NIEPI itz, k + NIEPI medianacionaltz, k
]2
Values for Observed (Observado) indicators for each company are calculated as follows:
TIEPI itz-REALIZADO,n-1 = 1/3 * n-1
k = n-3TIEPI itz, k
NIEPI itz-REALIZADO,n-1 = 1/3 * n-1
k = n-3NIEPI itz, k
The quality incentives vary between -3% and 3% of the distribution company’s total remuneration.
The Swedish incentive scheme for the regulation period 2012 to 2015 uses rewards and penalties for DSOs. The indicators applied are SAIDI and SAIFI on the distribution level and ENS as well as inter-rupted power for regional networks (40-130 kV) and for transmission network (220-400 kV). The Swed-ish electrical power system consists of a national and regional transmission system in addition to local distribution networks. The national transmis-sion system includes mostly 220 kV and 400 kV AC lines as well as most of the interconnectors with neighbouring countries. The national grid is owned by Svenska Kraftnät. The regional networks typically consist of 20/40/70 kV to 130 kV lines. The main function of the regional networks is to transport electricity from the national transmission network to local distribution networks and directly to some larger electricity users. There are currently 5 region-al network operators in Sweden and approximately 170 local distribution networks.
The reference for all indicators is determined as the average level for the period ranging from 2006 to 2009 for both distribution and regional networks. For the TSO, the reference for all indicators is deter-mined by the average values for the period 2001 to
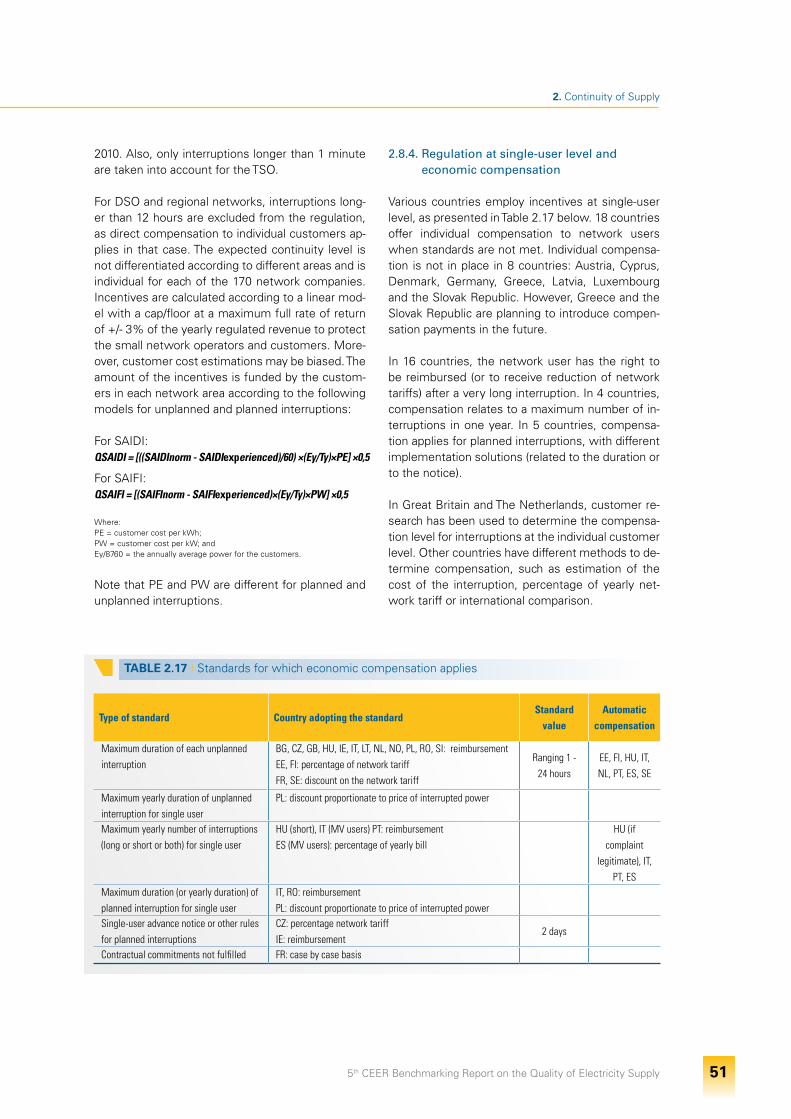
5th CEER Benchmarking Report on the Quality of Electricity Supply 51
2. Continuity of Supply
2010. Also, only interruptions longer than 1 minute are taken into account for the TSO.
For DSO and regional networks, interruptions long-er than 12 hours are excluded from the regulation, as direct compensation to individual customers ap-plies in that case. The expected continuity level is not differentiated according to different areas and is individual for each of the 170 network companies. Incentives are calculated according to a linear mod-el with a cap/floor at a maximum full rate of return of +/- 3% of the yearly regulated revenue to protect the small network operators and customers. More-over, customer cost estimations may be biased. The amount of the incentives is funded by the custom-ers in each network area according to the following models for unplanned and planned interruptions:
For SAIDI:QSAIDI = [((SAIDInorm - SAIDIexperienced)/60) ×(Ey/Ty)×PE] ×0,5
For SAIFI:QSAIFI = [(SAIFInorm - SAIFIexperienced)×(Ey/Ty)×PW] ×0,5
Where: PE = customer cost per kWh;PW = customer cost per kW; and Ey/8760 = the annually average power for the customers.
Note that PE and PW are different for planned and unplanned interruptions.
2.8.4. Regulation at single-user level and economic compensation
Various countries employ incentives at single-user level, as presented in Table 2.17 below. 18 countries offer individual compensation to network users when standards are not met. Individual compensa-tion is not in place in 8 countries: Austria, Cyprus, Denmark, Germany, Greece, Latvia, Luxembourg and the Slovak Republic. However, Greece and the Slovak Republic are planning to introduce compen-sation payments in the future.
In 16 countries, the network user has the right to be reimbursed (or to receive reduction of network tariffs) after a very long interruption. In 4 countries, compensation relates to a maximum number of in-terruptions in one year. In 5 countries, compensa-tion applies for planned interruptions, with different implementation solutions (related to the duration or to the notice).
In Great Britain and The Netherlands, customer re-search has been used to determine the compensa-tion level for interruptions at the individual customer level. Other countries have different methods to de-termine compensation, such as estimation of the cost of the interruption, percentage of yearly net-work tariff or international comparison.
TABLE 2.17 I Standards for which economic compensation applies
Type of standard Country adopting the standardStandard
valueAutomatic
compensation
Maximum duration of each unplanned interruption
BG, CZ, GB, HU, IE, IT, LT, NL, NO, PL, RO, SI: reimbursementEE, FI: percentage of network tariffFR, SE: discount on the network tariff
Ranging 1 -24 hours
EE, FI, HU, IT, NL, PT, ES, SE
Maximum yearly duration of unplanned interruption for single user
PL: discount proportionate to price of interrupted power
Maximum yearly number of interruptions (long or short or both) for single user
HU (short), IT (MV users) PT: reimbursementES (MV users): percentage of yearly bill
HU (if complaint
legitimate), IT, PT, ES
Maximum duration (or yearly duration) of planned interruption for single user
IT, RO: reimbursement PL: discount proportionate to price of interrupted power
Single-user advance notice or other rules for planned interruptions
CZ: percentage network tariffIE: reimbursement
2 days
Contractual commitments not fulfilled FR: case by case basis
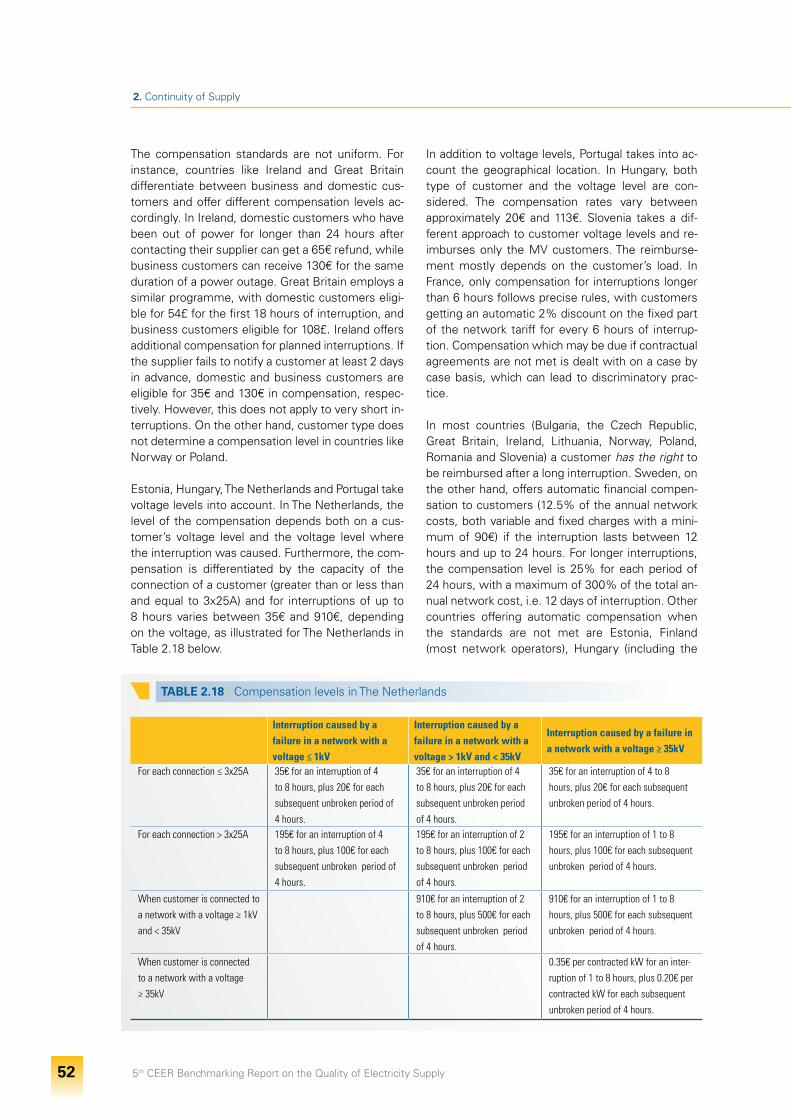
5th CEER Benchmarking Report on the Quality of Electricity Supply 52
2. Continuity of Supply
The compensation standards are not uniform. For instance, countries like Ireland and Great Britain differentiate between business and domestic cus-tomers and offer different compensation levels ac-cordingly. In Ireland, domestic customers who have been out of power for longer than 24 hours after contacting their supplier can get a 65€ refund, while business customers can receive 130€ for the same duration of a power outage. Great Britain employs a similar programme, with domestic customers eligi-ble for 54£ for the first 18 hours of interruption, and business customers eligible for 108£. Ireland offers additional compensation for planned interruptions. If the supplier fails to notify a customer at least 2 days in advance, domestic and business customers are eligible for 35€ and 130€ in compensation, respec-tively. However, this does not apply to very short in-terruptions. On the other hand, customer type does not determine a compensation level in countries like Norway or Poland.
Estonia, Hungary, The Netherlands and Portugal take voltage levels into account. In The Netherlands, the level of the compensation depends both on a cus-tomer’s voltage level and the voltage level where the interruption was caused. Furthermore, the com-pensation is differentiated by the capacity of the connection of a customer (greater than or less than and equal to 3x25A) and for interruptions of up to 8 hours varies between 35€ and 910€, depending on the voltage, as illustrated for The Netherlands in Table 2.18 below.
TABLE 2.18 I Compensation levels in The Netherlands
Interruption caused by a failure in a network with a voltage ≤ 1kV
Interruption caused by a failure in a network with a voltage > 1kV and < 35kV
Interruption caused by a failure in a network with a voltage ≥ 35kV
For each connection ≤ 3x25A 35€ for an interruption of 4 to 8 hours, plus 20€ for each subsequent unbroken period of 4 hours.
35€ for an interruption of 4 to 8 hours, plus 20€ for each subsequent unbroken period of 4 hours.
35€ for an interruption of 4 to 8 hours, plus 20€ for each subsequent unbroken period of 4 hours.
For each connection > 3x25A 195€ for an interruption of 4 to 8 hours, plus 100€ for each subsequent unbroken period of 4 hours.
195€ for an interruption of 2 to 8 hours, plus 100€ for each subsequent unbroken period of 4 hours.
195€ for an interruption of 1 to 8 hours, plus 100€ for each subsequent unbroken period of 4 hours.
When customer is connected to a network with a voltage ≥ 1kV and < 35kV
910€ for an interruption of 2 to 8 hours, plus 500€ for each subsequent unbroken period of 4 hours.
910€ for an interruption of 1 to 8 hours, plus 500€ for each subsequent unbroken period of 4 hours.
When customer is connected to a network with a voltage ≥ 35kV
0.35€ per contracted kW for an inter-ruption of 1 to 8 hours, plus 0.20€ per contracted kW for each subsequent unbroken period of 4 hours.
In addition to voltage levels, Portugal takes into ac-count the geographical location. In Hungary, both type of customer and the voltage level are con-sidered. The compensation rates vary between approximately 20€ and 113€. Slovenia takes a dif-ferent approach to customer voltage levels and re-imburses only the MV customers. The reimburse-ment mostly depends on the customer’s load. In France, only compensation for interruptions longer than 6 hours follows precise rules, with customers getting an automatic 2% discount on the fixed part of the network tariff for every 6 hours of interrup-tion. Compensation which may be due if contractual agreements are not met is dealt with on a case by case basis, which can lead to discriminatory prac-tice.
In most countries (Bulgaria, the Czech Republic, Great Britain, Ireland, Lithuania, Norway, Poland, Romania and Slovenia) a customer has the right to be reimbursed after a long interruption. Sweden, on the other hand, offers automatic financial compen-sation to customers (12.5% of the annual network costs, both variable and fixed charges with a mini-mum of 90€) if the interruption lasts between 12 hours and up to 24 hours. For longer interruptions, the compensation level is 25% for each period of 24 hours, with a maximum of 300% of the total an-nual network cost, i.e. 12 days of interruption. Other countries offering automatic compensation when the standards are not met are Estonia, Finland (most network operators), Hungary (including the
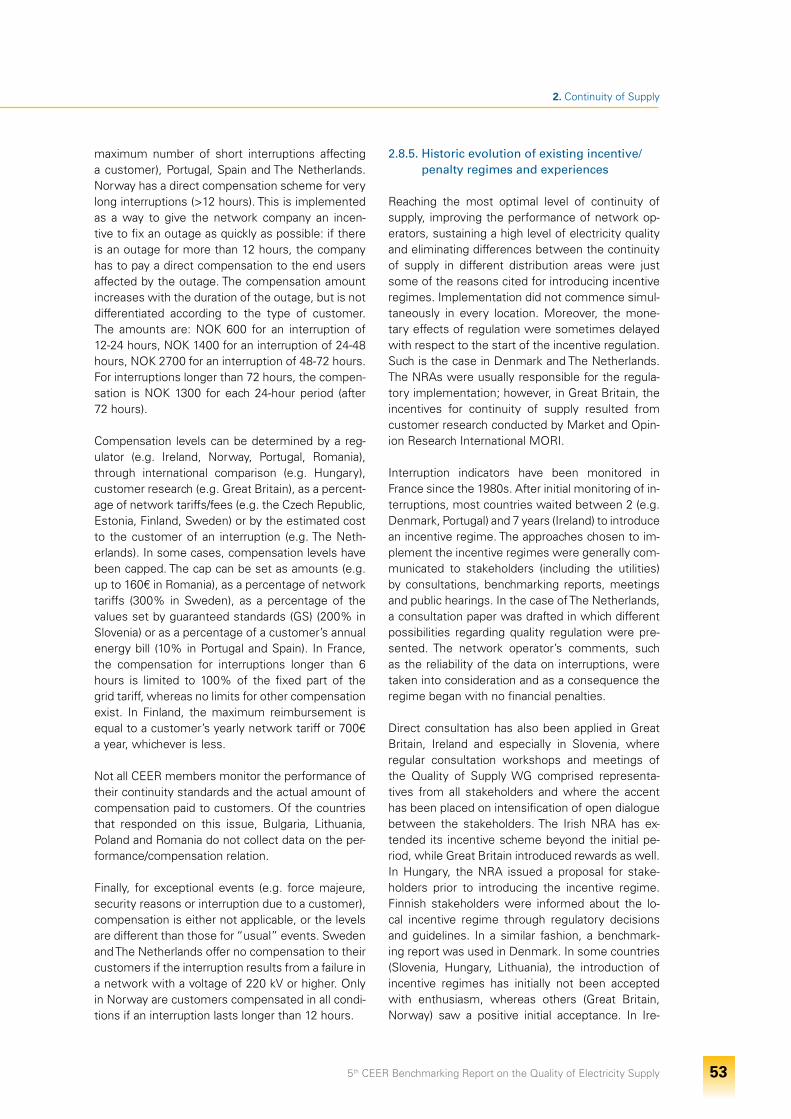
5th CEER Benchmarking Report on the Quality of Electricity Supply 53
2. Continuity of Supply
maximum number of short interruptions affecting a customer), Portugal, Spain and The Netherlands. Norway has a direct compensation scheme for very long interruptions (>12 hours). This is implemented as a way to give the network company an incen-tive to fix an outage as quickly as possible: if there is an outage for more than 12 hours, the company has to pay a direct compensation to the end users affected by the outage. The compensation amount increases with the duration of the outage, but is not differentiated according to the type of customer. The amounts are: NOK 600 for an interruption of 12-24 hours, NOK 1400 for an interruption of 24-48 hours, NOK 2700 for an interruption of 48-72 hours. For interruptions longer than 72 hours, the compen-sation is NOK 1300 for each 24-hour period (after 72 hours).
Compensation levels can be determined by a reg-ulator (e.g. Ireland, Norway, Portugal, Romania), through international comparison (e.g. Hungary), customer research (e.g. Great Britain), as a percent-age of network tariffs/fees (e.g. the Czech Republic, Estonia, Finland, Sweden) or by the estimated cost to the customer of an interruption (e.g. The Neth-erlands). In some cases, compensation levels have been capped. The cap can be set as amounts (e.g. up to 160€ in Romania), as a percentage of network tariffs (300% in Sweden), as a percentage of the values set by guaranteed standards (GS) (200% in Slovenia) or as a percentage of a customer’s annual energy bill (10% in Portugal and Spain). In France, the compensation for interruptions longer than 6 hours is limited to 100% of the fixed part of the grid tariff, whereas no limits for other compensation exist. In Finland, the maximum reimbursement is equal to a customer’s yearly network tariff or 700€ a year, whichever is less.
Not all CEER members monitor the performance of their continuity standards and the actual amount of compensation paid to customers. Of the countries that responded on this issue, Bulgaria, Lithuania, Poland and Romania do not collect data on the per-formance/compensation relation.
Finally, for exceptional events (e.g. force majeure, security reasons or interruption due to a customer), compensation is either not applicable, or the levels are different than those for “usual” events. Sweden and The Netherlands offer no compensation to their customers if the interruption results from a failure in a network with a voltage of 220 kV or higher. Only in Norway are customers compensated in all condi-tions if an interruption lasts longer than 12 hours.
2.8.5. Historic evolution of existing incentive/ penalty regimes and experiences
Reaching the most optimal level of continuity of supply, improving the performance of network op-erators, sustaining a high level of electricity quality and eliminating differences between the continuity of supply in different distribution areas were just some of the reasons cited for introducing incentive regimes. Implementation did not commence simul-taneously in every location. Moreover, the mone-tary effects of regulation were sometimes delayed with respect to the start of the incentive regulation. Such is the case in Denmark and The Netherlands. The NRAs were usually responsible for the regula-tory implementation; however, in Great Britain, the incentives for continuity of supply resulted from customer research conducted by Market and Opin-ion Research International MORI.
Interruption indicators have been monitored in France since the 1980s. After initial monitoring of in-terruptions, most countries waited between 2 (e.g. Denmark, Portugal) and 7 years (Ireland) to introduce an incentive regime. The approaches chosen to im-plement the incentive regimes were generally com-municated to stakeholders (including the utilities) by consultations, benchmarking reports, meetings and public hearings. In the case of The Netherlands, a consultation paper was drafted in which different possibilities regarding quality regulation were pre-sented. The network operator’s comments, such as the reliability of the data on interruptions, were taken into consideration and as a consequence the regime began with no financial penalties.
Direct consultation has also been applied in Great Britain, Ireland and especially in Slovenia, where regular consultation workshops and meetings of the Quality of Supply WG comprised representa-tives from all stakeholders and where the accent has been placed on intensification of open dialogue between the stakeholders. The Irish NRA has ex-tended its incentive scheme beyond the initial pe-riod, while Great Britain introduced rewards as well. In Hungary, the NRA issued a proposal for stake-holders prior to introducing the incentive regime. Finnish stakeholders were informed about the lo-cal incentive regime through regulatory decisions and guidelines. In a similar fashion, a benchmark-ing report was used in Denmark. In some countries (Slovenia, Hungary, Lithuania), the introduction of incentive regimes has initially not been accepted with enthusiasm, whereas others (Great Britain, Norway) saw a positive initial acceptance. In Ire-
5th CEER Benchmarking Report on the Quality of Electricity Supply 54
2. Continuity of Supply
land, it is interesting to note that compensation for failing to restore the power supply within a pre-determined time or failing to give advance notice about a planned interruption to a customer has ex-isted and was put in place by the DSO even before the establishment of the NRA.
The incentive regimes have already been changed in certain countries. In Great Britain, the incentive rates were amended to correspond to the values that customers attribute to interruptions. In Ireland, a dead-band for SML has been introduced for the 2011/2012 incentive period to combat the varying (and difficult-to-predict) SML output. The effect of a Q-Factor has been increased in The Netherlands by changing the indicators used to determine the Q-Factor and splitting the SAIDI into a combination of CAIDI and SAIFI. A graduation has been introduced in Denmark to make the penalty fairer. Norway has changed its regime several times. In Portugal, the regime has remained the same but the parameters have changed to become more demanding each year. The regime has not been changed in Hungary, but a long-term target for what should be achieved by yearly improvements has been set.
2.8.6. Expected developments in continuity of supply and quality incentives
Without a doubt, quality incentive regulation will change in the future. Many countries that have not yet implemented it will do so, while others will focus on improving their regulation. For example, preparations are underway for extra compensation for the maximum planned unavailability in France’s transmission network. This year, the Danish incen-tive will introduce data on duration of the interrup-tion at single-customer level. There are plans to in-troduce individual guaranteed continuity standards in Greece, the Slovak Republic and Slovenia. In Greece, compensation will be paid if the restora-tion time for a single interruption exceeds a limit or if the yearly number of interruptions greater than a specified duration exceeds a cetain limit. The Slovak Republic is planning to introduce automatic com-pensation payments while Slovenia and Spain are planning to extend their compensation scheme for the next regulatory period.
Of the countries with no overall incentive-based scheme, Austria and Romania are considering in-troducing a link between continuity and tariffs. Incentive regulation based on SAIDI and SAIFI in-dicators is planned by Greece and the Czech Re-
public, whereas Luxembourg is taking quality in-centives into consideration. Germany will introduce a reward-penalty mechanism in 2012 (the last two years of the first regulatory period), with the follow-ing details already available: SAIDI will be consid-ered on a LV level and ASIDI on the MV level. The mechanism will only be applied to DSOs with more than 30,000 customers. Rewards or penalties for each network operator will be calculated depend-ing on a difference between the network operator’s continuity level and a reference level of all network operators. The difference will be multiplied by a fixed price for quality per unit and by the number of customers from the network operator. The price for quality will be estimated by the NRA by using a macroeconomic approach. Both the operator’s con-tinuity level and the continuity reference level are calculated as a mean of continuity indicators for the past 3 years. The reference level takes structural dif-ferences (measured as load density) into account. Whether the quality improves or not will be left for the individual network operator to decide as the minimum improvements will not be determined by the NRA. The aim of the quality regulation system in Germany is to achieve a socio-economically ac-ceptable level of continuity of supply. There will be no tolerance/dead band, but a cap and floor system (set to a fixed percentage of allowed revenues) will be implemented for rewards and penalties. The in-centive scheme will act as an additive element of the revenue cap, which is modified depending on the performance of the network operator in terms of continuity of supply. Hence, the existing revenue-cap of the network operator increases or decreases with quality of supply. In general, the total amount of all rewards should be equal to the overall amount of penalties of all network operators.
2.9. Findings and Recommendations on Continuity of Supply
Finding #1Continuity of supply is monitored in all countries
Monitoring schemes for continuity of supply are in place in all 26 CEER countries who participated in the data collection survey for this report. Monitor-ing continuity of supply is an essential tool in the overall monitoring by an independent entity (such as a regulator) of a functioning electricity market. In addition, most countries in the ECRB (see dedi-cated ECRB Annex of this Benchmarking Report),
5th CEER Benchmarking Report on the Quality of Electricity Supply 55
2. Continuity of Supply
Belgium (who did not participate in the survey) and Switzerland, see dedicated inset in Section 2.4.5) monitor continuity of supply. Thus, continuity of supply is monitored in at least 35 European coun-tries.
Such monitoring usually covers long interruptions (more than three minutes) by differentiating un-planned (non-notified) and planned (notified) inter-ruptions. All 26 countries that provided feedback monitor unplanned interruptions and 24 of them monitor planned interruptions. Short interruptions are recorded separately by 12 of the 26 respond-ents and 4 countries record transient interruptions separately. Other countries record short and tran-sient interruptions without a separate definition, so they are included in long or short interruptions respectively. Slightly more than half of countries (17 out of 26) consider incidents at all voltage levels in the continuity of supply statistics.
Finding #2Continuity of supply indicators, procedures for data collection vary across countries
European countries use different indicators and dif-ferent weighting methods when evaluating inter-ruptions, in fact, a range of indicators is in use in different countries. The use of multiple indicators to quantify the continuity of supply enables the col-lection of more information and offers more pos-sibilities to observe trends. In the 4th Benchmarking Report, CEER presented precise definitions of con-tinuity indicators in order to ensure harmonisation between European countries. SAIDI and SAIFI are
the most commonly-used indices with weightings in most countries based on the number of users.
The analysis in Section 2.5.2 further reveals that the number of short interruptions per year (MAIFI and more frequently MAIFIE) is used in nearly all coun-tries that monitor short interruptions. However, as discussed in Section 2.6.3, the use of MAIFIE (ag-gregation rules) differs in the 5 countries which use a MAIFIE-like index.
The indices ENS and AIT are frequently used to monitor continuity of supply in transmission net-works. Section 2.6.5 reported ENS values for 14 countries.
Most of the countries collect some information on the cause of interruptions. If collected in detail, this provides NRAs with important information on the grid and can be used as an essential part of the im-provement of continuity of the supply by the net-work operators. Different designations and mean-ings of exceptional events are used in the CEER Member Countries9.Expand the monitoring of continuity of
supply
Incidents at all voltage levels should be included in interruption statistics. As long as the duration of those interruptions and the numbers of affect-ed network users are estimated, the additional costs are limited. A decision at national level is needed on automatic methods for determining the duration and number of affected users for in-cidents at LV. The costs of such a scheme should be considered in that decision.
It is recommended that the measurement of in-terruptions should cover all network levels and all interruption durations.
Recommendation #1
Harmonise continuity of supply indicators and data collection procedures
CEER recommends standardisation of data collecting procedures for NRAs, with a single scheme for continuity of supply indicators, which must be tied to:
• the duration and frequency of long interrup-tions: SAIDI and SAIFI;
• the frequency of short interruptions: MAIFIE; and
• the ENS due to interruptions in the transmis-sion networks: ENS.
Moreover, countries should be encouraged to use the same weighting methods for indices with the same term. CEER recommends the har-monisation of continuity of supply methods by NRAs through the usage of common definitions for indicators and common rules for weighting. Common rules for aggregation should be investi-gated and pursued by CEER, before more coun-tries begin to use short interruption indices.
Lastly, CEER confirms its recommendation that any publication of continuity of supply data in-clude information on the interruptions that are excluded and included.
Recommendation #2
9. See Section 2.7 of the 4th Benchmarking Report and Annexes of that report.
5th CEER Benchmarking Report on the Quality of Electricity Supply 56
2. Continuity of Supply
Finding #3Continuity of supply improvements tend to become stable
The data presented in Section 2.6 shows different tendencies in continuity of supply across CEER countries.
The difference in the yearly cumulative duration of interruptions (excluding exceptional events) across the countries tends to diminish over the years. At least 5 countries which were seeing a high number of minutes lost around the year 2000 now have du-ration figures similar to those of the other countries.
More generally, around half of the countries with data covering at least three years (9 out of 15) show a decreasing duration of interruptions. In the other 6 countries (characterised by good or even very good continuity level since the beginning), the duration is almost on the same value.
The number of interruptions across the countries has smaller variations when compared to the changes in the duration of the interruptions. In most countries, the number has the same long-term ten-dency, but it is interesting to observe that in at least 4 countries there is a decoupled trend, which re-flects a shorter or a longer average duration of the individual interruptions.
7 countries reported data for short interruptions covering at least 4 years. From this limited sample, an increased stability of the indicator over the years can be observed. Still, it is worth noting that half of the countries have a decreasing number of short interruptions.
Whereas the data for distribution systems are char-acterised by a substantial stability in the figures over the years, the interruption indices for transmis-sion systems are clearly affected by more frequent yearly spikes, which are probably due to the large effects of a limited number of events.
Finding #4Continuity of supply varies depending on the population density and the voltage level
5 countries provided data for continuity of supply linked to population density (urban/suburban/rural areas, see Section 2.7.1). In each of these 5 coun-tries, continuity of supply is much better in urban areas than in rural areas.
About 70% of SAIDI and about 78% of SAIFI are due to incidents at MV, based on data obtained from, respectively, 6 and 5 countries (see Section 2.7.2). For SAIDI, the spread between the countries was small, between 61% and 79%. For SAIFI, the spread between the countries was between 59% and 85%. For the contributions from incidents at other voltage levels, the percentages vary strongly between these countries.
Finding #5 Continuity of supply levels are affected by network characteristics
Section 2.7.5 analyses the correlation between the percentage of underground cables and continuity of supply in several European countries. It shows a significant correlation between a high percent-age of underground cables and high continuity of supply. This correlation tends to confirm existing observations and statements on the benefits of undergrounding for continuity of supply. However, many indicators are actually correlated all together: the population density, the resources available for networks, the continuity of supply and the many parameters that impact it, such as the percentage of underground cables, the redundancy of the net-works or the quality of the preventive maintenance. As a consequence, it is not possible to assess pre-cisely the specific impact of the percentage of un-derground cables on continuity of supply.
Investigate continuity of supply trends for a periodic review of regulation.
CEER recommends that the competent regula-tory authorities analyse trends in continuity of supply and (when applicable) the economic re-sults of regulation. Periodic evaluation and revi-sion of the continuity regulation are suggested, with enlargements and adaptations over time.
Recommendation #3
Assess disaggregated continuity data in or-der to identify priorities
CEER recommends that NRAs and network op-erators collect and assess disaggregated inter-ruption data, for example by voltage level and by cause, in order to better identify priorities for regulation and network interventions.
Recommendation #4
5th CEER Benchmarking Report on the Quality of Electricity Supply 57
2. Continuity of Supply
Finding #6Incentive schemes are used to regulate continuity of supply in distribution and transmission networks
General reward or penalty schemes or incentives to optimise the continuity of supply levels (on a sys-tem level) are applied in 15 out of 26 countries.
Penalties are usually coupled with rewards and are always applied to distribution networks. 11 coun-tries adopt rewards and/or penalties for transmis-sion networks as well. 6 countries (Austria, the Czech Republic, Germany, Greece, Luxembourg and Romania) which have not yet implemented a continuity of supply rewards/penalties scheme plan to introduce such a regime. Whereas other coun-tries focus on combining penalties and rewards, Denmark and Hungary have regimes that focus ex-clusively on penalties.
Minimum improvements for DSOs are sometimes required. This is the case in Bulgaria, France, Great Britain, Hungary, Ireland, Italy, Portugal and Slovenia. Additionally, a tolerance band (the so-called dead-band) where no reward or penalty exists is used in Finland, Hungary, Ireland, Portugal and Slovenia.
The data obtained by cost estimation studies is frequently used to set incentive schemes (rewards/penalties and compensation levels) for network operators.
Finding #7Incentive schemes for individual continuity levels are used in many countries and have different formulations
Compensation schemes at single-user level are ap-plied in 18 countries and are planned in 2 others. In 16 countries, the network user has the right to be reimbursed (or to receive a reduction in network tariffs) after a very long interruption, varying across the countries from 1 hour for HV users to 24 hours for domestic users. In 4 countries, compensation is associated to the maximum number of interrup-tions in one year. In 5 countries, compensation is linked to planned interruptions as well.
The schemes, however, are not uniform, as re-ported in Section 2.8.4. For example, some coun-tries differentiate between business and domestic network users while others differentiate between the voltage levels. In some cases, the compensa-tion levels depend both on the connection voltage level and the voltage level where the incident that caused the interruption took place. In some cases, user location and load are also taken into account.
Sometimes the reimbursements are automatic (Es-tonia, Finland, Hungary, Italy, Portugal, Spain, Swe-den and The Netherlands). Methods to determine compensation levels vary from a percentage of network tariffs to an estimation of the costs of the interruption based on customer surveys.
Promote cost-benefit analysis to improve the efficiency of expenditure on networks
CEER recommends the use of cost-benefit anal-yses to compare and select the various actions (e.g. undergrounding) aimed at improving conti-nuity of supply. The results of such cost-benefit analyses should be shared between countries.
Recommendation #5
Implement an incentive scheme for maintain-ing or improving general continuity levels
CEER recommends that NRAs implement ad-equate incentive schemes in order to maintain continuity of supply levels or improve them, if economically viable on both the distribution and the transmission levels.
CEER confirms its past recommendation that the results from cost-estimation studies on cus-tomer costs due to electricity interruptions are of key importance in order to be able to set proper incentives for continuity of supply.
Recommendation #6
5th CEER Benchmarking Report on the Quality of Electricity Supply 58
2. Continuity of Supply
• publication of the report to promote discussion of quality regulation amongst EU and non-EU regu-lators;
• enlargement of the membership of the dedicated CEER Working Group to include members from other countries; and
• submission of the findings for discussion to a suitable international conference on regulatory is-sues.
A significant enlargement in membership and par-ticipation is observed in the Benchmarking Reports. The publication of the benchmarking reports with a minimum common structure through all its editions has reduced the cost of obtaining information about regulation.
Implement compensation payments for net-work users affected by very long interruptions
CEER recommends that the monitoring of inter-ruptions is extended to a customer survey at sin-gle-user level to provide the basis for individual compensation schemes.
CEER recommends the standardisation of pay-ments among the European countries. However, compensation payments should depend on the respective connection level.
Recommendation #7
Exchange information on continuity of supply and its regulation
CEER recommends that NRAs continue ex-changing best practices on regulating electrical network industries, as done in the benchmarking reports.
Recommendation #8
Finding #8More countries participate in benchmarking continuity
The series of CEER Benchmarking Reports on Qual-ity of Electricity Supply have demonstrated the im-portance of a continued exchange of information on quality indicators, actual quality levels, standards, regulatory mechanisms and strategies.
The basic recommendations of the 1st Benchmark-ing Report can today be considered to have been achieved completely:

5th CEER Benchmarking Report on the Quality of Electricity Supply 60
3.
Voltage Quality 3.1 What is Voltage Quality and why is it important to regulate it?
Voltage quality (VQ) covers a wide range of voltage disturbances and deviations in voltage magnitude or waveform from the optimum values. In this bench-marking report, voltage quality is used to refer to all disturbances (excluding interruptions which are cov-ered by Chapter 2). Examples of voltage disturbanc-es are supply voltage variations, harmonic voltage and voltage dips. We do not include details of fre-quency variations in this report; these are deemed to be rather a system operation issue.
Voltage quality is becoming an increasingly impor-tant issue in many countries due to, among other things, increases over the last 20 to 30 years in the susceptibility of end-user equipment and indus-trial installations to voltage disturbances, and the increased emission of disturbances by end-user equipment. The increased susceptibility and emis-sion levels are causing an increase in costs for network users as a result of voltage disturbances. This could result in an increase in network tariffs in order to mitigate these disturbances. Future de-velopments, like increasing amounts of distributed generation and the increased use of energy-effi-cient equipment, could result in further increases in emissions.
Voltage quality is by far the most technically-com-plex part of quality of electricity supply. Measure-ment issues, the choice of appropriate indicators, and the setting of limits require detailed monitoring of every single disturbance. The disturbance level and the consequences of high disturbance levels are further determined by multiple stakeholders. This often makes it difficult to lay the responsibil-ity with one particular stakeholder, whether it’s the network operator or one of the connected end-us-ers. Responsibility sharing has been identified by CEER as an important principle for voltage quality regulation.
At European level, the “3rd Package” Directive 2009/72/EC [27], which had to be transposed by Member States by 3 March 2011, states that the regulatory authority shall have the duty of setting or approving standards and requirements for qual-ity of supply or contributing thereto together with other competent authorities (Article 37(1h)). This provision is expected to result in a further increase in the involvement of national regulators in voltage quality issues, which thus far have not been fully addressed by national regulators in every European country.
5th CEER Benchmarking Report on the Quality of Electricity Supply 61
The European standard 10 EN 50160 [22] gives an overview of all voltage quality disturbances and sets limits or indicative values for many of them. This document has become an important basis for voltage quality regulation throughout Europe. A fur-ther important contribution comes in the form of the standard on power-quality (PQ) measurements, EN 61000-4-30 [31], which has resulted in common methods for voltage quality monitoring.
The ultimate aim of voltage quality regulation is to ensure that the functioning of equipment is not im-pacted by voltage disturbances coming from the network. Such malfunctioning can never be com-pletely ruled out, but the probability of it occurring is kept low in Europe through a set of standards on electromagnetic compatibility issued by IEC (International Electrotechnical Commission) and taken over by CENELEC (European Committee for Electrotechnical Standardization) as European har-monised standards, together with the European EMC Directive [26]. These documents regulate the emission of disturbances by individual devices as well as by installations and regulate the immunity of individual devices to any disturbances. Although the spread of disturbances across the electricity network is taken into consideration when setting the various limits, additional regulation of network operators in terms of voltage quality is necessary. This concerns, among other things, the setting of maximum levels of voltage disturbances at the point of delivery between the network operator and its customers, and responsibility sharing between the different stakeholders, for instance in terms of emission limits for installations. Any voltage quality regulation must consider both the costs for custom-ers due to equipment malfunctioning or damage and any direct or indirect increase in tariffs due to improvements made in the grid.
Whereas interruptions affect all network users, voltage disturbances do not affect all users in the same way. Also, the impact of different types of dis-turbances can be completely different for different individual users. Whereas there is a need for harmo-nisation as regards limits on voltage disturbances (as end-user equipment is the same throughout Europe), the emphasis in regulation is likely to be different between European countries, due to the aforementioned reasons.
3.2 Main Conclusions from Past Activities of the European Energy Regulators on Voltage Quality
The 1st and 2nd Benchmarking Reports on Quality of Electricity Supply [1] [2] devoted their attention to continuity of supply and commercial quality. CEER began to address voltage quality in 2005, when pre-paring the 3rd Benchmarking Report on Quality of Electricity Supply [3]. CEER’s activities in this area deepened with papers on ‘Towards Voltage Qual-ity Regulation in Europe’ [11] and other reports and events, which are summarised in Table 3.1.
In 2006, CEER also promoted cooperation on volt-age quality with the European standardisation or-ganisation CENELEC, mainly in order to revise the European standard EN 50160. The outcome of this cooperation is discussed in Section 3.4.1, together with the ERGEG (European Regulators Group for Electricity and Gas) conclusions following its public consultation on regulation of voltage quality. Eure-lectric (sector association of the electricity industry in Europe) was one of the most active parties in the EN 50160 revision process, as witnessed by the CEER/Eurelectric round tables at CIRED 2009 and CIRED 2011 (International Conference on Electricity Distribution).
The 3rd Benchmarking Report on Quality of Electric-ity Supply concluded that:
• A good knowledge of actual voltage quality levels is a preliminary step towards any kind of regula-tory intervention;
• A process was (in 2005) on-going in many coun-tries for voltage quality monitoring (VQM);
• Network users were generally entitled to get a verification of actual voltage quality levels at their point of connection; and
• In some countries, network users and distribution operators had the possibility to agree upon con-tractual quality levels and related payments.
The 3rd Benchmarking Report recommended:
• The monitoring and publication of most critical voltage quality performances; and
• Further research on power quality contracts.
10. In this chapter the term ‘standard’ refers to a technical specification for repeated or continuous application, with which compliance is not compulsory, and which can be an international standard, a European standard, a harmonised standard on the basis of a request by the European Commission or a national standard. The rules for individual voltage parameters are usually referred to as ‘limits’ or ‘requirements’ when they relate to voltage quality (whereas they are normally called ‘standards’ when relating to continuity of supply or commercial quality).
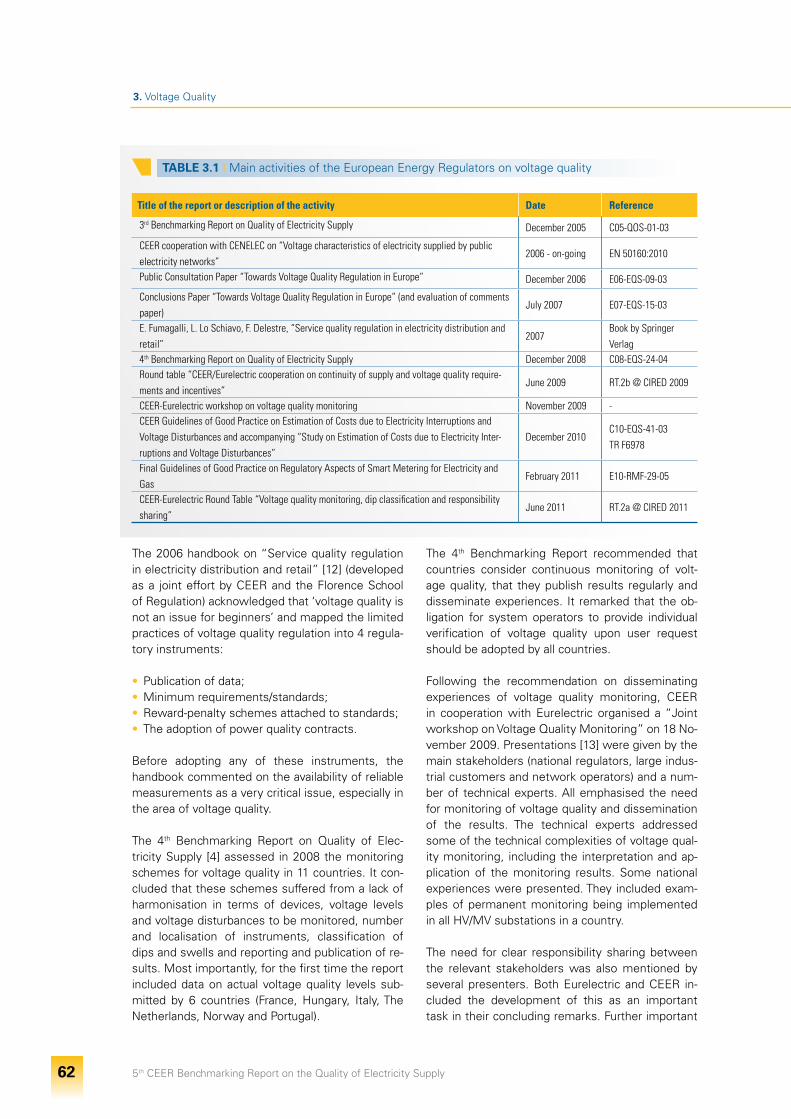
5th CEER Benchmarking Report on the Quality of Electricity Supply 62
3. Voltage Quality
TABLE 3.1 I Main activities of the European Energy Regulators on voltage quality
Title of the report or description of the activity Date Reference
3rd Benchmarking Report on Quality of Electricity Supply December 2005 C05-QOS-01-03
CEER cooperation with CENELEC on “Voltage characteristics of electricity supplied by public electricity networks”
2006 - on-going EN 50160:2010
Public Consultation Paper “Towards Voltage Quality Regulation in Europe” December 2006 E06-EQS-09-03
Conclusions Paper “Towards Voltage Quality Regulation in Europe” (and evaluation of comments paper)
July 2007 E07-EQS-15-03
E. Fumagalli, L. Lo Schiavo, F. Delestre, “Service quality regulation in electricity distribution and retail”
2007Book by Springer Verlag
4th Benchmarking Report on Quality of Electricity Supply December 2008 C08-EQS-24-04Round table “CEER/Eurelectric cooperation on continuity of supply and voltage quality require-ments and incentives”
June 2009 RT.2b @ CIRED 2009
CEER-Eurelectric workshop on voltage quality monitoring November 2009 -CEER Guidelines of Good Practice on Estimation of Costs due to Electricity Interruptions and Voltage Disturbances and accompanying “Study on Estimation of Costs due to Electricity Inter-ruptions and Voltage Disturbances”
December 2010C10-EQS-41-03TR F6978
Final Guidelines of Good Practice on Regulatory Aspects of Smart Metering for Electricity and Gas
February 2011 E10-RMF-29-05
CEER-Eurelectric Round Table “Voltage quality monitoring, dip classification and responsibility sharing”
June 2011 RT.2a @ CIRED 2011
The 2006 handbook on “Service quality regulation in electricity distribution and retail” [12] (developed as a joint effort by CEER and the Florence School of Regulation) acknowledged that ‘voltage quality is not an issue for beginners’ and mapped the limited practices of voltage quality regulation into 4 regula-tory instruments:
• Publication of data; • Minimum requirements/standards; • Reward-penalty schemes attached to standards; • The adoption of power quality contracts.
Before adopting any of these instruments, the handbook commented on the availability of reliable measurements as a very critical issue, especially in the area of voltage quality.
The 4th Benchmarking Report on Quality of Elec-tricity Supply [4] assessed in 2008 the monitoring schemes for voltage quality in 11 countries. It con-cluded that these schemes suffered from a lack of harmonisation in terms of devices, voltage levels and voltage disturbances to be monitored, number and localisation of instruments, classification of dips and swells and reporting and publication of re-sults. Most importantly, for the first time the report included data on actual voltage quality levels sub-mitted by 6 countries (France, Hungary, Italy, The Netherlands, Norway and Portugal).
The 4th Benchmarking Report recommended that countries consider continuous monitoring of volt-age quality, that they publish results regularly and disseminate experiences. It remarked that the ob-ligation for system operators to provide individual verification of voltage quality upon user request should be adopted by all countries.
Following the recommendation on disseminating experiences of voltage quality monitoring, CEER in cooperation with Eurelectric organised a “Joint workshop on Voltage Quality Monitoring” on 18 No-vember 2009. Presentations [13] were given by the main stakeholders (national regulators, large indus-trial customers and network operators) and a num-ber of technical experts. All emphasised the need for monitoring of voltage quality and dissemination of the results. The technical experts addressed some of the technical complexities of voltage qual-ity monitoring, including the interpretation and ap-plication of the monitoring results. Some national experiences were presented. They included exam-ples of permanent monitoring being implemented in all HV/MV substations in a country.
The need for clear responsibility sharing between the relevant stakeholders was also mentioned by several presenters. Both Eurelectric and CEER in-cluded the development of this as an important task in their concluding remarks. Further important
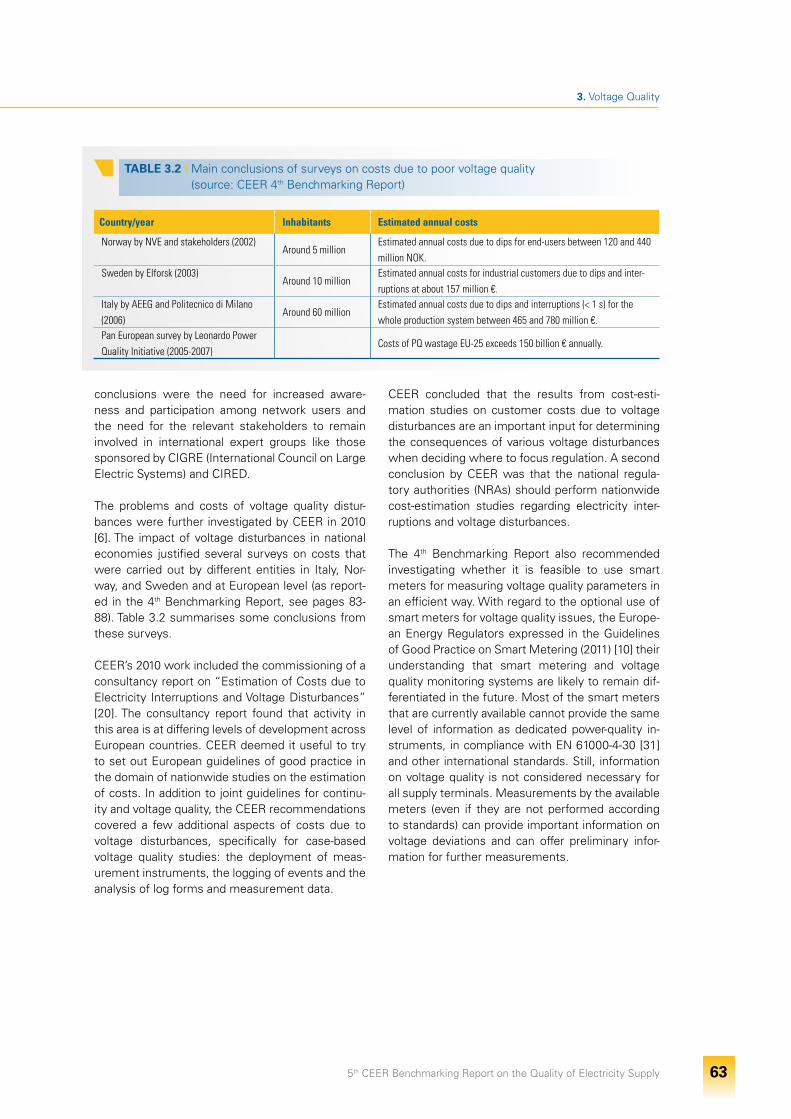
5th CEER Benchmarking Report on the Quality of Electricity Supply 63
3. Voltage Quality
conclusions were the need for increased aware-ness and participation among network users and the need for the relevant stakeholders to remain involved in international expert groups like those sponsored by CIGRE (International Council on Large Electric Systems) and CIRED.
The problems and costs of voltage quality distur-bances were further investigated by CEER in 2010 [6]. The impact of voltage disturbances in national economies justified several surveys on costs that were carried out by different entities in Italy, Nor-way, and Sweden and at European level (as report-ed in the 4th Benchmarking Report, see pages 83-88). Table 3.2 summarises some conclusions from these surveys.
CEER’s 2010 work included the commissioning of a consultancy report on “Estimation of Costs due to Electricity Interruptions and Voltage Disturbances” [20]. The consultancy report found that activity in this area is at differing levels of development across European countries. CEER deemed it useful to try to set out European guidelines of good practice in the domain of nationwide studies on the estimation of costs. In addition to joint guidelines for continu-ity and voltage quality, the CEER recommendations covered a few additional aspects of costs due to voltage disturbances, specifically for case-based voltage quality studies: the deployment of meas-urement instruments, the logging of events and the analysis of log forms and measurement data.
TABLE 3.2 I Main conclusions of surveys on costs due to poor voltage quality (source: CEER 4th Benchmarking Report)
Country/year Inhabitants Estimated annual costs
Norway by NVE and stakeholders (2002)Around 5 million
Estimated annual costs due to dips for end-users between 120 and 440 million NOK.
Sweden by Elforsk (2003)Around 10 million
Estimated annual costs for industrial customers due to dips and inter-ruptions at about 157 million €.
Italy by AEEG and Politecnico di Milano (2006)
Around 60 millionEstimated annual costs due to dips and interruptions (< 1 s) for the whole production system between 465 and 780 million €.
Pan European survey by Leonardo Power Quality Initiative (2005-2007)
Costs of PQ wastage EU-25 exceeds 150 billion € annually.
CEER concluded that the results from cost-esti-mation studies on customer costs due to voltage disturbances are an important input for determining the consequences of various voltage disturbances when deciding where to focus regulation. A second conclusion by CEER was that the national regula-tory authorities (NRAs) should perform nationwide cost-estimation studies regarding electricity inter-ruptions and voltage disturbances.
The 4th Benchmarking Report also recommended investigating whether it is feasible to use smart meters for measuring voltage quality parameters in an efficient way. With regard to the optional use of smart meters for voltage quality issues, the Europe-an Energy Regulators expressed in the Guidelines of Good Practice on Smart Metering (2011) [10] their understanding that smart metering and voltage quality monitoring systems are likely to remain dif-ferentiated in the future. Most of the smart meters that are currently available cannot provide the same level of information as dedicated power-quality in-struments, in compliance with EN 61000-4-30 [31] and other international standards. Still, information on voltage quality is not considered necessary for all supply terminals. Measurements by the available meters (even if they are not performed according to standards) can provide important information on voltage deviations and can offer preliminary infor-mation for further measurements.
5th CEER Benchmarking Report on the Quality of Electricity Supply 64
3. Voltage Quality
3.3 Structure of the Chapter on Voltage Quality
This chapter first describes standards and require-ments for voltage quality. Standards and require-ments encompass standardisation activities at European level and national legislation and regula-tions. It summarises the outcome of the coopera-tion process between CEER and CENELEC, which led to important improvements in the EN 50160 standard on voltage characteristics in Europe. The chapter also contains a comparison of voltage qual-ity regulations, including national rules which differ from EN 50160, which ensure individual verification of voltage quality, provide individual information about voltage quality and define emission limits by customer installations.
Next, the chapter provides details on the monitoring schemes applied in the CEER countries and data on actual voltage quality levels submitted from those countries where such data is available, including in-formation on the publication of voltage quality data.
The chapter is based on input from 25 CEER coun-tries: Austria, Bulgaria, Cyprus, the Czech Repub-lic, Denmark, Estonia, Finland, France, Germany, Greece, Hungary, Ireland, Italy, Latvia, Lithuania, Luxembourg, The Netherlands, Norway, Poland, Portugal, Romania, the Slovak Republic, Slovenia, Spain and Sweden.
3.4 Voltage Quality Legislation, Regulation and Standardisation
3.4.1 Improvements to the new version of EN 50160
The European Energy Regulators listed 6 recom-mendations for the improvement of European standard EN 50160 during the consultation process carried out in 2006-2007:
• Improve definitions and measurement rules;• Enlarge the scope of EN 50160 to high voltage
(HV11) and extra-high voltage (EHV) systems;• Adopt new limits for voltage variations, avoiding
“95%-of-time” clause and long time intervals for averaging measured values;
• Avoid ambiguous indicative values for voltage events and introduce a classification of severity of voltage dips and swells;
• Introduce limits for voltage events according to network characteristics; and
• Consider the duties and rights of all parties in-volved and propose a general framework to share responsibility between network companies, equipment manufacturers and users.
The CEER conclusions paper on “Towards Voltage Quality Regulation in Europe” [11] underlines that EN 50160 can be used as a basis for national volt-age quality regulations only if certain improvements in the standard are made. To this extent, CEER of-fered its cooperation on the work necessary for re-vising standard EN 50160. CEER is currently also cooperating with CENELEC in the drafting of a new edition of TR 50422, the application guide to EN 50160 which was published in 2003 [32].
CEER fully shares the conclusion of the 19th Electric-ity Regulatory Forum (Florence Forum, December 2010) that the standardisation process “should take full account of its regulatory fast paced develop-ment”. This warning to the European Standardisa-tion Organisations to speed-up the standardisation process was confirmed by the European Commis-sion in its Communication on Standardisation 1 June 2011 [28]. Unfortunately, the current experi-ence of CEER cooperation with CENELEC regarding this fundamental element of the network regulation framework (the voltage quality standards) suggests that results are not easily achievable at a fast pace.
After 5 years of cooperation between CEER and CENELEC, the positive elements in the new stand-ard EN 50160:2010 [22] include:
• An improved structure, dividing continuous phe-nomena and voltage events;
• Improved (more unique) definitions for voltage dips and swells;
• Standardised classification tables for voltage dips and swells;
• The applicability of the standard up to and in-cluding 150 kV (although requirements are much weaker than for MV and LV);
• Improved limits for supply voltage variations in the MV network;
• The removal of a note weakening the limits of supply voltage variations, when customers are being supplied “in remote areas with long lines or not connected to a large interconnected net-work”; and
• The removal of ambiguous indicative levels for voltage events (e.g. “the expected number of voltage dips in a year may be […] up to one thou-sand”) from the normative part of the standard.
11. See Section 2.4.3. for the CEER classification of voltage levels.
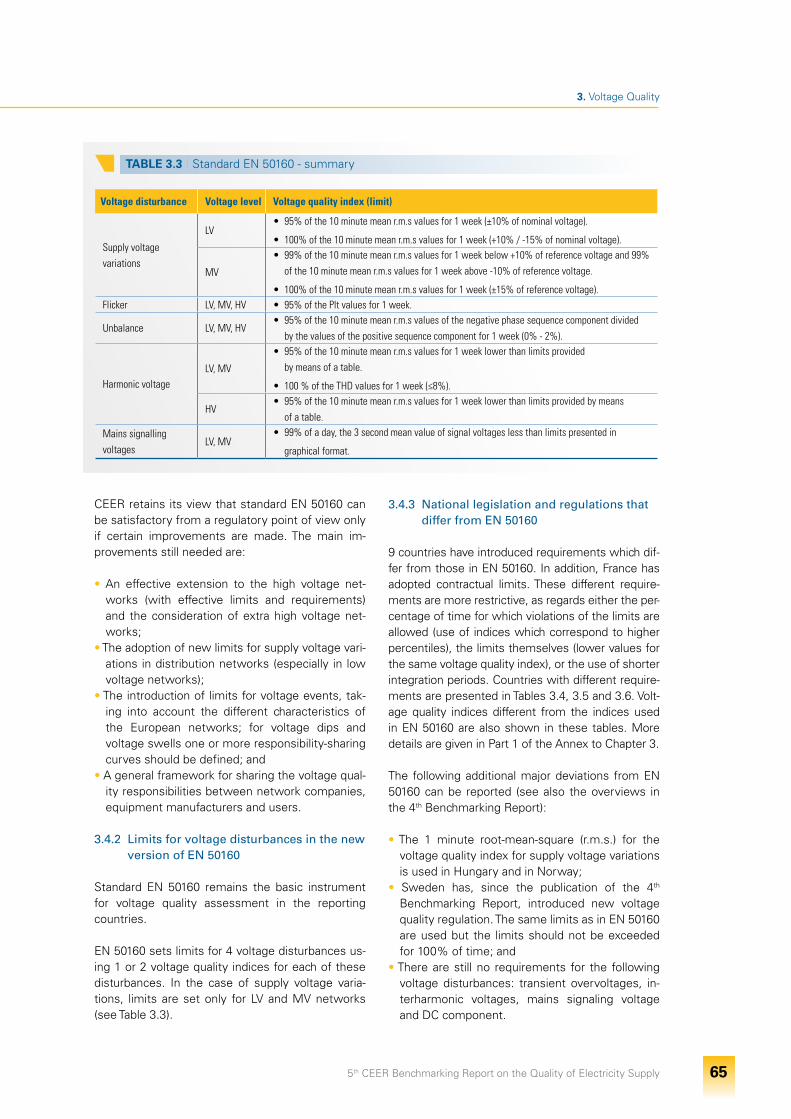
5th CEER Benchmarking Report on the Quality of Electricity Supply 65
3. Voltage Quality
CEER retains its view that standard EN 50160 can be satisfactory from a regulatory point of view only if certain improvements are made. The main im-provements still needed are:
• An effective extension to the high voltage net-works (with effective limits and requirements) and the consideration of extra high voltage net-works;
• The adoption of new limits for supply voltage vari-ations in distribution networks (especially in low voltage networks);
• The introduction of limits for voltage events, tak-ing into account the different characteristics of the European networks; for voltage dips and voltage swells one or more responsibility-sharing curves should be defined; and
• A general framework for sharing the voltage qual-ity responsibilities between network companies, equipment manufacturers and users.
3.4.2 Limits for voltage disturbances in the new version of EN 50160
Standard EN 50160 remains the basic instrument for voltage quality assessment in the reporting countries.
EN 50160 sets limits for 4 voltage disturbances us-ing 1 or 2 voltage quality indices for each of these disturbances. In the case of supply voltage varia-tions, limits are set only for LV and MV networks (see Table 3.3).
TABLE 3.3 I Standard EN 50160 - summary
Voltage disturbance Voltage level Voltage quality index (limit)
Supply voltagevariations
LV• 95% of the 10 minute mean r.m.s values for 1 week (±10% of nominal voltage).
• 100% of the 10 minute mean r.m.s values for 1 week (+10% / -15% of nominal voltage).
MV
• 99% of the 10 minute mean r.m.s values for 1 week below +10% of reference voltage and 99% of the 10 minute mean r.m.s values for 1 week above -10% of reference voltage.
• 100% of the 10 minute mean r.m.s values for 1 week (±15% of reference voltage).Flicker LV, MV, HV • 95% of the Plt values for 1 week.
Unbalance LV, MV, HV• 95% of the 10 minute mean r.m.s values of the negative phase sequence component divided
by the values of the positive sequence component for 1 week (0% - 2%).
Harmonic voltage LV, MV
• 95% of the 10 minute mean r.m.s values for 1 week lower than limits provided by means of a table.
• 100 % of the THD values for 1 week (≤8%).
HV• 95% of the 10 minute mean r.m.s values for 1 week lower than limits provided by means
of a table.
Mains signalling voltages
LV, MV• 99% of a day, the 3 second mean value of signal voltages less than limits presented in
graphical format.
3.4.3 National legislation and regulations that differ from EN 50160
9 countries have introduced requirements which dif-fer from those in EN 50160. In addition, France has adopted contractual limits. These different require-ments are more restrictive, as regards either the per-centage of time for which violations of the limits are allowed (use of indices which correspond to higher percentiles), the limits themselves (lower values for the same voltage quality index), or the use of shorter integration periods. Countries with different require-ments are presented in Tables 3.4, 3.5 and 3.6. Volt-age quality indices different from the indices used in EN 50160 are also shown in these tables. More details are given in Part 1 of the Annex to Chapter 3.
The following additional major deviations from EN 50160 can be reported (see also the overviews in the 4th Benchmarking Report):
• The 1 minute root-mean-square (r.m.s.) for the voltage quality index for supply voltage variations is used in Hungary and in Norway;
• Sweden has, since the publication of the 4th Benchmarking Report, introduced new voltage quality regulation. The same limits as in EN 50160 are used but the limits should not be exceeded for 100% of time; and
• There are still no requirements for the following voltage disturbances: transient overvoltages, in-terharmonic voltages, mains signaling voltage and DC component.
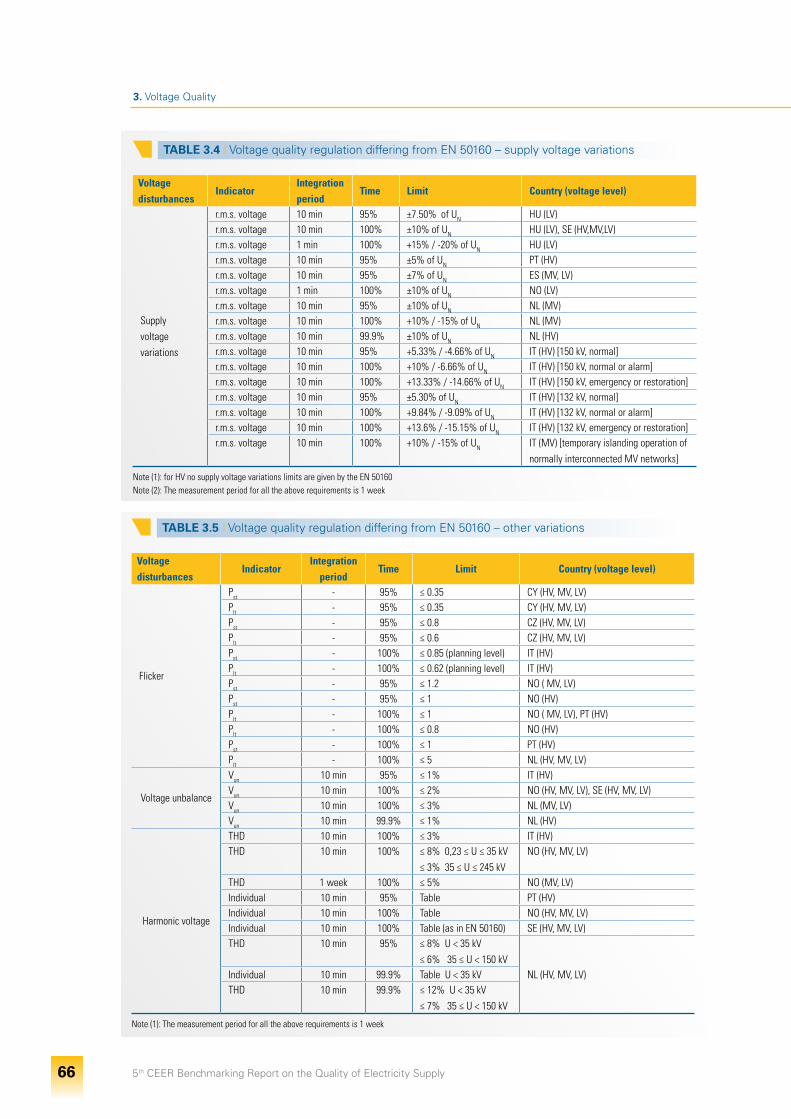
5th CEER Benchmarking Report on the Quality of Electricity Supply 66
3. Voltage Quality
TABLE 3.4 I Voltage quality regulation differing from EN 50160 – supply voltage variations
Voltagedisturbances
Indicator Integration period
Time Limit Country (voltage level)
Supplyvoltagevariations
r.m.s. voltage 10 min 95% ±7.50% of UN HU (LV)r.m.s. voltage 10 min 100% ±10% of UN HU (LV), SE (HV,MV,LV)r.m.s. voltage 1 min 100% +15% / -20% of UN HU (LV)r.m.s. voltage 10 min 95% ±5% of UN PT (HV)r.m.s. voltage 10 min 95% ±7% of UN ES (MV, LV)r.m.s. voltage 1 min 100% ±10% of UN NO (LV)r.m.s. voltage 10 min 95% ±10% of UN NL (MV)r.m.s. voltage 10 min 100% +10% / -15% of UN NL (MV)r.m.s. voltage 10 min 99.9% ±10% of UN NL (HV)r.m.s. voltage 10 min 95% +5.33% / -4.66% of UN IT (HV) [150 kV, normal]r.m.s. voltage 10 min 100% +10% / -6.66% of UN IT (HV) [150 kV, normal or alarm]r.m.s. voltage 10 min 100% +13.33% / -14.66% of UN IT (HV) [150 kV, emergency or restoration]r.m.s. voltage 10 min 95% ±5.30% of UN IT (HV) [132 kV, normal]r.m.s. voltage 10 min 100% +9.84% / -9.09% of UN IT (HV) [132 kV, normal or alarm]r.m.s. voltage 10 min 100% +13.6% / -15.15% of UN IT (HV) [132 kV, emergency or restoration]r.m.s. voltage 10 min 100% +10% / -15% of UN IT (MV) [temporary islanding operation of
normally interconnected MV networks]
Note (1): for HV no supply voltage variations limits are given by the EN 50160Note (2): The measurement period for all the above requirements is 1 week
TABLE 3.5 I Voltage quality regulation differing from EN 50160 – other variations
Voltage disturbances
Indicator Integration
periodTime Limit Country (voltage level)
Flicker
Pst - 95% ≤ 0.35 CY (HV, MV, LV)Plt - 95% ≤ 0.35 CY (HV, MV, LV)Pst - 95% ≤ 0.8 CZ (HV, MV, LV)Plt - 95% ≤ 0.6 CZ (HV, MV, LV)Pst - 100% ≤ 0.85 (planning level) IT (HV)Plt - 100% ≤ 0.62 (planning level) IT (HV)Pst - 95% ≤ 1.2 NO ( MV, LV)Pst - 95% ≤ 1 NO (HV)Plt - 100% ≤ 1 NO ( MV, LV), PT (HV)Plt - 100% ≤ 0.8 NO (HV)Pst - 100% ≤ 1 PT (HV)Plt - 100% ≤ 5 NL (HV, MV, LV)
Voltage unbalance
Vun 10 min 95% ≤ 1% IT (HV)Vun 10 min 100% ≤ 2% NO (HV, MV, LV), SE (HV, MV, LV)Vun 10 min 100% ≤ 3% NL (MV, LV)Vun 10 min 99.9% ≤ 1% NL (HV)
Harmonic voltage
THD 10 min 100% ≤ 3% IT (HV)THD 10 min 100% ≤ 8% 0,23 ≤ U ≤ 35 kV
≤ 3% 35 ≤ U ≤ 245 kVNO (HV, MV, LV)
THD 1 week 100% ≤ 5% NO (MV, LV)Individual 10 min 95% Table PT (HV)Individual 10 min 100% Table NO (HV, MV, LV)Individual 10 min 100% Table (as in EN 50160) SE (HV, MV, LV)THD 10 min 95% ≤ 8% U < 35 kV
≤ 6% 35 ≤ U < 150 kV NL (HV, MV, LV)Individual 10 min 99.9% Table U < 35 kV
THD 10 min 99.9% ≤ 12% U < 35 kV ≤ 7% 35 ≤ U < 150 kV
Note (1): The measurement period for all the above requirements is 1 week
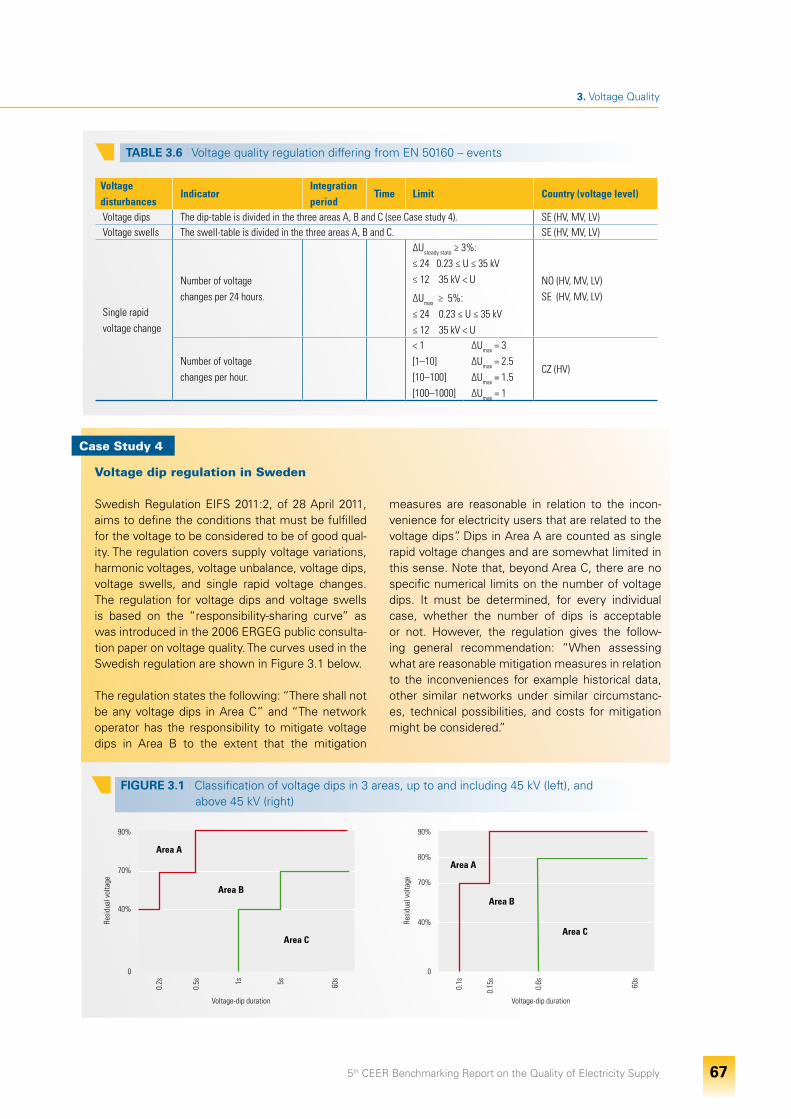
5th CEER Benchmarking Report on the Quality of Electricity Supply 67
3. Voltage Quality
TABLE 3.6 I Voltage quality regulation differing from EN 50160 – events
Voltage disturbances
Indicator Integration period
Time Limit Country (voltage level)
Voltage dips The dip-table is divided in the three areas A, B and C (see Case study 4). SE (HV, MV, LV)Voltage swells The swell-table is divided in the three areas A, B and C. SE (HV, MV, LV)
Single rapid voltage change
Number of voltagechanges per 24 hours.
ΔUsteady state ≥ 3%:≤ 24 0.23 ≤ U ≤ 35 kV ≤ 12 35 kV < U
ΔUmax ≥ 5%: ≤ 24 0.23 ≤ U ≤ 35 kV≤ 12 35 kV < U
NO (HV, MV, LV)SE (HV, MV, LV)
Number of voltagechanges per hour.
< 1 [1–10] [10–100] [100–1000]
ΔUmax = 3 ΔUmax = 2.5ΔUmax = 1.5 ΔUmax = 1
CZ (HV)
Voltage dip regulation in Sweden
Swedish Regulation EIFS 2011:2, of 28 April 2011, aims to define the conditions that must be fulfilled for the voltage to be considered to be of good qual-ity. The regulation covers supply voltage variations, harmonic voltages, voltage unbalance, voltage dips, voltage swells, and single rapid voltage changes. The regulation for voltage dips and voltage swells is based on the “responsibility-sharing curve” as was introduced in the 2006 ERGEG public consulta-tion paper on voltage quality. The curves used in the Swedish regulation are shown in Figure 3.1 below.
The regulation states the following: “There shall not be any voltage dips in Area C” and “The network operator has the responsibility to mitigate voltage dips in Area B to the extent that the mitigation
measures are reasonable in relation to the incon-venience for electricity users that are related to the voltage dips”. Dips in Area A are counted as single rapid voltage changes and are somewhat limited in this sense. Note that, beyond Area C, there are no specific numerical limits on the number of voltage dips. It must be determined, for every individual case, whether the number of dips is acceptable or not. However, the regulation gives the follow-ing general recommendation: “When assessing what are reasonable mitigation measures in relation to the inconveniences for example historical data, other similar networks under similar circumstanc-es, technical possibilities, and costs for mitigation might be considered.”
Case Study 4
90%
70%
40%
0
90%
80%
70%
40%
0
0.2s
0.5s 1s 5s 60
s
0.1s
0.15
s
0.6s 60
s
Resi
dual
vol
tage
Resi
dual
vol
tage
Voltage-dip duration Voltage-dip duration
FIGURE 3.1 I Classification of voltage dips in 3 areas, up to and including 45 kV (left), and above 45 kV (right)
Area A
Area A
Area BArea B
Area CArea C
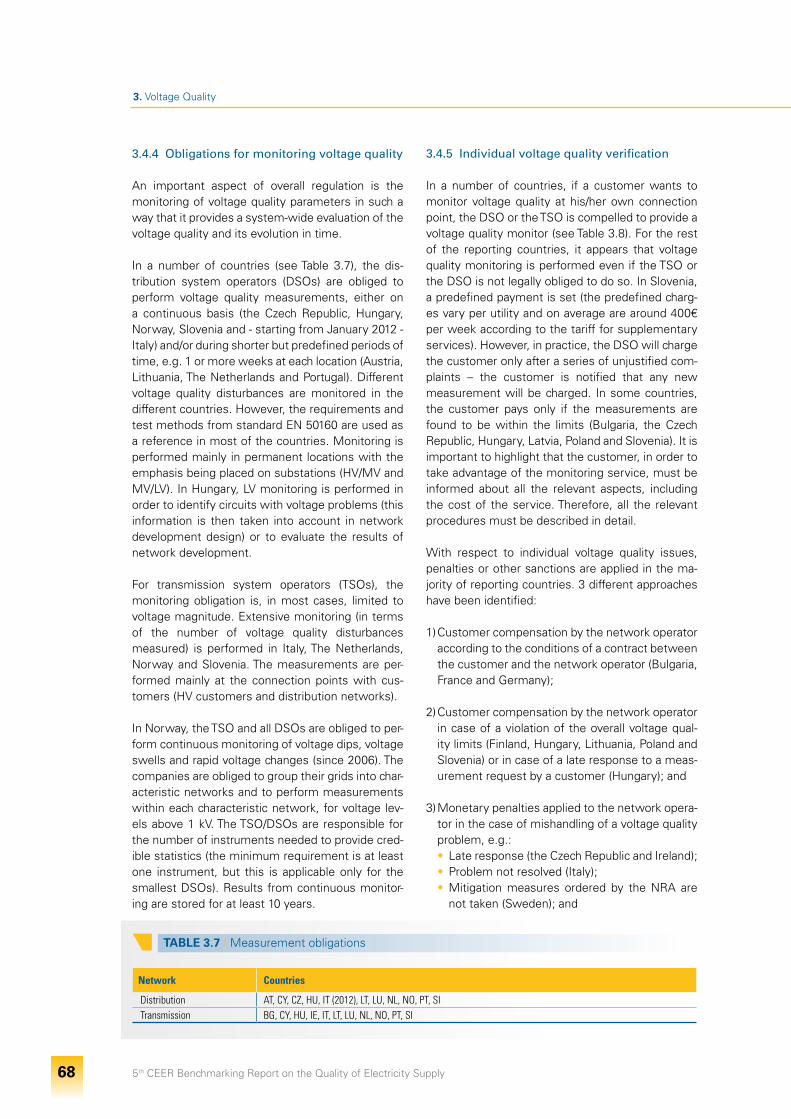
5th CEER Benchmarking Report on the Quality of Electricity Supply 68
3. Voltage Quality
3.4.4 Obligations for monitoring voltage quality An important aspect of overall regulation is the monitoring of voltage quality parameters in such a way that it provides a system-wide evaluation of the voltage quality and its evolution in time.
In a number of countries (see Table 3.7), the dis-tribution system operators (DSOs) are obliged to perform voltage quality measurements, either on a continuous basis (the Czech Republic, Hungary, Norway, Slovenia and - starting from January 2012 - Italy) and/or during shorter but predefined periods of time, e.g. 1 or more weeks at each location (Austria, Lithuania, The Netherlands and Portugal). Different voltage quality disturbances are monitored in the different countries. However, the requirements and test methods from standard EN 50160 are used as a reference in most of the countries. Monitoring is performed mainly in permanent locations with the emphasis being placed on substations (HV/MV and MV/LV). In Hungary, LV monitoring is performed in order to identify circuits with voltage problems (this information is then taken into account in network development design) or to evaluate the results of network development.
For transmission system operators (TSOs), the monitoring obligation is, in most cases, limited to voltage magnitude. Extensive monitoring (in terms of the number of voltage quality disturbances measured) is performed in Italy, The Netherlands, Norway and Slovenia. The measurements are per-formed mainly at the connection points with cus-tomers (HV customers and distribution networks).
In Norway, the TSO and all DSOs are obliged to per-form continuous monitoring of voltage dips, voltage swells and rapid voltage changes (since 2006). The companies are obliged to group their grids into char-acteristic networks and to perform measurements within each characteristic network, for voltage lev-els above 1 kV. The TSO/DSOs are responsible for the number of instruments needed to provide cred-ible statistics (the minimum requirement is at least one instrument, but this is applicable only for the smallest DSOs). Results from continuous monitor-ing are stored for at least 10 years.
3.4.5 Individual voltage quality verification
In a number of countries, if a customer wants to monitor voltage quality at his/her own connection point, the DSO or the TSO is compelled to provide a voltage quality monitor (see Table 3.8). For the rest of the reporting countries, it appears that voltage quality monitoring is performed even if the TSO or the DSO is not legally obliged to do so. In Slovenia, a predefined payment is set (the predefined charg-es vary per utility and on average are around 400€ per week according to the tariff for supplementary services). However, in practice, the DSO will charge the customer only after a series of unjustified com-plaints – the customer is notified that any new measurement will be charged. In some countries, the customer pays only if the measurements are found to be within the limits (Bulgaria, the Czech Republic, Hungary, Latvia, Poland and Slovenia). It is important to highlight that the customer, in order to take advantage of the monitoring service, must be informed about all the relevant aspects, including the cost of the service. Therefore, all the relevant procedures must be described in detail.
With respect to individual voltage quality issues, penalties or other sanctions are applied in the ma-jority of reporting countries. 3 different approaches have been identified:
1) Customer compensation by the network operator according to the conditions of a contract between the customer and the network operator (Bulgaria, France and Germany);
2) Customer compensation by the network operator in case of a violation of the overall voltage qual-ity limits (Finland, Hungary, Lithuania, Poland and Slovenia) or in case of a late response to a meas-urement request by a customer (Hungary); and
3) Monetary penalties applied to the network opera-tor in the case of mishandling of a voltage quality problem, e.g.:• Late response (the Czech Republic and Ireland);• Problem not resolved (Italy);• Mitigation measures ordered by the NRA are
not taken (Sweden); and
TABLE 3.7 I Measurement obligations
Network Countries
Distribution AT, CY, CZ, HU, IT (2012), LT, LU, NL, NO, PT, SITransmission BG, CY, HU, IE, IT, LT, LU, NL, NO, PT, SI
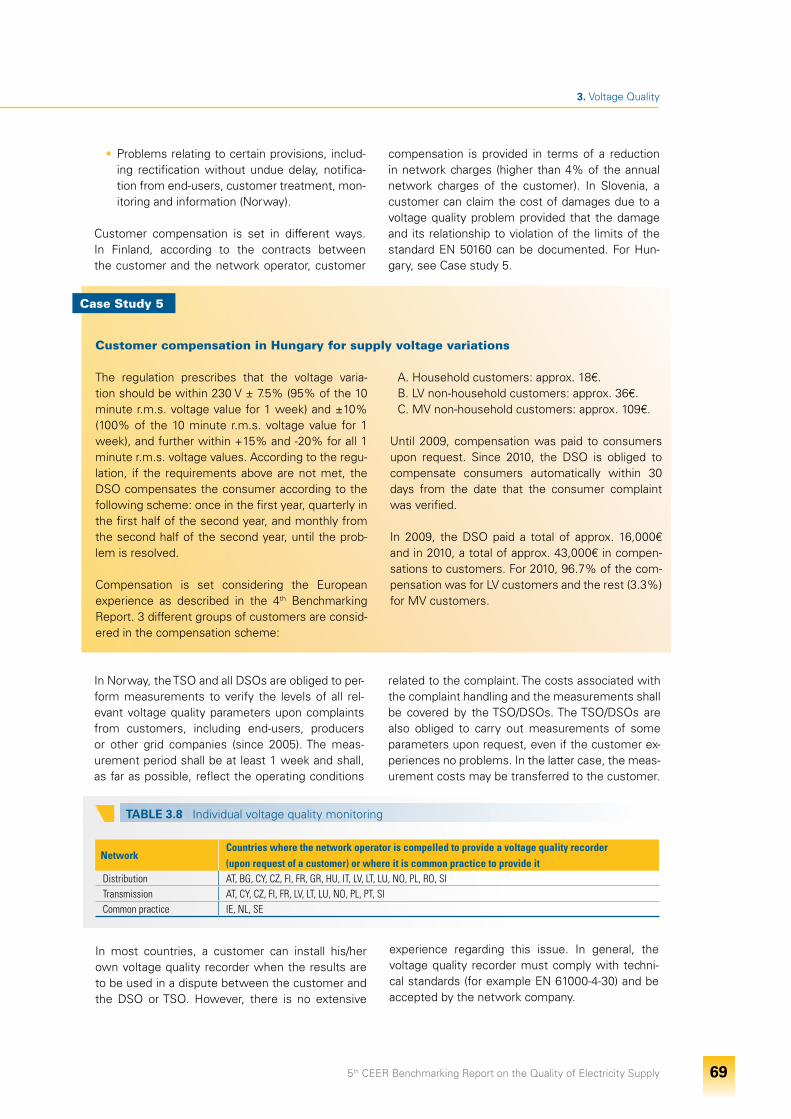
5th CEER Benchmarking Report on the Quality of Electricity Supply 69
3. Voltage Quality
• Problems relating to certain provisions, includ-ing rectification without undue delay, notifica-tion from end-users, customer treatment, mon-itoring and information (Norway).
Customer compensation is set in different ways. In Finland, according to the contracts between the customer and the network operator, customer
compensation is provided in terms of a reduction in network charges (higher than 4% of the annual network charges of the customer). In Slovenia, a customer can claim the cost of damages due to a voltage quality problem provided that the damage and its relationship to violation of the limits of the standard EN 50160 can be documented. For Hun-gary, see Case study 5.
TABLE 3.8 I Individual voltage quality monitoring
NetworkCountries where the network operator is compelled to provide a voltage quality recorder(upon request of a customer) or where it is common practice to provide it
Distribution AT, BG, CY, CZ, FI, FR, GR, HU, IT, LV, LT, LU, NO, PL, RO, SITransmission AT, CY, CZ, FI, FR, LV, LT, LU, NO, PL, PT, SICommon practice IE, NL, SE
Customer compensation in Hungary for supply voltage variations
The regulation prescribes that the voltage varia-tion should be within 230 V ± 7.5% (95% of the 10 minute r.m.s. voltage value for 1 week) and ±10% (100% of the 10 minute r.m.s. voltage value for 1 week), and further within +15% and -20% for all 1 minute r.m.s. voltage values. According to the regu-lation, if the requirements above are not met, the DSO compensates the consumer according to the following scheme: once in the first year, quarterly in the first half of the second year, and monthly from the second half of the second year, until the prob-lem is resolved.
Compensation is set considering the European experience as described in the 4th Benchmarking Report. 3 different groups of customers are consid-ered in the compensation scheme:
A. Household customers: approx. 18€.B. LV non-household customers: approx. 36€.C. MV non-household customers: approx. 109€.
Until 2009, compensation was paid to consumers upon request. Since 2010, the DSO is obliged to compensate consumers automatically within 30 days from the date that the consumer complaint was verified.
In 2009, the DSO paid a total of approx. 16,000€ and in 2010, a total of approx. 43,000€ in compen-sations to customers. For 2010, 96.7% of the com-pensation was for LV customers and the rest (3.3%) for MV customers.
Case Study 5
In most countries, a customer can install his/her own voltage quality recorder when the results are to be used in a dispute between the customer and the DSO or TSO. However, there is no extensive
experience regarding this issue. In general, the voltage quality recorder must comply with techni-cal standards (for example EN 61000-4-30) and be accepted by the network company.
In Norway, the TSO and all DSOs are obliged to per-form measurements to verify the levels of all rel-evant voltage quality parameters upon complaints from customers, including end-users, producers or other grid companies (since 2005). The meas-urement period shall be at least 1 week and shall, as far as possible, reflect the operating conditions
related to the complaint. The costs associated with the complaint handling and the measurements shall be covered by the TSO/DSOs. The TSO/DSOs are also obliged to carry out measurements of some parameters upon request, even if the customer ex-periences no problems. In the latter case, the meas-urement costs may be transferred to the customer.
5th CEER Benchmarking Report on the Quality of Electricity Supply 70
3. Voltage Quality
3.4.6 Individual information on voltage quality
In a few of the reporting countries, the network op-erators are obliged to inform customers about the actual voltage quality levels (in practice, the meas-ured levels from the recent past). In Ireland, the DSO must provide information upon the request of a customer. The type of information is based on the request. The TSO is not obliged to inform cus-tomers about voltage quality levels, but if issues arise customers will be informed. In Italy, the net-
work operators are obliged to publish and/or inform EHV, HV and MV customers about the maximum and minimum short circuit power at the connec-tion point. In Portugal, the network operators are obliged to provide the parameters as in the Quality of Service Code. In The Netherlands, a customer is entitled to information only if there is a measuring unit installed at his connection point. The informa-tion provided to customers in Norway is presented in Case study 6 and in Slovenia in Case study 7.
Information provided to customers about past (or expected future) voltage qualitylevels in Norway
At the request of a current or future network cus-tomer, the TSO/DSOs shall provide information within 1 month on the continuity of supply and volt-age quality in their own installations. Information on the following elements shall be provided:
a. Nominal value for the supply voltage in connec-tion points and voltage quality limits;
b. Results of fault analyses carried out pursuant to the regulations relating to system responsibility;
c. Results of continuous monitoring of voltage qual-ity parameters;
d. Estimated number of historical and expected volt-age swells and voltage dips in the company’s own supply areas, based on historical data recorded through continuous monitoring;
e. Calculated minimum and maximum short-circuit power for connection points above 1 kV. Signifi-cant changes in the short circuit power shall be notified to affected customers; and
f. Special conditions in the grid that may have an effect on the quality of supply, in order to prepare grid customers for conditions that might arise. Ex-amples of these include: particular risk of phase interruptions in coil earthed networks or transient over-voltages, use of automatic reconnection, etc.
Grid companies may not demand special remu-neration for information provided pursuant to the aforementioned paragraphs. Based on actual meas-urements at a given point in the network, the TSO/DSOs shall provide information about the level of steady state voltage variations, flicker severity, de-gree of voltage unbalance and harmonic voltages, when so requested in writing by current or future customers. The TSO/DSOs may demand the reim-bursement of necessary costs for carrying out the obligations pursuant to this paragraph.
Case Study 6
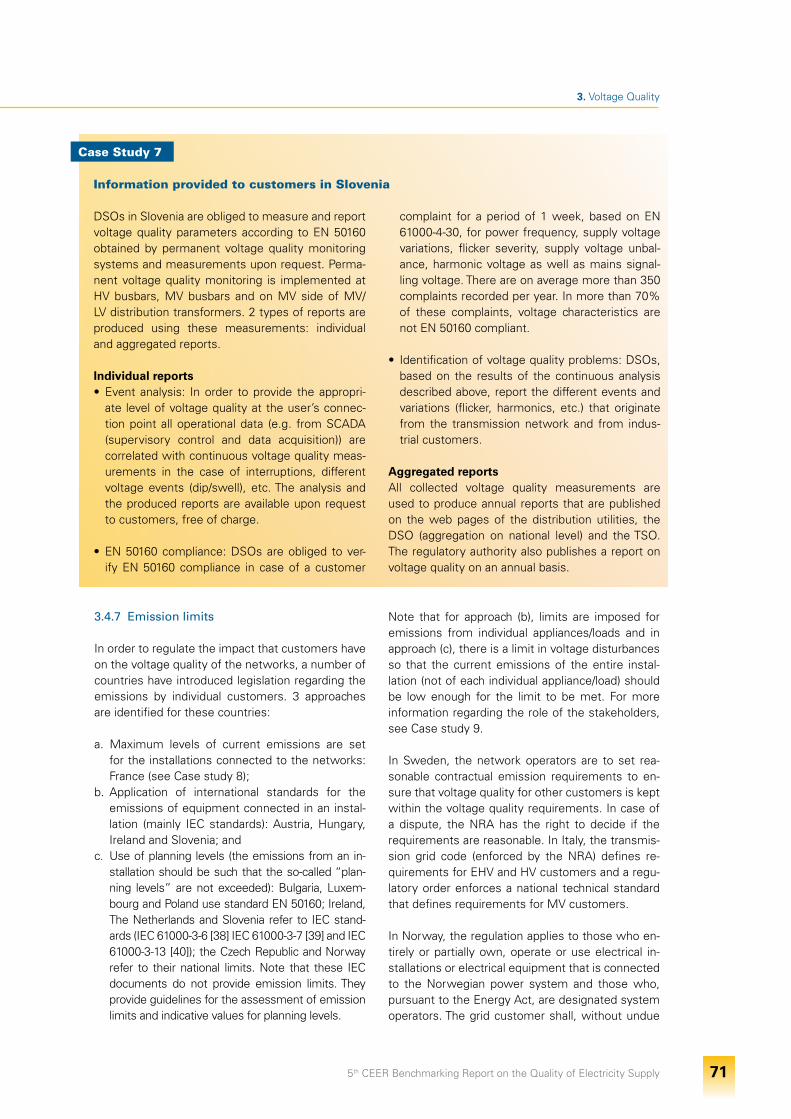
5th CEER Benchmarking Report on the Quality of Electricity Supply 71
3. Voltage Quality
3.4.7 Emission limits
In order to regulate the impact that customers have on the voltage quality of the networks, a number of countries have introduced legislation regarding the emissions by individual customers. 3 approaches are identified for these countries:
a. Maximum levels of current emissions are set for the installations connected to the networks: France (see Case study 8);
b. Application of international standards for the emissions of equipment connected in an instal-lation (mainly IEC standards): Austria, Hungary, Ireland and Slovenia; and
c. Use of planning levels (the emissions from an in-stallation should be such that the so-called “plan-ning levels” are not exceeded): Bulgaria, Luxem-bourg and Poland use standard EN 50160; Ireland, The Netherlands and Slovenia refer to IEC stand-ards (IEC 61000-3-6 [38] IEC 61000-3-7 [39] and IEC 61000-3-13 [40]); the Czech Republic and Norway refer to their national limits. Note that these IEC documents do not provide emission limits. They provide guidelines for the assessment of emission limits and indicative values for planning levels.
Note that for approach (b), limits are imposed for emissions from individual appliances/loads and in approach (c), there is a limit in voltage disturbances so that the current emissions of the entire instal-lation (not of each individual appliance/load) should be low enough for the limit to be met. For more information regarding the role of the stakeholders, see Case study 9.
In Sweden, the network operators are to set rea-sonable contractual emission requirements to en-sure that voltage quality for other customers is kept within the voltage quality requirements. In case of a dispute, the NRA has the right to decide if the requirements are reasonable. In Italy, the transmis-sion grid code (enforced by the NRA) defines re-quirements for EHV and HV customers and a regu-latory order enforces a national technical standard that defines requirements for MV customers.
In Norway, the regulation applies to those who en-tirely or partially own, operate or use electrical in-stallations or electrical equipment that is connected to the Norwegian power system and those who, pursuant to the Energy Act, are designated system operators. The grid customer shall, without undue
Information provided to customers in Slovenia
DSOs in Slovenia are obliged to measure and report voltage quality parameters according to EN 50160 obtained by permanent voltage quality monitoring systems and measurements upon request. Perma-nent voltage quality monitoring is implemented at HV busbars, MV busbars and on MV side of MV/LV distribution transformers. 2 types of reports are produced using these measurements: individual and aggregated reports.
Individual reports• Event analysis: In order to provide the appropri-
ate level of voltage quality at the user’s connec-tion point all operational data (e.g. from SCADA (supervisory control and data acquisition)) are correlated with continuous voltage quality meas-urements in the case of interruptions, different voltage events (dip/swell), etc. The analysis and the produced reports are available upon request to customers, free of charge.
• EN 50160 compliance: DSOs are obliged to ver-ify EN 50160 compliance in case of a customer
complaint for a period of 1 week, based on EN 61000-4-30, for power frequency, supply voltage variations, flicker severity, supply voltage unbal-ance, harmonic voltage as well as mains signal-ling voltage. There are on average more than 350 complaints recorded per year. In more than 70% of these complaints, voltage characteristics are not EN 50160 compliant.
• Identification of voltage quality problems: DSOs, based on the results of the continuous analysis described above, report the different events and variations (flicker, harmonics, etc.) that originate from the transmission network and from indus-trial customers.
Aggregated reportsAll collected voltage quality measurements are used to produce annual reports that are published on the web pages of the distribution utilities, the DSO (aggregation on national level) and the TSO. The regulatory authority also publishes a report on voltage quality on an annual basis.
Case Study 7
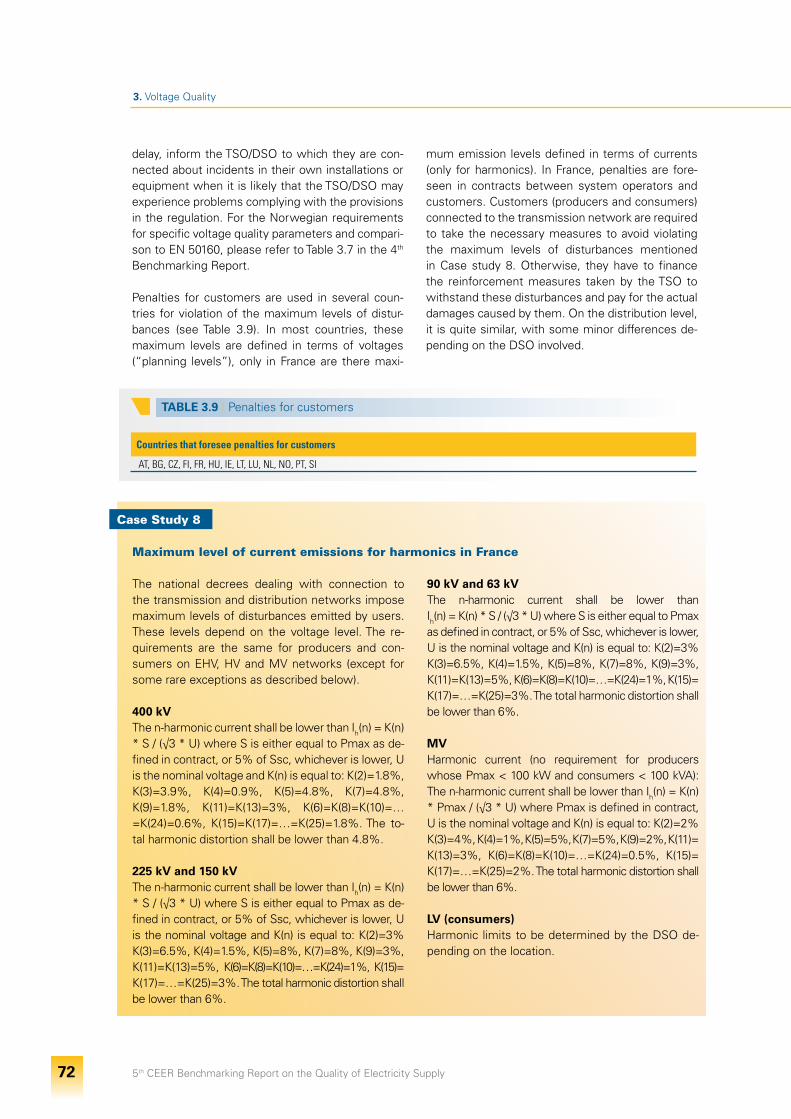
5th CEER Benchmarking Report on the Quality of Electricity Supply 72
3. Voltage Quality
delay, inform the TSO/DSO to which they are con-nected about incidents in their own installations or equipment when it is likely that the TSO/DSO may experience problems complying with the provisions in the regulation. For the Norwegian requirements for specific voltage quality parameters and compari-son to EN 50160, please refer to Table 3.7 in the 4th Benchmarking Report.
Penalties for customers are used in several coun-tries for violation of the maximum levels of distur-bances (see Table 3.9). In most countries, these maximum levels are defined in terms of voltages (“planning levels”), only in France are there maxi-
mum emission levels defined in terms of currents (only for harmonics). In France, penalties are fore-seen in contracts between system operators and customers. Customers (producers and consumers) connected to the transmission network are required to take the necessary measures to avoid violating the maximum levels of disturbances mentioned in Case study 8. Otherwise, they have to finance the reinforcement measures taken by the TSO to withstand these disturbances and pay for the actual damages caused by them. On the distribution level, it is quite similar, with some minor differences de-pending on the DSO involved.
Maximum level of current emissions for harmonics in France
The national decrees dealing with connection to the transmission and distribution networks impose maximum levels of disturbances emitted by users. These levels depend on the voltage level. The re-quirements are the same for producers and con-sumers on EHV, HV and MV networks (except for some rare exceptions as described below).
400 kV The n-harmonic current shall be lower than Ih(n) = K(n) * S / (√3 * U) where S is either equal to Pmax as de-fined in contract, or 5% of Ssc, whichever is lower, U is the nominal voltage and K(n) is equal to: K(2)=1.8%, K(3)=3.9%, K(4)=0.9%, K(5)=4.8%, K(7)=4.8%, K(9)=1.8%, K(11)=K(13)=3%, K(6)=K(8)=K(10)=…=K(24)=0.6%, K(15)=K(17)=…=K(25)=1.8%. The to-tal harmonic distortion shall be lower than 4.8%.
225 kV and 150 kVThe n-harmonic current shall be lower than Ih(n) = K(n) * S / (√3 * U) where S is either equal to Pmax as de-fined in contract, or 5% of Ssc, whichever is lower, U is the nominal voltage and K(n) is equal to: K(2)=3% K(3)=6.5%, K(4)=1.5%, K(5)=8%, K(7)=8%, K(9)=3%, K(11)=K(13)=5%, K(6)=K(8)=K(10)=…=K(24)=1%, K(15)= K(17)=…=K(25)=3%. The total harmonic distortion shall be lower than 6%.
90 kV and 63 kVThe n-harmonic current shall be lower than Ih(n) = K(n) * S / (√3 * U) where S is either equal to Pmax as defined in contract, or 5% of Ssc, whichever is lower, U is the nominal voltage and K(n) is equal to: K(2)=3% K(3)=6.5%, K(4)=1.5%, K(5)=8%, K(7)=8%, K(9)=3%, K(11)=K(13)=5%, K(6)=K(8)=K(10)=…=K(24)=1%, K(15)= K(17)=…=K(25)=3%. The total harmonic distortion shall be lower than 6%.
MVHarmonic current (no requirement for producers whose Pmax < 100 kW and consumers < 100 kVA): The n-harmonic current shall be lower than Ih(n) = K(n) * Pmax / (√3 * U) where Pmax is defined in contract, U is the nominal voltage and K(n) is equal to: K(2)=2% K(3)=4%, K(4)=1%, K(5)=5%, K(7)=5%, K(9)=2%, K(11)= K(13)=3%, K(6)=K(8)=K(10)=…=K(24)=0.5%, K(15)= K(17)=…=K(25)=2%. The total harmonic distortion shall be lower than 6%.
LV (consumers)Harmonic limits to be determined by the DSO de-pending on the location.
Case Study 8
TABLE 3.9 I Penalties for customers
Countries that foresee penalties for customers
AT, BG, CZ, FI, FR, HU, IE, LT, LU, NL, NO, PT, SI
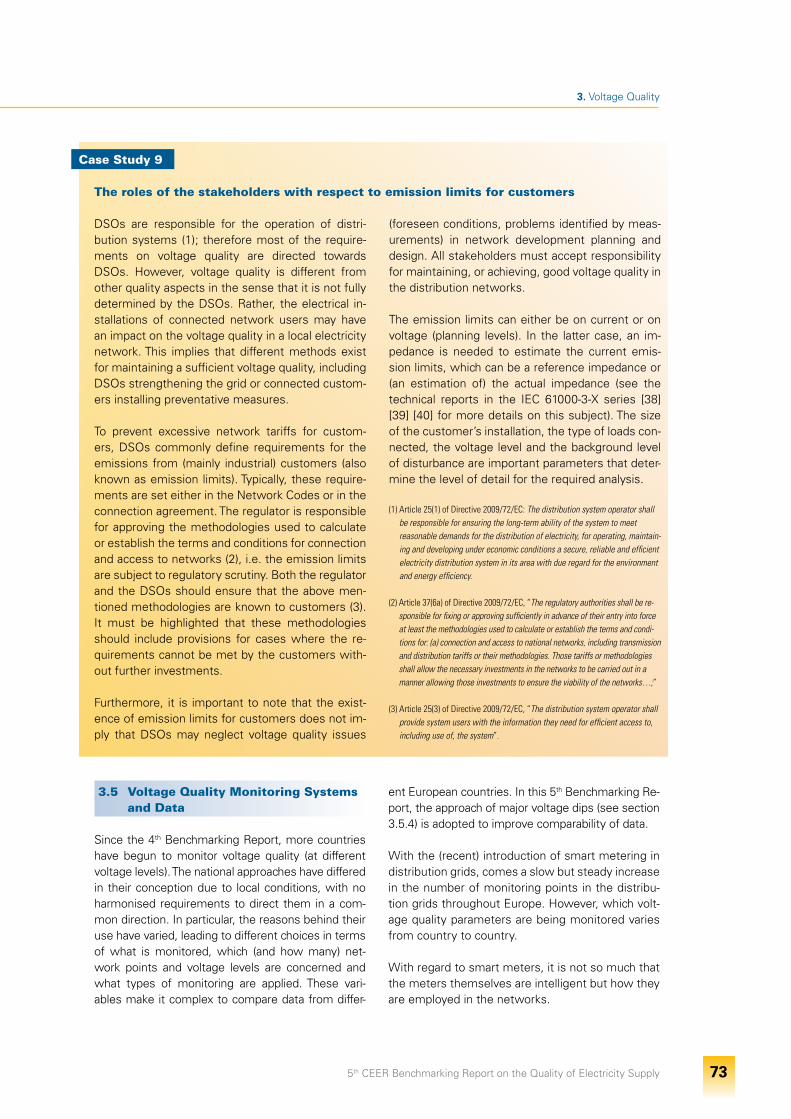
5th CEER Benchmarking Report on the Quality of Electricity Supply 73
3. Voltage Quality
The roles of the stakeholders with respect to emission limits for customers
DSOs are responsible for the operation of distri-bution systems (1); therefore most of the require-ments on voltage quality are directed towards DSOs. However, voltage quality is different from other quality aspects in the sense that it is not fully determined by the DSOs. Rather, the electrical in-stallations of connected network users may have an impact on the voltage quality in a local electricity network. This implies that different methods exist for maintaining a sufficient voltage quality, including DSOs strengthening the grid or connected custom-ers installing preventative measures.
To prevent excessive network tariffs for custom-ers, DSOs commonly define requirements for the emissions from (mainly industrial) customers (also known as emission limits). Typically, these require-ments are set either in the Network Codes or in the connection agreement. The regulator is responsible for approving the methodologies used to calculate or establish the terms and conditions for connection and access to networks (2), i.e. the emission limits are subject to regulatory scrutiny. Both the regulator and the DSOs should ensure that the above men-tioned methodologies are known to customers (3). It must be highlighted that these methodologies should include provisions for cases where the re-quirements cannot be met by the customers with-out further investments.
Furthermore, it is important to note that the exist-ence of emission limits for customers does not im-ply that DSOs may neglect voltage quality issues
(foreseen conditions, problems identified by meas-urements) in network development planning and design. All stakeholders must accept responsibility for maintaining, or achieving, good voltage quality in the distribution networks.
The emission limits can either be on current or on voltage (planning levels). In the latter case, an im-pedance is needed to estimate the current emis-sion limits, which can be a reference impedance or (an estimation of) the actual impedance (see the technical reports in the IEC 61000-3-X series [38] [39] [40] for more details on this subject). The size of the customer’s installation, the type of loads con-nected, the voltage level and the background level of disturbance are important parameters that deter-mine the level of detail for the required analysis.
(1) Article 25(1) of Directive 2009/72/EC: The distribution system operator shall be responsible for ensuring the long-term ability of the system to meet reasonable demands for the distribution of electricity, for operating, maintain-ing and developing under economic conditions a secure, reliable and efficient electricity distribution system in its area with due regard for the environment and energy efficiency.
(2) Article 37(6a) of Directive 2009/72/EC, “The regulatory authorities shall be re-sponsible for fixing or approving sufficiently in advance of their entry into force at least the methodologies used to calculate or establish the terms and condi-tions for: (a) connection and access to national networks, including transmission and distribution tariffs or their methodologies. Those tariffs or methodologies shall allow the necessary investments in the networks to be carried out in a manner allowing those investments to ensure the viability of the networks…;”
(3) Article 25(3) of Directive 2009/72/EC, “The distribution system operator shall provide system users with the information they need for efficient access to, including use of, the system”.
Case Study 9
3.5 Voltage Quality Monitoring Systems and Data
Since the 4th Benchmarking Report, more countries have begun to monitor voltage quality (at different voltage levels). The national approaches have differed in their conception due to local conditions, with no harmonised requirements to direct them in a com-mon direction. In particular, the reasons behind their use have varied, leading to different choices in terms of what is monitored, which (and how many) net-work points and voltage levels are concerned and what types of monitoring are applied. These vari-ables make it complex to compare data from differ-
ent European countries. In this 5th Benchmarking Re-port, the approach of major voltage dips (see section 3.5.4) is adopted to improve comparability of data.
With the (recent) introduction of smart metering in distribution grids, comes a slow but steady increase in the number of monitoring points in the distribu-tion grids throughout Europe. However, which volt-age quality parameters are being monitored varies from country to country.
With regard to smart meters, it is not so much that the meters themselves are intelligent but how they are employed in the networks.
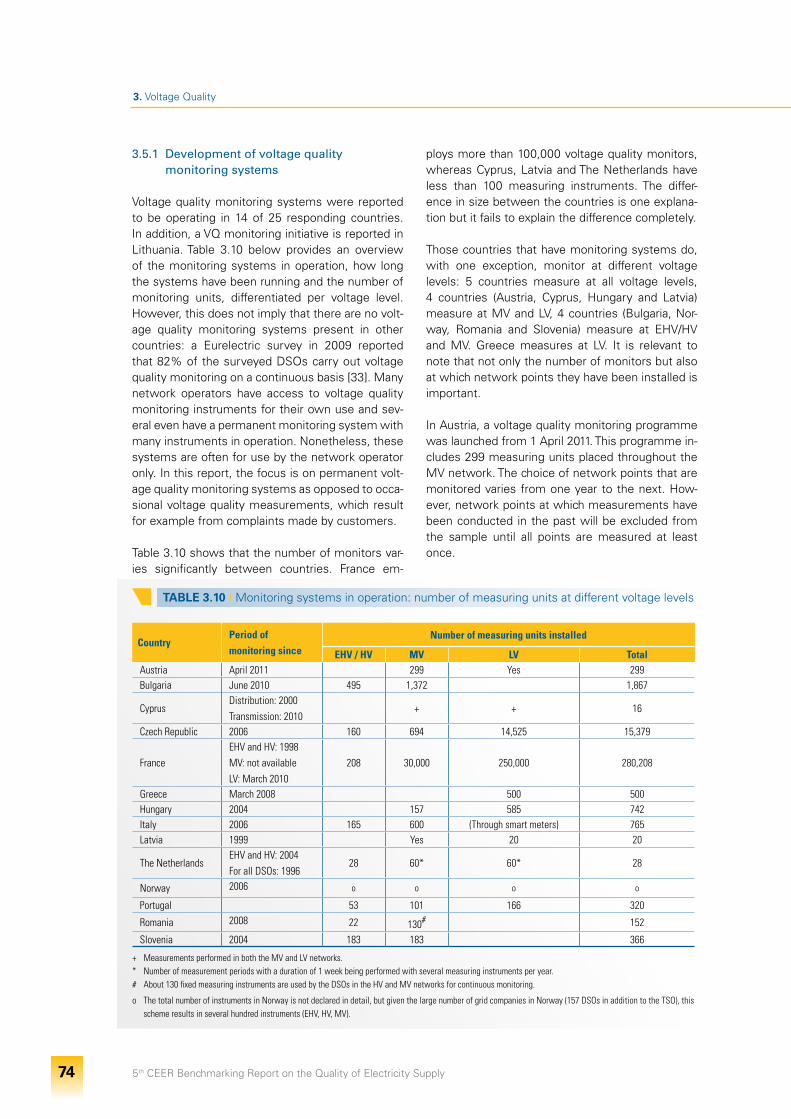
5th CEER Benchmarking Report on the Quality of Electricity Supply 74
3. Voltage Quality
TABLE 3.10 I Monitoring systems in operation: number of measuring units at different voltage levels
CountryPeriod of monitoring since
Number of measuring units installed
EHV / HV MV LV TotalAustria April 2011 299 Yes 299Bulgaria June 2010 495 1,372 1,867
CyprusDistribution: 2000Transmission: 2010
+ + 16
Czech Republic 2006 160 694 14,525 15,379
FranceEHV and HV: 1998MV: not availableLV: March 2010
208 30,000 250,000 280,208
Greece March 2008 500 500Hungary 2004 157 585 742Italy 2006 165 600 (Through smart meters) 765Latvia 1999 Yes 20 20
The NetherlandsEHV and HV: 2004For all DSOs: 1996
28 60* 60* 28
Norway 2006 o o o o
Portugal 53 101 166 320
Romania 2008 22 130# 152
Slovenia 2004 183 183 366
+ Measurements performed in both the MV and LV networks. * Number of measurement periods with a duration of 1 week being performed with several measuring instruments per year.# About 130 fixed measuring instruments are used by the DSOs in the HV and MV networks for continuous monitoring.
o The total number of instruments in Norway is not declared in detail, but given the large number of grid companies in Norway (157 DSOs in addition to the TSO), this scheme results in several hundred instruments (EHV, HV, MV).
3.5.1 Development of voltage quality monitoring systems
Voltage quality monitoring systems were reported to be operating in 14 of 25 responding countries. In addition, a VQ monitoring initiative is reported in Lithuania. Table 3.10 below provides an overview of the monitoring systems in operation, how long the systems have been running and the number of monitoring units, differentiated per voltage level. However, this does not imply that there are no volt-age quality monitoring systems present in other countries: a Eurelectric survey in 2009 reported that 82% of the surveyed DSOs carry out voltage quality monitoring on a continuous basis [33]. Many network operators have access to voltage quality monitoring instruments for their own use and sev-eral even have a permanent monitoring system with many instruments in operation. Nonetheless, these systems are often for use by the network operator only. In this report, the focus is on permanent volt-age quality monitoring systems as opposed to occa-sional voltage quality measurements, which result for example from complaints made by customers.
Table 3.10 shows that the number of monitors var-ies significantly between countries. France em-
ploys more than 100,000 voltage quality monitors, whereas Cyprus, Latvia and The Netherlands have less than 100 measuring instruments. The differ-ence in size between the countries is one explana-tion but it fails to explain the difference completely.
Those countries that have monitoring systems do, with one exception, monitor at different voltage levels: 5 countries measure at all voltage levels, 4 countries (Austria, Cyprus, Hungary and Latvia) measure at MV and LV, 4 countries (Bulgaria, Nor-way, Romania and Slovenia) measure at EHV/HV and MV. Greece measures at LV. It is relevant to note that not only the number of monitors but also at which network points they have been installed is important.
In Austria, a voltage quality monitoring programme was launched from 1 April 2011. This programme in-cludes 299 measuring units placed throughout the MV network. The choice of network points that are monitored varies from one year to the next. How-ever, network points at which measurements have been conducted in the past will be excluded from the sample until all points are measured at least once.
5th CEER Benchmarking Report on the Quality of Electricity Supply 75
3. Voltage Quality
In Bulgaria, an extensive monitoring programme measures the voltage quality at all HV substations, HV and MV end-user sites, and at all MV busbars in HV/MV substations. The total number of measuring units is 495 in the HV network and 1,372 in the MV network. Of these measurement units, 53 units are portable instruments.
In Cyprus, the voltage quality monitoring pro-gramme in the distribution network has been in operation since 1 January 2000. Since 1 June 2010, the transmission network has also been included. The monitoring system in the transmission network involves a single, permanent and fixed instrument at the TSO connection point production units. In ad-dition, a total of 15 portable instruments are used to measure the voltage quality at the connection points of independent renewable energy producers and at MV substations.
Below are the dates from which continuous moni-toring of voltage quality in the Czech Republic for different kinds of network points has been in op-eration. The list comes from the Czech Distribution Grid Code.
• Transfer points TS/DS > continuously monitored since 1/1/2006• Delivery points 110 kV > continuously monitored since 1/1/2007• Substations output voltage 110 kV (MV) > continuously monitored since 1/1/2010• Delivery points MV > selection• Substations output voltage MV/LV > selection• Delivery points LV > selection
In France, the monitoring of voltage quality began in January 1998 with a programme in the EHV and HV networks. This programme now includes meas-urement units at 208 EHV or HV end-user sites (the total number of end-user sites in the EHV and HV networks in France amounts to 1,720). In the MV networks, about 50% of MV customers (the total number is about 60,000 MV customers) are equipped with a monitoring device. These moni-toring devices are especially installed for custom-ers with a subscribed power larger than 250 kVA. Furthermore, some of the HV/MV substations are monitored in the distribution networks. Finally, the voltage quality monitoring programme includes around 250,000 end user sites in the LV network.
All of the measuring instruments in the MV and LV networks are fixed instruments.
In Greece, since the launch in 2007 of a monitor-ing programme there are 500 measuring points, of which 285 interconnected urban network points and 107 interconnected rural network points. The remaining 108 measurement units were installed in networks on non-interconnected islands. Popu-lation density criteria were used in order to select end-user sites in both the interconnected distribu-tion networks and the non-interconnected islands. The threshold for the distinction between urban and rural was placed at a population of 1,000.
In Hungary, the selection of network points for voltage quality monitoring is done according to different approaches for the LV and MV networks. In the LV network, the monitoring instruments are placed at network points with known voltage quality problems, especially at locations with large supply voltage variations. Thus, the results of the voltage quality monitoring serve as input for the network development plans of the DSOs. The av-erage monitoring duration of LV network points is about 3 weeks. In the MV network, the selection of monitored network points is based on different ap-proaches and its purpose is to monitor the voltage quality in general. The average monitoring duration of MV network points is about 9.6 months.
In Ireland, the TSO has a number of disturbance re-corders at key nodes in the transmission network, including a number of interfaces with users of the system. The recorders monitor voltage and current and the newer installations have the ability to cal-culate, among other things, voltage unbalance, har-monics, etc. Currently, the TSO uses these record-ers primarily to examine the impact of faults and other abnormal conditions on the power system and on users of the power system. Voltage quality parameters are not monitored on a continuous ba-sis or at pre-defined time periods. Harmonic distor-tion and voltage unbalance surveys are carried out from time to time to establish network conditions prior to and/or post changes (e.g. the addition of a new feeder, customer load or reactive power sup-port installation), in response to requests (see Sec-tion 3.4.6) and to provide data for system models.
In Italy, voltage quality monitoring in the EHV, HV and MV networks has been in operation since 2006. The following network points are monitored in Italy, in-cluding the number of measuring instruments:

5th CEER Benchmarking Report on the Quality of Electricity Supply 76
3. Voltage Quality
• 380 kV busbar/substation 7• 220 kV busbar/substation 16• HV busbar/substation 142• MV busbar in HV/MV substation 400
(to be extended to all MV busbars from 2012)• MV end-user site 70• MV busbar in MV/LV substation 130• LV end-user site 350,000
(planned, through smart meters)
The monitoring of voltage quality in the LV networks occurs for customers equipped with smart meters. Currently, a consultation is being conducted by the regulator on the monitoring campaigns (see Section 3.5.2 on smart meters).
In Latvia, there are 20 portable instruments moni-toring the voltage quality at the weakest points in the network. The weakest points are defined by the DSO without the use of standardised criteria. Gen-erally, they refer to points in the network with long overhead lines in the LV network (more than about 500 meters), which are located mostly in rural areas. Moreover, approximately 10% of MV busbars in HV/MV substations are also monitored for voltage qual-ity. Further, voltage quality measurements are per-formed only in case of complaints from customers, generally in the LV networks. In the MV networks, monitoring due to complaints from customers is typ-ically performed only once or twice per year.
In The Netherlands, the selection of network points under monitoring (for a period of 1 week) was based on a random selection of postcodes. Since 2008, the random selection of 60 monitoring customer con-nection points in both the MV and LV networks is based on EAN codes rather than postcodes. In The Netherlands, a unique EAN-code is assigned to eve-ry single customer connection point, which is used for identification by network operators and suppliers. In the HV network, 20 customer connection points have been randomly selected to monitor the voltage quality continuously. From 2004, all customer con-nection points in the EHV network are continuously monitored.
In Norway, all voltage levels above 1 kV are involved in continuous monitoring. From 1 January 2006, all network operators are required to carry out continu-ous monitoring on characteristic areas in their EHV, HV and MV networks. These characteristic areas are defined by considering features such as, under-ground cables versus aerial lines, system earthing, extension of the network and short circuit power. The network operators decide for themselves how many
measurement instruments for continuous monitor-ing are required to create trustworthy statistics. Each network operator must have at least one instrument installed in each different characteristic area.
The total number of instruments in Norway is not declared to the regulator in detail, but given the large number of network operators in Norway (157 DSOs regulated by revenue cap in 2010), this scheme re-sults in several hundred instruments installed in the MV, HV and EHV networks.
The Norwegian regulator, NVE, commissioned a consultancy study [36] with the task of, inter alia, evaluating how network operators have solved the current requirements on continuous monitoring of voltage disturbances, including the number of instru-ments, the voltage disturbances monitored, the char-acteristic networks and the location of measurement units. Further, the study aimed to evaluate whether the current regulatory requirement is sufficient to en-sure trustworthy statistics at national, regional and local level, and to recommend a suitable division of characteristic networks for a given number of opera-tors. The assignment included recommendations on regulatory requirements to ensure the mentioned trustworthy statistics. Finally, the assignment includ-ed issuing recommendations on a reporting scheme of results from the measurements of voltage distur-bances through continuous monitoring, or monitor-ing related to customer complaints or requests.
In Portugal, voltage quality monitoring is carried out at all voltage levels. The quality of service code estab-lishes that within every 2 years, each delivery point in the EHV and HV networks must be monitored. The TSO continuously monitors all delivery points where measurement is possible. Where monitoring is con-ducted with portable instruments, the duration of the monitoring is 4 weeks. Furthermore, the quality of service code requires that monitoring is done in MV busbars in all HV/MV substations and in LV busbars in, at least, 2MV/LV substations per municipality for every 4 year period.
In Romania, the voltage quality monitoring system covers all voltage levels in the network. The scheme includes approximately 150 fixed and 150 portable measuring instruments. The fixed measuring instru-ments are used for continuous monitoring as follows: 22 instruments for the EHV network (220 – 750 kV) of the TSO and about 130 measuring instruments for the HV and MV networks of the DSOs. The network operators decide for themselves which network points need to be monitored for voltage quality. Cho-
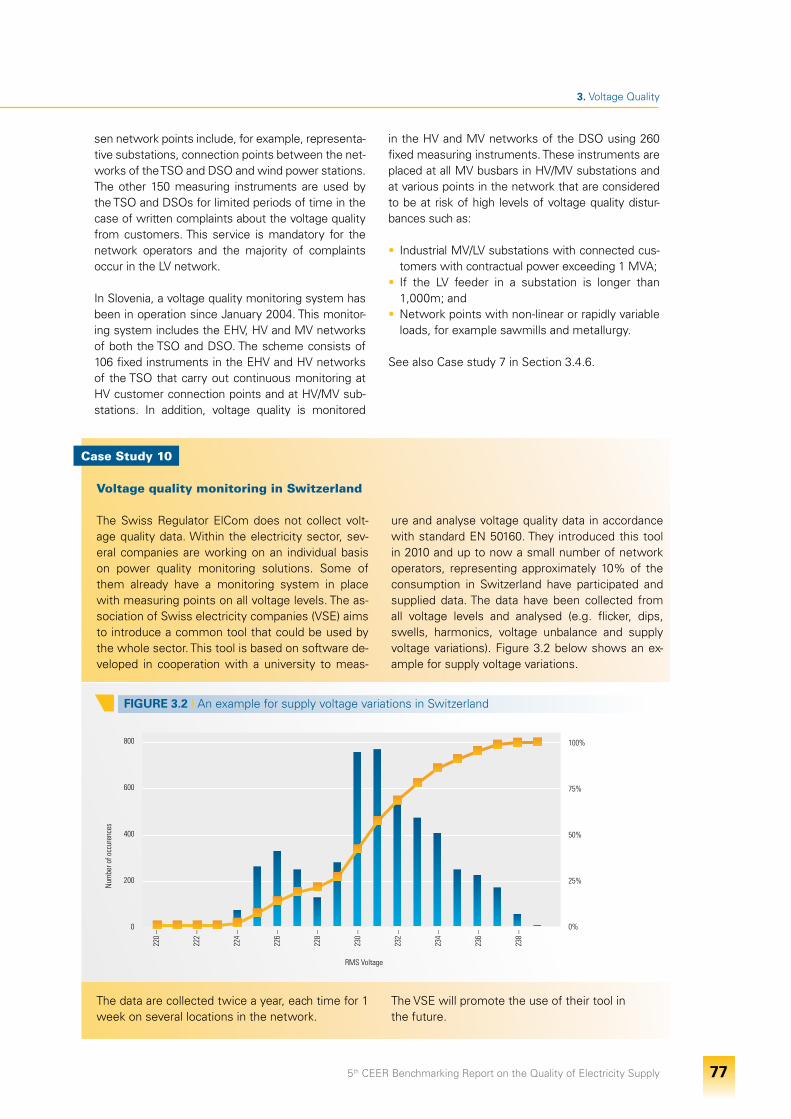
5th CEER Benchmarking Report on the Quality of Electricity Supply 77
3. Voltage Quality
sen network points include, for example, representa-tive substations, connection points between the net-works of the TSO and DSO and wind power stations. The other 150 measuring instruments are used by the TSO and DSOs for limited periods of time in the case of written complaints about the voltage quality from customers. This service is mandatory for the network operators and the majority of complaints occur in the LV network.
In Slovenia, a voltage quality monitoring system has been in operation since January 2004. This monitor-ing system includes the EHV, HV and MV networks of both the TSO and DSO. The scheme consists of 106 fixed instruments in the EHV and HV networks of the TSO that carry out continuous monitoring at HV customer connection points and at HV/MV sub-stations. In addition, voltage quality is monitored
in the HV and MV networks of the DSO using 260 fixed measuring instruments. These instruments are placed at all MV busbars in HV/MV substations and at various points in the network that are considered to be at risk of high levels of voltage quality distur-bances such as:
• Industrial MV/LV substations with connected cus-tomers with contractual power exceeding 1 MVA;
• If the LV feeder in a substation is longer than 1,000m; and
• Network points with non-linear or rapidly variable loads, for example sawmills and metallurgy.
See also Case study 7 in Section 3.4.6.
Voltage quality monitoring in Switzerland
The Swiss Regulator ElCom does not collect volt-age quality data. Within the electricity sector, sev-eral companies are working on an individual basis on power quality monitoring solutions. Some of them already have a monitoring system in place with measuring points on all voltage levels. The as-sociation of Swiss electricity companies (VSE) aims to introduce a common tool that could be used by the whole sector. This tool is based on software de-veloped in cooperation with a university to meas-
ure and analyse voltage quality data in accordance with standard EN 50160. They introduced this tool in 2010 and up to now a small number of network operators, representing approximately 10% of the consumption in Switzerland have participated and supplied data. The data have been collected from all voltage levels and analysed (e.g. flicker, dips, swells, harmonics, voltage unbalance and supply voltage variations). Figure 3.2 below shows an ex-ample for supply voltage variations.
The data are collected twice a year, each time for 1 week on several locations in the network.
The VSE will promote the use of their tool inthe future.
Case Study 10
800
600
400
200
0
100%
75%
50%
25%
0%
220
–
222
–
224
–
226
–
228
–
230
–
232
–
234
–
236
–
238
–
Num
ber o
f occ
uren
ces
RMS Voltage
FIGURE 3.2 I An example for supply voltage variations in Switzerland
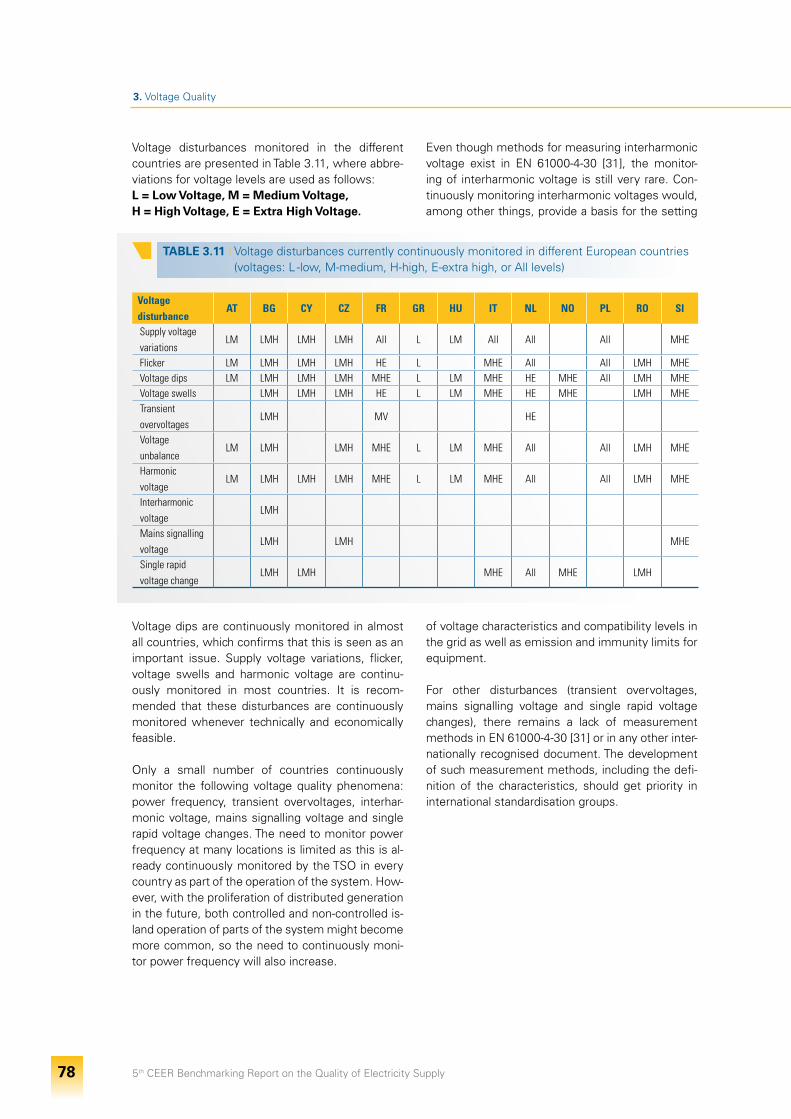
5th CEER Benchmarking Report on the Quality of Electricity Supply 78
3. Voltage Quality
Voltage disturbances monitored in the different countries are presented in Table 3.11, where abbre-viations for voltage levels are used as follows:L = Low Voltage, M = Medium Voltage,H = High Voltage, E = Extra High Voltage.
Voltage dips are continuously monitored in almost all countries, which confirms that this is seen as an important issue. Supply voltage variations, flicker, voltage swells and harmonic voltage are continu-ously monitored in most countries. It is recom-mended that these disturbances are continuously monitored whenever technically and economically feasible.
Only a small number of countries continuously monitor the following voltage quality phenomena: power frequency, transient overvoltages, interhar-monic voltage, mains signalling voltage and single rapid voltage changes. The need to monitor power frequency at many locations is limited as this is al-ready continuously monitored by the TSO in every country as part of the operation of the system. How-ever, with the proliferation of distributed generation in the future, both controlled and non-controlled is-land operation of parts of the system might become more common, so the need to continuously moni-tor power frequency will also increase.
Even though methods for measuring interharmonic voltage exist in EN 61000-4-30 [31], the monitor-ing of interharmonic voltage is still very rare. Con-tinuously monitoring interharmonic voltages would, among other things, provide a basis for the setting
of voltage characteristics and compatibility levels in the grid as well as emission and immunity limits for equipment.
For other disturbances (transient overvoltages, mains signalling voltage and single rapid voltage changes), there remains a lack of measurement methods in EN 61000-4-30 [31] or in any other inter-nationally recognised document. The development of such measurement methods, including the defi-nition of the characteristics, should get priority in international standardisation groups.
TABLE 3.11 I Voltage disturbances currently continuously monitored in different European countries (voltages: L -low, M-medium, H-high, E-extra high, or All levels)
Voltagedisturbance
AT BG CY CZ FR GR HU IT NL NO PL RO SI
Supply voltage variations
LM LMH LMH LMH All L LM All All All MHE
Flicker LM LMH LMH LMH HE L MHE All All LMH MHEVoltage dips LM LMH LMH LMH MHE L LM MHE HE MHE All LMH MHEVoltage swells LMH LMH LMH HE L LM MHE HE MHE LMH MHETransientovervoltages
LMH MV HE
Voltageunbalance
LM LMH LMH MHE L LM MHE All All LMH MHE
Harmonicvoltage
LM LMH LMH LMH MHE L LM MHE All All LMH MHE
Interharmonic voltage
LMH
Mains signalling voltage
LMH LMH MHE
Single rapidvoltage change
LMH LMH MHE All MHE LMH
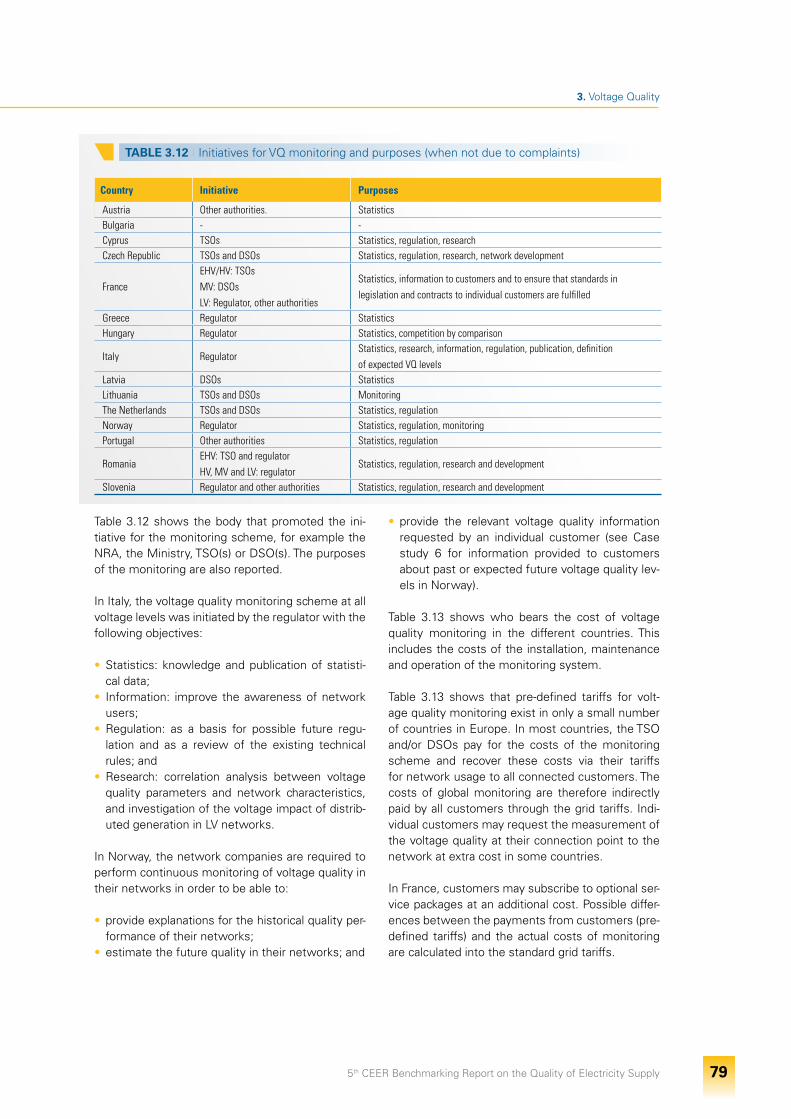
5th CEER Benchmarking Report on the Quality of Electricity Supply 79
3. Voltage Quality
Table 3.12 shows the body that promoted the ini-tiative for the monitoring scheme, for example the NRA, the Ministry, TSO(s) or DSO(s). The purposes of the monitoring are also reported.
In Italy, the voltage quality monitoring scheme at all voltage levels was initiated by the regulator with the following objectives:
• Statistics: knowledge and publication of statisti-cal data;
• Information: improve the awareness of network users;
• Regulation: as a basis for possible future regu-lation and as a review of the existing technical rules; and
• Research: correlation analysis between voltage quality parameters and network characteristics, and investigation of the voltage impact of distrib-uted generation in LV networks.
In Norway, the network companies are required to perform continuous monitoring of voltage quality in their networks in order to be able to:
• provide explanations for the historical quality per-formance of their networks;
• estimate the future quality in their networks; and
• provide the relevant voltage quality information requested by an individual customer (see Case study 6 for information provided to customers about past or expected future voltage quality lev-els in Norway).
Table 3.13 shows who bears the cost of voltage quality monitoring in the different countries. This includes the costs of the installation, maintenance and operation of the monitoring system.
Table 3.13 shows that pre-defined tariffs for volt-age quality monitoring exist in only a small number of countries in Europe. In most countries, the TSO and/or DSOs pay for the costs of the monitoring scheme and recover these costs via their tariffs for network usage to all connected customers. The costs of global monitoring are therefore indirectly paid by all customers through the grid tariffs. Indi-vidual customers may request the measurement of the voltage quality at their connection point to the network at extra cost in some countries.
In France, customers may subscribe to optional ser-vice packages at an additional cost. Possible differ-ences between the payments from customers (pre-defined tariffs) and the actual costs of monitoring are calculated into the standard grid tariffs.
TABLE 3.12 I Initiatives for VQ monitoring and purposes (when not due to complaints)
Country Initiative Purposes
Austria Other authorities. Statistics Bulgaria - -Cyprus TSOs Statistics, regulation, researchCzech Republic TSOs and DSOs Statistics, regulation, research, network development
FranceEHV/HV: TSOsMV: DSOsLV: Regulator, other authorities
Statistics, information to customers and to ensure that standards inlegislation and contracts to individual customers are fulfilled
Greece Regulator StatisticsHungary Regulator Statistics, competition by comparison
Italy RegulatorStatistics, research, information, regulation, publication, definitionof expected VQ levels
Latvia DSOs StatisticsLithuania TSOs and DSOs MonitoringThe Netherlands TSOs and DSOs Statistics, regulationNorway Regulator Statistics, regulation, monitoringPortugal Other authorities Statistics, regulation
RomaniaEHV: TSO and regulatorHV, MV and LV: regulator
Statistics, regulation, research and development
Slovenia Regulator and other authorities Statistics, regulation, research and development
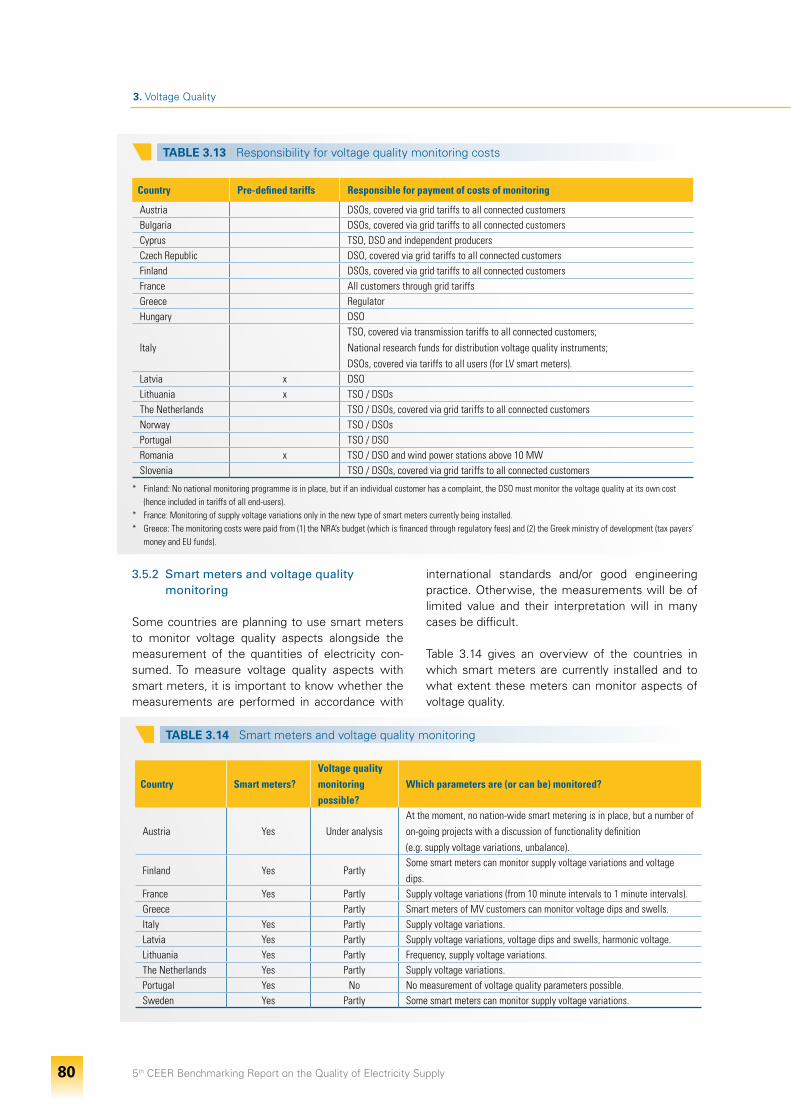
5th CEER Benchmarking Report on the Quality of Electricity Supply 80
3. Voltage Quality
TABLE 3.13 I Responsibility for voltage quality monitoring costs
Country Pre-defined tariffs Responsible for payment of costs of monitoring
Austria DSOs, covered via grid tariffs to all connected customersBulgaria DSOs, covered via grid tariffs to all connected customersCyprus TSO, DSO and independent producersCzech Republic DSO, covered via grid tariffs to all connected customersFinland DSOs, covered via grid tariffs to all connected customersFrance All customers through grid tariffsGreece RegulatorHungary DSO
ItalyTSO, covered via transmission tariffs to all connected customers;National research funds for distribution voltage quality instruments;DSOs, covered via tariffs to all users (for LV smart meters).
Latvia x DSO Lithuania x TSO / DSOsThe Netherlands TSO / DSOs, covered via grid tariffs to all connected customersNorway TSO / DSOsPortugal TSO / DSORomania x TSO / DSO and wind power stations above 10 MWSlovenia TSO / DSOs, covered via grid tariffs to all connected customers
* Finland: No national monitoring programme is in place, but if an individual customer has a complaint, the DSO must monitor the voltage quality at its own cost (hence included in tariffs of all end-users).
* France: Monitoring of supply voltage variations only in the new type of smart meters currently being installed.* Greece: The monitoring costs were paid from (1) the NRA’s budget (which is financed through regulatory fees) and (2) the Greek ministry of development (tax payers’
money and EU funds).
3.5.2 Smart meters and voltage quality monitoring
Some countries are planning to use smart meters to monitor voltage quality aspects alongside the measurement of the quantities of electricity con-sumed. To measure voltage quality aspects with smart meters, it is important to know whether the measurements are performed in accordance with
international standards and/or good engineering practice. Otherwise, the measurements will be of limited value and their interpretation will in many cases be difficult.
Table 3.14 gives an overview of the countries in which smart meters are currently installed and to what extent these meters can monitor aspects of voltage quality.
TABLE 3.14 I Smart meters and voltage quality monitoring
Country Smart meters?Voltage qualitymonitoring possible?
Which parameters are (or can be) monitored?
Austria Yes Under analysisAt the moment, no nation-wide smart metering is in place, but a number of on-going projects with a discussion of functionality definition(e.g. supply voltage variations, unbalance).
Finland Yes PartlySome smart meters can monitor supply voltage variations and voltage dips.
France Yes Partly Supply voltage variations (from 10 minute intervals to 1 minute intervals).Greece Partly Smart meters of MV customers can monitor voltage dips and swells.Italy Yes Partly Supply voltage variations.Latvia Yes Partly Supply voltage variations, voltage dips and swells, harmonic voltage.Lithuania Yes Partly Frequency, supply voltage variations.The Netherlands Yes Partly Supply voltage variations.Portugal Yes No No measurement of voltage quality parameters possible.Sweden Yes Partly Some smart meters can monitor supply voltage variations.
5th CEER Benchmarking Report on the Quality of Electricity Supply 81
3. Voltage Quality
Table 3.14 shows that in most countries smart me-ters are able to measure supply voltage variations. Also, the measurement of voltage dips and swells by smart meters is fairly common.
In France, with the development of Automated Meter Management (AMM) systems, it will soon be possible to precisely monitor both interruptions and voltage variations on LV networks. For each LV customer, the date and the duration of (1) long interruptions, (2) short interruptions, (3) large volt-age variations (i.e. 10-minute average above 110% or below 90% of the nominal voltage) will be au-tomatically recorded and transmitted to the DSO. 250,000 experimental smart meters were already installed in 2010. The Government has validated the experimentation and from 2013/2014 smart meters will progressively replace old meters; 80% of cus-tomers should be equipped by 2020.
In Italy, all smart meters for LV customers (around 35 million, deployment rate about 95%) must be able to record and collect measurements relevant to supply voltage variations according to EN 50160. An initial monitoring campaign (involving more than 50,000 meters) was carried out in January 2010 at the regulator’s request, when the preparation of the quality of supply regulation, to be enforced in 2012, was started. The question of how the future monitoring campaign shall be undertaken is under consultation (for instance, sample of about 1% of smart meters selected by the national regulator, in-formation on the selected smart meters to be com-municated to the DSOs 6 months in advance of the measurements, selection of 4 weeks including win-ter/summer peak and minimum load conditions).
In The Netherlands, the association of network op-erators Netbeheer Nederland has, in close coop-eration with the TSO and DSOs and KEMA, defined several requirements for smart meters that are re-lated to power quality. These requirements are not mandatory by law, but are used in the tenders for smart meters. In The Netherlands, it will be possible to perform measurements of at least the magnitude of the supply voltage with all new smart meters for LV customers.
3.5.3 Indicators for voltage dips
Clear and consistent definitions of voltage dip indi-ces are necessary in order to be able to interpret the results from measurement campaigns and to be able to effectively enforce limits. The calculation of voltage dip indices consists of 3 stages:
i. Calculation of the “dip characteristics” (also known as “single-event indices”) from the sam-pled voltage waveform. This calculation is often performed by the monitoring instrument;
ii. Calculation of the “site indices”, typically the num-ber of dips per year with certain characteristics; and
iii. Calculation of the “system indices”, for example the average number of dips per year per site.
Below, these 3 levels of indices will be discussed in more detail, including their definition in international standards and similar documents and the current practice in Europe.
3.5.3.1 Dip characteristics
The dip characteristics are calculated from the sam-pled voltage waveform. In most cases, this calcula-tion takes place in the monitoring instrument and the user of the instrument cannot further influence this calculation. The resulting characteristics and in-dices depend strongly on whether the line-to-neu-tral or the line-to-line voltages are used as input to the calculation.
The following voltages are to be used according to EN 50160 [22]:
• On LV networks, for four-wire three-phase systems, the line-to-neutral voltages shall be considered;
• On LV networks, for three-wire three-phase sys-tems the line-to-line voltages shall be considered;
• On LV networks, in the case of a single-phase connection, the supply voltage (line-to-line or line-to-neutral, according to the network user connec-tion) shall be considered; and
• Typically, on MV and HV networks, the line-to-line voltages shall be considered.
The recommendations in CIGRE TB 412 [25] are along the same lines, where it is explained that us-ing phase-to-phase voltages to obtain voltage dip statistics in MV and HV networks gives the most relevant information on voltage dips as experienced at the terminals of end-user equipment.
In some surveys, including some of the surveys of which the results are presented in this report, the phase-to-neutral voltages are used for MV and HV networks. This can have a significant impact on the voltage dip statistics. Earth faults in non-solidly earthed systems (a common practice in European countries) cause a low phase-to-neutral voltage whereas the phase-to-phase voltage only shows a minor drop in voltage, with the residual voltage of-
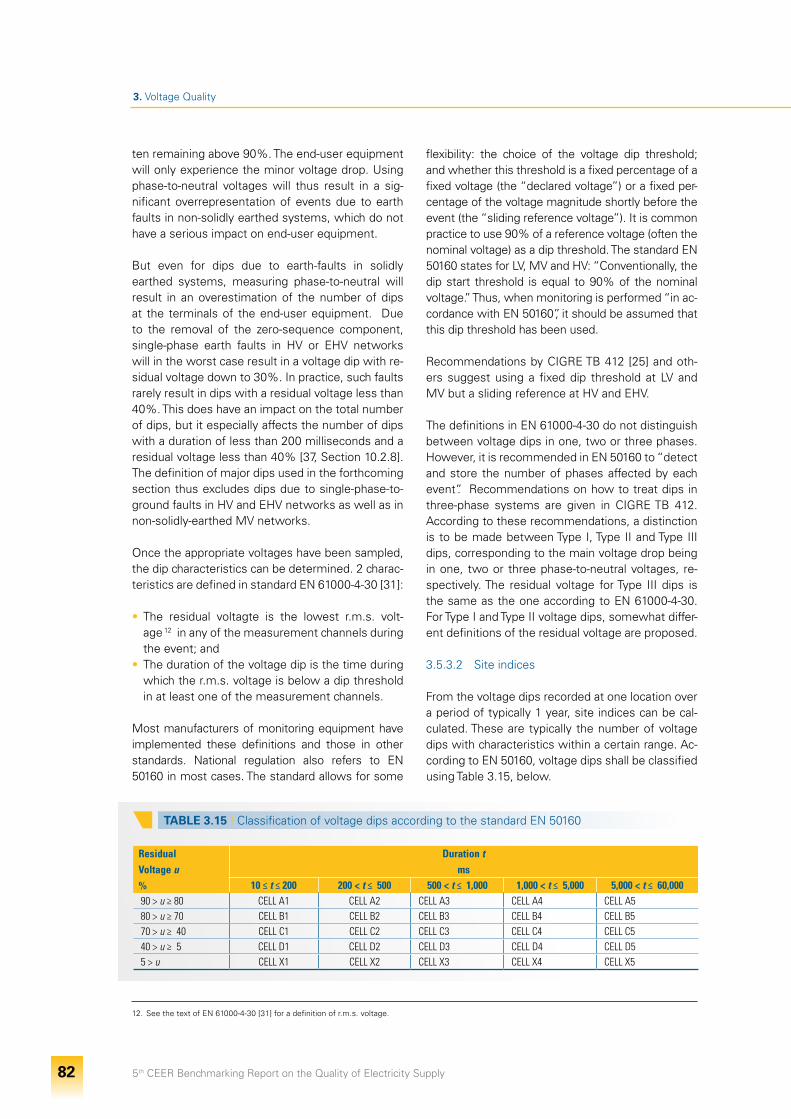
5th CEER Benchmarking Report on the Quality of Electricity Supply 82
3. Voltage Quality
ten remaining above 90%. The end-user equipment will only experience the minor voltage drop. Using phase-to-neutral voltages will thus result in a sig-nificant overrepresentation of events due to earth faults in non-solidly earthed systems, which do not have a serious impact on end-user equipment.
But even for dips due to earth-faults in solidly earthed systems, measuring phase-to-neutral will result in an overestimation of the number of dips at the terminals of the end-user equipment. Due to the removal of the zero-sequence component, single-phase earth faults in HV or EHV networks will in the worst case result in a voltage dip with re-sidual voltage down to 30%. In practice, such faults rarely result in dips with a residual voltage less than 40%. This does have an impact on the total number of dips, but it especially affects the number of dips with a duration of less than 200 milliseconds and a residual voltage less than 40% [37, Section 10.2.8]. The definition of major dips used in the forthcoming section thus excludes dips due to single-phase-to-ground faults in HV and EHV networks as well as in non-solidly-earthed MV networks.
Once the appropriate voltages have been sampled, the dip characteristics can be determined. 2 charac-teristics are defined in standard EN 61000-4-30 [31]:
• The residual voltagte is the lowest r.m.s. volt-age 12 in any of the measurement channels during the event; and
• The duration of the voltage dip is the time during which the r.m.s. voltage is below a dip threshold in at least one of the measurement channels.
Most manufacturers of monitoring equipment have implemented these definitions and those in other standards. National regulation also refers to EN 50160 in most cases. The standard allows for some
flexibility: the choice of the voltage dip threshold; and whether this threshold is a fixed percentage of a fixed voltage (the “declared voltage”) or a fixed per-centage of the voltage magnitude shortly before the event (the “sliding reference voltage”). It is common practice to use 90% of a reference voltage (often the nominal voltage) as a dip threshold. The standard EN 50160 states for LV, MV and HV: “Conventionally, the dip start threshold is equal to 90% of the nominal voltage.” Thus, when monitoring is performed “in ac-cordance with EN 50160”, it should be assumed that this dip threshold has been used.
Recommendations by CIGRE TB 412 [25] and oth-ers suggest using a fixed dip threshold at LV and MV but a sliding reference at HV and EHV.
The definitions in EN 61000-4-30 do not distinguish between voltage dips in one, two or three phases. However, it is recommended in EN 50160 to “detect and store the number of phases affected by each event”. Recommendations on how to treat dips in three-phase systems are given in CIGRE TB 412. According to these recommendations, a distinction is to be made between Type I, Type II and Type III dips, corresponding to the main voltage drop being in one, two or three phase-to-neutral voltages, re-spectively. The residual voltage for Type III dips is the same as the one according to EN 61000-4-30. For Type I and Type II voltage dips, somewhat differ-ent definitions of the residual voltage are proposed.
3.5.3.2 Site indices
From the voltage dips recorded at one location over a period of typically 1 year, site indices can be cal-culated. These are typically the number of voltage dips with characteristics within a certain range. Ac-cording to EN 50160, voltage dips shall be classified using Table 3.15, below.
12. See the text of EN 61000-4-30 [31] for a definition of r.m.s. voltage.
TABLE 3.15 I Classification of voltage dips according to the standard EN 50160
Residual Voltage u%
Duration tms
10 ≤ t ≤ 200 200 < t ≤ 500 500 < t ≤ 1,000 1,000 < t ≤ 5,000 5,000 < t ≤ 60,00090 > u ≥ 80 CELL A1 CELL A2 CELL A3 CELL A4 CELL A580 > u ≥ 70 CELL B1 CELL B2 CELL B3 CELL B4 CELL B570 > u ≥ 40 CELL C1 CELL C2 CELL C3 CELL C4 CELL C540 > u ≥ 5 CELL D1 CELL D2 CELL D3 CELL D4 CELL D55 > u CELL X1 CELL X2 CELL X3 CELL X4 CELL X5
5th CEER Benchmarking Report on the Quality of Electricity Supply 83
3. Voltage Quality
For each of the cells in Table 3.15, the number of events per year is presented. To obtain this num-ber of events, 2 levels of aggregation are needed: poly-phase aggregation (any difference in treatment for voltage dips in one, two and three phases); and time aggregation (any difference in treatment for multiple dips based on the time elapsed between these events).
According to EN 50160, poly-phase aggregation concerns the definition of an equivalent event char-acterised by a single duration and a single residual voltage. The general interpretation of this is that all voltage dips should be treated in the same way, independently of whether the voltage drop takes place in one, two or three phase-to-neutral voltag-es. However, the formulation in EN 50160 does not rule out the calculation of separate site indices for voltage dips affecting a different number of phase-to-neutral voltages.
Time aggregation remains a matter of disagree-ment and an issue that still has not been solved. In EN 50160 it is stated that “the method used for the aggregation of multiple events can be set according to the final use of the data”; further reference is made to IEC/TR 61000 2-8 [29]. Time aggregation is also discussed in CIGRE TB 261 [35] and CIGRE TB 412. From the information obtained by CEER, it has been concluded that no time aggregation is used in any of the surveys 13. Thus, each voltage dip is counted even if it occurs shortly after another dip.
Instead of, or alongside the statistics according to the voltage dip table, other site indices can be calcu-lated. This typically concerns the number of voltage dips per year more severe than the residual voltage and the duration according to a certain curve.
13. Only in Italy (transmission), a minimum time of 0.1 second is indicated between different voltage dips.
Calculation of voltage dip indices for transmission networks in Italy
Under the Italian regulation, the number of voltage dips is monitored and publicly reported by the TSO for the voltage levels, 132-150 kV, 220 kV and 380 kV. Two site-indices are calculated:
• The number of dips per year with a residual volt-age below 70% and a duration more than 500 ms, including interruption with a duration be-tween 500 ms and 1 minute. In terms of Table 3.15 this corresponds to the following cells: C3, C4, C5, D3, D4, D5, X3, X4, and X5; and
• The total number of dips per year with a residual voltage below 90%. This corresponds to all cells in Table 3.15.
A distinction is made between events where only one phase-to-neutral voltage drops below 90% (“single-phase dips”) and events where more than one phase-to-neutral voltage drops below 90% (“poly-phase dips”). For poly-phase dips the dura-tion is determined for the phase with the lowest residual voltage.
The TSO annually sets thresholds for the number of single-phase and poly-phase dips (so called “expect-ed voltage quality levels”). The 4 indices obtained from monitoring are compared with the thresholds. The NRA is not involved in the setting of these thresholds and there are no sanctions or penalties attached when the thresholds are exceeded.
Case Study 11
5th CEER Benchmarking Report on the Quality of Electricity Supply 84
3. Voltage Quality
14. For more details see [24].15. For a description of the contour chart see, among others, IEEE Std. 1346-1998 [34], CIGRE Report 261 [35], Section 2.4, and CIGRE Technical Brochure TB
412 [25], Chapter 6
Proposed voltage dip indices for distribution networks in Italy
The Italian regulator recently proposed a number of voltage dip site indices to be used for distribution networks. 3 of the proposed indices are based on the counting of events:
• The total number of dips per year with a residual voltage below 90% (all cells in Table 3.15);
• The number of dips per year below a curve de-fined by the Class 2 testing levels in EN 61000-4-11 [30] and EN 61000-4-34 [41] (all cells except A1,A2,B1 and B2 in Table 3.15); and
• The number of dips per year below a curve de-fined by the Class 3 testing levels in EN 61000-4-11 and EN 61000-4-34 (all cells except A1, A2, A3, A4, B1, B2, and C1 in Table 3.15).
The “regulated dip-frequency index” is the average of the last 2 indices above.
Other site indices are based on defining a single dip characteristic that quantifies the severity for each individual voltage dip event based on its expected impact on customer installations and equipment in those installations. The site index is calculated as the sum of the severities for all events that occurred during 1 year. 3 different types of dip characteristics are proposed:
• The “discrete severity indices” compare the volt-age drop with the voltage drop for a reference curve 14; for a dip on the curve the value of the
index is equal to 1, below the curve the value is higher than 1 as such a dip is more severe, above the curve the value is less than 1. 2 different refer-ence curves are proposed, based on the Class 2 and Class 3 testing levels in EN 61000-4-11 and EN 61000-4-34.
• The “missing voltage time indices” calculate the severity of a voltage dip event as the product of the voltage drop and the duration. 3 options are proposed here: counting all dips; counting only dips below a curve defined by the Class 2 test-ing levels in EN 61000-4-11 and EN 61000-4-34; or counting only dips below a curve defined by the Class 3 testing levels in EN 61000-4-11 and EN 61000-4-34; and
• The “missing voltage time area indices” where the product of voltage drop and duration is divid-ed by a reference value (100 pu.ms) and all events with a resulting value below 1 are not counted.
It is further proposed to use the average of the “reg-ulated dip-frequency index” over all monitored sites as a system index and to present the results for in-dividual sites as well as for the system as a whole in the form of voltage dip tables (as in Table 3.15, according to EN 50160) and as a contour chart 15.
Case Study 12
3.5.3.3 System indices
When the site indices are available at a sufficient number of locations, so called “system indices” can be determined. The system indices can be the average of the site indices over all sites (with or without the use of weighting factors) or a percentile value of the site indices.
According to the recommendations given in CIGRE TB 412 [25] a number of percentile values should be used, for example the 25%, 50%, 75%, 90% and 95% values.
In France, as well as in Italy, both the averages over all sites and the 95% values are calculated. In Hun-gary and The Netherlands, only the averages over all sites are calculated.
3.5.4 Actual data on voltage dips
In this section, data reported by 5 countries (France, Hungary, Italy, The Netherlands and Portugal) is pre-sented. In order to increase the comparability of the voltage quality data, only data for voltage dips has been included in this section. More specifically, this section focuses on major voltage dips, which
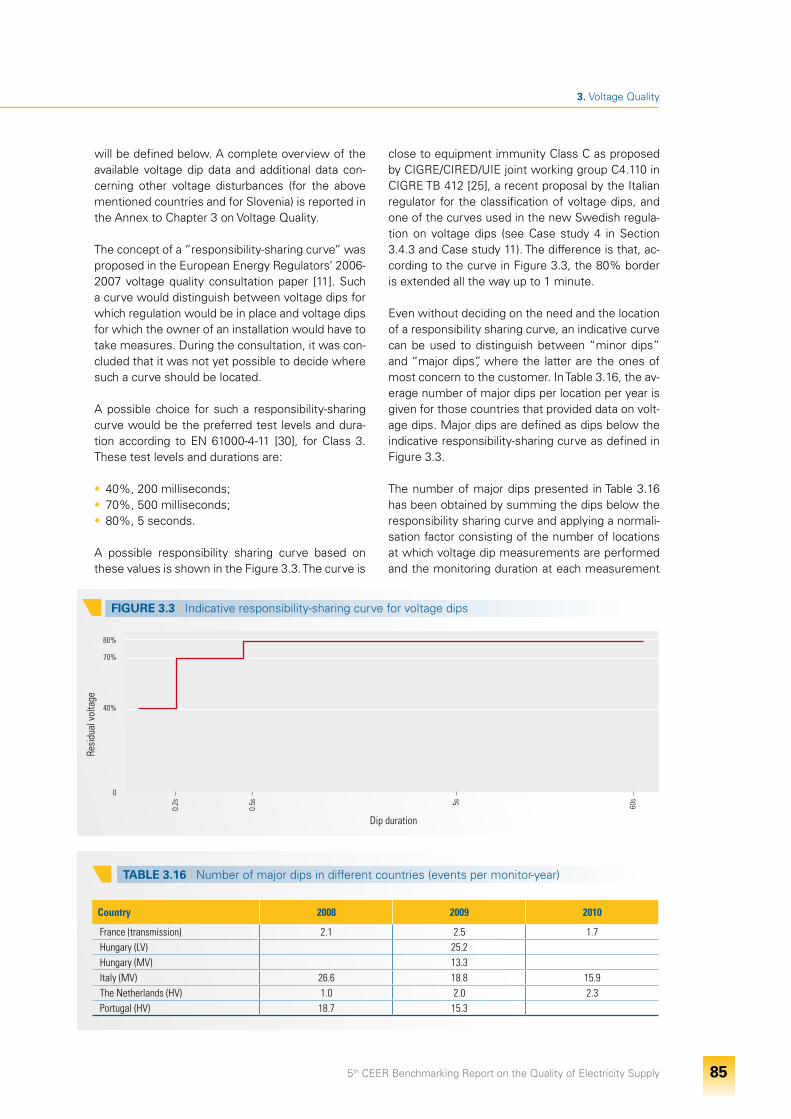
5th CEER Benchmarking Report on the Quality of Electricity Supply 85
3. Voltage Quality
will be defined below. A complete overview of the available voltage dip data and additional data con-cerning other voltage disturbances (for the above mentioned countries and for Slovenia) is reported in the Annex to Chapter 3 on Voltage Quality.
The concept of a ”responsibility-sharing curve” was proposed in the European Energy Regulators’ 2006-2007 voltage quality consultation paper [11]. Such a curve would distinguish between voltage dips for which regulation would be in place and voltage dips for which the owner of an installation would have to take measures. During the consultation, it was con-cluded that it was not yet possible to decide where such a curve should be located.
A possible choice for such a responsibility-sharing curve would be the preferred test levels and dura-tion according to EN 61000-4-11 [30], for Class 3. These test levels and durations are:
• 40%, 200 milliseconds;• 70%, 500 milliseconds;• 80%, 5 seconds.
A possible responsibility sharing curve based on these values is shown in the Figure 3.3. The curve is
close to equipment immunity Class C as proposed by CIGRE/CIRED/UIE joint working group C4.110 in CIGRE TB 412 [25], a recent proposal by the Italian regulator for the classification of voltage dips, and one of the curves used in the new Swedish regula-tion on voltage dips (see Case study 4 in Section 3.4.3 and Case study 11). The difference is that, ac-cording to the curve in Figure 3.3, the 80% border is extended all the way up to 1 minute.
Even without deciding on the need and the location of a responsibility sharing curve, an indicative curve can be used to distinguish between “minor dips” and “major dips”, where the latter are the ones of most concern to the customer. In Table 3.16, the av-erage number of major dips per location per year is given for those countries that provided data on volt-age dips. Major dips are defined as dips below the indicative responsibility-sharing curve as defined in Figure 3.3.
The number of major dips presented in Table 3.16 has been obtained by summing the dips below the responsibility sharing curve and applying a normali-sation factor consisting of the number of locations at which voltage dip measurements are performed and the monitoring duration at each measurement
FIGURE 3.3 I Indicative responsibility-sharing curve for voltage dips
80%
70%
40%
0
0.2s
0.5s 5s 60
s
Resi
dual
vol
tage
Dip duration
TABLE 3.16 I Number of major dips in different countries (events per monitor-year)
Country 2008 2009 2010
France (transmission) 2.1 2.5 1.7Hungary (LV) 25.2Hungary (MV) 13.3Italy (MV) 26.6 18.8 15.9The Netherlands (HV) 1.0 2.0 2.3Portugal (HV) 18.7 15.3
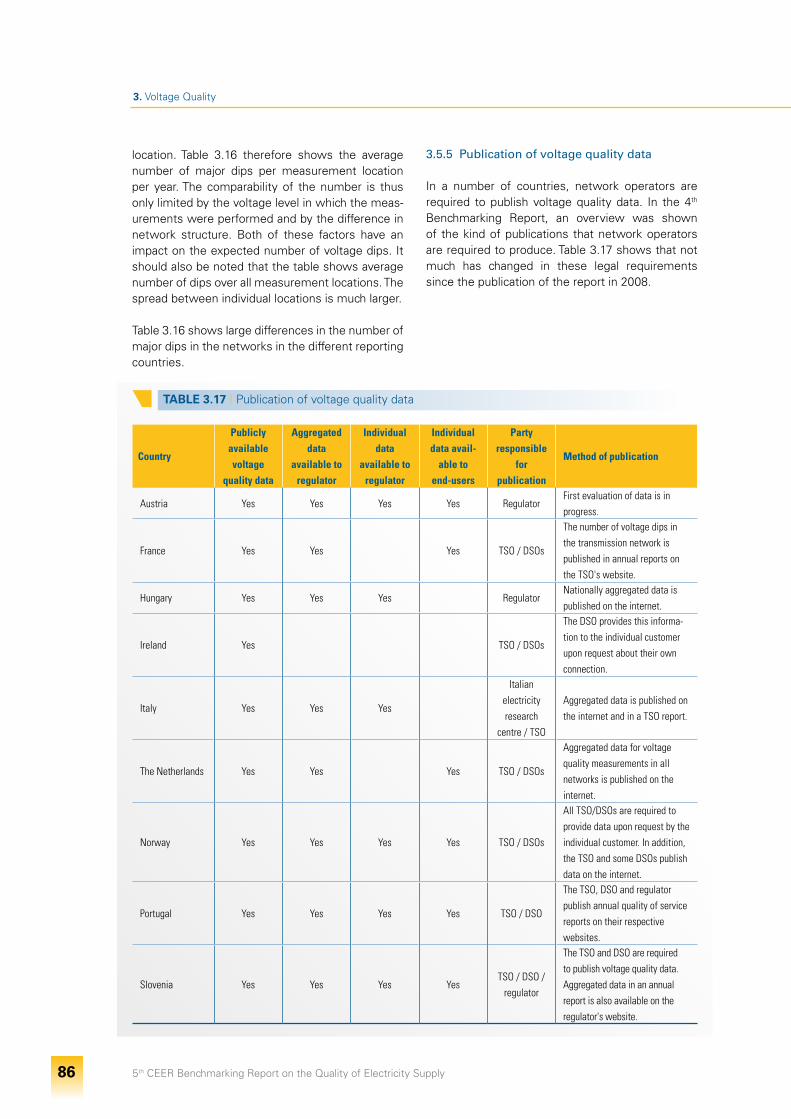
5th CEER Benchmarking Report on the Quality of Electricity Supply 86
3. Voltage Quality
location. Table 3.16 therefore shows the average number of major dips per measurement location per year. The comparability of the number is thus only limited by the voltage level in which the meas-urements were performed and by the difference in network structure. Both of these factors have an impact on the expected number of voltage dips. It should also be noted that the table shows average number of dips over all measurement locations. The spread between individual locations is much larger.
Table 3.16 shows large differences in the number of major dips in the networks in the different reporting countries.
3.5.5 Publication of voltage quality data
In a number of countries, network operators are required to publish voltage quality data. In the 4th
Benchmarking Report, an overview was shown of the kind of publications that network operators are required to produce. Table 3.17 shows that not much has changed in these legal requirements since the publication of the report in 2008.
TABLE 3.17 I Publication of voltage quality data
Country
Publiclyavailablevoltage
quality data
Aggregated data
available to regulator
Individual data
available to regulator
Individual data avail-
able to end-users
Partyresponsible
for publication
Method of publication
Austria Yes Yes Yes Yes RegulatorFirst evaluation of data is in progress.
France Yes Yes Yes TSO / DSOs
The number of voltage dips in the transmission network is published in annual reports on the TSO's website.
Hungary Yes Yes Yes RegulatorNationally aggregated data is published on the internet.
Ireland Yes TSO / DSOs
The DSO provides this informa-tion to the individual customer upon request about their own connection.
Italy Yes Yes Yes
Italian electricity research
centre / TSO
Aggregated data is published on the internet and in a TSO report.
The Netherlands Yes Yes Yes TSO / DSOs
Aggregated data for voltage quality measurements in all networks is published on the internet.
Norway Yes Yes Yes Yes TSO / DSOs
All TSO/DSOs are required to provide data upon request by the individual customer. In addition, the TSO and some DSOs publish data on the internet.
Portugal Yes Yes Yes Yes TSO / DSO
The TSO, DSO and regulator publish annual quality of service reports on their respective websites.
Slovenia Yes Yes Yes YesTSO / DSO /
regulator
The TSO and DSO are required to publish voltage quality data. Aggregated data in an annual report is also available on the regulator's website.
5th CEER Benchmarking Report on the Quality of Electricity Supply 87
3. Voltage Quality
Table 3.17 shows that for many countries in which voltage quality is monitored, at least some of the data obtained is publicly available. In addition, most regulators have access to at least aggregated data, if not to data for individual measuring points in the networks. In several countries, individual voltage quality data is also made available to customers. In most cases, the network operators (TSO and/or DSOs) are responsible for the publication of voltage quality data.
3.6 Findings and Recommendations on Voltage Quality
Finding #1Voltage characteristics are regulated through EN 50160 in combination with stricter national requirements
Five years of cooperation between CEER and CENELEC led to the publication of a new version of the standard EN 50160:2010 [22], with a number of positive elements, discussed in Section 3.4.1. The CEER survey reveals that EN 50160 is used in many countries. But a growing number of countries are setting national requirements on voltage qual-ity that deviate from EN 50160. In all cases, these requirements are stricter than those in EN 50160.
The impact of voltage quality disturbances on net-work users was further investigated by CEER in 2010, as described in Section 3.2. Guidelines of good practice were developed by CEER in the do-main of nationwide studies on the estimation of costs due to voltage quality disturbances.
Further improve EN 50160 as a harmonised instrument for voltage quality regulation
CEER retains the view that standard EN 50160 can be satisfactory from a regulatory point of view only if certain improvements are made. The main improvements needed are the following:
• An effective extension to the high voltage net-works (with effective limits and requirements) and the consideration of extra high voltage networks;
• The adoption of new limits for supply voltage variations in distribution networks (especially in low voltage networks);
• The introduction of limits for voltage events, taking into account the different characteristics of the European networks; one or more re-sponsibility-sharing curves should be defined for voltage dips and voltage swells; and
• A general framework for sharing the voltage quality responsibilities between network com-panies, equipment manufacturers and users.
Further, the need for proper regulation of voltage quality will increase in the future, taking account of the possible large-scale implementation of distributed generation.
CEER believes that harmonised voltage quality requirements are necessary. Unless the imple-mentation of the above-mentioned improve-ments starts as soon as possible, standard EN 50160 will miss its objective to harmonise the voltage quality standards and performances across the European electricity networks, due to the fact that national deviations will increase further, as discussed in Section 3.4.3. Further strengthening of the voltage quality regulation in the individual countries, followed by attempts to harmonise this, would be the only alternative.
Recommendation #1A
Perform cost-estimation studies of voltage disturbances
The results from cost-estimation studies on customer costs due to various voltage quality disturbances are an important input when decid-ing where to focus regulation. Therefore, NRAs should perform national cost-estimation studies regarding voltage disturbances.
Recommendation #1B
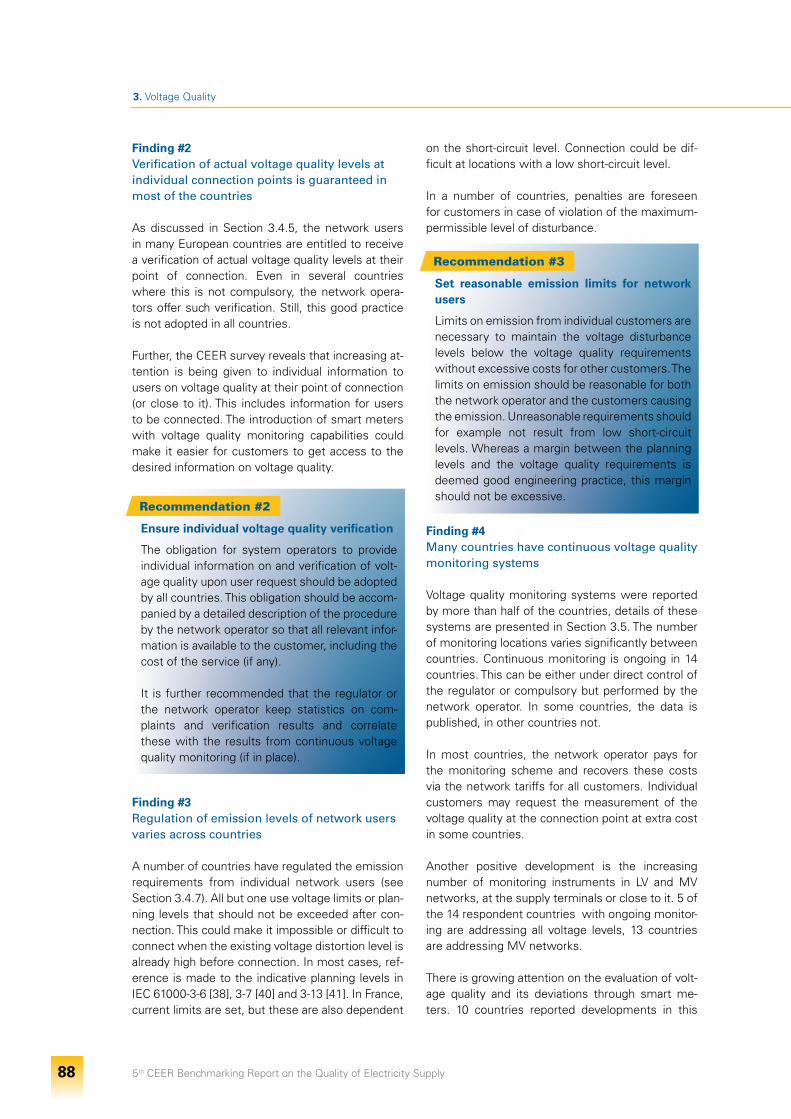
5th CEER Benchmarking Report on the Quality of Electricity Supply 88
3. Voltage Quality
Finding #2Verification of actual voltage quality levels at individual connection points is guaranteed in most of the countries
As discussed in Section 3.4.5, the network users in many European countries are entitled to receive a verification of actual voltage quality levels at their point of connection. Even in several countries where this is not compulsory, the network opera-tors offer such verification. Still, this good practice is not adopted in all countries.
Further, the CEER survey reveals that increasing at-tention is being given to individual information to users on voltage quality at their point of connection (or close to it). This includes information for users to be connected. The introduction of smart meters with voltage quality monitoring capabilities could make it easier for customers to get access to the desired information on voltage quality.
Finding #3Regulation of emission levels of network users varies across countries
A number of countries have regulated the emission requirements from individual network users (see Section 3.4.7). All but one use voltage limits or plan-ning levels that should not be exceeded after con-nection. This could make it impossible or difficult to connect when the existing voltage distortion level is already high before connection. In most cases, ref-erence is made to the indicative planning levels in IEC 61000-3-6 [38], 3-7 [40] and 3-13 [41]. In France, current limits are set, but these are also dependent
on the short-circuit level. Connection could be dif-ficult at locations with a low short-circuit level.
In a number of countries, penalties are foreseen for customers in case of violation of the maximum-permissible level of disturbance.
Finding #4Many countries have continuous voltage quality monitoring systems
Voltage quality monitoring systems were reported by more than half of the countries, details of these systems are presented in Section 3.5. The number of monitoring locations varies significantly between countries. Continuous monitoring is ongoing in 14 countries. This can be either under direct control of the regulator or compulsory but performed by the network operator. In some countries, the data is published, in other countries not.
In most countries, the network operator pays for the monitoring scheme and recovers these costs via the network tariffs for all customers. Individual customers may request the measurement of the voltage quality at the connection point at extra cost in some countries.
Another positive development is the increasing number of monitoring instruments in LV and MV networks, at the supply terminals or close to it. 5 of the 14 respondent countries with ongoing monitor-ing are addressing all voltage levels, 13 countries are addressing MV networks.
There is growing attention on the evaluation of volt-age quality and its deviations through smart me-ters. 10 countries reported developments in this
Ensure individual voltage quality verification
The obligation for system operators to provide individual information on and verification of volt-age quality upon user request should be adopted by all countries. This obligation should be accom-panied by a detailed description of the procedure by the network operator so that all relevant infor-mation is available to the customer, including the cost of the service (if any).
It is further recommended that the regulator or the network operator keep statistics on com-plaints and verification results and correlate these with the results from continuous voltage quality monitoring (if in place).
Recommendation #2
Set reasonable emission limits for network users
Limits on emission from individual customers are necessary to maintain the voltage disturbance levels below the voltage quality requirements without excessive costs for other customers. The limits on emission should be reasonable for both the network operator and the customers causing the emission. Unreasonable requirements should for example not result from low short-circuit levels. Whereas a margin between the planning levels and the voltage quality requirements is deemed good engineering practice, this margin should not be excessive.
Recommendation #3
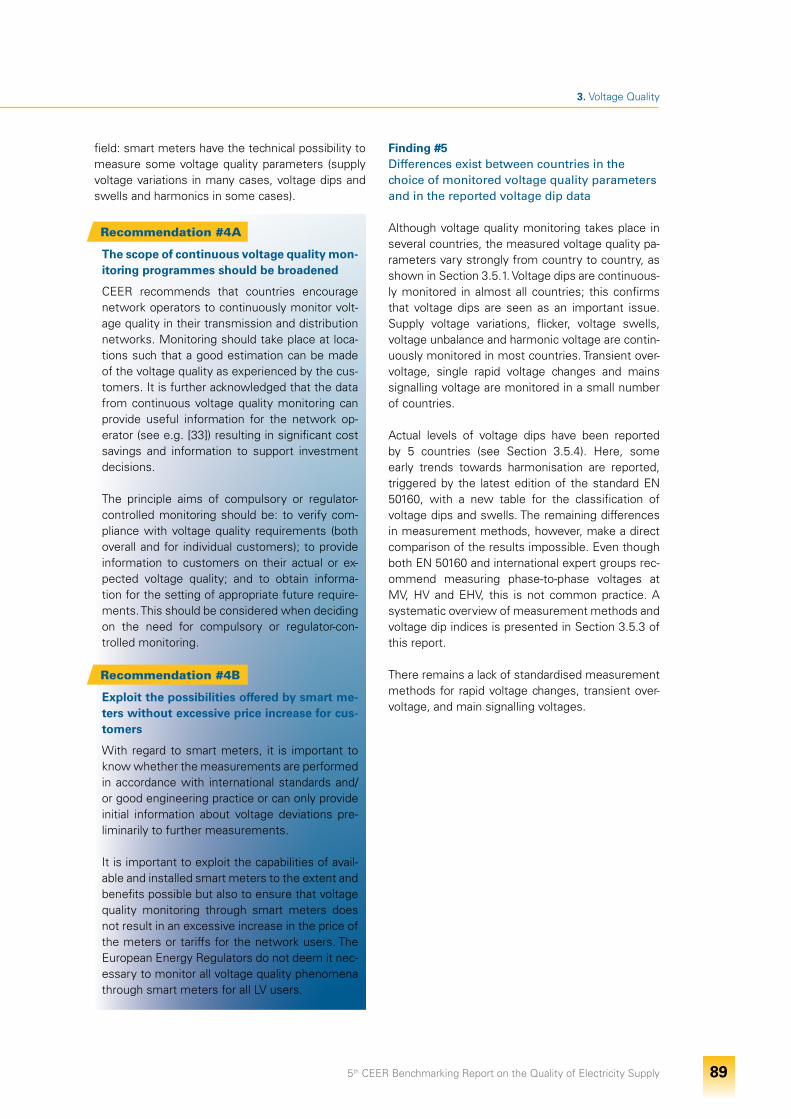
5th CEER Benchmarking Report on the Quality of Electricity Supply 89
3. Voltage Quality
field: smart meters have the technical possibility to measure some voltage quality parameters (supply voltage variations in many cases, voltage dips and swells and harmonics in some cases).
Finding #5Differences exist between countries in the choice of monitored voltage quality parameters and in the reported voltage dip data
Although voltage quality monitoring takes place in several countries, the measured voltage quality pa-rameters vary strongly from country to country, as shown in Section 3.5.1. Voltage dips are continuous-ly monitored in almost all countries; this confirms that voltage dips are seen as an important issue. Supply voltage variations, flicker, voltage swells, voltage unbalance and harmonic voltage are contin-uously monitored in most countries. Transient over-voltage, single rapid voltage changes and mains signalling voltage are monitored in a small number of countries.
Actual levels of voltage dips have been reported by 5 countries (see Section 3.5.4). Here, some early trends towards harmonisation are reported, triggered by the latest edition of the standard EN 50160, with a new table for the classification of voltage dips and swells. The remaining differences in measurement methods, however, make a direct comparison of the results impossible. Even though both EN 50160 and international expert groups rec-ommend measuring phase-to-phase voltages at MV, HV and EHV, this is not common practice. A systematic overview of measurement methods and voltage dip indices is presented in Section 3.5.3 of this report.
There remains a lack of standardised measurement methods for rapid voltage changes, transient over-voltage, and main signalling voltages.
The scope of continuous voltage quality mon-itoring programmes should be broadened
CEER recommends that countries encourage network operators to continuously monitor volt-age quality in their transmission and distribution networks. Monitoring should take place at loca-tions such that a good estimation can be made of the voltage quality as experienced by the cus-tomers. It is further acknowledged that the data from continuous voltage quality monitoring can provide useful information for the network op-erator (see e.g. [33]) resulting in significant cost savings and information to support investment decisions.
The principle aims of compulsory or regulator-controlled monitoring should be: to verify com-pliance with voltage quality requirements (both overall and for individual customers); to provide information to customers on their actual or ex-pected voltage quality; and to obtain informa-tion for the setting of appropriate future require-ments. This should be considered when deciding on the need for compulsory or regulator-con-trolled monitoring.
Recommendation #4A
Exploit the possibilities offered by smart me-ters without excessive price increase for cus-tomers
With regard to smart meters, it is important to know whether the measurements are performed in accordance with international standards and/or good engineering practice or can only provide initial information about voltage deviations pre-liminarily to further measurements.
It is important to exploit the capabilities of avail-able and installed smart meters to the extent and benefits possible but also to ensure that voltage quality monitoring through smart meters does not result in an excessive increase in the price of the meters or tariffs for the network users. The European Energy Regulators do not deem it nec-essary to monitor all voltage quality phenomena through smart meters for all LV users.
Recommendation #4B
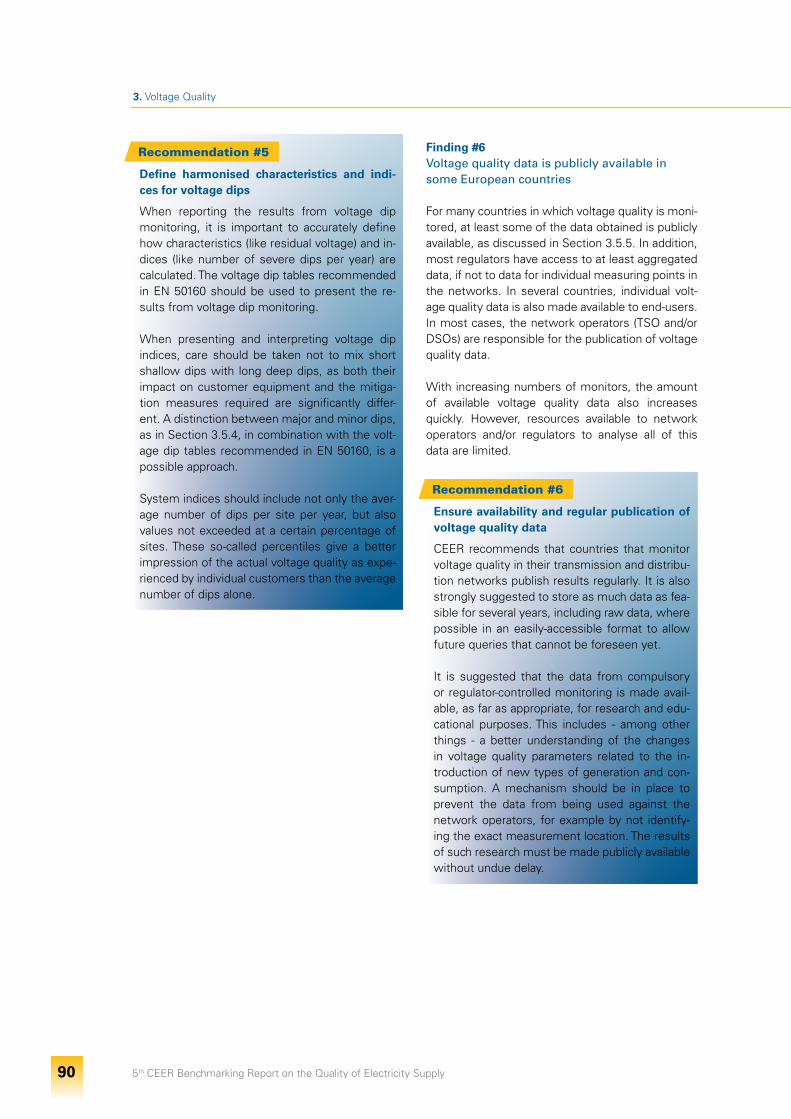
5th CEER Benchmarking Report on the Quality of Electricity Supply 90
3. Voltage Quality
Finding #6Voltage quality data is publicly available in some European countries
For many countries in which voltage quality is moni-tored, at least some of the data obtained is publicly available, as discussed in Section 3.5.5. In addition, most regulators have access to at least aggregated data, if not to data for individual measuring points in the networks. In several countries, individual volt-age quality data is also made available to end-users. In most cases, the network operators (TSO and/or DSOs) are responsible for the publication of voltage quality data.
With increasing numbers of monitors, the amount of available voltage quality data also increases quickly. However, resources available to network operators and/or regulators to analyse all of this data are limited.
Define harmonised characteristics and indi-ces for voltage dips
When reporting the results from voltage dip monitoring, it is important to accurately define how characteristics (like residual voltage) and in-dices (like number of severe dips per year) are calculated. The voltage dip tables recommended in EN 50160 should be used to present the re-sults from voltage dip monitoring.
When presenting and interpreting voltage dip indices, care should be taken not to mix short shallow dips with long deep dips, as both their impact on customer equipment and the mitiga-tion measures required are significantly differ-ent. A distinction between major and minor dips, as in Section 3.5.4, in combination with the volt-age dip tables recommended in EN 50160, is a possible approach.
System indices should include not only the aver-age number of dips per site per year, but also values not exceeded at a certain percentage of sites. These so-called percentiles give a better impression of the actual voltage quality as expe-rienced by individual customers than the average number of dips alone.
Recommendation #5
Ensure availability and regular publication of voltage quality data
CEER recommends that countries that monitor voltage quality in their transmission and distribu-tion networks publish results regularly. It is also strongly suggested to store as much data as fea-sible for several years, including raw data, where possible in an easily-accessible format to allow future queries that cannot be foreseen yet.
It is suggested that the data from compulsory or regulator-controlled monitoring is made avail-able, as far as appropriate, for research and edu-cational purposes. This includes - among other things - a better understanding of the changes in voltage quality parameters related to the in-troduction of new types of generation and con-sumption. A mechanism should be in place to prevent the data from being used against the network operators, for example by not identify-ing the exact measurement location. The results of such research must be made publicly available without undue delay.
Recommendation #6

5th CEER Benchmarking Report on the Quality of Electricity Supply 92
4.
Commercial Quality 4.1 What is Commercial Quality and why is it important to regulate it?
In a liberalised electricity market, the customer concludes either a single contract with the supplier (SP) or separate contracts with the supplier and the distribution system operator (DSO), according to the existing national regulations. In both cases, however, commercial quality is an important issue.
Commercial quality is directly associated to transac-tions between electricity companies (either DSOs or suppliers, or both) and customers, and covers not only the supply and sale of electricity, but also various forms of contacts established between elec-tricity companies and customers. There are several services that can be requested or expected by cus-tomers, such as new connections, increase of the connection capacity, disconnection upon customer’s request, meter reading and verification, repairs and elimination of voltage quality problems, answering phone calls, etc. Each of these services mentioned above is a transaction that involves some commer-cial quality aspect. The most frequent commercial quality aspect is the timeliness of services request-ed by customers. However, the definition of the term ’timeliness’ may vary from country to country.
Where it concerns the need for commercial qual-ity standards, a distinction between the deregu-
lated market of electrical energy and the regulated market of network operation should be made. The energy regulator normally does not intervene in the deregulated market as competition between retailers is expected to result in the sufficient qual-ity. However, in some cases, a certain level of cus-tomer protection is needed. Such protection can be provided through standards. The need for such pro-tection differs among different types of customers, where small domestic customers most likely need more protection.
Network operators (i.e. the regulated market) pos-sess a natural monopoly, free or almost free from competition. To ensure a sufficient level of quality, a set of Guaranteed Standards (GSs) and Over-all Standards (OSs) are needed. Another debated aspect is the incentive regulation for revenues of network operators. This price-regulation method (price/revenue cap, price formula and pricing period) provides the network companies with strong incen-tives to reduce their overall costs – this accounts also for operational expenditures and capital expen-ditures – in order to increase efficiency. A reduction of operational expenditures may result in a decline of the actual quality levels of network services or, at the very least, result in no improvement in line with customers’ expectations. This may easily be the re-sult in countries where the principle of incentive-based regulation in network price regulation is ei-
5th CEER Benchmarking Report on the Quality of Electricity Supply 93
ther just being developed or could be adopted in the near future, while no service quality standard exists or is supposed to be issued only at a later stage. Here, the involvement of customers and their rep-resentatives can make an important contribution to quality regulation; customer surveys can reveal both customer expectations and satisfaction with the current level of service as well as appropriate-ness of the regulation already in place.
There is also a question as to whether it is appropri-ate to maintain minimum standards with regard to supply when competition is fully developed, such that companies compete in providing services and performances which exceed these minimums. The fact is that some commercial quality aspects (e.g. times for connections) relate to distribution net-works and therefore, given their monopolistic na-ture, they should still be regulated.
Last but not least, an important call for regulation of commercial quality arises from the new EU legis-lative measures. Indeed, Directive 2009/72/EC [27] requires that Member States shall take appropriate measures to protect final customers, to ensure that they:
• Have a right to a contract with their electricity ser-vice provider that specifies:- the services provided, the service quality levels
offered, as well as the time for the initial con-nection;
- any compensation and the refund arrange-ments which apply if contracted service qual-ity levels are not met, including inaccurate and delayed billing;
- information relating to customer rights, includ-ing on the complaint handling and all of the information referred to in this point, clearly communicated through billing or the electricity undertaking’s website.
• Benefit from transparent, simple and inexpensive procedures for dealing with their complaints. In particular, all customers shall have the right to a good standard of service and complaint handling by their electricity service provider.
4.2 Main Conclusions from Past Activities of the European Energy Regulators on Commercial Quality
The chapter on commercial quality has been an inte-gral part of all Benchmarking Reports of CEER so far.
According to the definitions in the 1st Benchmarking Report (2001) [1] commercial quality concerns the quality of relationships between a supplier and a user. In this relationship, it is also very important that the potential customer should have the correct data regarding the conditions of network connec-tion even before using the service. It was obvious while drafting the 1st Benchmarking Report that commercial quality includes such a broad range of services that only some of them could be regulated based on the usual standards and measuring meth-odologies. The definitions of OS and GS were intro-duced for categorisation of the regulatory methods. The elemental difference between the 2 types of standards is the reimbursement for the customer that is peculiar to the GS, when the standard is not fulfilled. The internal questionnaire which was prepared for the 1st Benchmarking Report was completed by 6 countries, as a result the evalua-tion and the processing of the data did not cause significant difficulties. The evaluated 25 standards were organised around some concrete topics (e.g. access to the network, investigation of problems and complaints and communication personally, by phone or in writing). 4 countries out of 6 applied both types of standards, 1 country used only GSs and another 1 used individual standards without any compensation. The number of standards applied as guaranteed ranged between 6 and 11 in each single country and overall was between 1 and 9 in each single country. The values of the 7 most frequent GSs were evaluated one by one. The scale of com-pensation (15-33€) – to be paid automatically or by request in case of non-fulfilling the standards – was also presented.
A question arose during the preparation of the 2nd Benchmarking Report (2003) [2]: whether market liberalisation would make commercial quality regu-lation unnecessary. The questionnaire included 6 questions about this issue. The answers provided by the respondents on the latter issue raised the necessity of unbundling the regulations for the DSO and supplier. The Benchmarking Report points out that the number of regulations for suppliers has de-creased in countries with fully opened markets but it forecasts the opposite for the DSO. 10 countries answered the questionnaire. The questionnaire was aimed to survey actual data in order to provide the authors with the chance to make an international comparison. Due to country specificity of the data, this goal unfortunately could not be fully reached. The definitions of overall and guaranteed standards were determined as they are used nowadays. The in-
5th CEER Benchmarking Report on the Quality of Electricity Supply 94
4. Commercial Quality
coming answers showed that many countries were already using the standards. There were 4 countries where the number of OSs and GSs together was above 15. From the 25 standards that were involved in the survey, there were 9 which were applied in more than 5 countries. In most of the countries, the compensation was paid automatically.
The 3rd Benchmarking Report (2005) [3] aimed to measure the actual state of the regulation as widely as possible. The CEER questionnaire originally listed 24 standards and also allowed countries to specify any additional standards specific to them. As a result, 19 countries provided data for altogether 48 standards and there were also data for the actual level of appli-cation of 42 standards. The 14 most frequently used standards were evaluated in 5 groups. This survey in-volved the evaluation of data of Transmission System Operators (TSOs) for the first time. In respect of OS / GS and compensation to be paid automatically or by request, there was a rate shift in favour of GSs and the compensation to be paid automatically. Further-more, it was concluded that the regulatory authorities closely followed the level of the services provided to customers, still with significantly different sets of standards with different contents and implementation levels. The need for clarifying all specific indicators (e.g. how times are calculated) was highlighted. Also, CEER recommended that countries put in place GSs together with compensation to be paid automatically to the customer, where appropriate.
The wide list of standards led to a more focused approach when preparing the 4th Benchmarking Report [4] (2008). CEER adjusted the list of most common standards, by reformulating the names of some standards and including a new standard about “Time from notice-to-pay until disconnection”. 15 standards that were found as the most frequently used in 21 countries were evaluated in 4 groups. It was obvious that the majority (approx. 80%) of the regulations were related to the DSO. In addition to the two types of standards of the previous Bench-marking Reports, a new one was introduced, i.e. Other Available Requirements (OAR, see Section 4.4.3), as a form of regulation and it has become the most frequently used standard type. The pay-ment of the compensation is performed upon re-quest in the majority of the 9 responding countries. The questionnaire involved a new question-group in order to survey the full market opening regula-tion. Due to its novelty, the evaluation of the scarce data did not provide a representative result. In the communication between the licensee and the cus-
tomer, as well as in the method of gathering the measured data, a wider use of mobile phones and e-mail as well as the advantages provided by the smart meters also emerged. CEER acknowledged that regulations concerning these new issues were still in their infancy.
In the 4th Benchmarking Report, CEER recommend-ed that:
• Countries consider the usefulness of GSs tied to direct automatic compensation for non-compli-ance with the quality parameters or other regula-tory requirements with the possibility to impose sanctions, wherever information on the particular parameter makes it possible;
• National Regulatory Authorities (NRAs) consider developing procedures capable of measuring the performance of call centres and monitor the per-formance of the licensees in order to establish regulations.
The European Energy Regulators assessed in the recent years one important aspect of commercial quality - the treatment of customer complaints. The Guidelines of Good Practice (GGP) on customer complaint handling, reporting and classification [8] were published in 2010. The proposal of con-sumer complaints classification included as a first-level classification quality of supply issues, which is further broken down into continuity of supply complaints or voltage quality complaints as a sec-ond-level classification. The Status Review on im-plementation of the GGP on customer complaints (2011) [9] includes an overview of existing statutory complaint handling standards and recommenda-tions on how to set up these standards.
4.3 Structure of the Chapter on Commercial Quality
Taking into account the distinction between the deregulated market of electrical energy and the regulated market of network operation, the cur-rent 5th Benchmarking Report is more focused on commercial performance of the DSOs and less on commercial performance in the competitive sector of supply as compared to the past Benchmarking Reports. Due to this focus and to other ongoing activities of the European Energy Regulators, the impact of market opening on commercial quality is not discussed in this edition.
5th CEER Benchmarking Report on the Quality of Electricity Supply 95
4. Commercial Quality
The 5th Benchmarking Report adopts the same ap-proach as the 4th Benchmarking Report. First, it dis-cusses the main aspects of commercial quality and categorises standards into four groups (see Section 4.4.1), then it provides the list of standards which were surveyed (see Section 4.4.2) and the approaches for regulating commercial quality (see Section 4.4.3).
The contents of this chapter on commercial qual-ity are based on answers provided by 18 CEER countries16: Austria, the Czech Republic, Estonia, Finland, France, Greece, Hungary, Ireland, Italy, Lat-via, The Netherlands, Norway, Portugal, the Slovak Republic, Slovenia, Spain, Sweden and the United Kingdom17. In addition, Denmark indicated that the regulator does not set commercial quality stand-ards. Germany provided some additional informa-tion without any detailed data. The results of the benchmarking are presented in Section 4.5, organ-ised by main groups of commercial quality aspects. Attention is paid to the level of compensation to the customers (see Section 4.5.6).
For the first time, historical data for the 3-year pe-riod (2008-2010) since the 4th Benchmarking Report was surveyed. The actual data is presented in Sec-tion 4.6. Lastly, a summary of the benchmarking results is provided in Section 4.7.
4.4 Main Aspects of Commercial Quality
Commercial transactions between electricity com-panies and customers are traditionally classified as follows:
• Pre-contract transactions, such as information on connection to the network and prices associ-ated with the supply of electricity. These actions occur before the supply contract comes into force and incorporate actions by both the DSO and the supplier. Generally, customer rights with regard to such actions are set out in codes (such as Con-nection Agreements and the General Conditions of Supply Contracts) and are approved by the regula-tory authority or other governmental authorities;
• Transactions during the contract period, such as billing, payment arrangements and responses to customers’ queries, complaints and claims, or
repairs. These transactions occur regularly, like billing and meter readings or occasionally e.g. when the customer contacts the company with a query or a complaint.
The quality of service during these transactions can be measured for example by the time the electricity company needs in order to provide a proper reply. These transactions could relate to the DSO, the sup-plier, to the Universal Supplier (USP)18 or to the meter operator (MO) and could be regulated according to the regulatory framework of the particular country.
A recurring dilemma is the question of which cus-tomer class (voltage level) the regulation should focus on. In the 4th Benchmarking Report, beyond low voltage19 (LV), some respondents also supplied commercial quality data related to customers con-nected at medium voltage (MV) and high voltage (HV). As requirements set for MV and HV are con-siderably different from those at LV, the comparison did not result in useful information. For this reason, this chapter focuses on residential customers with a connection to the LV network because while this is the largest group of customers at the same time they have a small economic potential. However, all replies are shown in detail in the Annex to Chapter 4 on Commercial Quality.
4.4.1 Main groups of commercial quality aspects
In order to simplify the approach to such a complex matter as commercial quality, indicators relating to commercial quality have been classified into 4 main groups:• Connection (Group I);• Customer Care (Group II);• Technical Service (Group III);• Metering and Billing (Group IV).
4.4.2 Commercial quality standards and their definitions
Based on the list of the most commonly used stand-ards and recommendations from past CEER activi-ties on commercial quality (3rd and 4th Benchmark-ing Reports), a questionnaire was prepared with precise specifications towards the comparability of
16. There is a country whose data - due to delayed data provision – is not considered in the analysis, but can be found in the Part 1 of the Annex to Chapter 4. 17. The United Kingdom’s answers refer to Great Britain. 18. Universal suppliers exist in some countries in order to supply domestic and small customers who do not choose a supplier in the free market or who rely on their
supplier of last resort (in cases when the supplier fails to supply electricity for a variety of reasons).19. See Section 2.4.3 for the CEER classification of voltage levels.
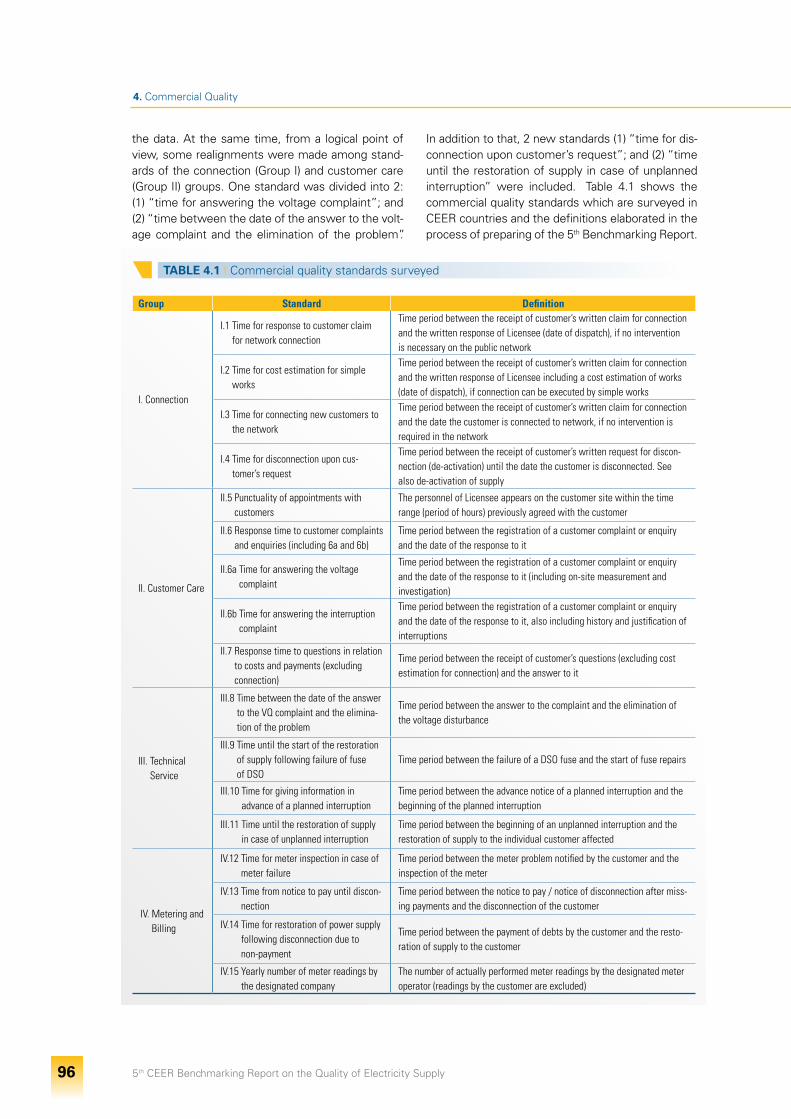
5th CEER Benchmarking Report on the Quality of Electricity Supply 96
4. Commercial Quality
the data. At the same time, from a logical point of view, some realignments were made among stand-ards of the connection (Group I) and customer care (Group II) groups. One standard was divided into 2: (1) “time for answering the voltage complaint”; and (2) “time between the date of the answer to the volt-age complaint and the elimination of the problem”.
In addition to that, 2 new standards (1) “time for dis-connection upon customer’s request”; and (2) “time until the restoration of supply in case of unplanned interruption” were included. Table 4.1 shows the commercial quality standards which are surveyed in CEER countries and the definitions elaborated in the process of preparing of the 5th Benchmarking Report.
TABLE 4.1 I Commercial quality standards surveyed
Group Standard Definition
I. Connection
I.1 Time for response to customer claim for network connection
Time period between the receipt of customer’s written claim for connection and the written response of Licensee (date of dispatch), if no intervention is necessary on the public network
I.2 Time for cost estimation for simple works
Time period between the receipt of customer’s written claim for connection and the written response of Licensee including a cost estimation of works (date of dispatch), if connection can be executed by simple works
I.3 Time for connecting new customers to the network
Time period between the receipt of customer’s written claim for connection and the date the customer is connected to network, if no intervention is required in the network
I.4 Time for disconnection upon cus-tomer’s request
Time period between the receipt of customer’s written request for discon-nection (de-activation) until the date the customer is disconnected. See also de-activation of supply
II. Customer Care
II.5 Punctuality of appointments with customers
The personnel of Licensee appears on the customer site within the time range (period of hours) previously agreed with the customer
II.6 Response time to customer complaints and enquiries (including 6a and 6b)
Time period between the registration of a customer complaint or enquiry and the date of the response to it
II.6a Time for answering the voltage complaint
Time period between the registration of a customer complaint or enquiry and the date of the response to it (including on-site measurement and investigation)
II.6b Time for answering the interruption complaint
Time period between the registration of a customer complaint or enquiry and the date of the response to it, also including history and justification of interruptions
II.7 Response time to questions in relation to costs and payments (excluding connection)
Time period between the receipt of customer’s questions (excluding cost estimation for connection) and the answer to it
III. Technical Service
III.8 Time between the date of the answer to the VQ complaint and the elimina-tion of the problem
Time period between the answer to the complaint and the elimination of the voltage disturbance
III.9 Time until the start of the restoration of supply following failure of fuse of DSO
Time period between the failure of a DSO fuse and the start of fuse repairs
III.10 Time for giving information in advance of a planned interruption
Time period between the advance notice of a planned interruption and the beginning of the planned interruption
III.11 Time until the restoration of supply in case of unplanned interruption
Time period between the beginning of an unplanned interruption and the restoration of supply to the individual customer affected
IV. Metering and Billing
IV.12 Time for meter inspection in case of meter failure
Time period between the meter problem notified by the customer and the inspection of the meter
IV.13 Time from notice to pay until discon-nection
Time period between the notice to pay / notice of disconnection after miss-ing payments and the disconnection of the customer
IV.14 Time for restoration of power supply following disconnection due to non-payment
Time period between the payment of debts by the customer and the resto-ration of supply to the customer
IV.15 Yearly number of meter readings by the designated company
The number of actually performed meter readings by the designated meter operator (readings by the customer are excluded)
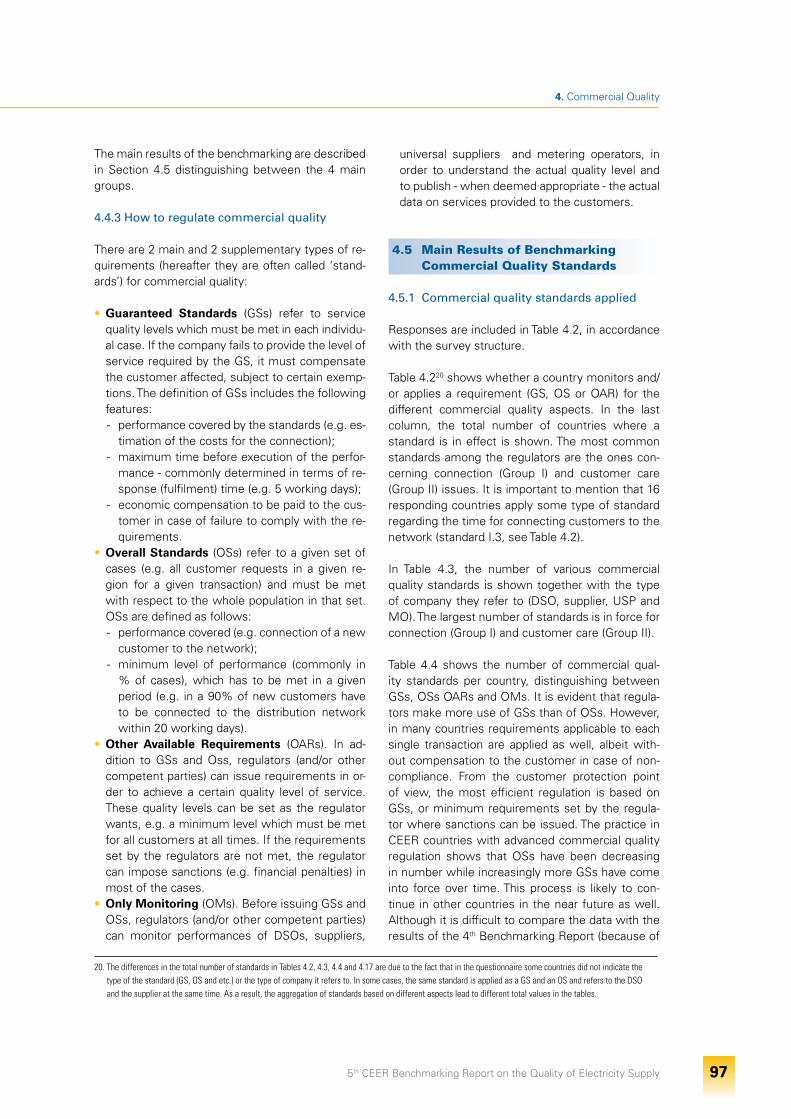
5th CEER Benchmarking Report on the Quality of Electricity Supply 97
4. Commercial Quality
The main results of the benchmarking are described in Section 4.5 distinguishing between the 4 main groups.
4.4.3 How to regulate commercial quality
There are 2 main and 2 supplementary types of re-quirements (hereafter they are often called ‘stand-ards’) for commercial quality:
• Guaranteed Standards (GSs) refer to service quality levels which must be met in each individu-al case. If the company fails to provide the level of service required by the GS, it must compensate the customer affected, subject to certain exemp-tions. The definition of GSs includes the following features:- performance covered by the standards (e.g. es-
timation of the costs for the connection);- maximum time before execution of the perfor-
mance - commonly determined in terms of re-sponse (fulfilment) time (e.g. 5 working days);
- economic compensation to be paid to the cus-tomer in case of failure to comply with the re-quirements.
• Overall Standards (OSs) refer to a given set of cases (e.g. all customer requests in a given re-gion for a given transaction) and must be met with respect to the whole population in that set. OSs are defined as follows:- performance covered (e.g. connection of a new
customer to the network);- minimum level of performance (commonly in
% of cases), which has to be met in a given period (e.g. in a 90% of new customers have to be connected to the distribution network within 20 working days).
• Other Available Requirements (OARs). In ad-dition to GSs and Oss, regulators (and/or other competent parties) can issue requirements in or-der to achieve a certain quality level of service. These quality levels can be set as the regulator wants, e.g. a minimum level which must be met for all customers at all times. If the requirements set by the regulators are not met, the regulator can impose sanctions (e.g. financial penalties) in most of the cases.
• Only Monitoring (OMs). Before issuing GSs and OSs, regulators (and/or other competent parties) can monitor performances of DSOs, suppliers,
universal suppliers and metering operators, in order to understand the actual quality level and to publish - when deemed appropriate - the actual data on services provided to the customers.
4.5 Main Results of Benchmarking Commercial Quality Standards
4.5.1 Commercial quality standards applied
Responses are included in Table 4.2, in accordance with the survey structure.
Table 4.220 shows whether a country monitors and/or applies a requirement (GS, OS or OAR) for the different commercial quality aspects. In the last column, the total number of countries where a standard is in effect is shown. The most common standards among the regulators are the ones con-cerning connection (Group I) and customer care (Group II) issues. It is important to mention that 16 responding countries apply some type of standard regarding the time for connecting customers to the network (standard I.3, see Table 4.2).
In Table 4.3, the number of various commercial quality standards is shown together with the type of company they refer to (DSO, supplier, USP and MO). The largest number of standards is in force for connection (Group I) and customer care (Group II).
Table 4.4 shows the number of commercial qual-ity standards per country, distinguishing between GSs, OSs OARs and OMs. It is evident that regula-tors make more use of GSs than of OSs. However, in many countries requirements applicable to each single transaction are applied as well, albeit with-out compensation to the customer in case of non-compliance. From the customer protection point of view, the most efficient regulation is based on GSs, or minimum requirements set by the regula-tor where sanctions can be issued. The practice in CEER countries with advanced commercial quality regulation shows that OSs have been decreasing in number while increasingly more GSs have come into force over time. This process is likely to con-tinue in other countries in the near future as well. Although it is difficult to compare the data with the results of the 4th Benchmarking Report (because of
20. The differences in the total number of standards in Tables 4.2, 4.3, 4.4 and 4.17 are due to the fact that in the questionnaire some countries did not indicate the type of the standard (GS, OS and etc.) or the type of company it refers to. In some cases, the same standard is applied as a GS and an OS and refers to the DSO and the supplier at the same time. As a result, the aggregation of standards based on different aspects lead to different total values in the tables.
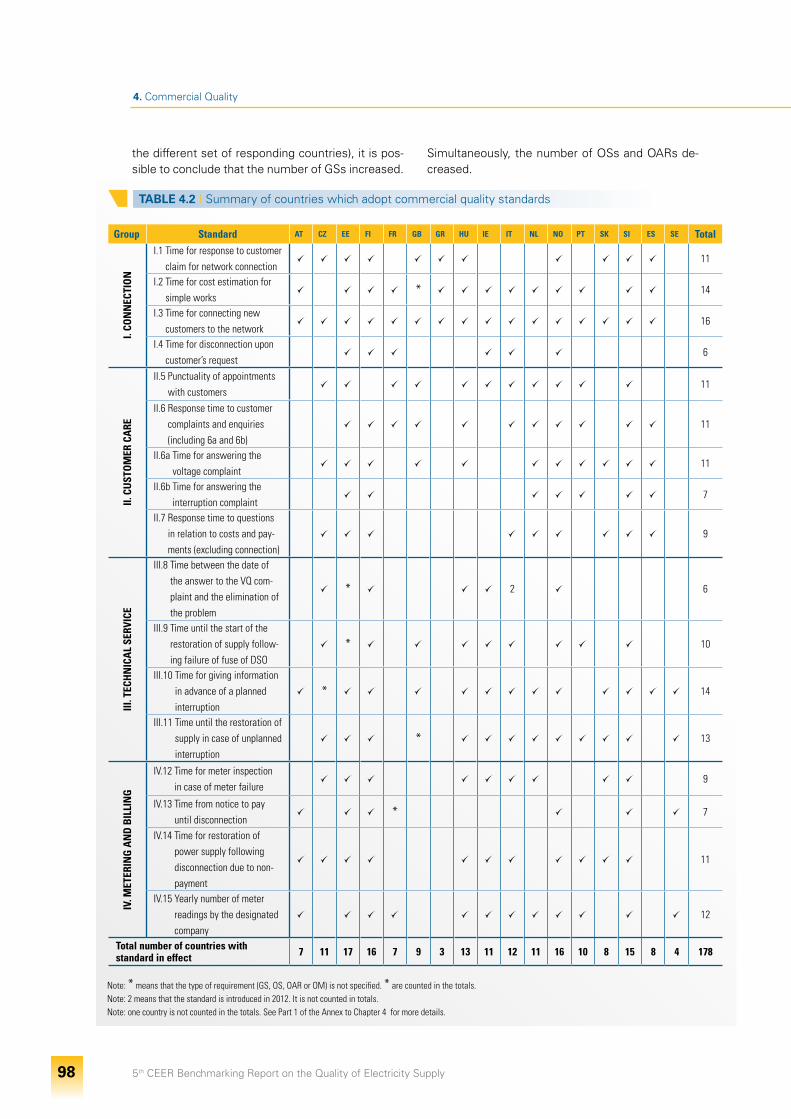
5th CEER Benchmarking Report on the Quality of Electricity Supply 98
4. Commercial Quality
the different set of responding countries), it is pos-sible to conclude that the number of GSs increased.
Simultaneously, the number of OSs and OARs de-creased.
TABLE 4.2 I Summary of countries which adopt commercial quality standards
Group Standard AT CZ EE FI FR GB GR HU IE IT NL NO PT SK SI ES SE Total
I. CO
NN
ECTI
ON
I.1 Time for response to customer claim for network connection
11
I.2 Time for cost estimation for simple works
* 14
I.3 Time for connecting new customers to the network
16
I.4 Time for disconnection upon customer’s request
6
II. C
UST
OM
ER C
ARE
II.5 Punctuality of appointments with customers
11
II.6 Response time to customer complaints and enquiries (including 6a and 6b)
11
II.6a Time for answering the voltage complaint
11
II.6b Time for answering the interruption complaint
7
II.7 Response time to questions in relation to costs and pay-ments (excluding connection)
9
III. T
ECH
NIC
AL
SERV
ICE
III.8 Time between the date of the answer to the VQ com-plaint and the elimination of the problem
* 2 6
III.9 Time until the start of the restoration of supply follow-ing failure of fuse of DSO
* 10
III.10 Time for giving information in advance of a planned interruption
* 14
III.11 Time until the restoration of supply in case of unplanned interruption
* 13
IV. M
ETER
ING
AN
D B
ILLI
NG
IV.12 Time for meter inspection in case of meter failure
9
IV.13 Time from notice to pay until disconnection
* 7
IV.14 Time for restoration of power supply following disconnection due to non-payment
11
IV.15 Yearly number of meter readings by the designated company
12
Total number of countries withstandard in effect 7 11 17 16 7 9 3 13 11 12 11 16 10 8 15 8 4 178
Note: * means that the type of requirement (GS, OS, OAR or OM) is not specified. * are counted in the totals.Note: 2 means that the standard is introduced in 2012. It is not counted in totals.Note: one country is not counted in the totals. See Part 1 of the Annex to Chapter 4 for more details.
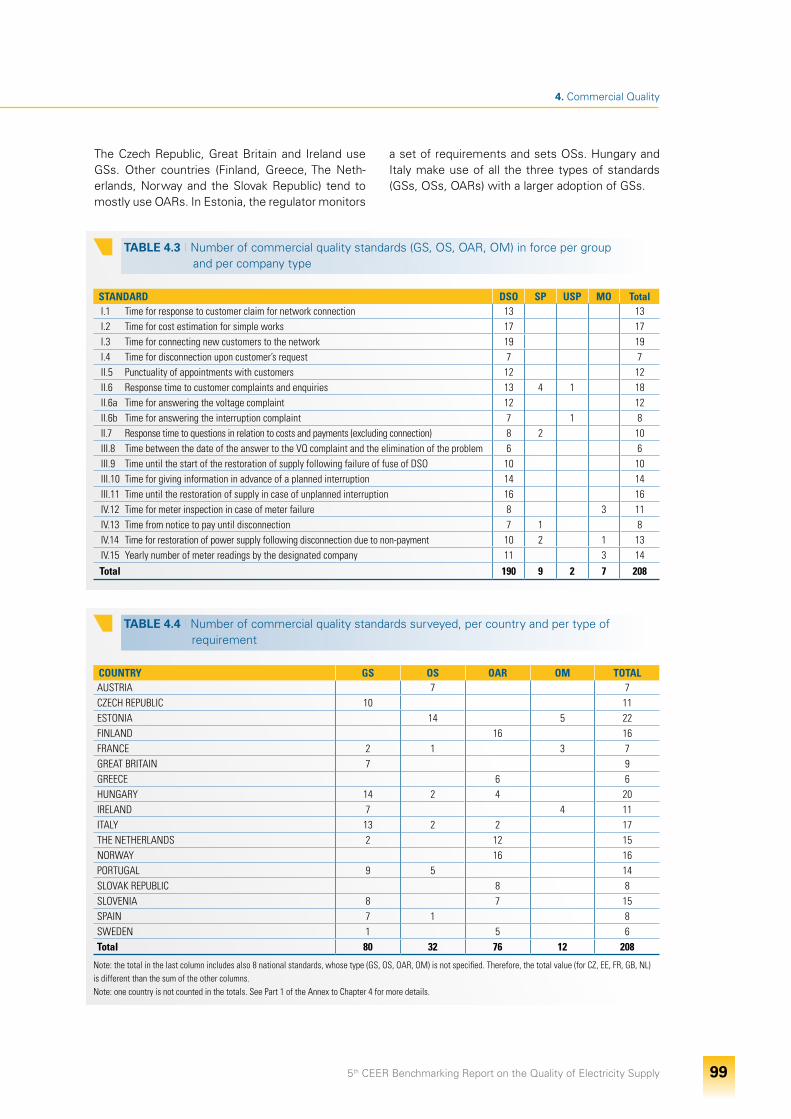
5th CEER Benchmarking Report on the Quality of Electricity Supply 99
4. Commercial Quality
TABLE 4.3 I Number of commercial quality standards (GS, OS, OAR, OM) in force per group and per company type
STANDARD DSO SP USP MO TotalI.1 Time for response to customer claim for network connection 13 13I.2 Time for cost estimation for simple works 17 17I.3 Time for connecting new customers to the network 19 19I.4 Time for disconnection upon customer’s request 7 7II.5 Punctuality of appointments with customers 12 12II.6 Response time to customer complaints and enquiries 13 4 1 18II.6a Time for answering the voltage complaint 12 12II.6b Time for answering the interruption complaint 7 1 8II.7 Response time to questions in relation to costs and payments (excluding connection) 8 2 10III.8 Time between the date of the answer to the VQ complaint and the elimination of the problem 6 6III.9 Time until the start of the restoration of supply following failure of fuse of DSO 10 10III.10 Time for giving information in advance of a planned interruption 14 14III.11 Time until the restoration of supply in case of unplanned interruption 16 16IV.12 Time for meter inspection in case of meter failure 8 3 11IV.13 Time from notice to pay until disconnection 7 1 8IV.14 Time for restoration of power supply following disconnection due to non-payment 10 2 1 13IV.15 Yearly number of meter readings by the designated company 11 3 14
Total 190 9 2 7 208
TABLE 4.4 I Number of commercial quality standards surveyed, per country and per type of requirement
COUNTRY GS OS OAR OM TOTALAUSTRIA 7 7CZECH REPUBLIC 10 11ESTONIA 14 5 22FINLAND 16 16FRANCE 2 1 3 7GREAT BRITAIN 7 9GREECE 6 6HUNGARY 14 2 4 20IRELAND 7 4 11ITALY 13 2 2 17THE NETHERLANDS 2 12 15NORWAY 16 16PORTUGAL 9 5 14SLOVAK REPUBLIC 8 8SLOVENIA 8 7 15SPAIN 7 1 8SWEDEN 1 5 6Total 80 32 76 12 208
Note: the total in the last column includes also 8 national standards, whose type (GS, OS, OAR, OM) is not specified. Therefore, the total value (for CZ, EE, FR, GB, NL)is different than the sum of the other columns.Note: one country is not counted in the totals. See Part 1 of the Annex to Chapter 4 for more details.
The Czech Republic, Great Britain and Ireland use GSs. Other countries (Finland, Greece, The Neth-erlands, Norway and the Slovak Republic) tend to mostly use OARs. In Estonia, the regulator monitors
a set of requirements and sets OSs. Hungary and Italy make use of all the three types of standards (GSs, OSs, OARs) with a larger adoption of GSs.
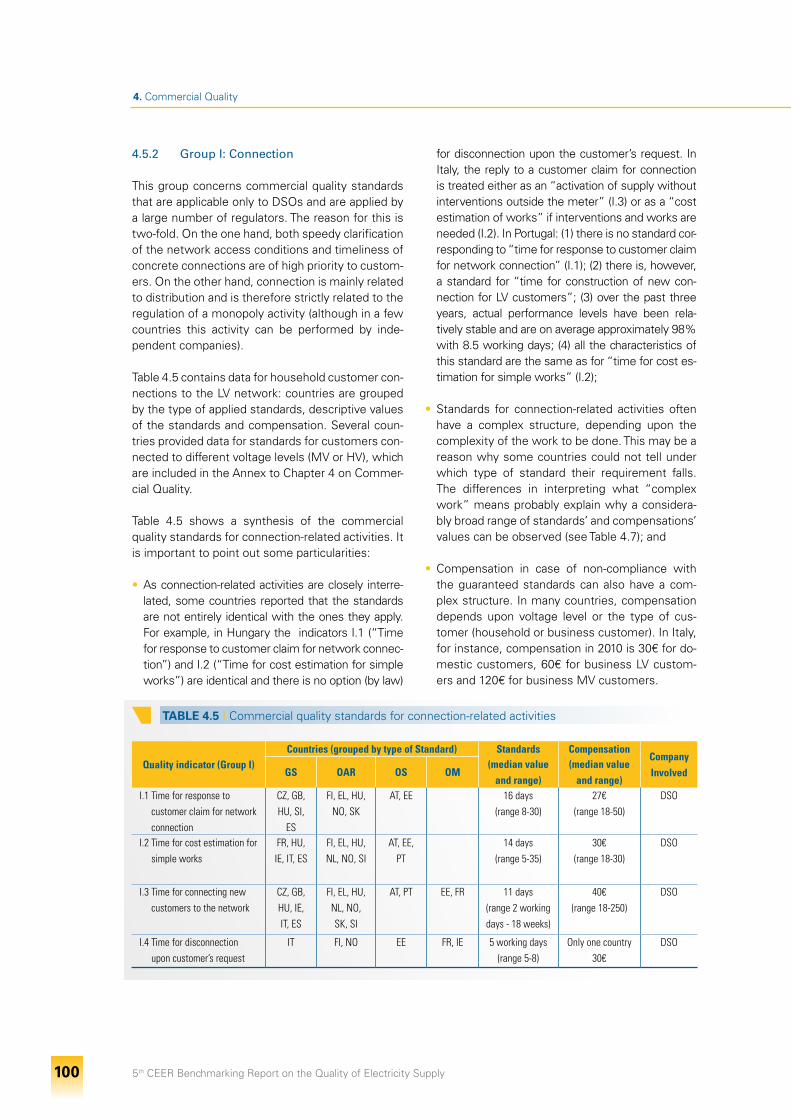
5th CEER Benchmarking Report on the Quality of Electricity Supply 100
4. Commercial Quality
TABLE 4.5 I Commercial quality standards for connection-related activities
Quality indicator (Group I)Countries (grouped by type of Standard) Standards Compensation
CompanyInvolvedGS OAR OS OM
(median value and range)
(median value and range)
I.1 Time for response to customer claim for network connection
CZ, GB, HU, SI,
ES
FI, EL, HU, NO, SK
AT, EE 16 days (range 8-30)
27€ (range 18-50)
DSO
I.2 Time for cost estimation for simple works
FR, HU, IE, IT, ES
FI, EL, HU, NL, NO, SI
AT, EE, PT
14 days (range 5-35)
30€ (range 18-30)
DSO
I.3 Time for connecting new customers to the network
CZ, GB, HU, IE, IT, ES
FI, EL, HU, NL, NO, SK, SI
AT, PT EE, FR 11 days (range 2 working days - 18 weeks)
40€ (range 18-250)
DSO
I.4 Time for disconnection upon customer’s request
IT FI, NO EE FR, IE 5 working days (range 5-8)
Only one country 30€
DSO
4.5.2 Group I: Connection
This group concerns commercial quality standards that are applicable only to DSOs and are applied by a large number of regulators. The reason for this is two-fold. On the one hand, both speedy clarification of the network access conditions and timeliness of concrete connections are of high priority to custom-ers. On the other hand, connection is mainly related to distribution and is therefore strictly related to the regulation of a monopoly activity (although in a few countries this activity can be performed by inde-pendent companies).
Table 4.5 contains data for household customer con-nections to the LV network: countries are grouped by the type of applied standards, descriptive values of the standards and compensation. Several coun-tries provided data for standards for customers con-nected to different voltage levels (MV or HV), which are included in the Annex to Chapter 4 on Commer-cial Quality.
Table 4.5 shows a synthesis of the commercial quality standards for connection-related activities. It is important to point out some particularities:
• As connection-related activities are closely interre-lated, some countries reported that the standards are not entirely identical with the ones they apply. For example, in Hungary the indicators I.1 (“Time for response to customer claim for network connec-tion”) and I.2 (“Time for cost estimation for simple works”) are identical and there is no option (by law)
for disconnection upon the customer’s request. In Italy, the reply to a customer claim for connection is treated either as an “activation of supply without interventions outside the meter” (I.3) or as a “cost estimation of works” if interventions and works are needed (I.2). In Portugal: (1) there is no standard cor-responding to “time for response to customer claim for network connection” (I.1); (2) there is, however, a standard for “time for construction of new con-nection for LV customers”; (3) over the past three years, actual performance levels have been rela-tively stable and are on average approximately 98% with 8.5 working days; (4) all the characteristics of this standard are the same as for “time for cost es-timation for simple works” (I.2);
• Standards for connection-related activities often have a complex structure, depending upon the complexity of the work to be done. This may be a reason why some countries could not tell under which type of standard their requirement falls. The differences in interpreting what “complex work” means probably explain why a considera-bly broad range of standards’ and compensations’ values can be observed (see Table 4.7); and
• Compensation in case of non-compliance with the guaranteed standards can also have a com-plex structure. In many countries, compensation depends upon voltage level or the type of cus-tomer (household or business customer). In Italy, for instance, compensation in 2010 is 30€ for do-mestic customers, 60€ for business LV custom-ers and 120€ for business MV customers.
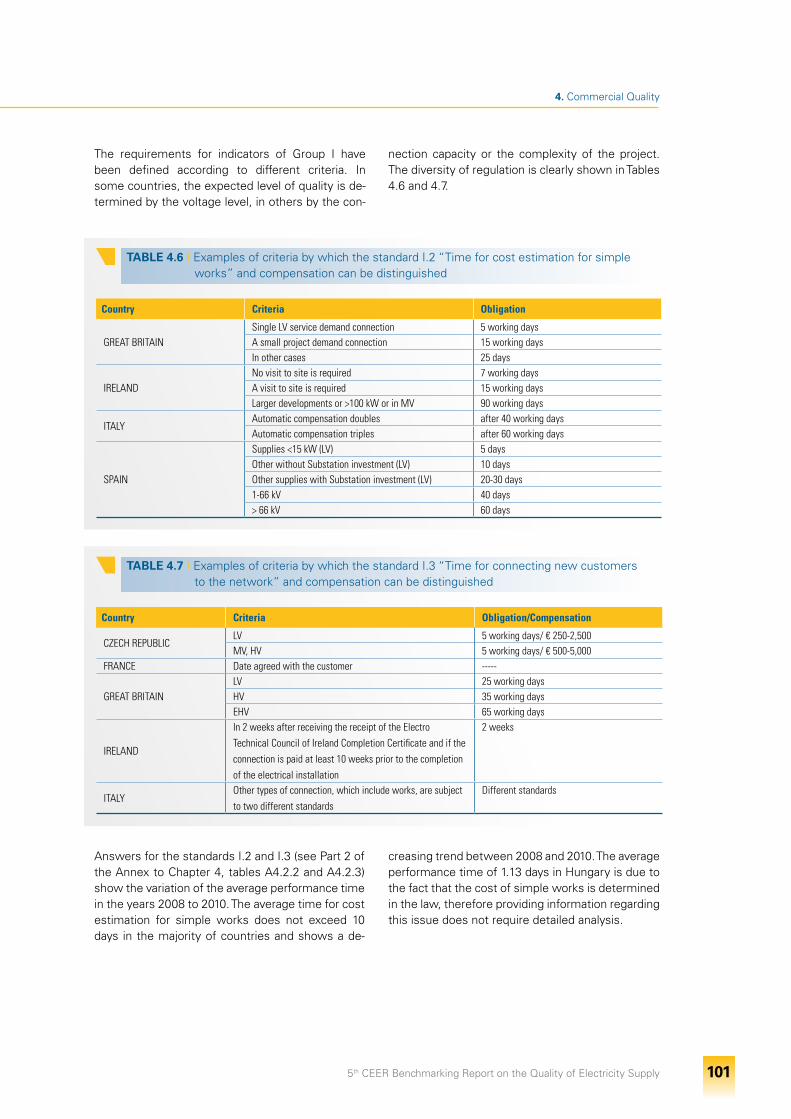
5th CEER Benchmarking Report on the Quality of Electricity Supply 101
4. Commercial Quality
The requirements for indicators of Group I have been defined according to different criteria. In some countries, the expected level of quality is de-termined by the voltage level, in others by the con-
TABLE 4.6 I Examples of criteria by which the standard I.2 “Time for cost estimation for simple works” and compensation can be distinguished
Country Criteria Obligation
GREAT BRITAINSingle LV service demand connection 5 working daysA small project demand connection 15 working daysIn other cases 25 days
IRELANDNo visit to site is required 7 working daysA visit to site is required 15 working daysLarger developments or >100 kW or in MV 90 working days
ITALYAutomatic compensation doubles after 40 working daysAutomatic compensation triples after 60 working days
SPAIN
Supplies <15 kW (LV) 5 daysOther without Substation investment (LV) 10 daysOther supplies with Substation investment (LV) 20-30 days1-66 kV 40 days> 66 kV 60 days
TABLE 4.7 I Examples of criteria by which the standard I.3 “Time for connecting new customers to the network” and compensation can be distinguished
Country Criteria Obligation/Compensation
CZECH REPUBLICLV 5 working days/ € 250-2,500 MV, HV 5 working days/ € 500-5,000
FRANCE Date agreed with the customer -----
GREAT BRITAINLV 25 working daysHV 35 working daysEHV 65 working days
IRELAND
In 2 weeks after receiving the receipt of the Electro Technical Council of Ireland Completion Certificate and if the connection is paid at least 10 weeks prior to the completion of the electrical installation
2 weeks
ITALYOther types of connection, which include works, are subject to two different standards
Different standards
Answers for the standards I.2 and I.3 (see Part 2 of the Annex to Chapter 4, tables A4.2.2 and A4.2.3) show the variation of the average performance time in the years 2008 to 2010. The average time for cost estimation for simple works does not exceed 10 days in the majority of countries and shows a de-
creasing trend between 2008 and 2010. The average performance time of 1.13 days in Hungary is due to the fact that the cost of simple works is determined in the law, therefore providing information regarding this issue does not require detailed analysis.
nection capacity or the complexity of the project. The diversity of regulation is clearly shown in Tables 4.6 and 4.7.
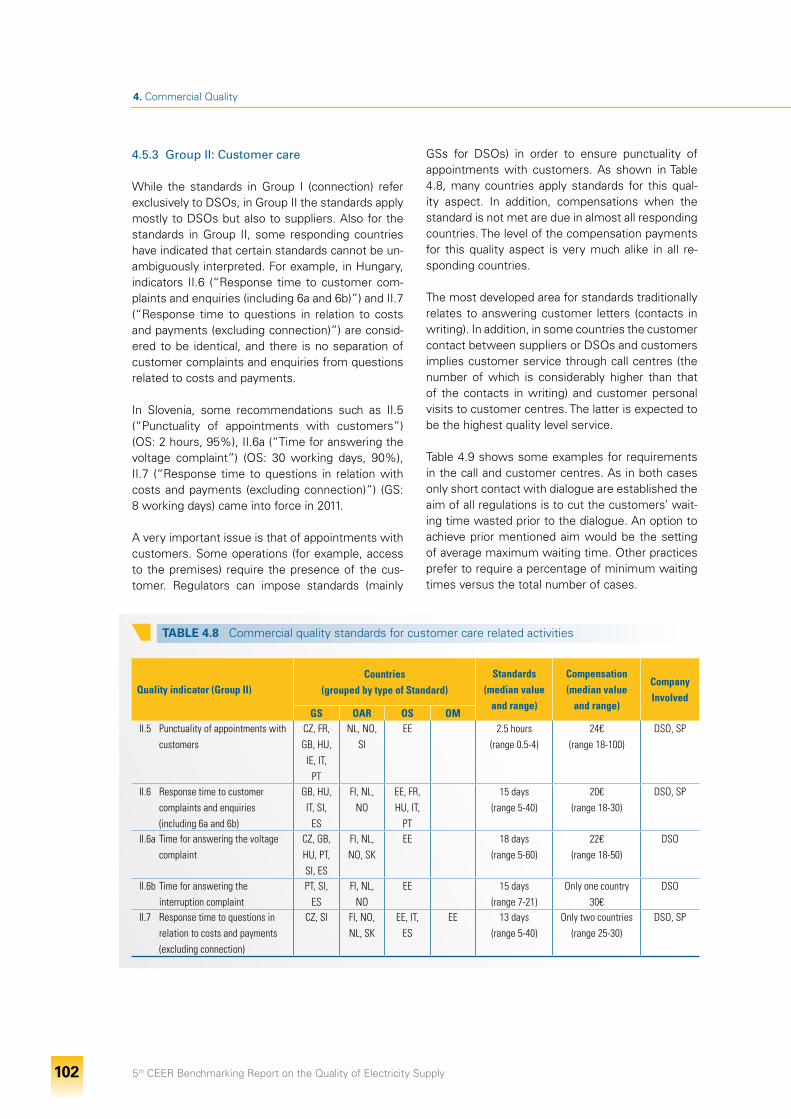
5th CEER Benchmarking Report on the Quality of Electricity Supply 102
4. Commercial Quality
TABLE 4.8 I Commercial quality standards for customer care related activities
Quality indicator (Group II)Countries
(grouped by type of Standard)
Standards(median value
and range)
Compensation(median value
and range)
CompanyInvolved
GS OAR OS OMII.5 Punctuality of appointments with
customersCZ, FR, GB, HU,
IE, IT, PT
NL, NO, SI
EE 2.5 hours(range 0.5-4)
24€ (range 18-100)
DSO, SP
II.6 Response time to customer complaints and enquiries (including 6a and 6b)
GB, HU, IT, SI,
ES
FI, NL, NO
EE, FR, HU, IT,
PT
15 days (range 5-40)
20€ (range 18-30)
DSO, SP
II.6a Time for answering the voltage complaint
CZ, GB, HU, PT, SI, ES
FI, NL, NO, SK
EE 18 days(range 5-60)
22€ (range 18-50)
DSO
II.6b Time for answering the interruption complaint
PT, SI, ES
FI, NL, NO
EE 15 days (range 7-21)
Only one country 30€
DSO
II.7 Response time to questions in relation to costs and payments (excluding connection)
CZ, SI FI, NO, NL, SK
EE, IT, ES
EE 13 days (range 5-40)
Only two countries (range 25-30)
DSO, SP
4.5.3 Group II: Customer care
While the standards in Group I (connection) refer exclusively to DSOs, in Group II the standards apply mostly to DSOs but also to suppliers. Also for the standards in Group II, some responding countries have indicated that certain standards cannot be un-ambiguously interpreted. For example, in Hungary, indicators II.6 (“Response time to customer com-plaints and enquiries (including 6a and 6b)”) and II.7 (“Response time to questions in relation to costs and payments (excluding connection)”) are consid-ered to be identical, and there is no separation of customer complaints and enquiries from questions related to costs and payments.
In Slovenia, some recommendations such as II.5 (“Punctuality of appointments with customers”) (OS: 2 hours, 95%), II.6a (“Time for answering the voltage complaint”) (OS: 30 working days, 90%), II.7 (“Response time to questions in relation with costs and payments (excluding connection)”) (GS: 8 working days) came into force in 2011.
A very important issue is that of appointments with customers. Some operations (for example, access to the premises) require the presence of the cus-tomer. Regulators can impose standards (mainly
GSs for DSOs) in order to ensure punctuality of appointments with customers. As shown in Table 4.8, many countries apply standards for this qual-ity aspect. In addition, compensations when the standard is not met are due in almost all responding countries. The level of the compensation payments for this quality aspect is very much alike in all re-sponding countries.
The most developed area for standards traditionally relates to answering customer letters (contacts in writing). In addition, in some countries the customer contact between suppliers or DSOs and customers implies customer service through call centres (the number of which is considerably higher than that of the contacts in writing) and customer personal visits to customer centres. The latter is expected to be the highest quality level service.
Table 4.9 shows some examples for requirements in the call and customer centres. As in both cases only short contact with dialogue are established the aim of all regulations is to cut the customers’ wait-ing time wasted prior to the dialogue. An option to achieve prior mentioned aim would be the setting of average maximum waiting time. Other practices prefer to require a percentage of minimum waiting times versus the total number of cases.
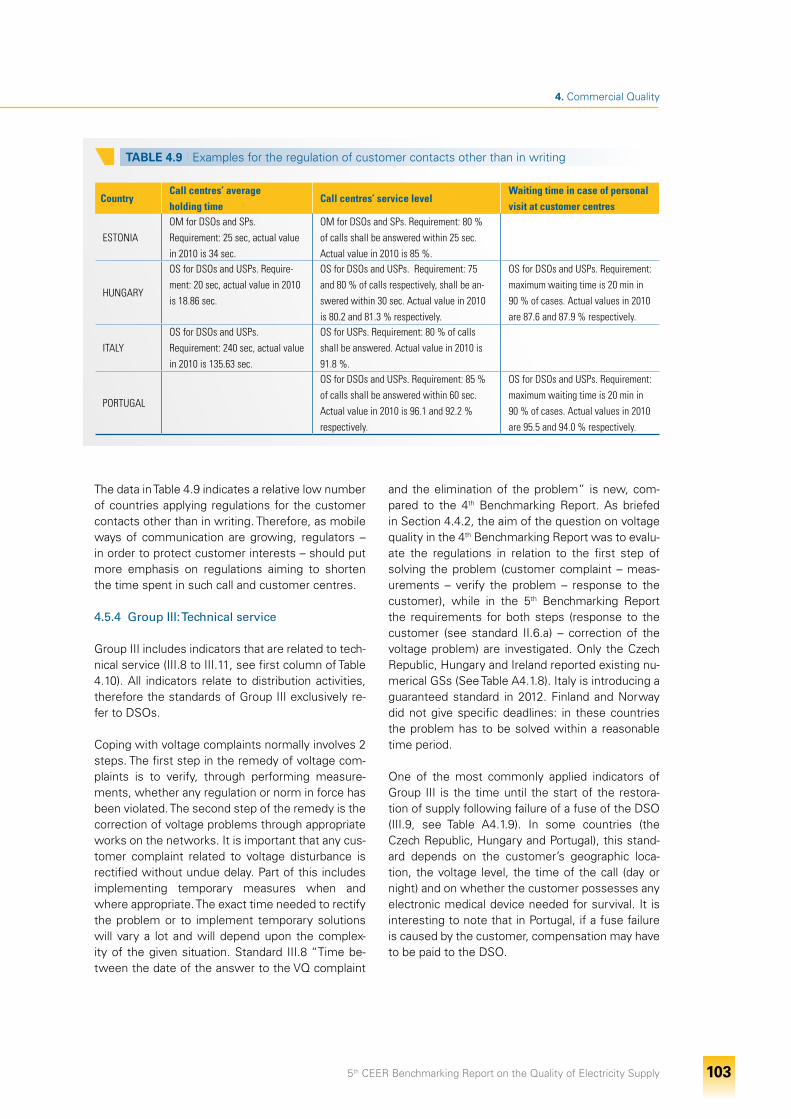
5th CEER Benchmarking Report on the Quality of Electricity Supply 103
4. Commercial Quality
TABLE 4.9 I Examples for the regulation of customer contacts other than in writing
CountryCall centres’ averageholding time
Call centres’ service levelWaiting time in case of personal visit at customer centres
ESTONIAOM for DSOs and SPs. Requirement: 25 sec, actual value in 2010 is 34 sec.
OM for DSOs and SPs. Requirement: 80 % of calls shall be answered within 25 sec. Actual value in 2010 is 85 %.
HUNGARY
OS for DSOs and USPs. Require-ment: 20 sec, actual value in 2010 is 18.86 sec.
OS for DSOs and USPs. Requirement: 75 and 80 % of calls respectively, shall be an-swered within 30 sec. Actual value in 2010 is 80.2 and 81.3 % respectively.
OS for DSOs and USPs. Requirement: maximum waiting time is 20 min in 90 % of cases. Actual values in 2010 are 87.6 and 87.9 % respectively.
ITALYOS for DSOs and USPs. Requirement: 240 sec, actual value in 2010 is 135.63 sec.
OS for USPs. Requirement: 80 % of calls shall be answered. Actual value in 2010 is 91.8 %.
PORTUGAL
OS for DSOs and USPs. Requirement: 85 % of calls shall be answered within 60 sec. Actual value in 2010 is 96.1 and 92.2 % respectively.
OS for DSOs and USPs. Requirement: maximum waiting time is 20 min in 90 % of cases. Actual values in 2010 are 95.5 and 94.0 % respectively.
The data in Table 4.9 indicates a relative low number of countries applying regulations for the customer contacts other than in writing. Therefore, as mobile ways of communication are growing, regulators – in order to protect customer interests – should put more emphasis on regulations aiming to shorten the time spent in such call and customer centres.
4.5.4 Group III: Technical service
Group III includes indicators that are related to tech-nical service (III.8 to III.11, see first column of Table 4.10). All indicators relate to distribution activities, therefore the standards of Group III exclusively re-fer to DSOs.
Coping with voltage complaints normally involves 2 steps. The first step in the remedy of voltage com-plaints is to verify, through performing measure-ments, whether any regulation or norm in force has been violated. The second step of the remedy is the correction of voltage problems through appropriate works on the networks. It is important that any cus-tomer complaint related to voltage disturbance is rectified without undue delay. Part of this includes implementing temporary measures when and where appropriate. The exact time needed to rectify the problem or to implement temporary solutions will vary a lot and will depend upon the complex-ity of the given situation. Standard III.8 “Time be-tween the date of the answer to the VQ complaint
and the elimination of the problem” is new, com-pared to the 4th Benchmarking Report. As briefed in Section 4.4.2, the aim of the question on voltage quality in the 4th Benchmarking Report was to evalu-ate the regulations in relation to the first step of solving the problem (customer complaint – meas-urements – verify the problem – response to the customer), while in the 5th Benchmarking Report the requirements for both steps (response to the customer (see standard II.6.a) – correction of the voltage problem) are investigated. Only the Czech Republic, Hungary and Ireland reported existing nu-merical GSs (See Table A4.1.8). Italy is introducing a guaranteed standard in 2012. Finland and Norway did not give specific deadlines: in these countries the problem has to be solved within a reasonable time period.
One of the most commonly applied indicators of Group III is the time until the start of the restora-tion of supply following failure of a fuse of the DSO (III.9, see Table A4.1.9). In some countries (the Czech Republic, Hungary and Portugal), this stand-ard depends on the customer’s geographic loca-tion, the voltage level, the time of the call (day or night) and on whether the customer possesses any electronic medical device needed for survival. It is interesting to note that in Portugal, if a fuse failure is caused by the customer, compensation may have to be paid to the DSO.
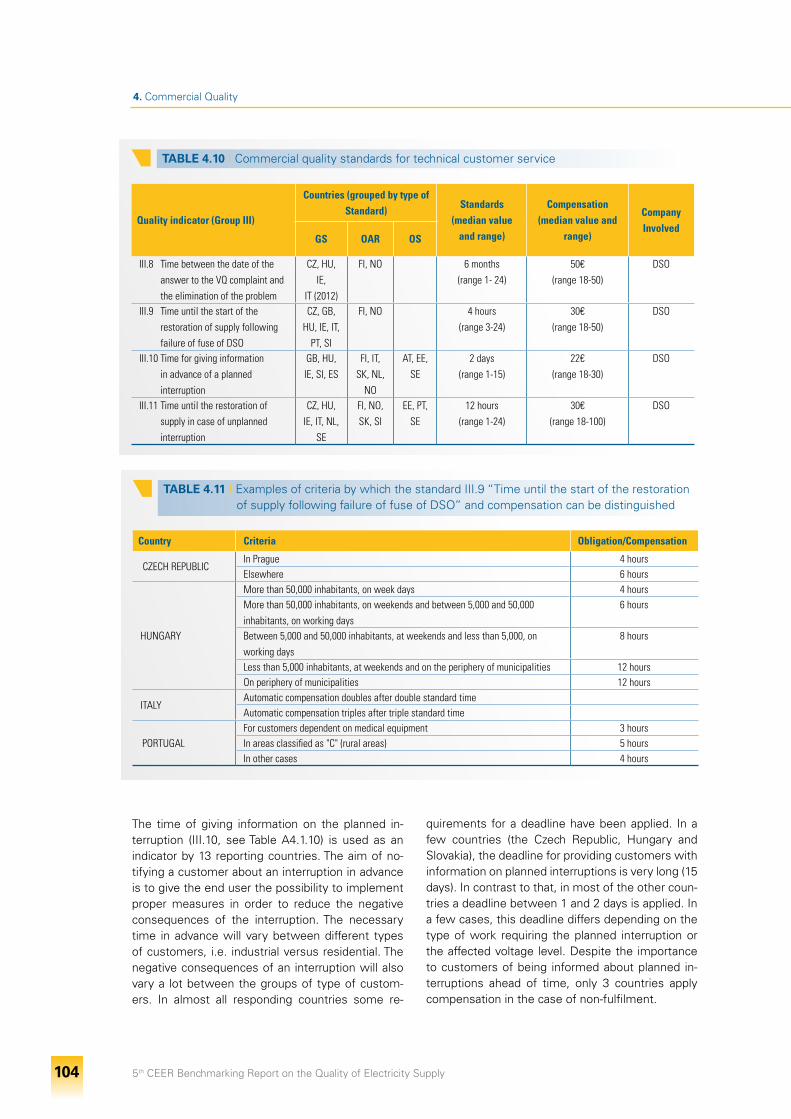
5th CEER Benchmarking Report on the Quality of Electricity Supply 104
4. Commercial Quality
The time of giving information on the planned in-terruption (III.10, see Table A4.1.10) is used as an indicator by 13 reporting countries. The aim of no-tifying a customer about an interruption in advance is to give the end user the possibility to implement proper measures in order to reduce the negative consequences of the interruption. The necessary time in advance will vary between different types of customers, i.e. industrial versus residential. The negative consequences of an interruption will also vary a lot between the groups of type of custom-ers. In almost all responding countries some re-
quirements for a deadline have been applied. In a few countries (the Czech Republic, Hungary and Slovakia), the deadline for providing customers with information on planned interruptions is very long (15 days). In contrast to that, in most of the other coun-tries a deadline between 1 and 2 days is applied. In a few cases, this deadline differs depending on the type of work requiring the planned interruption or the affected voltage level. Despite the importance to customers of being informed about planned in-terruptions ahead of time, only 3 countries apply compensation in the case of non-fulfilment.
TABLE 4.11 I Examples of criteria by which the standard III.9 “Time until the start of the restoration of supply following failure of fuse of DSO” and compensation can be distinguished
Country Criteria Obligation/Compensation
CZECH REPUBLICIn Prague 4 hoursElsewhere 6 hours
HUNGARY
More than 50,000 inhabitants, on week days 4 hoursMore than 50,000 inhabitants, on weekends and between 5,000 and 50,000 inhabitants, on working days
6 hours
Between 5,000 and 50,000 inhabitants, at weekends and less than 5,000, on working days
8 hours
Less than 5,000 inhabitants, at weekends and on the periphery of municipalities 12 hoursOn periphery of municipalities 12 hours
ITALYAutomatic compensation doubles after double standard timeAutomatic compensation triples after triple standard time
PORTUGALFor customers dependent on medical equipment 3 hoursIn areas classified as "C" (rural areas) 5 hoursIn other cases 4 hours
TABLE 4.10 I Commercial quality standards for technical customer service
Quality indicator (Group III)
Countries (grouped by type of Standard)
Standards(median value
and range)
Compensation(median value and
range)
CompanyInvolved
GS OAR OS
III.8 Time between the date of the answer to the VQ complaint and the elimination of the problem
CZ, HU, IE,
IT (2012)
FI, NO 6 months(range 1- 24)
50€(range 18-50)
DSO
III.9 Time until the start of the restoration of supply following failure of fuse of DSO
CZ, GB, HU, IE, IT,
PT, SI
FI, NO 4 hours (range 3-24)
30€ (range 18-50)
DSO
III.10 Time for giving information in advance of a planned interruption
GB, HU, IE, SI, ES
FI, IT, SK, NL,
NO
AT, EE, SE
2 days (range 1-15)
22€ (range 18-30)
DSO
III.11 Time until the restoration of supply in case of unplanned interruption
CZ, HU, IE, IT, NL,
SE
FI, NO, SK, SI
EE, PT, SE
12 hours (range 1-24)
30€ (range 18-100)
DSO
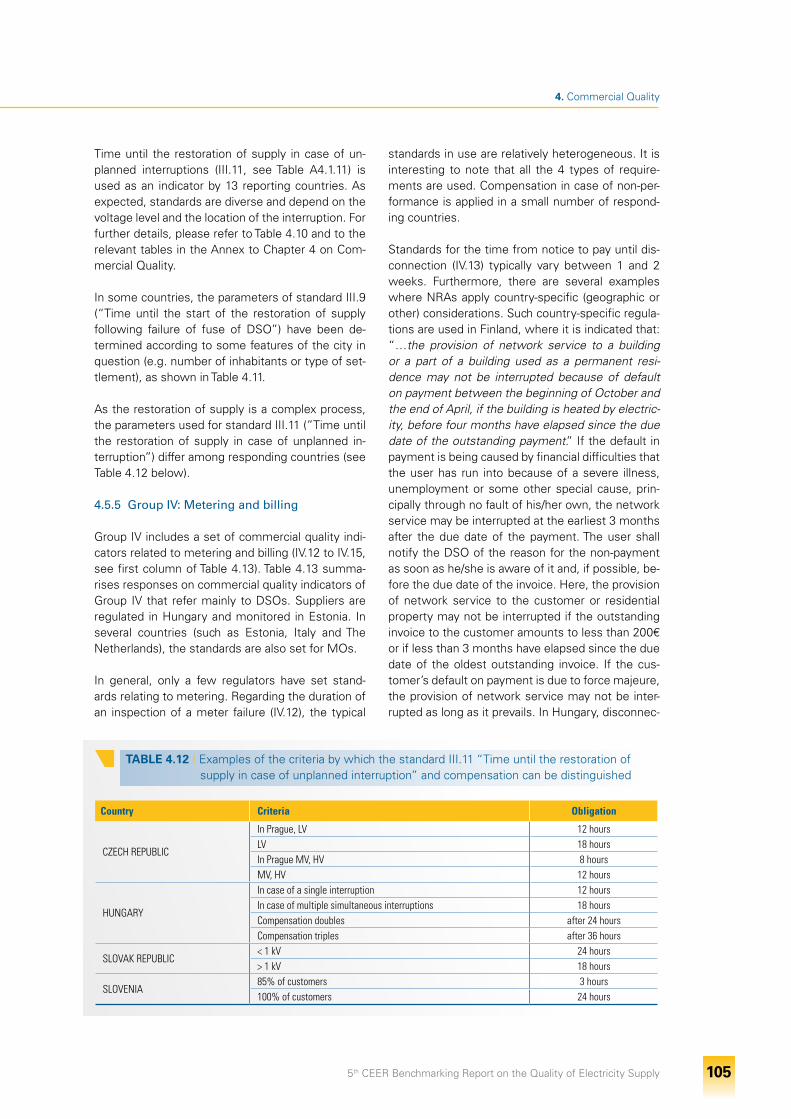
5th CEER Benchmarking Report on the Quality of Electricity Supply 105
4. Commercial Quality
Time until the restoration of supply in case of un-planned interruptions (III.11, see Table A4.1.11) is used as an indicator by 13 reporting countries. As expected, standards are diverse and depend on the voltage level and the location of the interruption. For further details, please refer to Table 4.10 and to the relevant tables in the Annex to Chapter 4 on Com-mercial Quality.
In some countries, the parameters of standard III.9 (“Time until the start of the restoration of supply following failure of fuse of DSO”) have been de-termined according to some features of the city in question (e.g. number of inhabitants or type of set-tlement), as shown in Table 4.11.
As the restoration of supply is a complex process, the parameters used for standard III.11 (”Time until the restoration of supply in case of unplanned in-terruption”) differ among responding countries (see Table 4.12 below).
4.5.5 Group IV: Metering and billing
Group IV includes a set of commercial quality indi-cators related to metering and billing (IV.12 to IV.15, see first column of Table 4.13). Table 4.13 summa-rises responses on commercial quality indicators of Group IV that refer mainly to DSOs. Suppliers are regulated in Hungary and monitored in Estonia. In several countries (such as Estonia, Italy and The Netherlands), the standards are also set for MOs.
In general, only a few regulators have set stand-ards relating to metering. Regarding the duration of an inspection of a meter failure (IV.12), the typical
standards in use are relatively heterogeneous. It is interesting to note that all the 4 types of require-ments are used. Compensation in case of non-per-formance is applied in a small number of respond-ing countries.
Standards for the time from notice to pay until dis-connection (IV.13) typically vary between 1 and 2 weeks. Furthermore, there are several examples where NRAs apply country-specific (geographic or other) considerations. Such country-specific regula-tions are used in Finland, where it is indicated that: “…the provision of network service to a building or a part of a building used as a permanent resi-dence may not be interrupted because of default on payment between the beginning of October and the end of April, if the building is heated by electric-ity, before four months have elapsed since the due date of the outstanding payment.” If the default in payment is being caused by financial difficulties that the user has run into because of a severe illness, unemployment or some other special cause, prin-cipally through no fault of his/her own, the network service may be interrupted at the earliest 3 months after the due date of the payment. The user shall notify the DSO of the reason for the non-payment as soon as he/she is aware of it and, if possible, be-fore the due date of the invoice. Here, the provision of network service to the customer or residential property may not be interrupted if the outstanding invoice to the customer amounts to less than 200€ or if less than 3 months have elapsed since the due date of the oldest outstanding invoice. If the cus-tomer’s default on payment is due to force majeure, the provision of network service may not be inter-rupted as long as it prevails. In Hungary, disconnec-
TABLE 4.12 I Examples of the criteria by which the standard III.11 “Time until the restoration of supply in case of unplanned interruption” and compensation can be distinguished
Country Criteria Obligation
CZECH REPUBLIC
In Prague, LV 12 hoursLV 18 hoursIn Prague MV, HV 8 hoursMV, HV 12 hours
HUNGARY
In case of a single interruption 12 hoursIn case of multiple simultaneous interruptions 18 hoursCompensation doubles after 24 hoursCompensation triples after 36 hours
SLOVAK REPUBLIC< 1 kV 24 hours> 1 kV 18 hours
SLOVENIA85% of customers 3 hours100% of customers 24 hours
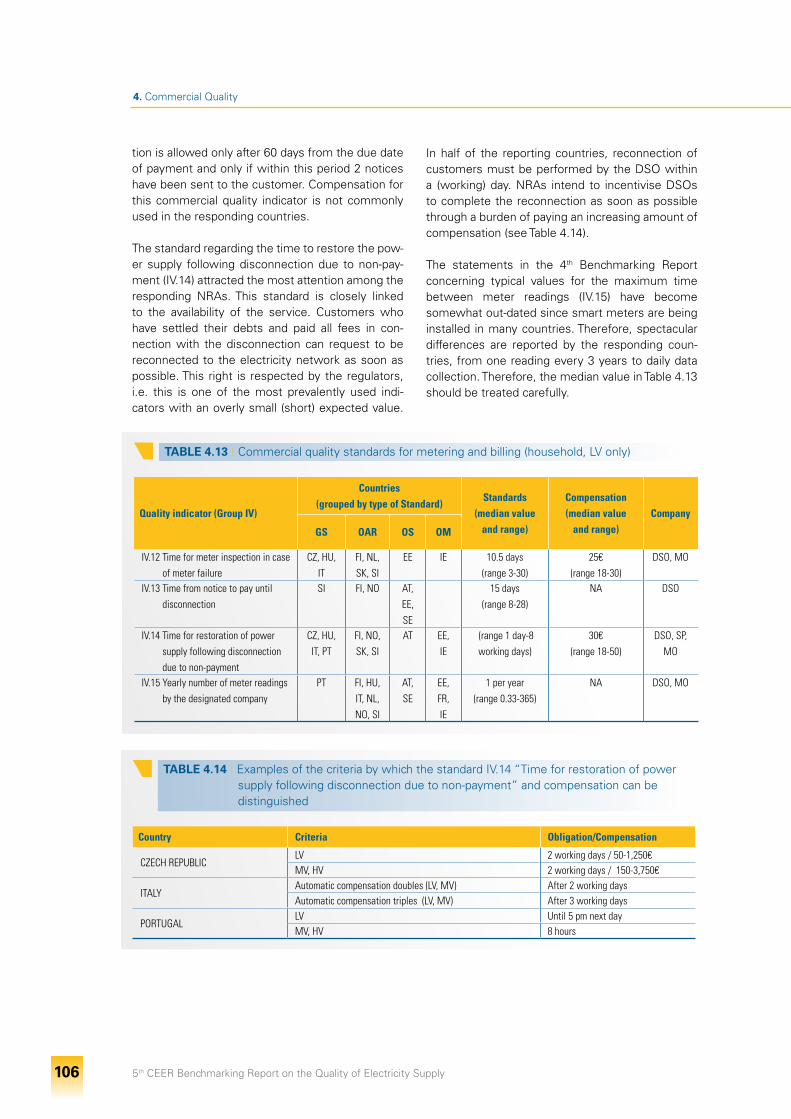
5th CEER Benchmarking Report on the Quality of Electricity Supply 106
4. Commercial Quality
tion is allowed only after 60 days from the due date of payment and only if within this period 2 notices have been sent to the customer. Compensation for this commercial quality indicator is not commonly used in the responding countries.
The standard regarding the time to restore the pow-er supply following disconnection due to non-pay-ment (IV.14) attracted the most attention among the responding NRAs. This standard is closely linked to the availability of the service. Customers who have settled their debts and paid all fees in con-nection with the disconnection can request to be reconnected to the electricity network as soon as possible. This right is respected by the regulators, i.e. this is one of the most prevalently used indi-cators with an overly small (short) expected value.
In half of the reporting countries, reconnection of customers must be performed by the DSO within a (working) day. NRAs intend to incentivise DSOs to complete the reconnection as soon as possible through a burden of paying an increasing amount of compensation (see Table 4.14).
The statements in the 4th Benchmarking Report concerning typical values for the maximum time between meter readings (IV.15) have become somewhat out-dated since smart meters are being installed in many countries. Therefore, spectacular differences are reported by the responding coun-tries, from one reading every 3 years to daily data collection. Therefore, the median value in Table 4.13 should be treated carefully.
TABLE 4.14 I Examples of the criteria by which the standard IV.14 “Time for restoration of power supply following disconnection due to non-payment” and compensation can be distinguished
Country Criteria Obligation/Compensation
CZECH REPUBLICLV 2 working days / 50-1,250€ MV, HV 2 working days / 150-3,750€
ITALYAutomatic compensation doubles (LV, MV) After 2 working daysAutomatic compensation triples (LV, MV) After 3 working days
PORTUGALLV Until 5 pm next dayMV, HV 8 hours
TABLE 4.13 I Commercial quality standards for metering and billing (household, LV only)
Quality indicator (Group IV)
Countries (grouped by type of Standard)
Standards(median value
and range)
Compensation (median value
and range)Company
GS OAR OS OM
IV.12 Time for meter inspection in case of meter failure
CZ, HU, IT
FI, NL, SK, SI
EE IE 10.5 days (range 3-30)
25€ (range 18-30)
DSO, MO
IV.13 Time from notice to pay until disconnection
SI FI, NO AT, EE, SE
15 days(range 8-28)
NA DSO
IV.14 Time for restoration of power supply following disconnection due to non-payment
CZ, HU, IT, PT
FI, NO, SK, SI
AT EE, IE
(range 1 day-8 working days)
30€ (range 18-50)
DSO, SP, MO
IV.15 Yearly number of meter readings by the designated company
PT FI, HU, IT, NL, NO, SI
AT, SE
EE, FR, IE
1 per year(range 0.33-365)
NA DSO, MO
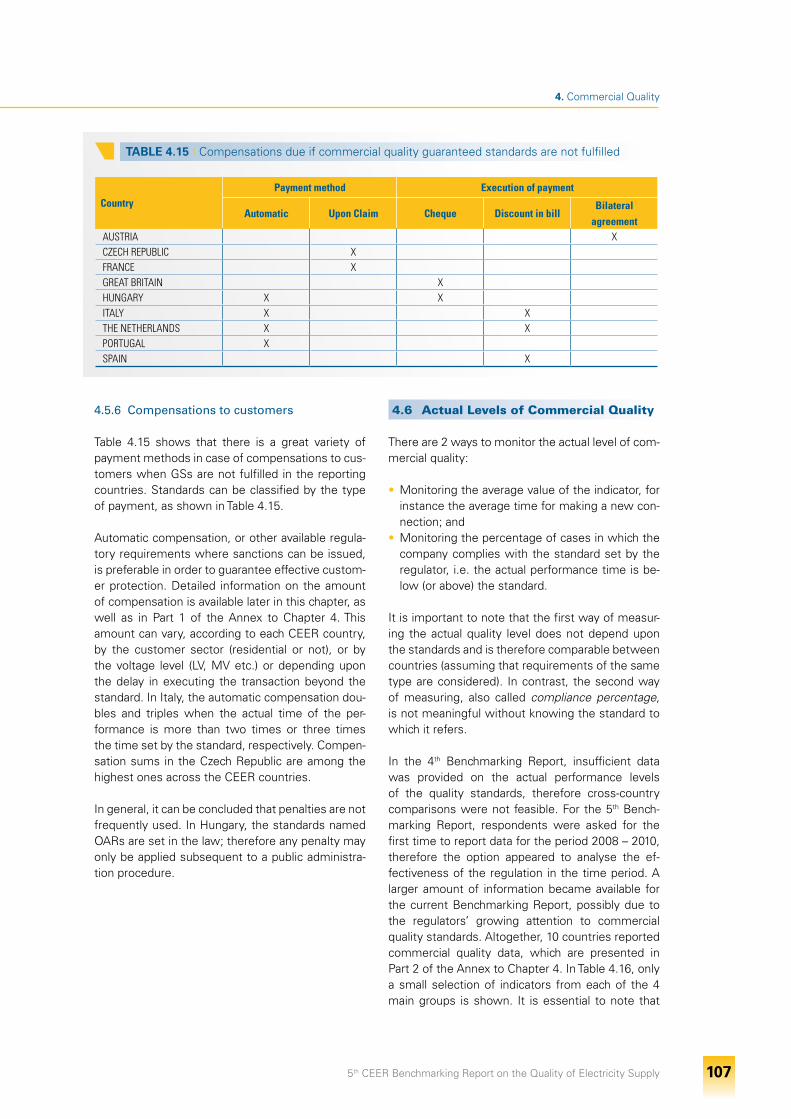
5th CEER Benchmarking Report on the Quality of Electricity Supply 107
4. Commercial Quality
4.5.6 Compensations to customers
Table 4.15 shows that there is a great variety of payment methods in case of compensations to cus-tomers when GSs are not fulfilled in the reporting countries. Standards can be classified by the type of payment, as shown in Table 4.15.
Automatic compensation, or other available regula-tory requirements where sanctions can be issued, is preferable in order to guarantee effective custom-er protection. Detailed information on the amount of compensation is available later in this chapter, as well as in Part 1 of the Annex to Chapter 4. This amount can vary, according to each CEER country, by the customer sector (residential or not), or by the voltage level (LV, MV etc.) or depending upon the delay in executing the transaction beyond the standard. In Italy, the automatic compensation dou-bles and triples when the actual time of the per-formance is more than two times or three times the time set by the standard, respectively. Compen-sation sums in the Czech Republic are among the highest ones across the CEER countries.
In general, it can be concluded that penalties are not frequently used. In Hungary, the standards named OARs are set in the law; therefore any penalty may only be applied subsequent to a public administra-tion procedure.
4.6 Actual Levels of Commercial Quality
There are 2 ways to monitor the actual level of com-mercial quality:
• Monitoring the average value of the indicator, for instance the average time for making a new con-nection; and
• Monitoring the percentage of cases in which the company complies with the standard set by the regulator, i.e. the actual performance time is be-low (or above) the standard.
It is important to note that the first way of measur-ing the actual quality level does not depend upon the standards and is therefore comparable between countries (assuming that requirements of the same type are considered). In contrast, the second way of measuring, also called compliance percentage, is not meaningful without knowing the standard to which it refers.
In the 4th Benchmarking Report, insufficient data was provided on the actual performance levels of the quality standards, therefore cross-country comparisons were not feasible. For the 5th Bench-marking Report, respondents were asked for the first time to report data for the period 2008 – 2010, therefore the option appeared to analyse the ef-fectiveness of the regulation in the time period. A larger amount of information became available for the current Benchmarking Report, possibly due to the regulators’ growing attention to commercial quality standards. Altogether, 10 countries reported commercial quality data, which are presented in Part 2 of the Annex to Chapter 4. In Table 4.16, only a small selection of indicators from each of the 4 main groups is shown. It is essential to note that
TABLE 4.15 I Compensations due if commercial quality guaranteed standards are not fulfilled
CountryPayment method Execution of payment
Automatic Upon Claim Cheque Discount in billBilateral
agreementAUSTRIA XCZECH REPUBLIC X FRANCE X GREAT BRITAIN X HUNGARY X X ITALY X X THE NETHERLANDS X X PORTUGAL X SPAIN X
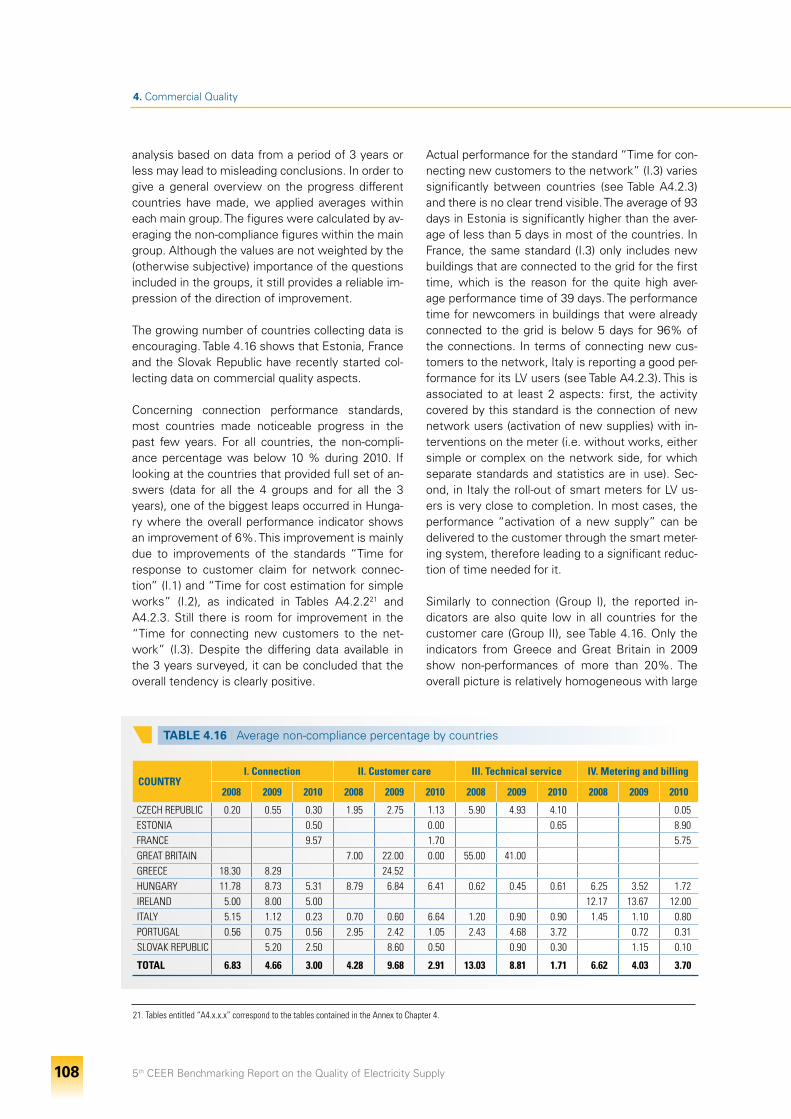
5th CEER Benchmarking Report on the Quality of Electricity Supply 108
4. Commercial Quality
analysis based on data from a period of 3 years or less may lead to misleading conclusions. In order to give a general overview on the progress different countries have made, we applied averages within each main group. The figures were calculated by av-eraging the non-compliance figures within the main group. Although the values are not weighted by the (otherwise subjective) importance of the questions included in the groups, it still provides a reliable im-pression of the direction of improvement.
The growing number of countries collecting data is encouraging. Table 4.16 shows that Estonia, France and the Slovak Republic have recently started col-lecting data on commercial quality aspects.
Concerning connection performance standards, most countries made noticeable progress in the past few years. For all countries, the non-compli-ance percentage was below 10 % during 2010. If looking at the countries that provided full set of an-swers (data for all the 4 groups and for all the 3 years), one of the biggest leaps occurred in Hunga-ry where the overall performance indicator shows an improvement of 6%. This improvement is mainly due to improvements of the standards “Time for response to customer claim for network connec-tion” (I.1) and “Time for cost estimation for simple works” (I.2), as indicated in Tables A4.2.221 and A4.2.3. Still there is room for improvement in the “Time for connecting new customers to the net-work” (I.3). Despite the differing data available in the 3 years surveyed, it can be concluded that the overall tendency is clearly positive.
Actual performance for the standard “Time for con-necting new customers to the network” (I.3) varies significantly between countries (see Table A4.2.3) and there is no clear trend visible. The average of 93 days in Estonia is significantly higher than the aver-age of less than 5 days in most of the countries. In France, the same standard (I.3) only includes new buildings that are connected to the grid for the first time, which is the reason for the quite high aver-age performance time of 39 days. The performance time for newcomers in buildings that were already connected to the grid is below 5 days for 96% of the connections. In terms of connecting new cus-tomers to the network, Italy is reporting a good per-formance for its LV users (see Table A4.2.3). This is associated to at least 2 aspects: first, the activity covered by this standard is the connection of new network users (activation of new supplies) with in-terventions on the meter (i.e. without works, either simple or complex on the network side, for which separate standards and statistics are in use). Sec-ond, in Italy the roll-out of smart meters for LV us-ers is very close to completion. In most cases, the performance “activation of a new supply” can be delivered to the customer through the smart meter-ing system, therefore leading to a significant reduc-tion of time needed for it.
Similarly to connection (Group I), the reported in-dicators are also quite low in all countries for the customer care (Group II), see Table 4.16. Only the indicators from Greece and Great Britain in 2009 show non-performances of more than 20%. The overall picture is relatively homogeneous with large
TABLE 4.16 I Average non-compliance percentage by countries
COUNTRYI. Connection II. Customer care III. Technical service IV. Metering and billing
2008 2009 2010 2008 2009 2010 2008 2009 2010 2008 2009 2010
CZECH REPUBLIC 0.20 0.55 0.30 1.95 2.75 1.13 5.90 4.93 4.10 0.05ESTONIA 0.50 0.00 0.65 8.90FRANCE 9.57 1.70 5.75GREAT BRITAIN 7.00 22.00 0.00 55.00 41.00 GREECE 18.30 8.29 24.52 HUNGARY 11.78 8.73 5.31 8.79 6.84 6.41 0.62 0.45 0.61 6.25 3.52 1.72IRELAND 5.00 8.00 5.00 12.17 13.67 12.00ITALY 5.15 1.12 0.23 0.70 0.60 6.64 1.20 0.90 0.90 1.45 1.10 0.80PORTUGAL 0.56 0.75 0.56 2.95 2.42 1.05 2.43 4.68 3.72 0.72 0.31SLOVAK REPUBLIC 5.20 2.50 8.60 0.50 0.90 0.30 1.15 0.10
TOTAL 6.83 4.66 3.00 4.28 9.68 2.91 13.03 8.81 1.71 6.62 4.03 3.70
21. Tables entitled “A4.x.x.x” correspond to the tables contained in the Annex to Chapter 4.
5th CEER Benchmarking Report on the Quality of Electricity Supply 109
4. Commercial Quality
differences observed only for Italy and the Slovak Republic between the 2009 and 2010 indicator val-ues. Italy saw a deterioration (rise from 0.6% to 6.64% non-compliance) whereas the Slovak Repub-lic saw constant improvement (from 8.6% to 0.5% non-compliance).
The data on the average performance time of re-sponse to customer complaints and enquiries in years between 2008 and 2010 (see Part 2 of the An-nex to Chapter 4) clearly show that although the per-formance of DSOs and USPs/suppliers is different in responding countries, customers will receive a re-sponse to their notice within an average of 15 days. In Portugal, the average response time to customer enquiries in 2010 – 0.46 days for the DSOs and 0.26 days for the USPs (see Table A4.2.6) – is very low because not only written enquiries but also all the phone enquiries (which are usually answered im-mediately or later in the same day) are considered. The average response time to customer complaints in 2010 was 8.0 days for the USPs and 8.5 days for the DSOs.
The indicators of technical service (Group III) re-mained either about the same or improved slightly in every reporting country during the period of 2008 – 2010, see Table 4.16 and Tables A4.2.8 to A4.2.11 for details. The great improvement in performance of technical service in 2010 is mostly due to the in-clusion of Estonia with a low non-compliance value (0.65% in 2010).
Table 4.16 shows that performance indicators for metering and billing (Group IV) are the least moni-tored commercial quality standards. Where histori-cal data is available, slight improvements in perfor-mance can be identified. Hopefully, more countries will be monitoring and reporting their performance levels, so that more thorough analyses can be per-formed in the future.
We would like to note again that the average perfor-mance should not be compared across countries, the only purpose of it is to provide a view into the actual levels of commercial quality, at a glance. Numbers of cases and average performance times can be seen in Part 2 of the Annex to Chapter 4 where the data is available.
4.7 Summary of Benchmarking Results
Tables 4.17 and 4.18 synthesise results in terms of applied standards (see also Section 4.5.1). Stand-ards for DSOs are the largest part of the total: 190 out of 208 national standards. Table 4.17 shows the number of countries where the listed commercial quality standards are in force for the DSOs per type of standard (GS, OS, OAR or OM).
According to Table 4.17, the average number of standards whose type is specified is 12.25 [stand-ards/activity] in the connection (Group I). This figure is the highest among the other groups (see below), meaning that connection to the network in the CEER countries is of primary importance. The figure would be even higher if it referred only to standards I.1 (“Time for response to customer claim for net-work connection”), I.2 (“Time for cost estimation for simple works”) and I.3 (“Time for connecting new customers to the network”) without counting I.4 “Time for disconnection upon customer’s re-quest” (which was introduced as a new commercial quality performance in this benchmarking report).
Customer care (Group II) (with an average value of 10.0 standards/activity), technical service (Group III) (with an average value of 9.8 standards/activity) and metering and billing (Group IV) (with an aver-age value of 9.0 standards/activity) are more or less regulated to the same extent. It can be noticed that great attention is paid to the quickest possible res-toration of supply irrespective of whether loss of supply was caused by faults, missing payments and information on notice for planned interruptions. This confirms the priority in regulation to ensuring the availability of supply. One may assume there is a relation between strong or weak regulation and the importance of the activities in that group. Proof of this may be the subject of future investigations.
Furthermore, as sign of prospective development of regulation, the presence of 10 OMs is promising considering a likely introduction of new standards in the close future.
Looking at the average number of standards per activity group, there is a considerable difference be-tween them. OSs are more frequently applied for regulation of customer care (Group II) issues than in the case of the other 3 groups of activities. In some important cases GSs, OSs and OARs are used in parallel by the CEER countries.
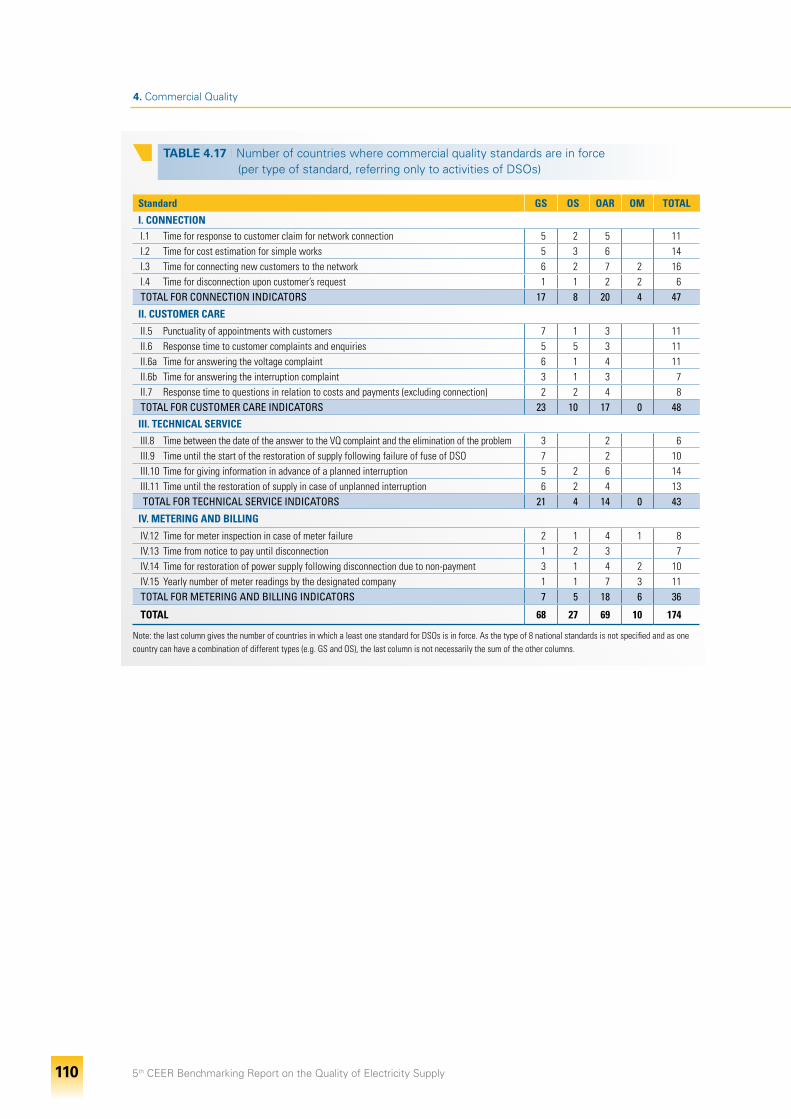
5th CEER Benchmarking Report on the Quality of Electricity Supply 110
4. Commercial Quality
TABLE 4.17 I Number of countries where commercial quality standards are in force (per type of standard, referring only to activities of DSOs)
Standard GS OS OAR OM TOTAL
I. CONNECTIONI.1 Time for response to customer claim for network connection 5 2 5 11I.2 Time for cost estimation for simple works 5 3 6 14I.3 Time for connecting new customers to the network 6 2 7 2 16I.4 Time for disconnection upon customer’s request 1 1 2 2 6TOTAL FOR CONNECTION INDICATORS 17 8 20 4 47
II. CUSTOMER CARE
II.5 Punctuality of appointments with customers 7 1 3 11II.6 Response time to customer complaints and enquiries 5 5 3 11II.6a Time for answering the voltage complaint 6 1 4 11II.6b Time for answering the interruption complaint 3 1 3 7II.7 Response time to questions in relation to costs and payments (excluding connection) 2 2 4 8TOTAL FOR CUSTOMER CARE INDICATORS 23 10 17 0 48
III. TECHNICAL SERVICE
III.8 Time between the date of the answer to the VQ complaint and the elimination of the problem 3 2 6III.9 Time until the start of the restoration of supply following failure of fuse of DSO 7 2 10III.10 Time for giving information in advance of a planned interruption 5 2 6 14III.11 Time until the restoration of supply in case of unplanned interruption 6 2 4 13 TOTAL FOR TECHNICAL SERVICE INDICATORS 21 4 14 0 43
IV. METERING AND BILLING
IV.12 Time for meter inspection in case of meter failure 2 1 4 1 8IV.13 Time from notice to pay until disconnection 1 2 3 7IV.14 Time for restoration of power supply following disconnection due to non-payment 3 1 4 2 10IV.15 Yearly number of meter readings by the designated company 1 1 7 3 11TOTAL FOR METERING AND BILLING INDICATORS 7 5 18 6 36
TOTAL 68 27 69 10 174
Note: the last column gives the number of countries in which a least one standard for DSOs is in force. As the type of 8 national standards is not specified and as one country can have a combination of different types (e.g. GS and OS), the last column is not necessarily the sum of the other columns.
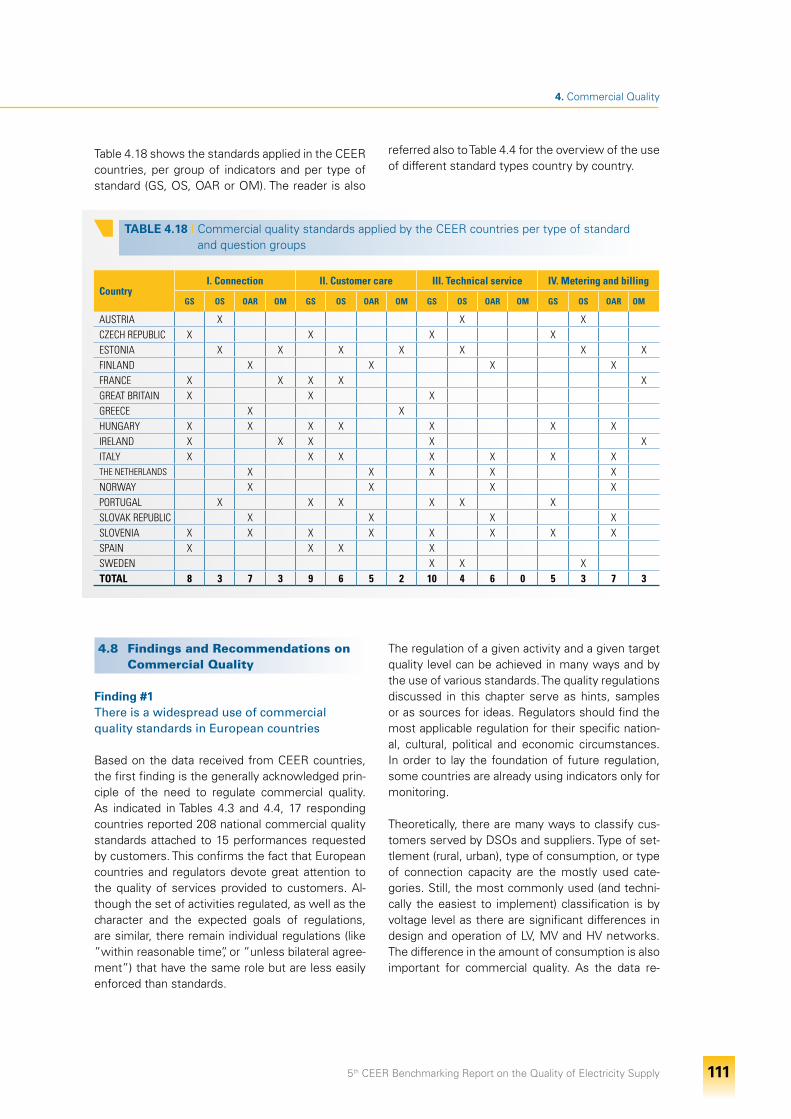
5th CEER Benchmarking Report on the Quality of Electricity Supply 111
4. Commercial Quality
Table 4.18 shows the standards applied in the CEER countries, per group of indicators and per type of standard (GS, OS, OAR or OM). The reader is also
TABLE 4.18 I Commercial quality standards applied by the CEER countries per type of standard and question groups
CountryI. Connection II. Customer care III. Technical service IV. Metering and billing
GS OS OAR OM GS OS OAR OM GS OS OAR OM GS OS OAR OM
AUSTRIA X X XCZECH REPUBLIC X X X XESTONIA X X X X X X XFINLAND X X X XFRANCE X X X X XGREAT BRITAIN X X XGREECE X XHUNGARY X X X X X X XIRELAND X X X X XITALY X X X X X X XTHE NETHERLANDS X X X X XNORWAY X X X XPORTUGAL X X X X X XSLOVAK REPUBLIC X X X XSLOVENIA X X X X X X X XSPAIN X X X XSWEDEN X X XTOTAL 8 3 7 3 9 6 5 2 10 4 6 0 5 3 7 3
4.8 Findings and Recommendations on Commercial Quality
Finding #1There is a widespread use of commercial quality standards in European countries
Based on the data received from CEER countries, the first finding is the generally acknowledged prin-ciple of the need to regulate commercial quality. As indicated in Tables 4.3 and 4.4, 17 responding countries reported 208 national commercial quality standards attached to 15 performances requested by customers. This confirms the fact that European countries and regulators devote great attention to the quality of services provided to customers. Al-though the set of activities regulated, as well as the character and the expected goals of regulations, are similar, there remain individual regulations (like ”within reasonable time”, or ”unless bilateral agree-ment”) that have the same role but are less easily enforced than standards.
The regulation of a given activity and a given target quality level can be achieved in many ways and by the use of various standards. The quality regulations discussed in this chapter serve as hints, samples or as sources for ideas. Regulators should find the most applicable regulation for their specific nation-al, cultural, political and economic circumstances. In order to lay the foundation of future regulation, some countries are already using indicators only for monitoring.
Theoretically, there are many ways to classify cus-tomers served by DSOs and suppliers. Type of set-tlement (rural, urban), type of consumption, or type of connection capacity are the mostly used cate-gories. Still, the most commonly used (and techni-cally the easiest to implement) classification is by voltage level as there are significant differences in design and operation of LV, MV and HV networks. The difference in the amount of consumption is also important for commercial quality. As the data re-
referred also to Table 4.4 for the overview of the use of different standard types country by country.
5th CEER Benchmarking Report on the Quality of Electricity Supply 112
4. Commercial Quality
veals, regulatory authorities – acknowledging these specific features – either set standards by voltage levels or, while doing this, focus only on LV and thus on domestic and other small customers.
Finding #2There is a trend for increasing the adoption of GSs
The data collected shows that in general commer-cial quality indicators can be used by regulators in 3 ways:
• To define OSs, either without any economic con-sequence for the DSO or supplier upon non-com-pliance or including economic sanctions. Regula-tors are entitled to impose sanctions like fines or reducing tariffs;
• To set GSs by which customers receive direct compensation if standards are not met; or
• To apply OAR and in case of non-compliance sanctions can be imposed by the regulator.
The analysis for this Report confirms that there is a general trend over time to move from OSs to GSs, which was already identified by the 4th Benchmark-ing Report. The survey reports 80 GSs in force, compared to 32 OSs.
In countries where competition works properly, the regulatory authorities engage themselves in the surveillance of DSOs’ activities in a much greater proportion than in respect of suppliers’ activities. This is confirmed by the number of standards used in the countries: 190 standards for DSOs, 11 for suppliers and USP.
Enforce GSs in order to protect customers better
It is recommended that regulators should apply GSs with automatic compensation or OSs or OARs associated with the option of sanction-ing. For the most important connection (Group I) standards, a combination of OS with economic sanctions and GSs is recommended, in order both to improve the average performances and to protect customers from worst service condi-tions.
This recommendation is especially applicable for the case of DSOs. With regard to services by suppliers, where markets work properly and ef-ficiently, CEER believes that only few regulations would be needed in the long run.
Recommendation #2
Periodically review the national regulations of commercial quality
It is indeed important to have a periodic review of the commercial quality standards, taking into account the development of national conditions (e.g. the retail market opening, the availability of technological developments such as smart me-ters) and - most importantly - the expectations of the customers. Monitoring the actual level of commercial quality (average values of the indi-cators and percentages of fulfilment) has an im-portant role in such periodic reviews. The most important factor in this process is the availability of ample and realistic data. In order to provide these, it is inevitable to use the OM option, es-pecially if its aim is to substantiate future regula-tion of a so far unregulated activity.
Care should be taken concerning the establish-ment and selection of the possible minimum number of standards otherwise the large num-ber of those may burden the data analysis and evaluation, and may induce unnecessary expens-es for the operators, together with an unwanted increase in tariffs.
It is recommended to treat separately the ac-tual performances for MV and HV customers, in order to avoid a distortion effect to the median value.
Recommendation #1
5th CEER Benchmarking Report on the Quality of Electricity Supply 113
4. Commercial Quality
Finding #3Priority of having access to electricity
The survey clearly shows that priority is given to the standards for connection of new customers to the network (I.1 – I.3 in Table 4.2) or for minimis-ing the amount of time that existing customers are interrupted (III.9 and III.11 in Table 4.2) and also to minimising the inconvenience of interruptions (III.10 in Table 4.2). CEER supports this priority ranking, as it aims at the maximum possible availability of elec-tricity supply and matches well the expectations of the customers.
Finding #4There are proven opportunities of high tech developments for improving quality for customers
Having accurate billing, based on actual, measured consumption is becoming more and more impor-tant both for customers and licensees. All parties may expect a more detailed picture of consumption habits (profiles) on the basis of which they would be able to plan network maintenance, energy purchas-es or eventual changes in the daily consumption practices. Recognising this need, many countries have launched programmes aiming at collecting monthly (or even more frequent) meter data with meter readings, therefore smart meters are being put in operation in a number of countries. Smart meters give a more accurate picture of electricity consumption, provide the parties with an accurate picture of grid status and can ease and shorten both the procedure of supplier switching and the pro-cess of dis- and re-connection due to unpaid bills. Indeed, the data reveals that the timeliest connec-tion (activation) of LV network users takes place in one country where smart meters are already widely deployed and used for this purpose.
Finding #5New trends in regulating customer relations
In addition to the customer’s expectation to be con-nected or reconnected as quickly as possible (see Finding #3), there is the noticeable need for a sub-stantive answer from the DSO/supplier to any cus-tomer query within a reasonable limit of time. The data reveals that emphasis is placed by the stand-ards applied to the written form of communication. This results in an increasingly incomplete picture of the quality of responses to customer queries for two different reasons. The first is the fast growth in non-written forms of communication like telephone (fixed and cell-phone) and internet. The second is that in some countries the more traditional ap-proach of visiting local customer centres continues.
Properly prioritise the national regulations of commercial quality
CEER recommends countries and their regula-tors to assess customer priorities before creat-ing new regulatory framework accordingly.
Recommendation #3
Maximise the benefits of high tech develop-ments for customers
It is recommended to monitor the commercial quality performances, in order to ensure that the possible benefits of high tech developments - when implemented - provide value for money paid by the customers.
Recommendation #4
Develop the regulation of customer relations CEER recommends that NRAs consider the de-velopment of procedures on how to regulate both customer communications by phone and – if national practices require – visits to customer centres. Especially, in the increasingly important field of phone contacts, the performances of distribution operators and USPs should be moni-tored, with the aim of getting information for de-veloping of regulations. Attention should be paid to a rapid, exhaustive and useful response.
Recommendation #5
5th CEER Benchmarking Report on the Quality of Electricity Supply 114
Annex to Chapter 2 on Continuity of Supply: Data
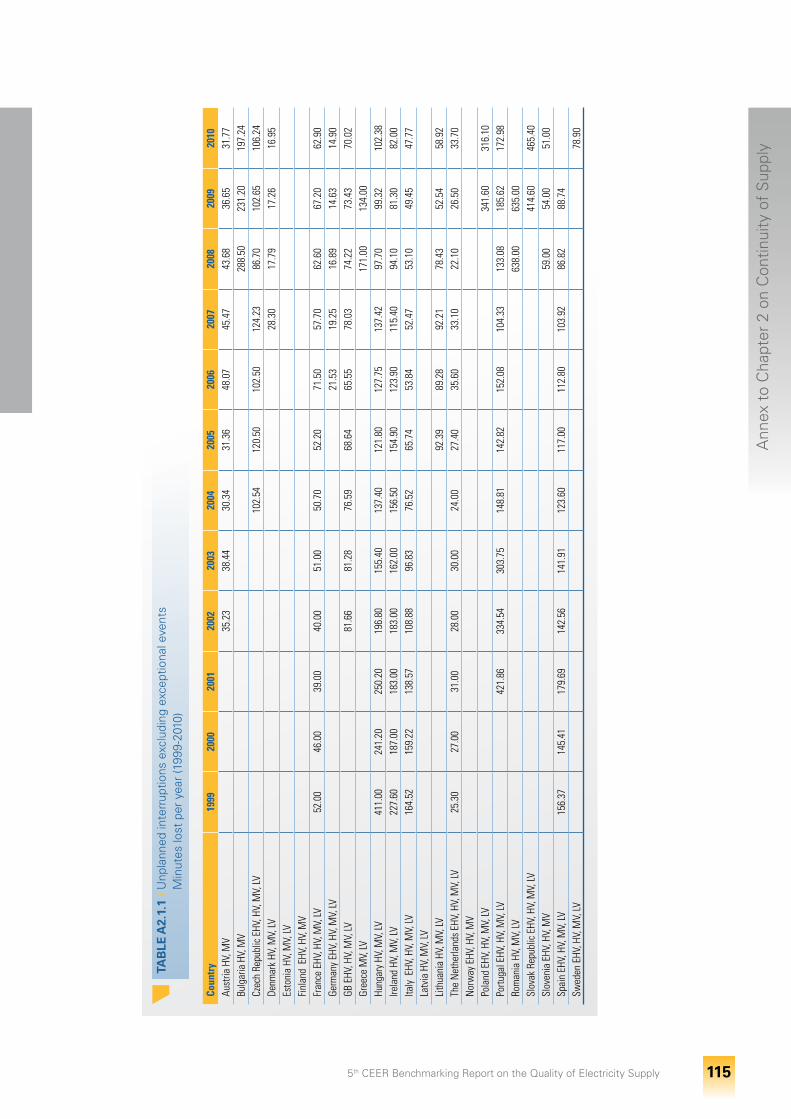
5th CEER Benchmarking Report on the Quality of Electricity Supply 115
Ann
ex t
o C
hapt
er 2
on
Con
tinui
ty o
f S
uppl
y
T
AB
LE A
2.1.
1 I U
npla
nned
inte
rrup
tions
exc
ludi
ng e
xcep
tiona
l eve
nts
Min
utes
lost
per
yea
r (1
999-
2010
)
Coun
try
1999
2000
2001
2002
2003
2004
2005
2006
2007
2008
2009
2010
Aust
ria H
V, M
V35
.23
38.4
430
.34
31.3
648
.07
45.4
743
.68
36.6
531
.77
Bulg
aria
HV,
MV
288.
5023
1.20
197.
24Cz
ech
Repu
blic
EHV
, HV,
MV,
LV10
2.54
120.
5010
2.50
124.
2386
.70
102.
6510
6.24
Denm
ark
HV, M
V, LV
28.3
017
.79
17.2
616
.95
Esto
nia
HV, M
V, LV
Finl
and
EHV
, HV,
MV
Fran
ce E
HV, H
V, M
V, LV
52.0
046
.00
39.0
040
.00
51.0
050
.70
52.2
071
.50
57.7
062
.60
67.2
062
.90
Germ
any
EHV,
HV,
MV,
LV21
.53
19.2
516
.89
14.6
314
.90
GB E
HV, H
V, M
V, LV
81.6
681
.28
76.5
968
.64
65.5
578
.03
74.2
273
.43
70.0
2Gr
eece
MV,
LV17
1.00
134.
00Hu
ngar
y HV
, MV,
LV41
1.00
241.
2025
0.20
196.
8015
5.40
137.
4012
1.80
127.
7513
7.42
97.7
099
.32
102.
38Ire
land
HV,
MV,
LV22
7.60
187.
0018
3.00
183.
0016
2.00
156.
5015
4.90
123.
9011
5.40
94.1
081
.30
82.0
0Ita
ly E
HV, H
V, M
V, LV
164.
5215
9.22
138.
5710
8.88
96.8
376
.52
65.7
453
.84
52.4
753
.10
49.4
547
.77
Latv
ia H
V, M
V, LV
Lith
uani
a HV
, MV,
LV92
.39
89.2
892
.21
78.4
352
.54
58.9
2Th
e N
ethe
rland
s EH
V, H
V, M
V, LV
25.3
027
.00
31.0
028
.00
30.0
024
.00
27.4
035
.60
33.1
022
.10
26.5
033
.70
Nor
way
EHV
, HV,
MV
Pola
nd E
HV, H
V, M
V, LV
341.
6031
6.10
Portu
gal E
HV, H
V, M
V, LV
421.
8633
4.54
303.
7514
8.81
142.
8215
2.08
104.
3313
3.08
185.
6217
2.98
Rom
ania
HV,
MV,
LV63
8.00
635.
00Sl
ovak
Rep
ublic
EHV
, HV,
MV,
LV41
4.60
465.
40Sl
oven
ia E
HV, H
V, M
V59
.00
54.0
051
.00
Spai
n EH
V, H
V, M
V, LV
156.
3714
5.41
179.
6914
2.56
141.
9112
3.60
117.
0011
2.80
103.
9286
.82
88.7
4Sw
eden
EHV
, HV,
MV,
LV78
.90
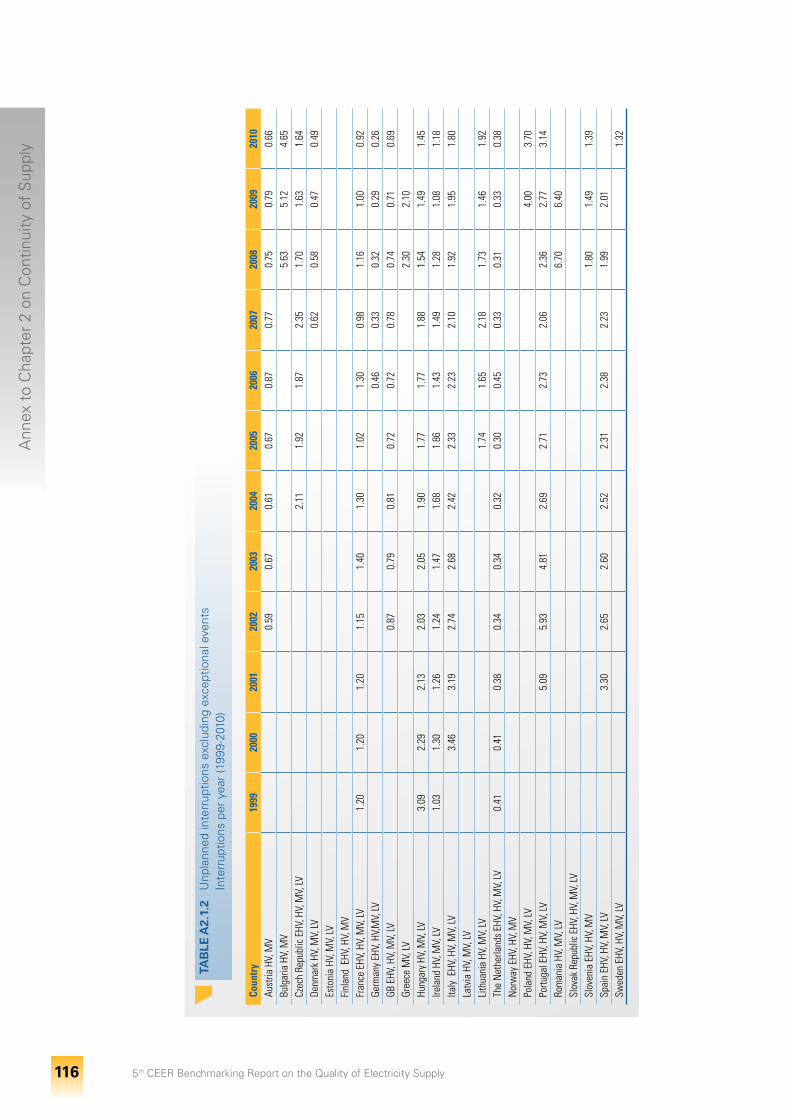
5th CEER Benchmarking Report on the Quality of Electricity Supply 116
Ann
ex t
o C
hapt
er 2
on
Con
tinui
ty o
f S
uppl
y
T
AB
LE A
2.1.
2 I U
npla
nned
inte
rrup
tions
exc
ludi
ng e
xcep
tiona
l eve
nts
In
terr
uptio
ns p
er y
ear
(199
9-20
10)
Coun
try
1999
2000
2001
2002
2003
2004
2005
2006
2007
2008
2009
2010
Aust
ria H
V, M
V0.
590.
670.
610.
670.
870.
770.
750.
790.
66Bu
lgar
ia H
V, M
V5.
635.
124.
65Cz
ech
Repu
blic
EHV
, HV,
MV,
LV2.
111.
921.
872.
351.
701.
631.
64De
nmar
k HV
, MV,
LV0.
620.
580.
470.
49Es
toni
a HV
, MV,
LVFi
nlan
d E
HV, H
V, M
VFr
ance
EHV
, HV,
MV,
LV1.
201.
201.
201.
151.
401.
301.
021.
300.
981.
161.
000.
92Ge
rman
y EH
V, H
V,M
V, LV
0.46
0.33
0.32
0.29
0.26
GB E
HV, H
V, M
V, LV
0.87
0.79
0.81
0.72
0.72
0.78
0.74
0.71
0.69
Gree
ce M
V, LV
2.30
2.10
Hung
ary
HV, M
V, LV
3.09
2.29
2.13
2.03
2.05
1.90
1.77
1.77
1.88
1.54
1.49
1.45
Irela
nd H
V, M
V, LV
1.03
1.30
1.26
1.24
1.47
1.68
1.86
1.43
1.49
1.28
1.08
1.18
Italy
EHV
, HV,
MV,
LV3.
463.
192.
742.
682.
422.
332.
232.
101.
921.
951.
80La
tvia
HV,
MV,
LVLi
thua
nia
HV, M
V, LV
1.74
1.65
2.18
1.73
1.46
1.92
The
Net
herla
nds
EHV,
HV,
MV,
LV0.
410.
410.
380.
340.
340.
320.
300.
450.
330.
310.
330.
38N
orw
ay E
HV, H
V, M
VPo
land
EHV
, HV,
MV,
LV4.
003.
70Po
rtuga
l EHV
, HV,
MV,
LV5.
095.
934.
812.
692.
712.
732.
062.
362.
773.
14Ro
man
ia H
V, M
V, LV
6.70
6.40
Slov
ak R
epub
lic E
HV, H
V, M
V, LV
Slov
enia
EHV
, HV,
MV
1.80
1.49
1.39
Spai
n EH
V, H
V, M
V, LV
3.30
2.65
2.60
2.52
2.31
2.38
2.23
1.99
2.01
Swed
en E
HV, H
V, M
V, LV
1.32
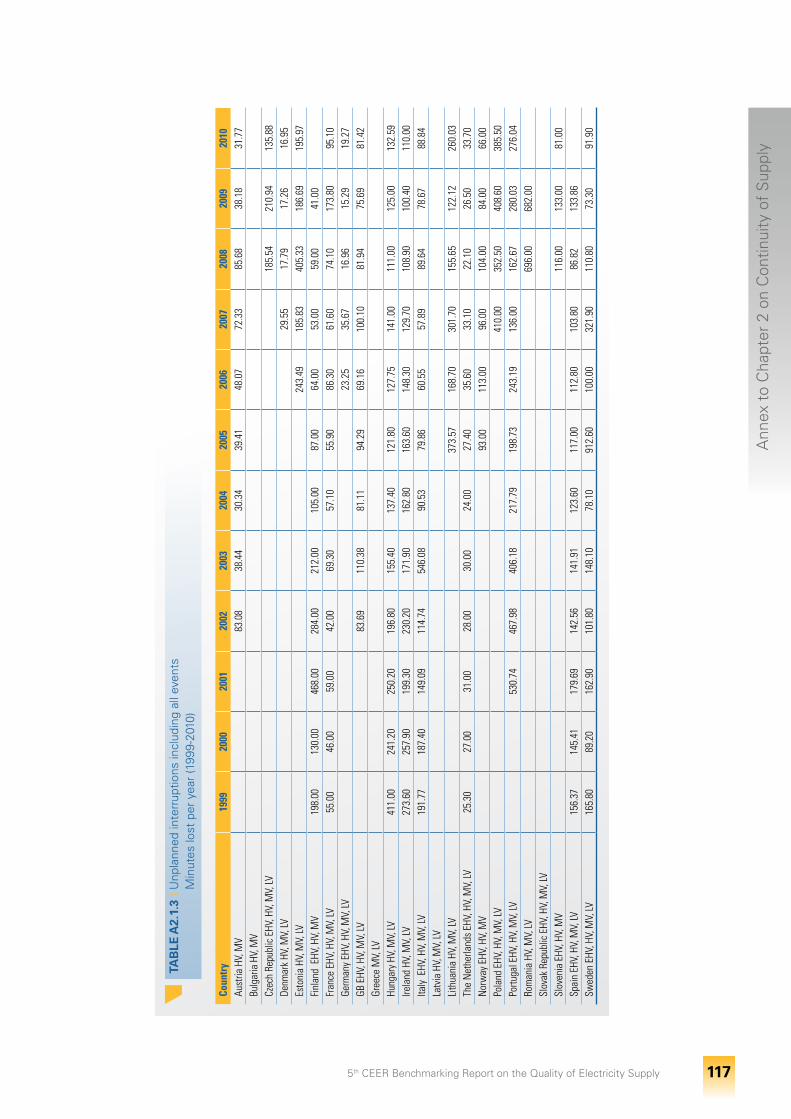
5th CEER Benchmarking Report on the Quality of Electricity Supply 117
Ann
ex t
o C
hapt
er 2
on
Con
tinui
ty o
f S
uppl
y
T
AB
LE A
2.1.
3 I U
npla
nned
inte
rrup
tions
incl
udin
g al
l eve
nts
M
inut
es lo
st p
er y
ear
(199
9-20
10)
Coun
try
1999
2000
2001
2002
2003
2004
2005
2006
2007
2008
2009
2010
Aust
ria H
V, M
V83
.08
38.4
430
.34
39.4
148
.07
72.3
385
.68
38.1
831
.77
Bulg
aria
HV,
MV
Czec
h Re
publ
ic E
HV, H
V, M
V, LV
185.
5421
0.94
135.
88De
nmar
k HV
, MV,
LV29
.55
17.7
917
.26
16.9
5Es
toni
a HV
, MV,
LV24
3.49
185.
8340
5.33
186.
6919
5.97
Finl
and
EHV
, HV,
MV
198.
0013
0.00
468.
0028
4.00
212.
0010
5.00
87.0
064
.00
53.0
059
.00
41.0
0Fr
ance
EHV
, HV,
MV,
LV55
.00
46.0
059
.00
42.0
069
.30
57.1
055
.90
86.3
061
.60
74.1
017
3.80
95.1
0Ge
rman
y EH
V, H
V, M
V, LV
23.2
535
.67
16.9
615
.29
19.2
7GB
EHV
, HV,
MV,
LV83
.69
110.
3881
.11
94.2
969
.16
100.
1081
.94
75.6
981
.42
Gree
ce M
V, LV
Hung
ary
HV, M
V, LV
411.
0024
1.20
250.
2019
6.80
155.
4013
7.40
121.
8012
7.75
141.
0011
1.00
125.
0013
2.59
Irela
nd H
V, M
V, LV
273.
6025
7.90
199.
3023
0.20
171.
9016
2.80
163.
6014
8.30
129.
7010
8.90
100.
4011
0.00
Italy
EHV
, HV,
MV,
LV19
1.77
187.
4014
9.09
114.
7454
6.08
90.5
379
.86
60.5
557
.89
89.6
478
.67
88.8
4La
tvia
HV,
MV,
LVLi
thua
nia
HV, M
V, LV
373.
5716
8.70
301.
7015
5.65
122.
1226
0.03
The
Net
herla
nds
EHV,
HV,
MV,
LV25
.30
27.0
031
.00
28.0
030
.00
24.0
027
.40
35.6
033
.10
22.1
026
.50
33.7
0N
orw
ay E
HV, H
V, M
V93
.00
113.
0096
.00
104.
0084
.00
66.0
0Po
land
EHV
, HV,
MV,
LV41
0.00
352.
5040
8.60
385.
50Po
rtuga
l EHV
, HV,
MV,
LV53
0.74
467.
9840
6.18
217.
7919
8.73
243.
1913
6.00
162.
6728
0.03
276.
04Ro
man
ia H
V, M
V, LV
696.
0068
2.00
Slov
ak R
epub
lic E
HV, H
V, M
V, LV
Slov
enia
EHV
, HV,
MV
116.
0013
3.00
81.0
0Sp
ain
EHV,
HV,
MV,
LV15
6.37
145.
4117
9.69
142.
5614
1.91
123.
6011
7.00
112.
8010
3.80
86.8
213
3.86
Swed
en E
HV, H
V, M
V, LV
165.
8089
.20
162.
9010
1.80
148.
1078
.10
912.
6010
0.00
321.
9011
0.80
73.3
091
.90
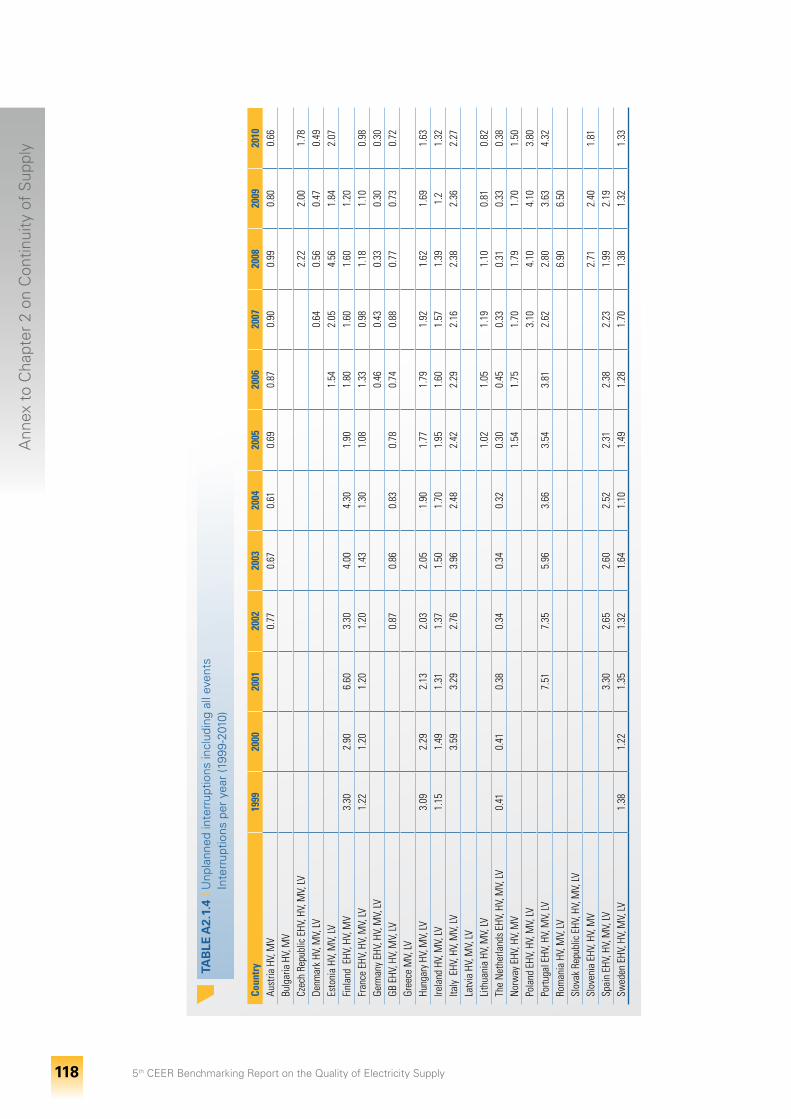
5th CEER Benchmarking Report on the Quality of Electricity Supply 118
Ann
ex t
o C
hapt
er 2
on
Con
tinui
ty o
f S
uppl
y
T
AB
LE A
2.1.
4 I U
npla
nned
inte
rrup
tions
incl
udin
g al
l eve
nts
In
terr
uptio
ns p
er y
ear
(199
9-20
10)
Coun
try
1999
2000
2001
2002
2003
2004
2005
2006
2007
2008
2009
2010
Aust
ria H
V, M
V0.
770.
670.
610.
690.
870.
900.
990.
800.
66Bu
lgar
ia H
V, M
VCz
ech
Repu
blic
EHV
, HV,
MV,
LV2.
222.
001.
78De
nmar
k HV
, MV,
LV0.
640.
560.
470.
49Es
toni
a HV
, MV,
LV1.
542.
054.
561.
842.
07Fi
nlan
d E
HV, H
V, M
V3.
302.
906.
603.
304.
004.
301.
901.
801.
601.
601.
20Fr
ance
EHV
, HV,
MV,
LV1.
221.
201.
201.
201.
431.
301.
081.
330.
981.
181.
100.
98Ge
rman
y EH
V, H
V, M
V, LV
0.46
0.43
0.33
0.30
0.30
GB E
HV, H
V, M
V, LV
0.87
0.86
0.83
0.78
0.74
0.88
0.77
0.73
0.72
Gree
ce M
V, LV
Hung
ary
HV, M
V, LV
3.09
2.29
2.13
2.03
2.05
1.90
1.77
1.79
1.92
1.62
1.69
1.63
Irela
nd H
V, M
V, LV
1.15
1.49
1.31
1.37
1.50
1.70
1.95
1.60
1.57
1.39
1.2
1.32
Italy
EHV
, HV,
MV,
LV3.
593.
292.
763.
962.
482.
422.
292.
162.
382.
362.
27La
tvia
HV,
MV,
LVLi
thua
nia
HV, M
V, LV
1.02
1.05
1.19
1.10
0.81
0.82
The
Net
herla
nds
EHV,
HV,
MV,
LV0.
410.
410.
380.
340.
340.
320.
300.
450.
330.
310.
330.
38N
orw
ay E
HV, H
V, M
V1.
541.
751.
701.
791.
701.
50Po
land
EHV
, HV,
MV,
LV3.
104.
104.
103.
80Po
rtuga
l EHV
, HV,
MV,
LV7.
517.
355.
963.
663.
543.
812.
622.
803.
634.
32Ro
man
ia H
V, M
V, LV
6.90
6.50
Slov
ak R
epub
lic E
HV, H
V, M
V, LV
Slov
enia
EHV
, HV,
MV
2.71
2.40
1.81
Spai
n EH
V, H
V, M
V, LV
3.30
2.65
2.60
2.52
2.31
2.38
2.23
1.99
2.19
Swed
en E
HV, H
V, M
V, LV
1.38
1.22
1.35
1.32
1.64
1.10
1.49
1.28
1.70
1.38
1.32
1.33
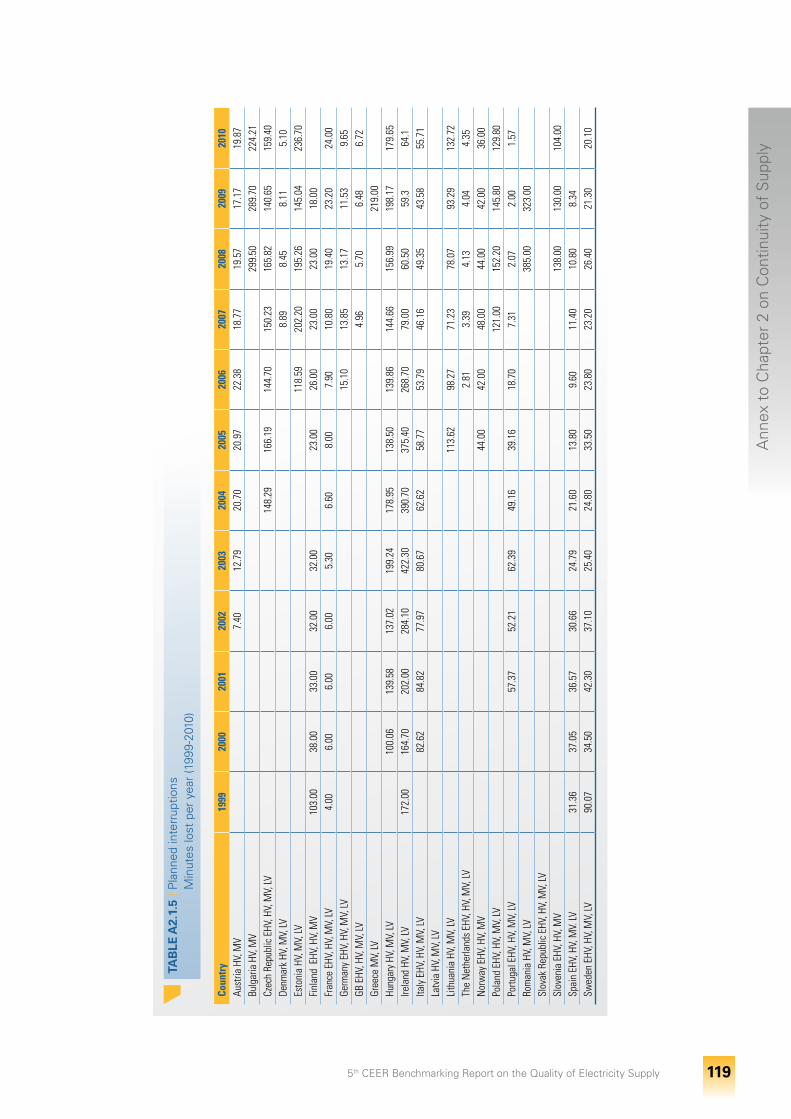
5th CEER Benchmarking Report on the Quality of Electricity Supply 119
Ann
ex t
o C
hapt
er 2
on
Con
tinui
ty o
f S
uppl
y
T
AB
LE A
2.1.
5 I P
lann
ed in
terr
uptio
ns
Min
utes
lost
per
yea
r (1
999-
2010
)
Coun
try
1999
2000
2001
2002
2003
2004
2005
2006
2007
2008
2009
2010
Aust
ria H
V, M
V7.
4012
.79
20.7
020
.97
22.3
818
.77
19.5
717
.17
19.8
7Bu
lgar
ia H
V, M
V29
9.50
289.
7022
4.21
Czec
h Re
publ
ic E
HV, H
V, M
V, LV
148.
2916
6.19
144.
7015
0.23
165.
8214
0.65
159.
40De
nmar
k HV
, MV,
LV8.
898.
458.
115.
10Es
toni
a HV
, MV,
LV11
8.59
202.
2019
5.26
145.
0423
6.70
Finl
and
EHV
, HV,
MV
103.
0038
.00
33.0
032
.00
32.0
023
.00
26.0
023
.00
23.0
018
.00
Fran
ce E
HV, H
V, M
V, LV
4.00
6.00
6.00
6.00
5.30
6.60
8.00
7.90
10.8
019
.40
23.2
024
.00
Germ
any
EHV,
HV,
MV,
LV15
.10
13.8
513
.17
11.5
39.
65GB
EHV
, HV,
MV,
LV4.
965.
706.
486.
72Gr
eece
MV,
LV21
9.00
Hung
ary
HV, M
V, LV
100.
0613
9.58
137.
0219
9.24
178.
9513
8.50
139.
8614
4.66
156.
9919
8.17
179.
65Ire
land
HV,
MV,
LV17
2.00
164.
7020
2.00
284.
1042
2.30
390.
7037
5.40
268.
7079
.00
60.5
059
.364
.1Ita
ly E
HV, H
V, M
V, LV
82.6
284
.82
77.9
780
.67
62.6
258
.77
53.7
946
.16
49.3
543
.58
55.7
1La
tvia
HV,
MV,
LVLi
thua
nia
HV, M
V, LV
113.
6298
.27
71.2
378
.07
93.2
913
2.72
The
Net
herla
nds
EHV,
HV,
MV,
LV2.
813.
394.
134.
044.
35N
orw
ay E
HV, H
V, M
V44
.00
42.0
048
.00
44.0
042
.00
36.0
0Po
land
EHV
, HV,
MV,
LV12
1.00
152.
2014
5.80
129.
80Po
rtuga
l EHV
, HV,
MV,
LV57
.37
52.2
162
.39
49.1
639
.16
18.7
07.
312.
072.
001.
57Ro
man
ia H
V, M
V, LV
385.
0032
3.00
Slov
ak R
epub
lic E
HV, H
V, M
V, LV
Slov
enia
EHV
, HV,
MV
138.
0013
0.00
104.
00Sp
ain
EHV,
HV,
MV.
LV31
.36
37.0
536
.57
30.6
624
.79
21.6
013
.80
9.60
11.4
010
.80
8.34
Swed
en E
HV, H
V, M
V, LV
90.0
734
.50
42.3
037
.10
25.4
024
.80
33.5
023
.80
23.2
026
.40
21.3
020
.10
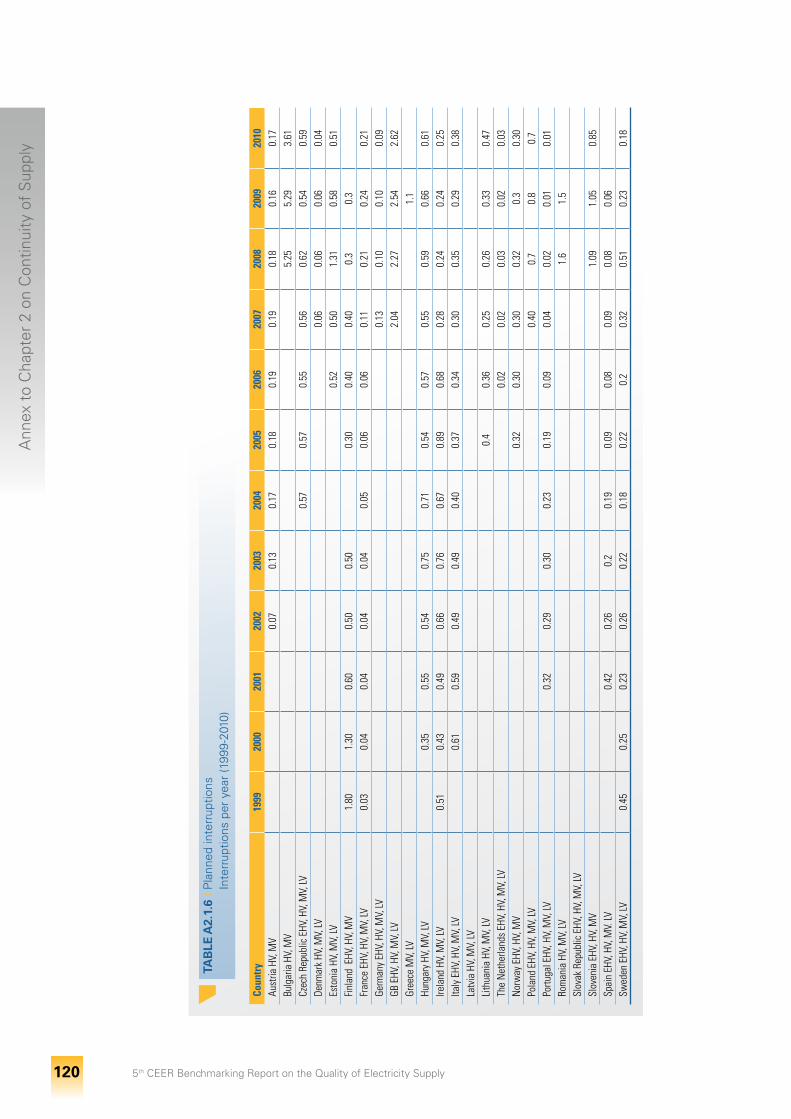
5th CEER Benchmarking Report on the Quality of Electricity Supply 120
Ann
ex t
o C
hapt
er 2
on
Con
tinui
ty o
f S
uppl
y
T
AB
LE A
2.1.
6 I P
lann
ed in
terr
uptio
ns
Inte
rrup
tions
per
yea
r (1
999-
2010
)
Coun
try
1999
2000
2001
2002
2003
2004
2005
2006
2007
2008
2009
2010
Aust
ria H
V, M
V0.
070.
130.
170.
180.
190.
190.
180.
160.
17Bu
lgar
ia H
V, M
V5.
255.
293.
61Cz
ech
Repu
blic
EHV
, HV,
MV,
LV0.
570.
570.
550.
560.
620.
540.
59De
nmar
k HV
, MV,
LV0.
060.
060.
060.
04Es
toni
a HV
, MV,
LV0.
520.
501.
310.
580.
51Fi
nlan
d E
HV, H
V, M
V1.
801.
300.
600.
500.
500.
300.
400.
400.
30.
3Fr
ance
EHV
, HV,
MV,
LV0.
030.
040.
040.
040.
040.
050.
060.
060.
110.
210.
240.
21Ge
rman
y EH
V, H
V, M
V, LV
0.13
0.10
0.10
0.09
GB E
HV, H
V, M
V, LV
2.04
2.27
2.54
2.62
Gree
ce M
V, LV
1.1
Hung
ary
HV, M
V, LV
0.35
0.55
0.54
0.75
0.71
0.54
0.57
0.55
0.59
0.66
0.61
Irela
nd H
V, M
V, LV
0.51
0.43
0.49
0.66
0.76
0.67
0.89
0.68
0.28
0.24
0.24
0.25
Italy
EHV
, HV,
MV,
LV0.
610.
590.
490.
490.
400.
370.
340.
300.
350.
290.
38La
tvia
HV,
MV,
LVLi
thua
nia
HV, M
V, LV
0.4
0.36
0.25
0.26
0.33
0.47
The
Net
herla
nds
EHV,
HV,
MV,
LV0.
020.
020.
030.
020.
03N
orw
ay E
HV, H
V, M
V0.
320.
300.
300.
320.
30.
30Po
land
EHV
, HV,
MV,
LV0.
400.
70.
80.
7Po
rtuga
l EHV
, HV,
MV,
LV0.
320.
290.
300.
230.
190.
090.
040.
020.
010.
01Ro
man
ia H
V, M
V, LV
1.6
1.5
Slov
ak R
epub
lic E
HV, H
V, M
V, LV
Slov
enia
EHV
, HV,
MV
1.09
1.05
0.85
Spai
n EH
V, H
V, M
V. LV
0.42
0.26
0.2
0.19
0.09
0.08
0.09
0.08
0.06
Swed
en E
HV, H
V, M
V, LV
0.45
0.25
0.23
0.26
0.22
0.18
0.22
0.2
0.32
0.51
0.23
0.18
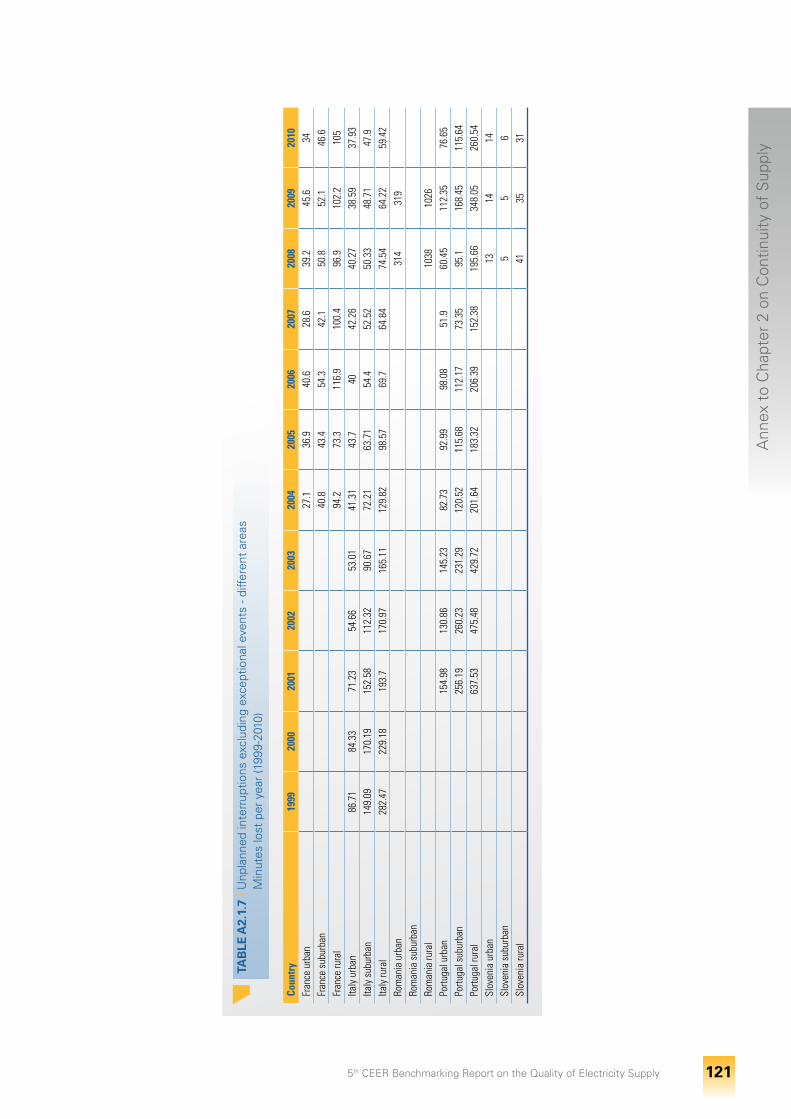
5th CEER Benchmarking Report on the Quality of Electricity Supply 121
Ann
ex t
o C
hapt
er 2
on
Con
tinui
ty o
f S
uppl
y
T
AB
LE A
2.1.
7 I U
npla
nned
inte
rrup
tions
exc
ludi
ng e
xcep
tiona
l eve
nts
- diff
eren
t ar
eas
M
inut
es lo
st p
er y
ear
(199
9-20
10)
Coun
try
1999
2000
2001
2002
2003
2004
2005
2006
2007
2008
2009
2010
Fran
ce u
rban
27.1
36.9
40.6
28.6
39.2
45.6
34Fr
ance
sub
urba
n40
.843
.454
.342
.150
.852
.146
.6Fr
ance
rura
l94
.273
.311
6.9
100.
496
.910
2.2
105
Italy
urb
an86
.71
84.3
371
.23
54.6
653
.01
41.3
143
.740
42.2
640
.27
38.5
937
.93
Italy
sub
urba
n14
9.09
170.
1915
2.58
112.
3290
.67
72.2
163
.71
54.4
52.5
250
.33
48.7
147
.9Ita
ly ru
ral
282.
4722
9.18
193.
717
0.97
165.
1112
9.82
98.5
769
.764
.84
74.5
464
.22
59.4
2Ro
man
ia u
rban
314
319
Rom
ania
sub
urba
nRo
man
ia ru
ral
1038
1026
Portu
gal u
rban
154.
9813
0.86
145.
2382
.73
92.9
998
.08
51.9
60.4
511
2.35
76.6
5Po
rtuga
l sub
urba
n25
6.19
260.
2323
1.29
120.
5211
5.68
112.
1773
.35
95.1
168.
4511
5.64
Portu
gal r
ural
637.
5347
5.48
429.
7220
1.64
183.
3220
6.39
152.
3819
5.66
348.
0526
0.54
Slov
enia
urb
an13
1414
Slov
enia
sub
urba
n5
56
Slov
enia
rura
l41
3531
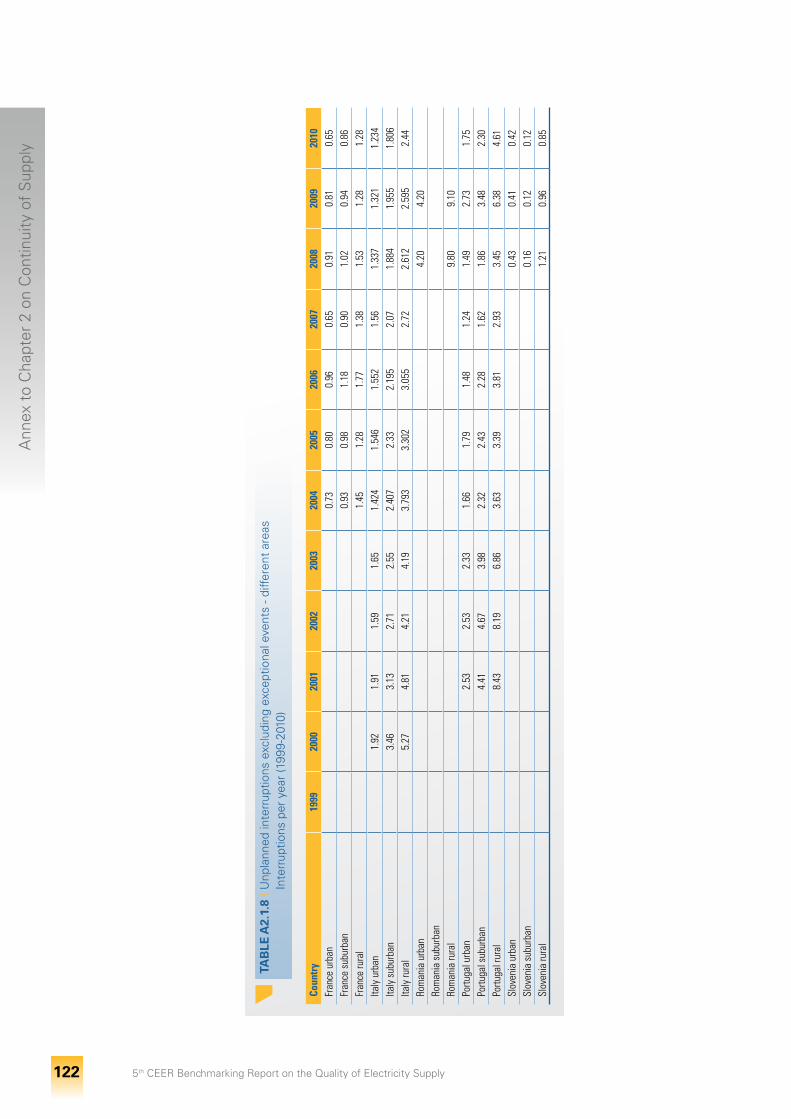
5th CEER Benchmarking Report on the Quality of Electricity Supply 122
Ann
ex t
o C
hapt
er 2
on
Con
tinui
ty o
f S
uppl
y
T
AB
LE A
2.1.
8 I U
npla
nned
inte
rrup
tions
exc
ludi
ng e
xcep
tiona
l eve
nts
- diff
eren
t ar
eas
In
terr
uptio
ns p
er y
ear
(199
9-20
10)
Coun
try
1999
2000
2001
2002
2003
2004
2005
2006
2007
2008
2009
2010
Fran
ce u
rban
0.73
0.80
0.96
0.65
0.91
0.81
0.65
Fran
ce s
ubur
ban
0.93
0.98
1.18
0.90
1.02
0.94
0.86
Fran
ce ru
ral
1.45
1.28
1.77
1.38
1.53
1.28
1.28
Italy
urb
an1.
921.
911.
591.
651.
424
1.54
61.
552
1.56
1.33
71.
321
1.23
4Ita
ly s
ubur
ban
3.46
3.13
2.71
2.55
2.40
72.
332.
195
2.07
1.88
41.
955
1.80
6Ita
ly ru
ral
5.27
4.81
4.21
4.19
3.79
33.
302
3.05
52.
722.
612
2.59
52.
44Ro
man
ia u
rban
4.20
4.20
Rom
ania
sub
urba
nRo
man
ia ru
ral
9.80
9.10
Portu
gal u
rban
2.53
2.53
2.33
1.66
1.79
1.48
1.24
1.49
2.73
1.75
Portu
gal s
ubur
ban
4.41
4.67
3.98
2.32
2.43
2.28
1.62
1.86
3.48
2.30
Portu
gal r
ural
8.43
8.19
6.86
3.63
3.39
3.81
2.93
3.45
6.38
4.61
Slov
enia
urb
an0.
430.
410.
42Sl
oven
ia s
ubur
ban
0.16
0.12
0.12
Slov
enia
rura
l1.
210.
960.
85
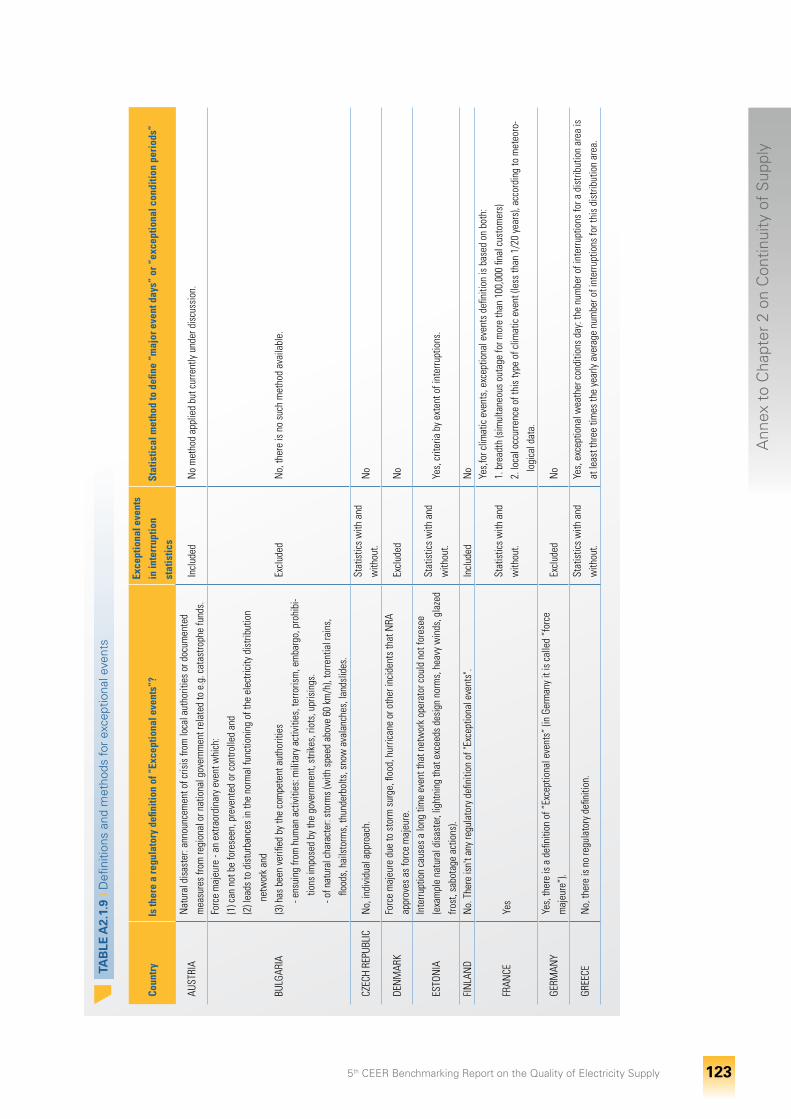
5th CEER Benchmarking Report on the Quality of Electricity Supply 123
Ann
ex t
o C
hapt
er 2
on
Con
tinui
ty o
f S
uppl
y
T
AB
LE A
2.1.
9 I D
efini
tions
and
met
hods
for
exce
ptio
nal e
vent
s
Coun
try
Is th
ere
a re
gula
tory
defi
nitio
n of
“Ex
cept
iona
l eve
nts”
?Ex
cept
iona
l eve
nts
in in
terr
uptio
n st
atis
tics
Stat
istic
al m
etho
d to
defi
ne “
maj
or e
vent
day
s” o
r “ex
cept
iona
l con
ditio
n pe
riod
s”
AUST
RIA
N
atur
al d
isas
ter:
anno
unce
men
t of c
risis
from
loca
l aut
horit
ies
or d
ocum
ente
d m
easu
res
from
regi
onal
or n
atio
nal g
over
nmen
t rel
ated
to e
.g. c
atas
troph
e fu
nds.
Incl
uded
No
met
hod
appl
ied
but c
urre
ntly
und
er d
iscu
ssio
n.
BULG
ARIA
Forc
e m
ajeu
re -
an e
xtra
ordi
nary
eve
nt w
hich
:(1
) can
not
be
fore
seen
, pre
vent
ed o
r con
trolle
d an
d(2
) lea
ds to
dis
turb
ance
s in
the
norm
al fu
nctio
ning
of t
he e
lect
ricity
dis
tribu
tion
netw
ork
and
(3) h
as b
een
verifi
ed b
y th
e co
mpe
tent
aut
horit
ies
- ens
uing
from
hum
an a
ctiv
ities
: mili
tary
act
iviti
es, t
erro
rism
, em
barg
o, p
rohi
bi-
tions
impo
sed
by th
e go
vern
men
t, st
rikes
, rio
ts, u
pris
ings
. - o
f nat
ural
cha
ract
er: s
torm
s (w
ith s
peed
abo
ve 6
0 km
/h),
torre
ntia
l rai
ns,
flood
s, h
ails
torm
s, th
unde
rbol
ts, s
now
ava
lanc
hes,
land
slid
es.
Excl
uded
No,
ther
e is
no
such
met
hod
avai
labl
e.
CZEC
H RE
PUBL
IC
No,
indi
vidu
al a
ppro
ach.
Stat
istic
s w
ith a
nd
with
out.
No
DEN
MAR
KFo
rce
maj
eure
due
to s
torm
sur
ge, fl
ood,
hur
rican
e or
oth
er in
cide
nts
that
NRA
ap
prov
es a
s fo
rce
maj
eure
. Ex
clud
edN
o
ESTO
NIA
In
terru
ptio
n ca
uses
a lo
ng ti
me
even
t tha
t net
wor
k op
erat
or c
ould
not
fore
see
(exa
mpl
e na
tura
l dis
aste
r, lig
htni
ng th
at e
xcee
ds d
esig
n no
rms,
hea
vy w
inds
, gla
zed
frost
, sab
otag
e ac
tions
).
Stat
istic
s w
ith a
nd
with
out.
Yes,
crit
eria
by
exte
nt o
f int
erru
ptio
ns.
FIN
LAN
D
No.
The
re is
n't a
ny re
gula
tory
defi
nitio
n of
"Exc
eptio
nal e
vent
s".
Incl
uded
No
FRAN
CE
Yes
St
atis
tics
with
and
w
ithou
t.
Yes,
for c
limat
ic e
vent
s, e
xcep
tiona
l eve
nts
defin
ition
is b
ased
on
both
:1.
bre
adth
(sim
ulta
neou
s ou
tage
for m
ore
than
100
,000
fina
l cus
tom
ers)
2. lo
cal o
ccur
renc
e of
this
type
of c
limat
ic e
vent
(les
s th
an 1
/20
year
s), a
ccor
ding
to m
eteo
ro-
logi
cal d
ata.
GERM
ANY
Ye
s, th
ere
is a
defi
nitio
n of
“Ex
cept
iona
l eve
nts”
(in
Germ
any
it is
cal
led
“for
ce
maj
eure
”).
Excl
uded
No
GREE
CE
No,
ther
e is
no
regu
lato
ry d
efini
tion.
St
atis
tics
with
and
w
ithou
t.Ye
s, e
xcep
tiona
l wea
ther
con
ditio
ns d
ay: t
he n
umbe
r of i
nter
rupt
ions
for a
dis
tribu
tion
area
is
at le
ast t
hree
tim
es th
e ye
arly
ave
rage
num
ber o
f int
erru
ptio
ns fo
r thi
s di
strib
utio
n ar
ea.
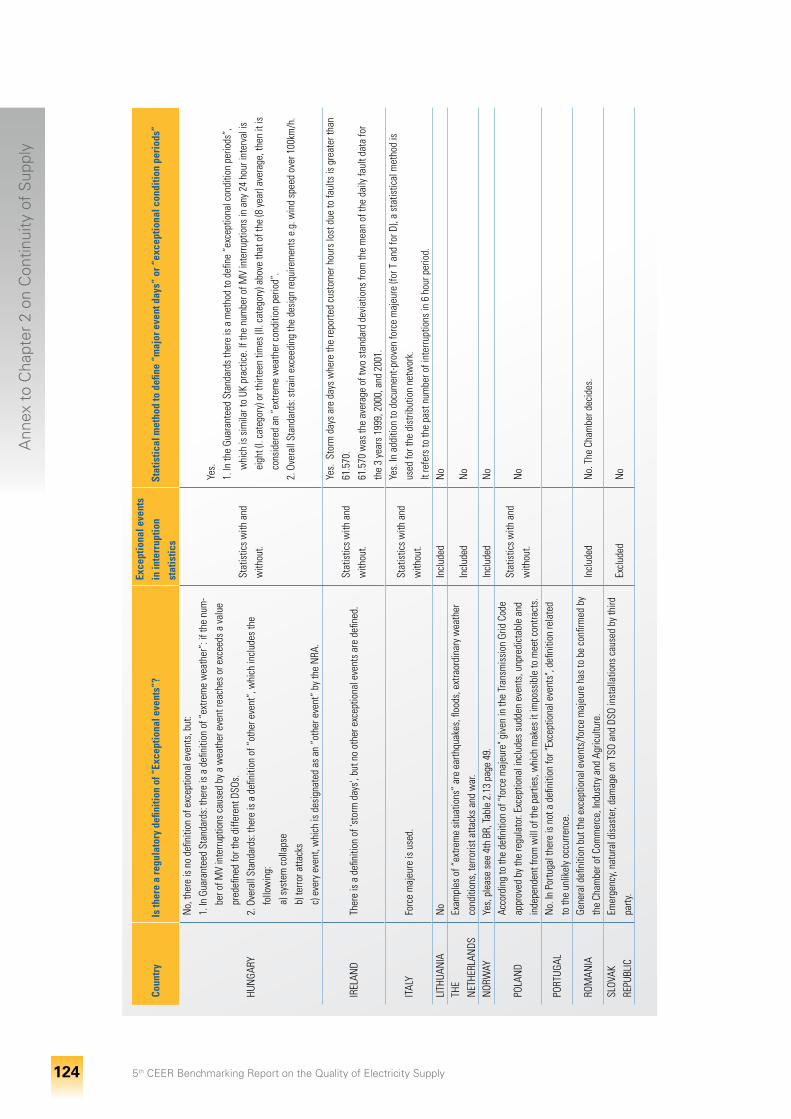
5th CEER Benchmarking Report on the Quality of Electricity Supply 124
Ann
ex t
o C
hapt
er 2
on
Con
tinui
ty o
f S
uppl
y
Coun
try
Is th
ere
a re
gula
tory
defi
nitio
n of
“Ex
cept
iona
l eve
nts”
?Ex
cept
iona
l eve
nts
in in
terr
uptio
n st
atis
tics
Stat
istic
al m
etho
d to
defi
ne “
maj
or e
vent
day
s” o
r “ex
cept
iona
l con
ditio
n pe
riod
s”
HUN
GARY
No,
ther
e is
no
defin
ition
of e
xcep
tiona
l eve
nts,
but
:1.
In G
uara
ntee
d St
anda
rds:
ther
e is
a d
efini
tion
of “
extre
me
wea
ther
”: if
the
num
-be
r of M
V in
terru
ptio
ns c
ause
d by
a w
eath
er e
vent
reac
hes
or e
xcee
ds a
val
ue
pred
efine
d fo
r the
diff
eren
t DSO
s.2.
Ove
rall
Stan
dard
s: th
ere
is a
defi
nitio
n of
“ot
her e
vent
”, w
hich
incl
udes
the
follo
win
g:
a) s
yste
m c
olla
pse
b) te
rror a
ttack
s c)
eve
ry e
vent
, whi
ch is
des
igna
ted
as a
n “o
ther
eve
nt”
by th
e N
RA.
Stat
istic
s w
ith a
nd
with
out.
Yes.
1. In
the
Guar
ante
ed S
tand
ards
ther
e is
a m
etho
d to
defi
ne “
exce
ptio
nal c
ondi
tion
perio
ds”,
w
hich
is s
imila
r to
UK p
ract
ice.
If th
e nu
mbe
r of M
V in
terru
ptio
ns in
any
24
hour
inte
rval
is
eigh
t (I.
cate
gory
) or t
hirte
en ti
mes
(II.
cate
gory
) abo
ve th
at o
f the
(8 y
ear)
aver
age,
then
it is
co
nsid
ered
an
“ext
rem
e w
eath
er c
ondi
tion
perio
d”.
2. O
vera
ll St
anda
rds:
stra
in e
xcee
ding
the
desi
gn re
quire
men
ts e
.g. w
ind
spee
d ov
er 1
00km
/h.
IREL
AND
Th
ere
is a
defi
nitio
n of
'sto
rm d
ays',
but
no
othe
r exc
eptio
nal e
vent
s ar
e de
fined
. St
atis
tics
with
and
w
ithou
t.
Yes.
Sto
rm d
ays
are
days
whe
re th
e re
porte
d cu
stom
er h
ours
lost
due
to fa
ults
is g
reat
er th
an
61.5
70.
61.5
70 w
as th
e av
erag
e of
two
stan
dard
dev
iatio
ns fr
om th
e m
ean
of th
e da
ily fa
ult d
ata
for
the
3 ye
ars
1999
, 200
0, a
nd 2
001.
ITAL
Y Fo
rce
maj
eure
is u
sed.
Stat
istic
s w
ith a
nd
with
out.
Yes.
In a
dditi
on to
doc
umen
t-pro
ven
forc
e m
ajeu
re (f
or T
and
for D
), a
stat
istic
al m
etho
d is
us
ed fo
r the
dis
tribu
tion
netw
ork.
It re
fers
to th
e pa
st n
umbe
r of i
nter
rupt
ions
in 6
hou
r per
iod.
LITH
UAN
IA
No
In
clud
edN
oTH
E N
ETHE
RLAN
DS
Exam
ples
of “
extre
me
situ
atio
ns”
are
earth
quak
es, fl
oods
, ext
raor
dina
ry w
eath
er
cond
ition
s, te
rroris
t atta
cks
and
war
. In
clud
edN
o
NOR
WAY
Ye
s, p
leas
e se
e 4t
h BR
, Tab
le 2
.13
page
49.
In
clud
edN
o
POLA
ND
Ac
cord
ing
to th
e de
finiti
on o
f "fo
rce
maj
eure
" giv
en in
the
Tran
smis
sion
Grid
Cod
e ap
prov
ed b
y th
e re
gula
tor.
Exce
ptio
nal i
nclu
des
sudd
en e
vent
s, u
npre
dict
able
and
in
depe
nden
t fro
m w
ill o
f the
par
ties,
whi
ch m
akes
it im
poss
ible
to m
eet c
ontra
cts.
Stat
istic
s w
ith a
nd
with
out.
No
PORT
UGAL
N
o. In
Por
tuga
l the
re is
not
a d
efini
tion
for "
Exce
ptio
nal e
vent
s", d
efini
tion
rela
ted
to th
e un
likel
y oc
curre
nce.
ROM
ANIA
Ge
nera
l defi
nitio
n bu
t the
exc
eptio
nal e
vent
s/fo
rce
maj
eure
has
to b
e co
nfirm
ed b
y th
e Ch
ambe
r of C
omm
erce
, Ind
ustry
and
Agr
icul
ture
.In
clud
edN
o. T
he C
ham
ber d
ecid
es.
SLOV
AK
REPU
BLIC
Em
erge
ncy,
natu
ral d
isas
ter,
dam
age
on T
SO a
nd D
SO in
stal
latio
ns c
ause
d by
third
pa
rty.
Excl
uded
No
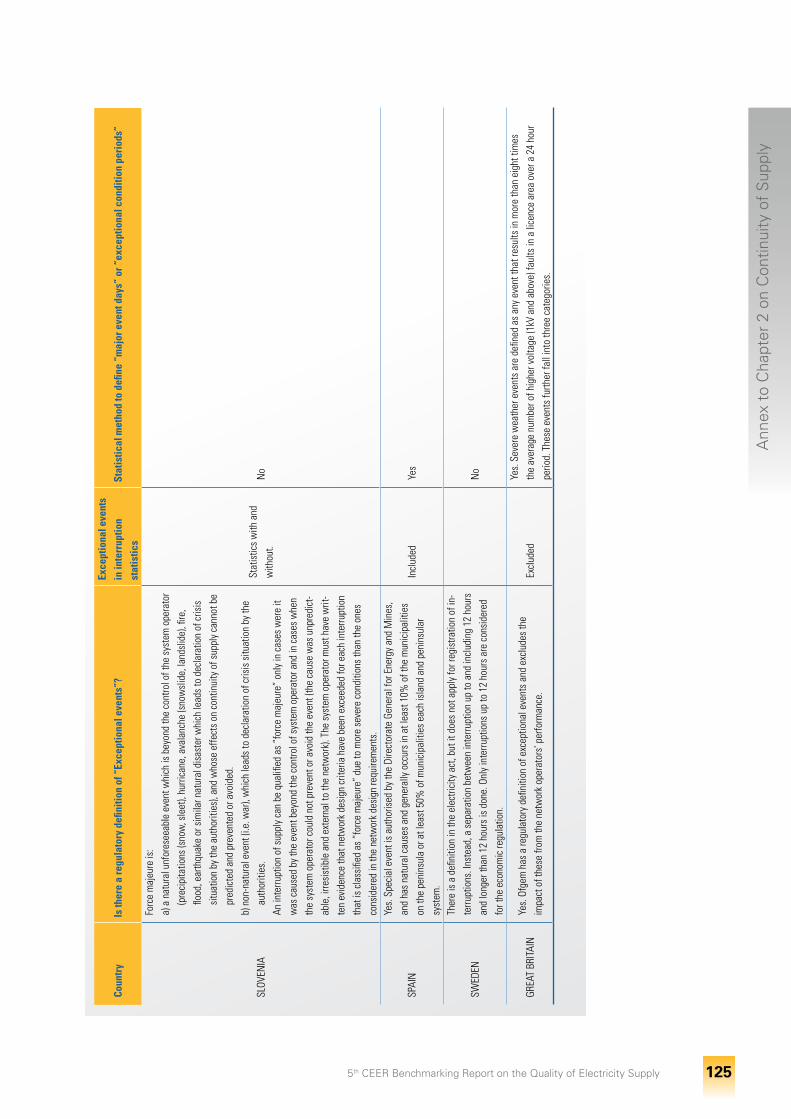
5th CEER Benchmarking Report on the Quality of Electricity Supply 125
Ann
ex t
o C
hapt
er 2
on
Con
tinui
ty o
f S
uppl
y
Coun
try
Is th
ere
a re
gula
tory
defi
nitio
n of
“Ex
cept
iona
l eve
nts”
?Ex
cept
iona
l eve
nts
in in
terr
uptio
n st
atis
tics
Stat
istic
al m
etho
d to
defi
ne “
maj
or e
vent
day
s” o
r “ex
cept
iona
l con
ditio
n pe
riod
s”
SLOV
ENIA
Forc
e m
ajeu
re is
:a)
a n
atur
al u
nfor
esee
able
eve
nt w
hich
is b
eyon
d th
e co
ntro
l of t
he s
yste
m o
pera
tor
(pre
cipi
tatio
ns (s
now
, sle
et),
hurri
cane
, ava
lanc
he (s
now
slid
e, la
ndsl
ide)
, fire
, flo
od, e
arth
quak
e or
sim
ilar n
atur
al d
isas
ter w
hich
lead
s to
dec
lara
tion
of c
risis
si
tuat
ion
by th
e au
thor
ities
), an
d w
hose
effe
cts
on c
ontin
uity
of s
uppl
y ca
nnot
be
pred
icte
d an
d pr
even
ted
or a
void
ed.
b) n
on-n
atur
al e
vent
(i.e
. war
), w
hich
lead
s to
dec
lara
tion
of c
risis
situ
atio
n by
the
auth
oriti
es.
An in
terru
ptio
n of
sup
ply
can
be q
ualifi
ed a
s “f
orce
maj
eure
” on
ly in
cas
es w
ere
it w
as c
ause
d by
the
even
t bey
ond
the
cont
rol o
f sys
tem
ope
rato
r and
in c
ases
whe
n th
e sy
stem
ope
rato
r cou
ld n
ot p
reve
nt o
r avo
id th
e ev
ent (
the
caus
e w
as u
npre
dict
-ab
le, i
rresi
stib
le a
nd e
xter
nal t
o th
e ne
twor
k). T
he s
yste
m o
pera
tor m
ust h
ave
writ
-te
n ev
iden
ce th
at n
etw
ork
desi
gn c
riter
ia h
ave
been
exc
eede
d fo
r eac
h in
terru
ptio
n th
at is
cla
ssifi
ed a
s “f
orce
maj
eure
” du
e to
mor
e se
vere
con
ditio
ns th
an th
e on
es
cons
ider
ed in
the
netw
ork
desi
gn re
quire
men
ts.
Stat
istic
s w
ith a
nd
with
out.
No
SPAI
N
Yes.
Spe
cial
eve
nt is
aut
horis
ed b
y th
e Di
rect
orat
e Ge
nera
l for
Ene
rgy
and
Min
es,
and
has
natu
ral c
ause
s an
d ge
nera
lly o
ccur
s in
at l
east
10%
of t
he m
unic
ipal
ities
on
the
peni
nsul
a or
at l
east
50%
of m
unic
ipal
ities
eac
h is
land
and
pen
insu
lar
syst
em.
Incl
uded
Yes
SWED
EN
Ther
e is
a d
efini
tion
in th
e el
ectri
city
act
, but
it d
oes
not a
pply
for r
egis
tratio
n of
in-
terru
ptio
ns. I
nste
ad, a
sep
arat
ion
betw
een
inte
rrupt
ion
up to
and
incl
udin
g 12
hou
rs
and
long
er th
an 1
2 ho
urs
is d
one.
Onl
y in
terru
ptio
ns u
p to
12
hour
s ar
e co
nsid
ered
fo
r the
eco
nom
ic re
gula
tion.
No
GREA
T BR
ITAI
N
Yes.
Ofg
em h
as a
regu
lato
ry d
efini
tion
of e
xcep
tiona
l eve
nts
and
excl
udes
the
impa
ct o
f the
se fr
om th
e ne
twor
k op
erat
ors’
per
form
ance
. Ex
clud
edYe
s. S
ever
e w
eath
er e
vent
s ar
e de
fined
as
any
even
t tha
t res
ults
in m
ore
than
eig
ht ti
mes
th
e av
erag
e nu
mbe
r of h
ighe
r vol
tage
(1kV
and
abo
ve) f
aults
in a
lice
nce
area
ove
r a 2
4 ho
ur
perio
d. T
hese
eve
nts
furth
er fa
ll in
to th
ree
cate
gorie
s.
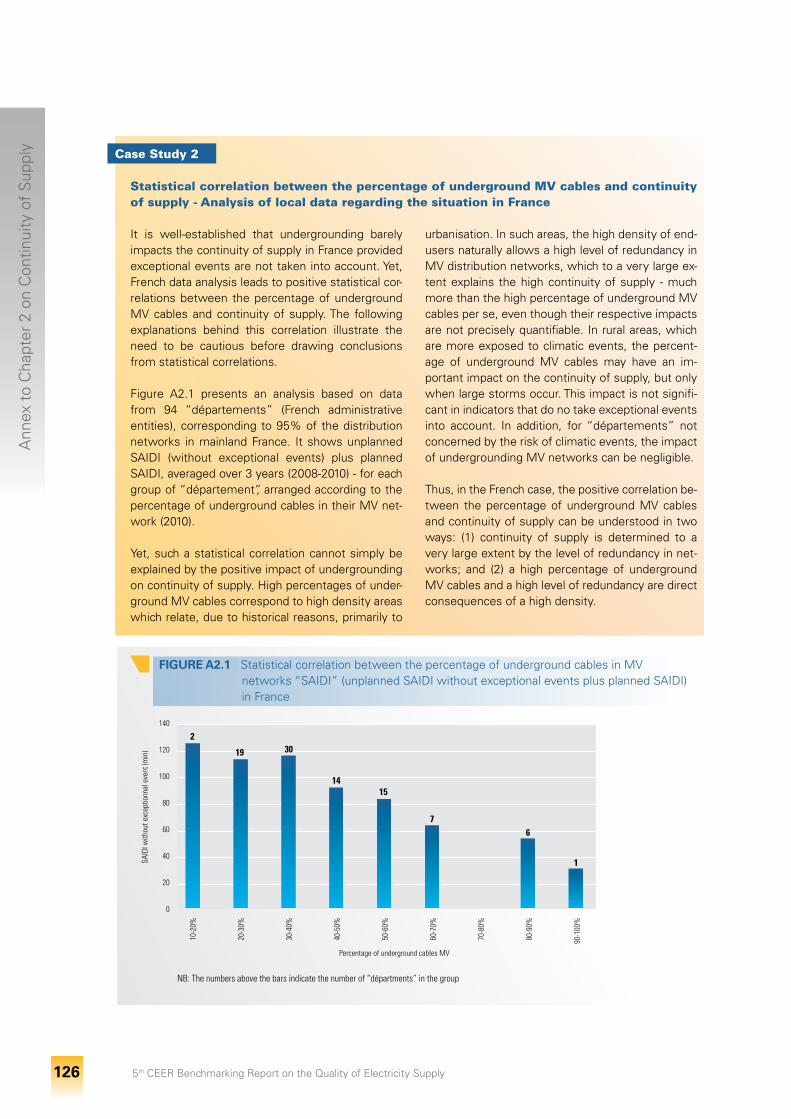
5th CEER Benchmarking Report on the Quality of Electricity Supply 126
Ann
ex t
o C
hapt
er 2
on
Con
tinui
ty o
f S
uppl
y
Statistical correlation between the percentage of underground MV cables and continuity of supply - Analysis of local data regarding the situation in France
It is well-established that undergrounding barely impacts the continuity of supply in France provided exceptional events are not taken into account. Yet, French data analysis leads to positive statistical cor-relations between the percentage of underground MV cables and continuity of supply. The following explanations behind this correlation illustrate the need to be cautious before drawing conclusions from statistical correlations.
Figure A2.1 presents an analysis based on data from 94 “départements” (French administrative entities), corresponding to 95% of the distribution networks in mainland France. It shows unplanned SAIDI (without exceptional events) plus planned SAIDI, averaged over 3 years (2008-2010) - for each group of “département”, arranged according to the percentage of underground cables in their MV net-work (2010).
Yet, such a statistical correlation cannot simply be explained by the positive impact of undergrounding on continuity of supply. High percentages of under-ground MV cables correspond to high density areas which relate, due to historical reasons, primarily to
urbanisation. In such areas, the high density of end-users naturally allows a high level of redundancy in MV distribution networks, which to a very large ex-tent explains the high continuity of supply - much more than the high percentage of underground MV cables per se, even though their respective impacts are not precisely quantifiable. In rural areas, which are more exposed to climatic events, the percent-age of underground MV cables may have an im-portant impact on the continuity of supply, but only when large storms occur. This impact is not signifi-cant in indicators that do no take exceptional events into account. In addition, for “départements” not concerned by the risk of climatic events, the impact of undergrounding MV networks can be negligible.
Thus, in the French case, the positive correlation be-tween the percentage of underground MV cables and continuity of supply can be understood in two ways: (1) continuity of supply is determined to a very large extent by the level of redundancy in net-works; and (2) a high percentage of underground MV cables and a high level of redundancy are direct consequences of a high density.
Case Study 2
140
120
100
80
60
40
20
0
10-2
0%
20-3
0%
30-4
0%
40-5
0%
50-6
0%
60-7
0%
70-8
0%
80-9
0%
90-1
00%
SAID
I with
out e
xcep
tionn
al e
vent
(min
)
Percentage of underground cables MV
FIGURE A2.1 I Statistical correlation between the percentage of underground cables in MV networks “SAIDI” (unplanned SAIDI without exceptional events plus planned SAIDI) in France
2
19 30
1415
7
NB: The numbers above the bars indicate the number of “départments” in the group
6
1
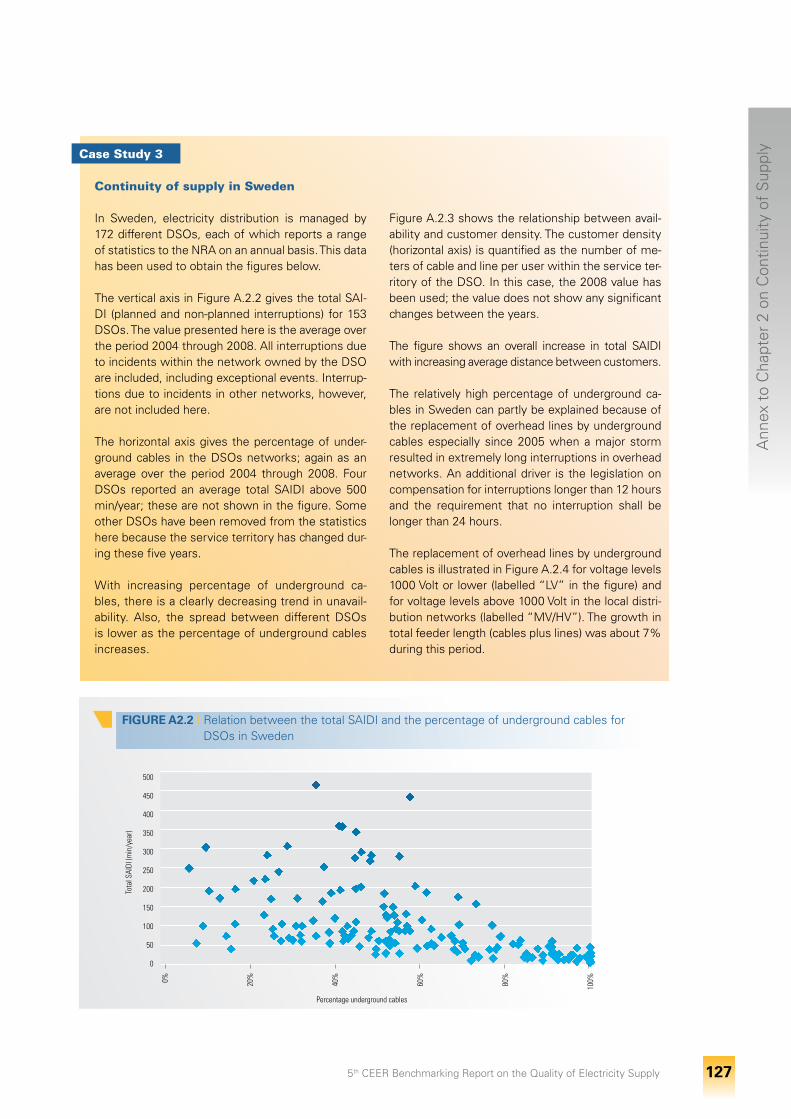
5th CEER Benchmarking Report on the Quality of Electricity Supply 127
Ann
ex t
o C
hapt
er 2
on
Con
tinui
ty o
f S
uppl
y
Continuity of supply in Sweden
In Sweden, electricity distribution is managed by 172 different DSOs, each of which reports a range of statistics to the NRA on an annual basis. This data has been used to obtain the figures below.
The vertical axis in Figure A.2.2 gives the total SAI-DI (planned and non-planned interruptions) for 153 DSOs. The value presented here is the average over the period 2004 through 2008. All interruptions due to incidents within the network owned by the DSO are included, including exceptional events. Interrup-tions due to incidents in other networks, however, are not included here.
The horizontal axis gives the percentage of under-ground cables in the DSOs networks; again as an average over the period 2004 through 2008. Four DSOs reported an average total SAIDI above 500 min/year; these are not shown in the figure. Some other DSOs have been removed from the statistics here because the service territory has changed dur-ing these five years.
With increasing percentage of underground ca-bles, there is a clearly decreasing trend in unavail-ability. Also, the spread between different DSOs is lower as the percentage of underground cables increases.
Figure A.2.3 shows the relationship between avail-ability and customer density. The customer density (horizontal axis) is quantified as the number of me-ters of cable and line per user within the service ter-ritory of the DSO. In this case, the 2008 value has been used; the value does not show any significant changes between the years.
The figure shows an overall increase in total SAIDI with increasing average distance between customers.
The relatively high percentage of underground ca-bles in Sweden can partly be explained because of the replacement of overhead lines by underground cables especially since 2005 when a major storm resulted in extremely long interruptions in overhead networks. An additional driver is the legislation on compensation for interruptions longer than 12 hours and the requirement that no interruption shall be longer than 24 hours.
The replacement of overhead lines by underground cables is illustrated in Figure A.2.4 for voltage levels 1000 Volt or lower (labelled “LV” in the figure) and for voltage levels above 1000 Volt in the local distri-bution networks (labelled “MV/HV”). The growth in total feeder length (cables plus lines) was about 7% during this period.
Case Study 3
FIGURE A2.2 I Relation between the total SAIDI and the percentage of underground cables for DSOs in Sweden
500
450
400
350
300
250
200
150
100
50
0
0% 20%
40%
60%
80%
100%
Tota
l SAI
DI (m
in/y
ear)
Percentage underground cables
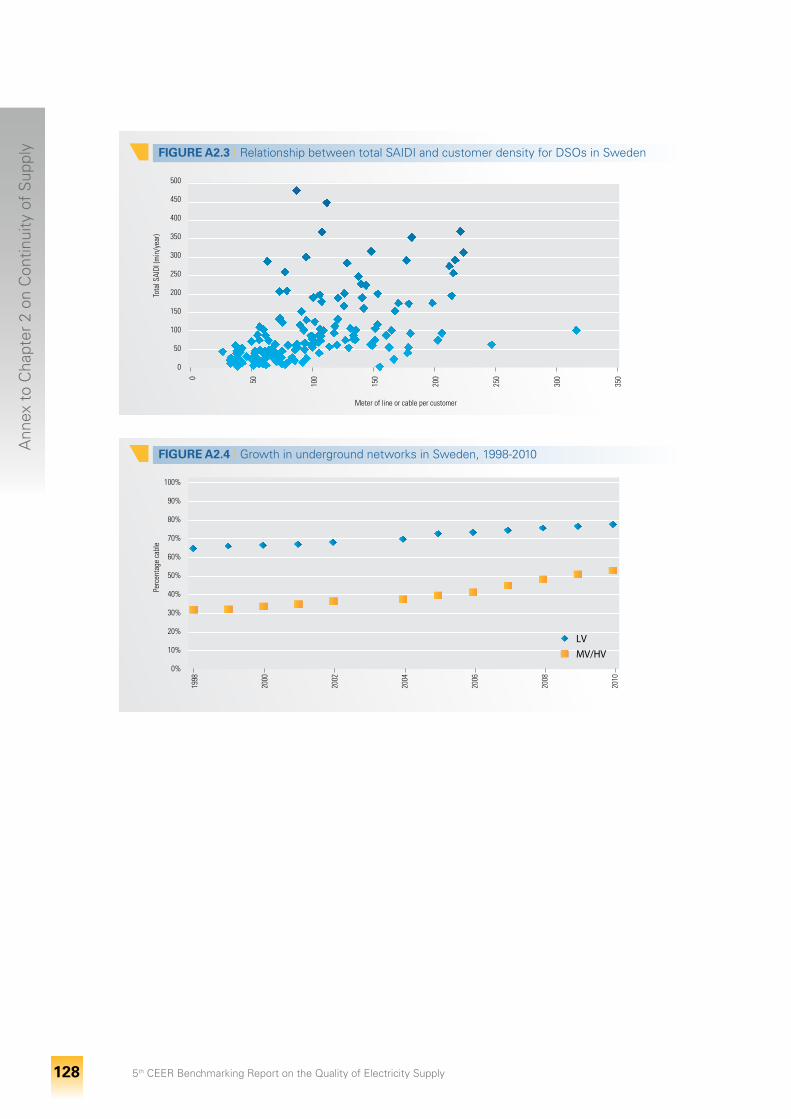
5th CEER Benchmarking Report on the Quality of Electricity Supply 128
Ann
ex t
o C
hapt
er 2
on
Con
tinui
ty o
f S
uppl
y FIGURE A2.3 I Relationship between total SAIDI and customer density for DSOs in Sweden
500
450
400
350
300
250
200
150
100
50
0
0 50 100
150
200
250
300
350
Tota
l SAI
DI (m
in/y
ear)
Meter of line or cable per customer
FIGURE A2.4 I Growth in underground networks in Sweden, 1998-2010
100%
90%
80%
70%
60%
50%
40%
30%
20%
10%
0%
1998
2000
2002
2004
2006
2008
2010
Perc
enta
ge c
able
LV
MV/HV

5th CEER Benchmarking Report on the Quality of Electricity Supply 130
Annex to Chapter 3 on Voltage Quality: Data
Part 1: National legislation and regulations that differ from EN 50160
Cyprus
• Power frequency - local areas (HV, MV, LV): As per CYS EN 50160: • 49.5-50.5HzNormalOperation• 47.0-52.0HzEmergencyOperation
• Power frequency – interconnected areas (LV): not applicable
• Supply voltage variations (MV, LV)• Flicker (HV, MV, LV): As per CYS EN 50160 and IEC 61000-3-7(Pst≤0,35&Plt≤0,35)
• Voltage dips (MV, LV): As per CYS EN 50160• Voltage swells (MV, LV): As per CYS EN 50160• Harmonic voltage (HV, MV, LV): As per CYS EN 50160andIEC61000-3-7(≤2%)byTSO
• Single rapidvoltagechange (HV): IEC61000-3-7(≤3%)byTSO
The Czech Republic
• Flicker(HV,MV,LV):Pst<0.8,Plt<0.6• Harmonic voltage: (HV):Max. amplitude of har-monicuh[%Un]-Max.THD[%]:• 110kV-2.0-<2.5• 220kV-1.5-<2.0• 400kV-1.0-<1.5
• Single rapid voltage change (HV): Number of changes[r/h]-dumax[%Un]:• r<1-3• 1<r<10-2.5• 10<r<100-1.5• 100<r<1,000–1
France
• Power frequency – local areas (HV, MV)• Power frequency – interconnected areas (HV, MV)• Supply voltage variations (HV, MV)• Flicker (HV, MV)• Voltage unbalance (HV, MV)
5th CEER Benchmarking Report on the Quality of Electricity Supply 131
Ann
ex t
o C
hapt
er 3
on
Volta
ge Q
ualit
y
Hungary
• Supply voltage variations (LV): • 10 minute mean values of supply voltage varia-tions shall bewithin Un ±7.5% for 95% of theweekandwithinUn±10%for100%oftheweek
• Each 1 minute mean value of supply voltage vari-ationsshallbewithinUn+15%/-20%for100%of the week
Italy
• Power frequency - local areas (HV): • HV:- 49.5-50.5Hzundernormal(i.e.withrespectto“N-1security”criterion)oralarm(i.e.withrespect to “N security” criterion but not “N-1 security”) operational states (Sicily and Sar-dinia islands)
- 47.5-51.5Hzunderemergency(i.e.interrup-tion) or restoration operational state
• Power frequency – interconnected areas (HV, MV): • HV:- 49.9-50.1Hzundernormaloralarmopera-
tional state (Italian mainland peninsula)- 47.5-51.5Hzunderemergencyorrestoration
operational state•MV,temporaryislandingoperationofnormally
interconnected MV networks: - 49-51Hzfor95%oftime- 47.5-51.5Hzfor100%oftime
• Supply voltage variations (EHV, HV, MV): • ForEHV:- 380kVoperatedat400kV-95%oftimeintherange375-415kVundernormalopera-tionalstate;100%oftime intherange360- 420 kVunder normal or alarmoperationalstate;100%oftimeintherange350-430kVunder emergency or restoration operational state; 220kVoperatedat 230kV - 95%oftimeintherange222-238kVundernormaloperationalstate;100%oftimeintherange200 - 242 kVunder normal or alarmopera-tionalstate;100%of time in therange187-245kVunderemergencyorrestorationop-erational state
• For HV: • 150kVoperatedat150kV-95%oftimeintherange143-158kVundernormalopera-tionalstate;100%of time in therange140
- 165 kV under normal or alarm operational state;100%oftimeintherange128-170kVunder emergency or restoration operational state; 132 kV operated at 132 kV - 95%oftimeintherange125-139kVundernormaloperationalstate;100%oftimeintherange120 - 145 kV under normal or alarm opera-tional state;100%of time in the range112- 150 kV under emergency or restoration op-erational state
• Temporary islanding operation of normally in-terconnected MV networks: - Upperlimit110%Un- Lowerlimit85%Un
• Flicker (HV): Indicators Pst and Plt are defined (limits only for Pst):• EHV(380kV):Pst1p.u.• EHV(220kV):Pst4p.u.• HV(150-132kV):Pst6p.u.
The‘planninglevels’ofPstandPltare:• EHV:Pst<0.70p.u.andPlt<0.50p.u.• HV:Pst<0.85p.u.andPlt<0.62p.u.
• Voltage dips (HV): • EHV (380 kV): 50 POLI-ALL and 200MONO-ALL;3POLI-SEVEREand5MONO-SEVERE
• EHV(220kV):100POLI-ALLand200MONO-ALL;6POLI-SEVEREand10MONO-SEVERE
• HV (150-132kV):250POLI-ALLand400MO-NO-ALL; 9 POLI-SEVERE and 15 MONO-SE-VERE
4indicators:• POLI-ALLpoli-phasevoltagedips(U<90%)•MONO-ALLmono-phasevoltagedips(U<90%)• POLI-SEVEREpoli-phasevoltagedips(U<70%
and t>0,5s) •MONO-SEVERE mono-phase voltage dips(U<70%andt>0,5s)
• Voltageunbalance(HV):Thenetworkcodespeci-fies that the unbalance for HV networks is gener-ally lower than 1% in normal conditions. Refer-encelevelsforEHVandHV:2%.Theindicatoristhe95%-weeklyvalue(asofEN50160).
• Harmonicvoltage(HV):Thenetworkcodespeci-fiesthattheTHDforHVnetworksis lowerthan3% in normal conditions. Reference levels forEHVandHV:6%.TheindicatorisTHDcalculatedforharmonics2-25(notethisisdifferentthanEN50160).
5th CEER Benchmarking Report on the Quality of Electricity Supply 132
Ann
ex t
o C
hapt
er 3
on
Volta
ge Q
ualit
y
Latvia
• Power frequency – interconnected areas (MV, LV): SameasEN50160:2007
• Supply voltage variations (LV): Un +/- 10% for95%ofthevaluesaveragedover10minutesdur-ing1week.Insomecases+10%-15%
• Flicker(LV):SameasEN50160:2007• Voltagedips(LV):SameasEN50160:2007• Voltageswells(LV):SameasEN50160:2007• Voltageunbalance(LV):SameasEN50160:2007•Harmonicvoltage(LV):SameasEN50160:2007
The Netherlands
• Power frequency – interconnected areas (HV, MV, LV):50Hz+/-1%during99.9%ofanyyear,50Hz+4%/-6%ofanyyear
• Supply voltage variations (HV, MV, LV):• FornetworksUn<35kV:- Un+/-10%for95%ofthevaluesaveraged
over 10 minutes during 1 week - Un+10/-15%forallvaluesaveragedover10
minutes during 1 week • Fornetworks>=35kV:- Uc+/-10%for99.9%ofthevaluesaveraged
over 10 minutes during an examination pe-riod of 1 week
• Flicker (HV, MV, LV): • Plt <= 1 during 95% of the values averaged
over 10 minutes during an examination period of 1 week
• Plt<=5forallvaluesaveragedover10minutesduring an examination period of 1 week
• Voltage dips (HV): No limits set at the moment• Voltage swells (HV)• Voltage unbalance (HV, MV, LV):• FornetworkswithUc<35kV:samerequire-
ments as in EN 50160, but in addition, the in-verse component of the voltage shall be be-tween0and3%ofthenormalcomponentforall measurement periods
• FornetworksUc>=35kV:inversecomponent<=1%ofthenormalcomponentduring99.9%of the values averaged over 10 minutes during an examination period of 1 week
• Harmonic voltage (HV, MV, LV): • FornetworksofUc<35kV:- The relative voltage per harmonic voltageshallbesmallerthanthepercentageof95%of the values averaged over 10 minutes stat-edinthestandard.Thesmallestvaluegivenin the standard shall apply to harmonics that are not stated
- THD<=8%forallharmonicvoltagesuptoand including the 40th, during 95% of thetime
- The relative voltage per harmonic voltageshallbesmallerthan3/2xthepercentageof99.9%of thevaluesaveragedover10min-utes stated in the standard
- THD<=12%forallharmonicvoltagesuptoand including the40th, during99.9%of thetime
• FornetworksofUc>=35kVandUc<150kV:- THD<=6%forallharmonicvoltagesuptoand including the 40th, during 95% of thevalues averaged over 10 minutes during an examination period of 1 week
• THD<=7%forallharmonicvoltagesuptoand including the40th, during99.9%of thevalues averaged over 10 minutes during an examination period of 1 week
• FornetworksofUc>=220kV:- THD<=5%forallharmonicvoltagesuptoand including the 40th, during 95% of thevalues averaged over 10 minutes during an examination period of 1 week
- THD<=6%forallharmonicvoltagesuptoand including the40th, during99.9%of thevalues averaged over 10 minutes during an examination period of 1 week
Norway
• Power frequency - local areas (HV, MV, LV): In sys-tems temporarily without physical connections to adjacent transmission grids, theTSO (Statnett)shall ensure that the voltage frequency is normal-lykeptwithin50Hz±2%.
• Power frequency – interconnected areas (HV, MV, LV):TheTSO(Statnett)shallensurethatthevolt-age frequency and time deviations are normally kept within the provisions of the Nordic system operationagreement.
• Supplyvoltagevariations(LV):TheDSOsshallen-sure that supply voltage variations are within the rangeof±10%ofthenominalvaluemeasuredas1-minute mean values, in connection points in the low-voltagesystem.
• Flicker (HV, MV, LV):• LimitsforPst(shorttermflickerseverity)95%
of the week: - 0.23≤UN≤35[kV]:1.2[pu]- 35<UN[kV]:1.0[pu]
• LimitsforPlt(longtermflickerseverity)100%of the time: - 0.23≤UN≤35[kV]:1.0[pu]- 35<UN[kV]:0.8[pu]
5th CEER Benchmarking Report on the Quality of Electricity Supply 133
Ann
ex t
o C
hapt
er 3
on
Volta
ge Q
ualit
y
• Voltage dips (HV, MV, LV): See limits given for rapid voltage change
• Voltage swells (HV, MV, LV): See limits given for rapid voltage change
• Voltage unbalance (HV,MV, LV):TheTSO/DSOsshall ensure that the degree of voltage unbalance doesnotexceed2%inconnectionpoints,meas-uredasten-minutemeanvalues.
• Harmonic voltage (HV, MV, LV):• 0.23≤UN≤35[kV]:• THD100%ofthetime≤8%(10-minmeanvalues)and≤5%(1weekmeanvalue)
• INDIVIDUAL HARMONIC VOLTAGE: SameasTable1inEN50160,butfor100%ofthetime.Plusgenerallimitsabove25th harmonic order (all 10 min mean values)
• 35≤UN≤245[kV]:- THD≤3%(10-minmeanvalues)100%ofthe
time - INDIVIDUAL HARMONIC VOLTAGE: Limits
for all harmonic orders (10-min mean values, 100%ofthetime)
• 245<UN[kV]:- THD≤2%(10-minmeanvalues)100%ofthe
time- INDIVIDUAL HARMONIC VOLTAGE: Limits
for all harmonic orders (10-min mean values, 100%ofthetime)
• Single rapid voltage change (HV, MV, LV): TheTSO/DSOsshallensurethatrapidvoltagechang-es do not exceed the following limits in connec-tion points with respect to the nominal voltage, UN,maximumnumberper24-hourperiod:• deltaU,steadystate≥3%:- max[#]:24for0.23≤UN≤35[kV]- max[#]:12for35<UN[kV]
• deltaU,max:≥5%:- max[#]:24for0.23≤UN≤35[kV]- max[#]:12for35<UN[kV]
Portugal
• Supply voltage variations (HV): For VHV and HV the Quality of Service Code establishes that the valueofUcshallbewithintherangeofUn±7%Un. Under normal operating conditions, duringeachperiodof1week,95%ofthe10minmeanr.m.s.valuesofthesupplyvoltageshallbewithintherangeofUc±5%Uc.
• Flicker (HV): For VHV and HV the Quality of Ser-vice Code establishes that under normal operat-ing conditions, in any period of 1 week the long andtheshorttermflickerseveritycausedbyvolt-agefluctuationshouldbelowerthan1.
• Voltage dips (HV): Limits are not established
• Voltage unbalance (HV)• Harmonic voltage (HV): For VHV and HV, under
normal conditions, during each period of 1 week, 95%of the 10minmean r.m.s. values of eachindividualharmonicvoltage,Uh(%),shallbelessor equal than: • h=5:4.5(HV);3.0(VHV)• h=3:3.0(HV);2.0(VHV)• h=2:1.6(HV);1.5(VHV)• h=7:3.0(HV);2.0(VHV)• h=9:1.1(HV);1.0(VHV)• h=4:1.0(HV);1.0(VHV)• h=11:2.5(HV);1.5(VHV)• h=15:0.3(HV);0.3(VHV)• h=6:0.5(HV);0.5(VHV)• h=13:2.0(HV);1.5(VHV)• h=21:0.2(HV);0.2(VHV)• h=8:0.4(HV);0.4(VHV)• h=17:1.3(HV);1.0(VHV)• h=>21:0.2(HV);0.2(VHV)• h=10:0.4(HV);0.4(VHV)• h=19:1.1(HV);1.0(VHV)• h=12:0.2(HV);0.2(VHV)• h=23:1.0(HV);0.7(VHV)• h=>12:0.2(HV);0.2(VHV)• h=25:1.0(HV);0.7(VHV)• h>25:0.2+12.5/h (HVandVHV)THDHV=<8%;THDVHV=<4%
Sweden
• Supplyvoltagevariations(HV,MV,LV):U+/-10%;100%oftimeoveraweek.
• Voltagedips(HV,MV,LV):Thedip-tableisdividedinthethreeareasA,BandC.Dipswithadurationand severity that puts them in area A is regarded a normal part of the operation of the network.Dipswithin areaBneed tobe investigatedanddips in areaC arenot allowed.Thebordersbe-tween the areas are slightly different for voltages aboveandbelow45kV.
• Voltageswells (LV):Theswell-table isdivided inthethreeareasA,BandC.Swellswithadurationand severity that puts them in area A is regarded a normal part of the operation of the network.Swells within area B need to be investigated and swellsinareaCarenotallowed.
• Voltageunbalance(HV,MV,LV):Unbalancemustbeequalto,orunder,2%;100%ofthetimeoveraweek.
• Harmonic voltage (HV, MV, LV): Same as EN 50160;100%ofthetimeoveraweek.
• Single rapid voltage change (HV, MV, LV): A maxi-mumnumberofvoltagechangesareallowed.
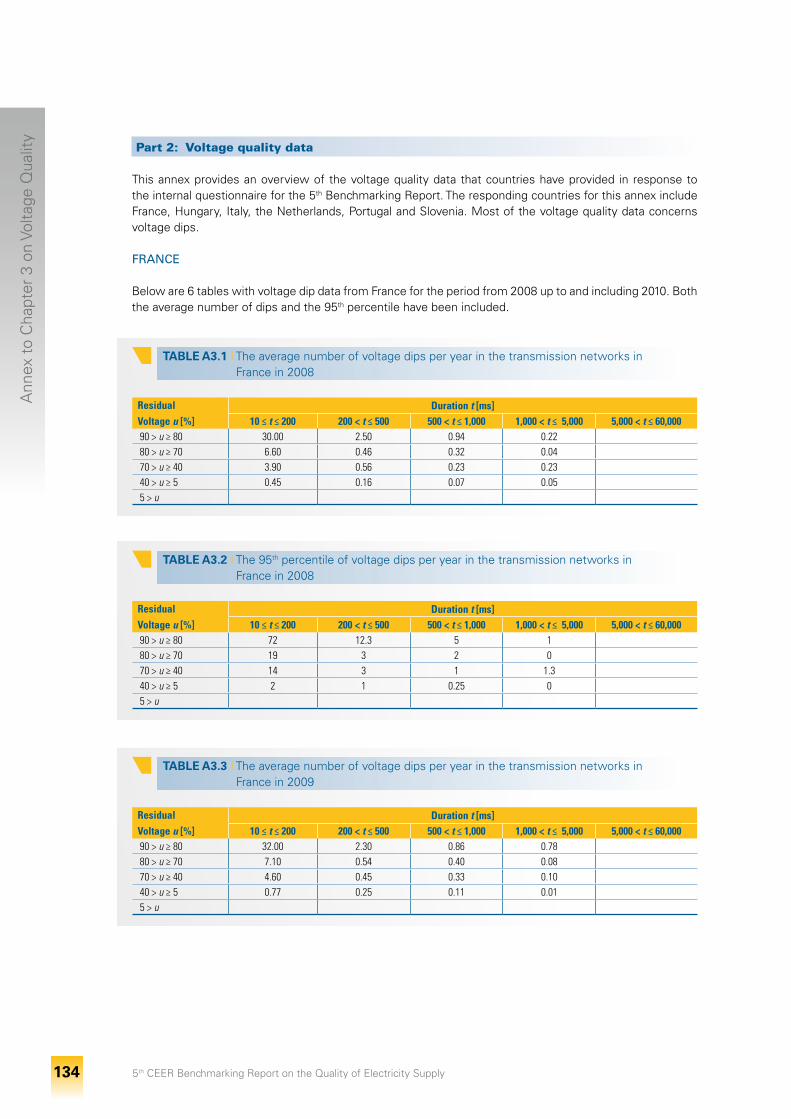
5th CEER Benchmarking Report on the Quality of Electricity Supply 134
Ann
ex t
o C
hapt
er 3
on
Volta
ge Q
ualit
y
Part 2: Voltage quality data
Thisannexprovidesanoverviewofthevoltagequalitydatathatcountrieshaveprovided inresponsetothe internal questionnaire for the 5thBenchmarkingReport.TherespondingcountriesforthisannexincludeFrance,Hungary,Italy,theNetherlands,PortugalandSlovenia.Mostofthevoltagequalitydataconcernsvoltagedips.
FRANCE
Beloware6tableswithvoltagedipdatafromFrancefortheperiodfrom2008uptoandincluding2010.Boththeaveragenumberofdipsandthe95thpercentilehavebeenincluded.
TABLE A3.1 I Theaveragenumberofvoltagedipsperyearinthetransmissionnetworksin Francein2008
Residual Voltage u [%]
Duration t [ms]10 ≤ t ≤ 200 200 < t ≤ 500 500 < t ≤ 1,000 1,000 < t ≤ 5,000 5,000 < t ≤ 60,000
90 > u ≥ 80 30.00 2.50 0.94 0.2280 > u ≥ 70 6.60 0.46 0.32 0.0470 > u ≥ 40 3.90 0.56 0.23 0.2340 > u ≥ 5 0.45 0.16 0.07 0.055 > u
TABLE A3.2 I The95th percentile of voltage dips per year in the transmission networks in Francein2008
Residual Voltage u [%]
Duration t [ms]10 ≤ t ≤ 200 200 < t ≤ 500 500 < t ≤ 1,000 1,000 < t ≤ 5,000 5,000 < t ≤ 60,000
90 > u ≥ 80 72 12.3 5 180 > u ≥ 70 19 3 2 070 > u ≥ 40 14 3 1 1.340 > u ≥ 5 2 1 0.25 05 > u
TABLE A3.3 I Theaveragenumberofvoltagedipsperyearinthetransmissionnetworksin Francein2009
Residual Voltage u [%]
Duration t [ms]10 ≤ t ≤ 200 200 < t ≤ 500 500 < t ≤ 1,000 1,000 < t ≤ 5,000 5,000 < t ≤ 60,000
90 > u ≥ 80 32.00 2.30 0.86 0.7880 > u ≥ 70 7.10 0.54 0.40 0.0870 > u ≥ 40 4.60 0.45 0.33 0.1040 > u ≥ 5 0.77 0.25 0.11 0.015 > u
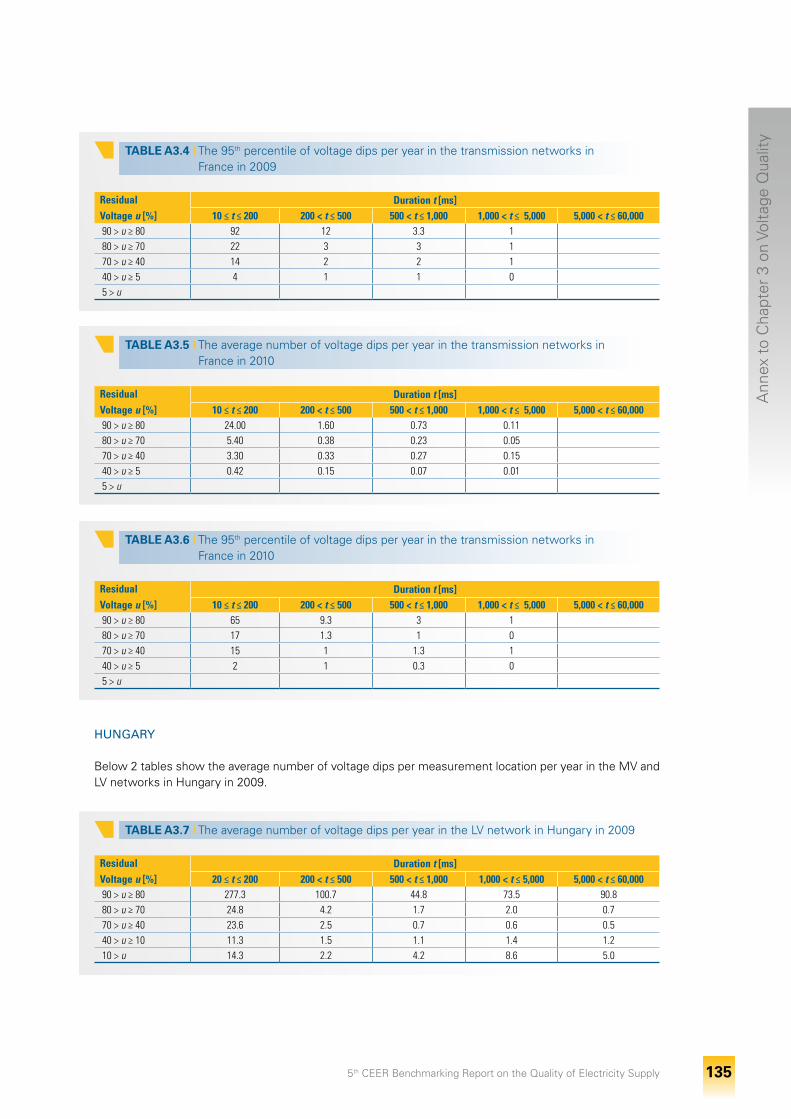
5th CEER Benchmarking Report on the Quality of Electricity Supply 135
Ann
ex t
o C
hapt
er 3
on
Volta
ge Q
ualit
y
TABLE A3.4 I The95th percentile of voltage dips per year in the transmission networks in Francein2009
Residual Voltage u [%]
Duration t [ms]10 ≤ t ≤ 200 200 < t ≤ 500 500 < t ≤ 1,000 1,000 < t ≤ 5,000 5,000 < t ≤ 60,000
90 > u ≥ 80 92 12 3.3 180 > u ≥ 70 22 3 3 170 > u ≥ 40 14 2 2 140 > u ≥ 5 4 1 1 05 > u
TABLE A3.5 I Theaveragenumberofvoltagedipsperyearinthetransmissionnetworksin Francein2010
Residual Voltage u [%]
Duration t [ms]10 ≤ t ≤ 200 200 < t ≤ 500 500 < t ≤ 1,000 1,000 < t ≤ 5,000 5,000 < t ≤ 60,000
90 > u ≥ 80 24.00 1.60 0.73 0.1180 > u ≥ 70 5.40 0.38 0.23 0.0570 > u ≥ 40 3.30 0.33 0.27 0.1540 > u ≥ 5 0.42 0.15 0.07 0.015 > u
TABLE A3.6 I The95th percentile of voltage dips per year in the transmission networks in Francein2010
Residual Voltage u [%]
Duration t [ms]10 ≤ t ≤ 200 200 < t ≤ 500 500 < t ≤ 1,000 1,000 < t ≤ 5,000 5,000 < t ≤ 60,000
90 > u ≥ 80 65 9.3 3 180 > u ≥ 70 17 1.3 1 070 > u ≥ 40 15 1 1.3 140 > u ≥ 5 2 1 0.3 05 > u
TABLE A3.7 I TheaveragenumberofvoltagedipsperyearintheLVnetworkinHungaryin2009
Residual Voltage u [%]
Duration t [ms]20 ≤ t ≤ 200 200 < t ≤ 500 500 < t ≤ 1,000 1,000 < t ≤ 5,000 5,000 < t ≤ 60,000
90 > u ≥ 80 277.3 100.7 44.8 73.5 90.880 > u ≥ 70 24.8 4.2 1.7 2.0 0.770 > u ≥ 40 23.6 2.5 0.7 0.6 0.540 > u ≥ 10 11.3 1.5 1.1 1.4 1.210 > u 14.3 2.2 4.2 8.6 5.0
HUNGARY
Below2tablesshowtheaveragenumberofvoltagedipspermeasurementlocationperyearintheMVandLVnetworksinHungaryin2009.
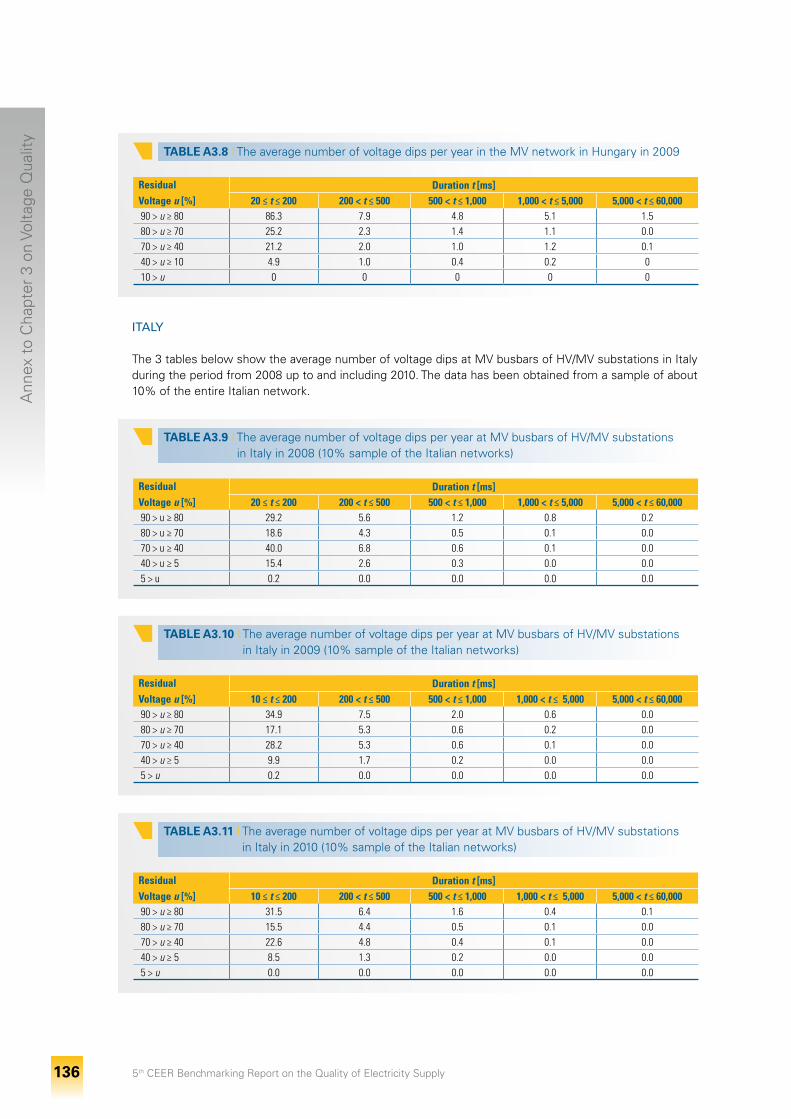
5th CEER Benchmarking Report on the Quality of Electricity Supply 136
Ann
ex t
o C
hapt
er 3
on
Volta
ge Q
ualit
y
TABLE A3.8 I TheaveragenumberofvoltagedipsperyearintheMVnetworkinHungaryin2009
Residual Voltage u [%]
Duration t [ms]20 ≤ t ≤ 200 200 < t ≤ 500 500 < t ≤ 1,000 1,000 < t ≤ 5,000 5,000 < t ≤ 60,000
90 > u ≥ 80 86.3 7.9 4.8 5.1 1.580 > u ≥ 70 25.2 2.3 1.4 1.1 0.070 > u ≥ 40 21.2 2.0 1.0 1.2 0.140 > u ≥ 10 4.9 1.0 0.4 0.2 010 > u 0 0 0 0 0
TABLE A3.9 I TheaveragenumberofvoltagedipsperyearatMVbusbarsofHV/MVsubstations inItalyin2008(10%sampleoftheItaliannetworks)
Residual Voltage u [%]
Duration t [ms]20 ≤ t ≤ 200 200 < t ≤ 500 500 < t ≤ 1,000 1,000 < t ≤ 5,000 5,000 < t ≤ 60,000
90 > u ≥ 80 29.2 5.6 1.2 0.8 0.280 > u ≥ 70 18.6 4.3 0.5 0.1 0.070 > u ≥ 40 40.0 6.8 0.6 0.1 0.040 > u ≥ 5 15.4 2.6 0.3 0.0 0.05 > u 0.2 0.0 0.0 0.0 0.0
TABLE A3.10 I TheaveragenumberofvoltagedipsperyearatMVbusbarsofHV/MVsubstations inItalyin2009(10%sampleoftheItaliannetworks)
Residual Voltage u [%]
Duration t [ms]10 ≤ t ≤ 200 200 < t ≤ 500 500 < t ≤ 1,000 1,000 < t ≤ 5,000 5,000 < t ≤ 60,000
90 > u ≥ 80 34.9 7.5 2.0 0.6 0.080 > u ≥ 70 17.1 5.3 0.6 0.2 0.070 > u ≥ 40 28.2 5.3 0.6 0.1 0.040 > u ≥ 5 9.9 1.7 0.2 0.0 0.05 > u 0.2 0.0 0.0 0.0 0.0
TABLE A3.11 I TheaveragenumberofvoltagedipsperyearatMVbusbarsofHV/MVsubstations inItalyin2010(10%sampleoftheItaliannetworks)
Residual Voltage u [%]
Duration t [ms]10 ≤ t ≤ 200 200 < t ≤ 500 500 < t ≤ 1,000 1,000 < t ≤ 5,000 5,000 < t ≤ 60,000
90 > u ≥ 80 31.5 6.4 1.6 0.4 0.180 > u ≥ 70 15.5 4.4 0.5 0.1 0.070 > u ≥ 40 22.6 4.8 0.4 0.1 0.040 > u ≥ 5 8.5 1.3 0.2 0.0 0.05 > u 0.0 0.0 0.0 0.0 0.0
ITALY
The3tablesbelowshowtheaveragenumberofvoltagedipsatMVbusbarsofHV/MVsubstationsinItalyduringtheperiodfrom2008uptoandincluding2010.Thedatahasbeenobtainedfromasampleofabout10%oftheentireItaliannetwork.
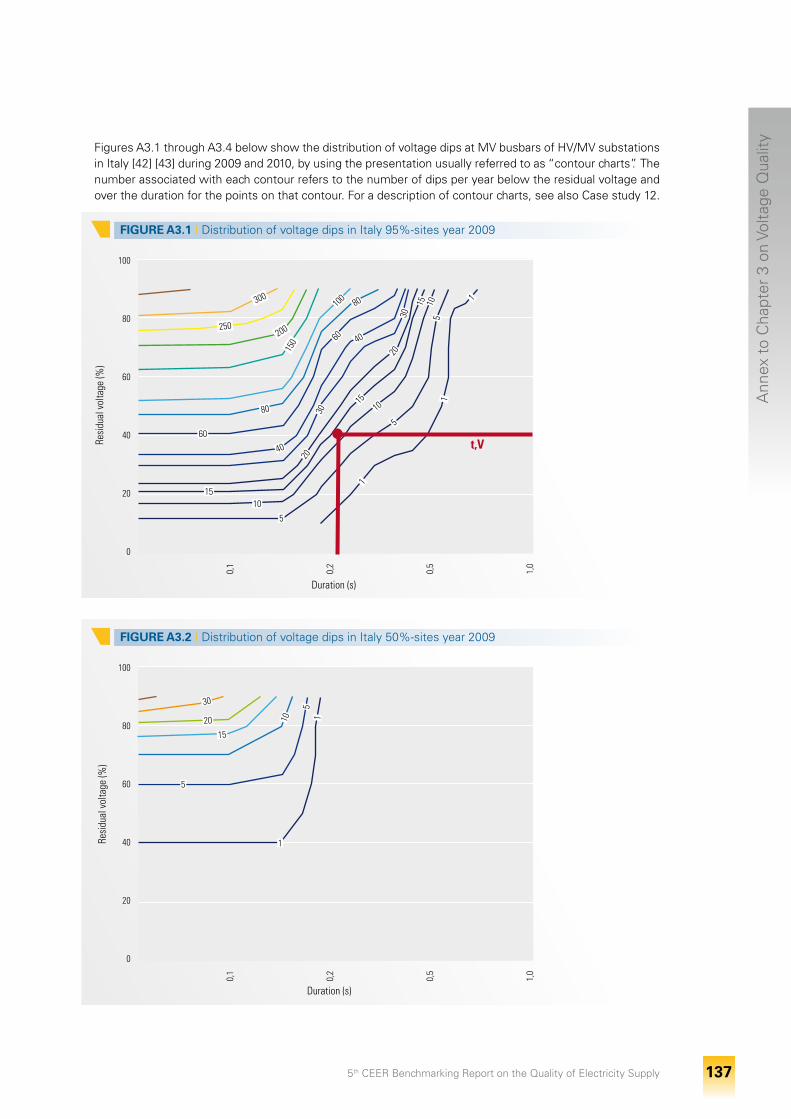
5th CEER Benchmarking Report on the Quality of Electricity Supply 137
Ann
ex t
o C
hapt
er 3
on
Volta
ge Q
ualit
y
FiguresA3.1throughA3.4belowshowthedistributionofvoltagedipsatMVbusbarsofHV/MVsubstationsinItaly[42][43]during2009and2010,byusingthepresentationusuallyreferredtoas“contourcharts”.Thenumber associated with each contour refers to the number of dips per year below the residual voltage and overthedurationforthepointsonthatcontour.Foradescriptionofcontourcharts,seealsoCasestudy12.
100
80
60
40
20
0
100
80
60
40
20
0
0,1 0,2
0,5
1,0
0,1 0,2
0,5
1,0
Resi
dual
vol
tage
(%)
Resi
dual
vol
tage
(%)
Duration (s)
Duration (s)
FIGURE A3.1 I DistributionofvoltagedipsinItaly95%-sitesyear2009
FIGURE A3.2 I DistributionofvoltagedipsinItaly50%-sitesyear2009
250200
150
100 80
80
60
60
40
40
30
3015
1510
5
55
1
1
1
1510
10
20
20
300
t,V
30
20
15
10
5
5
1
1
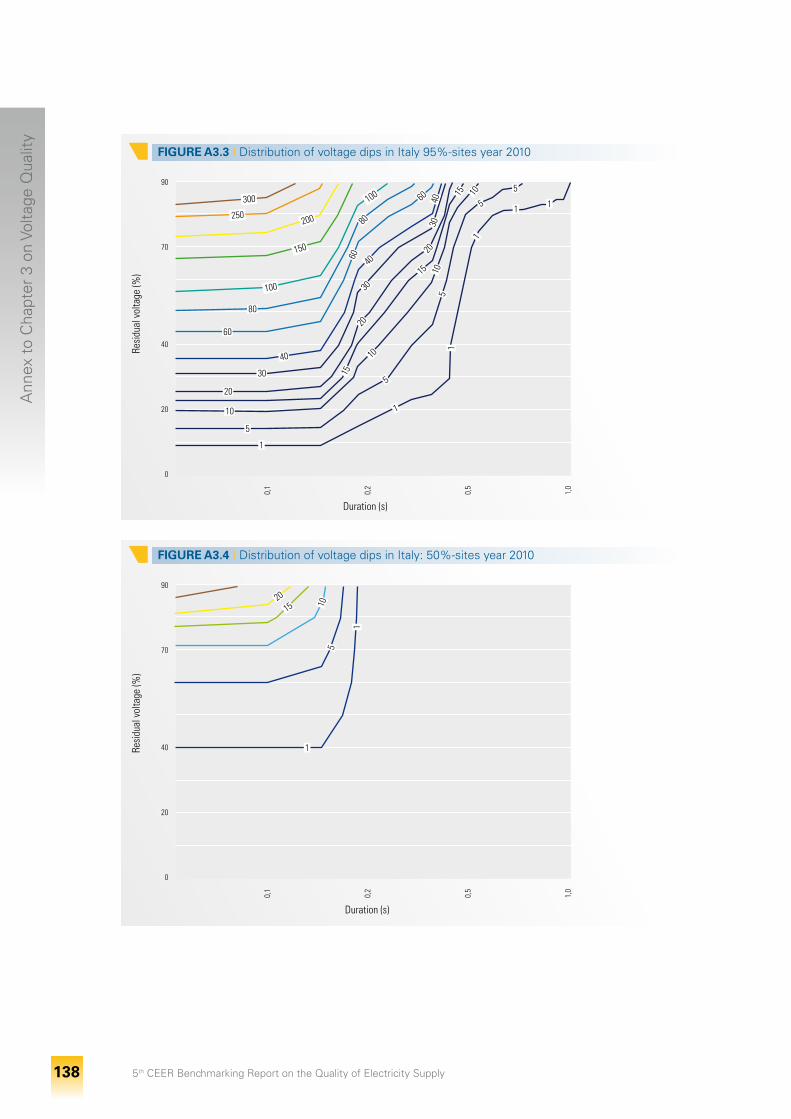
5th CEER Benchmarking Report on the Quality of Electricity Supply 138
Ann
ex t
o C
hapt
er 3
on
Volta
ge Q
ualit
y
90
70
40
20
0
90
70
40
20
0
0,1 0,2
0,5
1,0
0,1 0,2
0,5
1,0
Resi
dual
vol
tage
(%)
Resi
dual
vol
tage
(%)
Duration (s)
Duration (s)
FIGURE A3.3 I DistributionofvoltagedipsinItaly95%-sitesyear2010
FIGURE A3.4 I DistributionofvoltagedipsinItaly:50%-sitesyear2010
80
80
60
60
60
40
40
40
30
30
30
20
20
20
10
10
10
10
15
15
15
5
5
5
5
5
1
1
1
1
1 1300
250200
150
100
100
2015 10
5
1
1
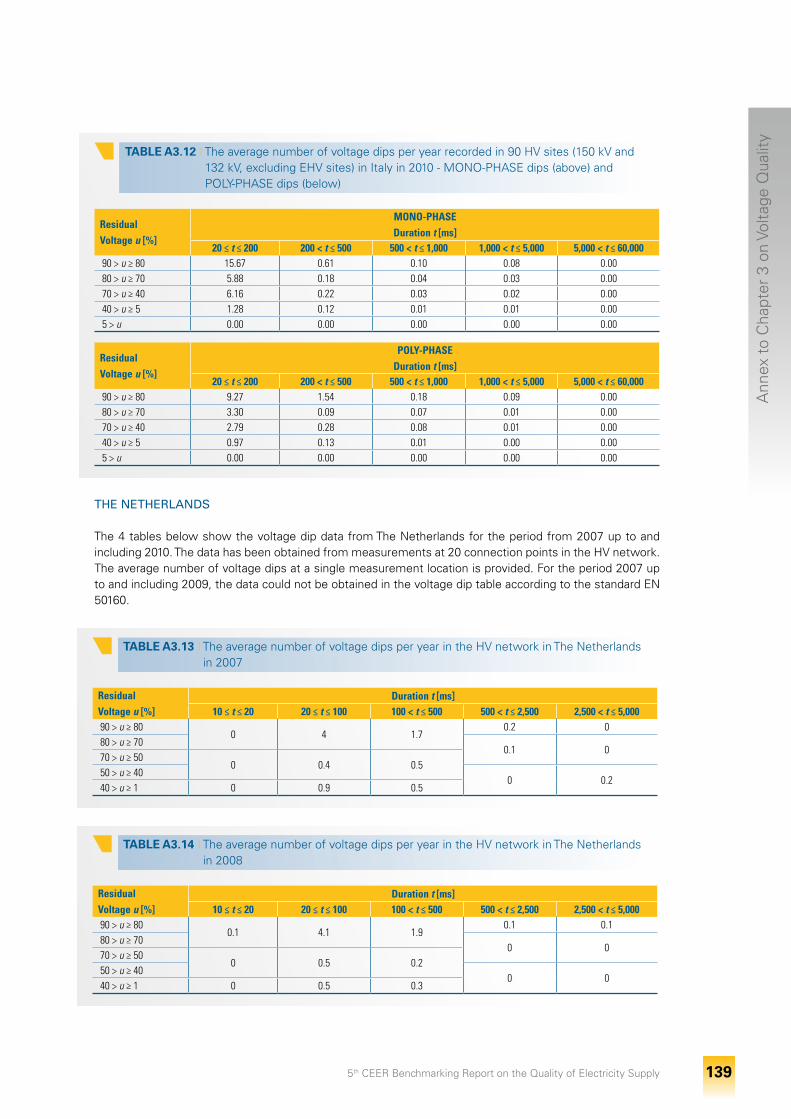
5th CEER Benchmarking Report on the Quality of Electricity Supply 139
Ann
ex t
o C
hapt
er 3
on
Volta
ge Q
ualit
y
TABLE A3.12 I Theaveragenumberofvoltagedipsperyearrecordedin90HVsites(150kVand 132kV,excludingEHVsites)inItalyin2010-MONO-PHASEdips(above)and POLY-PHASEdips(below)
Residual Voltage u [%]
MONO-PHASEDuration t [ms]
20 ≤ t ≤ 200 200 < t ≤ 500 500 < t ≤ 1,000 1,000 < t ≤ 5,000 5,000 < t ≤ 60,00090 > u ≥ 80 15.67 0.61 0.10 0.08 0.0080 > u ≥ 70 5.88 0.18 0.04 0.03 0.0070 > u ≥ 40 6.16 0.22 0.03 0.02 0.0040 > u ≥ 5 1.28 0.12 0.01 0.01 0.005 > u 0.00 0.00 0.00 0.00 0.00
Residual Voltage u [%]
POLY-PHASEDuration t [ms]
20 ≤ t ≤ 200 200 < t ≤ 500 500 < t ≤ 1,000 1,000 < t ≤ 5,000 5,000 < t ≤ 60,00090 > u ≥ 80 9.27 1.54 0.18 0.09 0.0080 > u ≥ 70 3.30 0.09 0.07 0.01 0.0070 > u ≥ 40 2.79 0.28 0.08 0.01 0.0040 > u ≥ 5 0.97 0.13 0.01 0.00 0.005 > u 0.00 0.00 0.00 0.00 0.00
THE NETHERLANDS
The4tablesbelowshowthevoltagedipdatafromTheNetherlandsfortheperiodfrom2007uptoandincluding2010.Thedatahasbeenobtainedfrommeasurementsat20connectionpointsintheHVnetwork.Theaveragenumberofvoltagedipsatasinglemeasurementlocationisprovided.Fortheperiod2007uptoandincluding2009,thedatacouldnotbeobtainedinthevoltagediptableaccordingtothestandardEN50160.
TABLE A3.13 I TheaveragenumberofvoltagedipsperyearintheHVnetworkinTheNetherlands in2007
Residual Voltage u [%]
Duration t [ms]10 ≤ t ≤ 20 20 ≤ t ≤ 100 100 < t ≤ 500 500 < t ≤ 2,500 2,500 < t ≤ 5,000
90 > u ≥ 800 4 1.7
0.2 080 > u ≥ 70
0.1 070 > u ≥ 50
0 0.4 0.550 > u ≥ 40
0 0.240 > u ≥ 1 0 0.9 0.5
TABLE A3.14 I TheaveragenumberofvoltagedipsperyearintheHVnetworkinTheNetherlands in2008
Residual Voltage u [%]
Duration t [ms]10 ≤ t ≤ 20 20 ≤ t ≤ 100 100 < t ≤ 500 500 < t ≤ 2,500 2,500 < t ≤ 5,000
90 > u ≥ 800.1 4.1 1.9
0.1 0.180 > u ≥ 70
0 070 > u ≥ 50
0 0.5 0.250 > u ≥ 40
0 040 > u ≥ 1 0 0.5 0.3
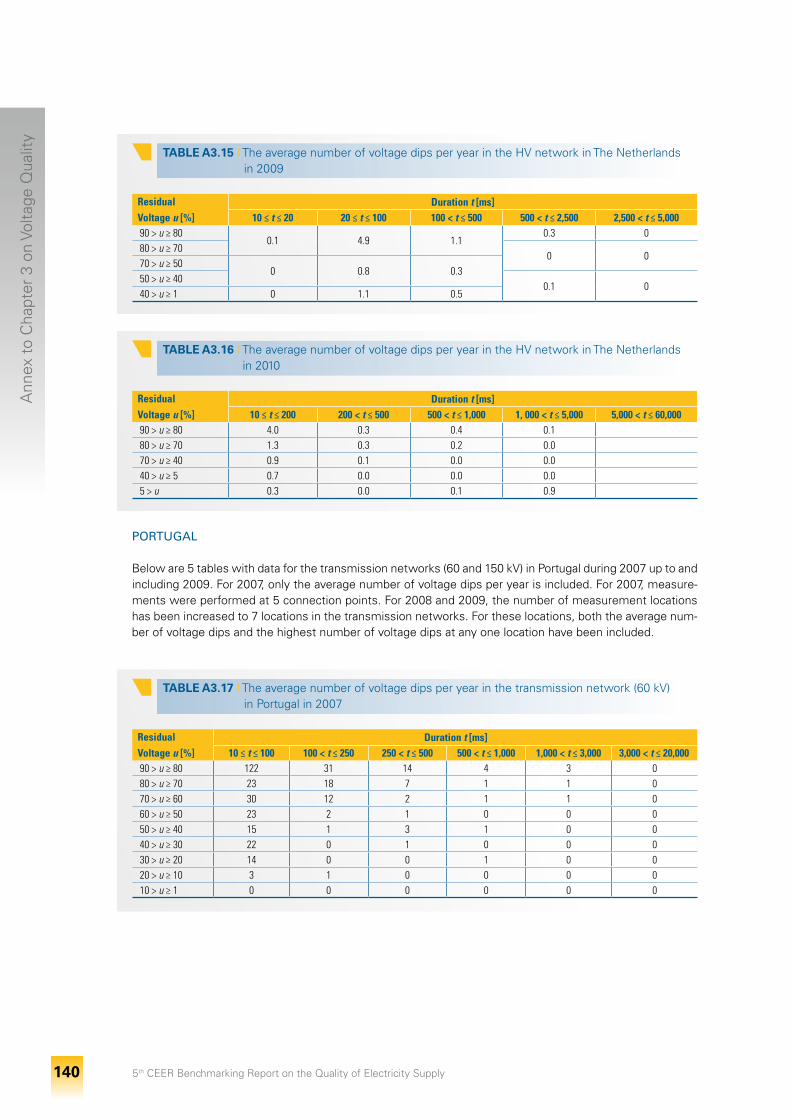
5th CEER Benchmarking Report on the Quality of Electricity Supply 140
Ann
ex t
o C
hapt
er 3
on
Volta
ge Q
ualit
y
TABLE A3.15 I TheaveragenumberofvoltagedipsperyearintheHVnetworkinTheNetherlands in2009
Residual Voltage u [%]
Duration t [ms]10 ≤ t ≤ 20 20 ≤ t ≤ 100 100 < t ≤ 500 500 < t ≤ 2,500 2,500 < t ≤ 5,000
90 > u ≥ 800.1 4.9 1.1
0.3 080 > u ≥ 70
0 070 > u ≥ 50
0 0.8 0.350 > u ≥ 40
0.1 040 > u ≥ 1 0 1.1 0.5
TABLE A3.16 I TheaveragenumberofvoltagedipsperyearintheHVnetworkinTheNetherlands in2010
Residual Voltage u [%]
Duration t [ms]10 ≤ t ≤ 200 200 < t ≤ 500 500 < t ≤ 1,000 1, 000 < t ≤ 5,000 5,000 < t ≤ 60,000
90 > u ≥ 80 4.0 0.3 0.4 0.180 > u ≥ 70 1.3 0.3 0.2 0.070 > u ≥ 40 0.9 0.1 0.0 0.040 > u ≥ 5 0.7 0.0 0.0 0.05 > u 0.3 0.0 0.1 0.9
TABLE A3.17 I Theaveragenumberofvoltagedipsperyearinthetransmissionnetwork(60kV) inPortugalin2007
Residual Voltage u [%]
Duration t [ms]10 ≤ t ≤ 100 100 < t ≤ 250 250 < t ≤ 500 500 < t ≤ 1,000 1,000 < t ≤ 3,000 3,000 < t ≤ 20,000
90 > u ≥ 80 122 31 14 4 3 080 > u ≥ 70 23 18 7 1 1 070 > u ≥ 60 30 12 2 1 1 060 > u ≥ 50 23 2 1 0 0 050 > u ≥ 40 15 1 3 1 0 040 > u ≥ 30 22 0 1 0 0 030 > u ≥ 20 14 0 0 1 0 020 > u ≥ 10 3 1 0 0 0 010 > u ≥ 1 0 0 0 0 0 0
PORTUGAL
Beloware5tableswithdataforthetransmissionnetworks(60and150kV)inPortugalduring2007uptoandincluding2009.For2007,onlytheaveragenumberofvoltagedipsperyearisincluded.For2007,measure-mentswereperformedat5connectionpoints.For2008and2009,thenumberofmeasurementlocationshasbeenincreasedto7locationsinthetransmissionnetworks.Fortheselocations,boththeaveragenum-berofvoltagedipsandthehighestnumberofvoltagedipsatanyonelocationhavebeenincluded.
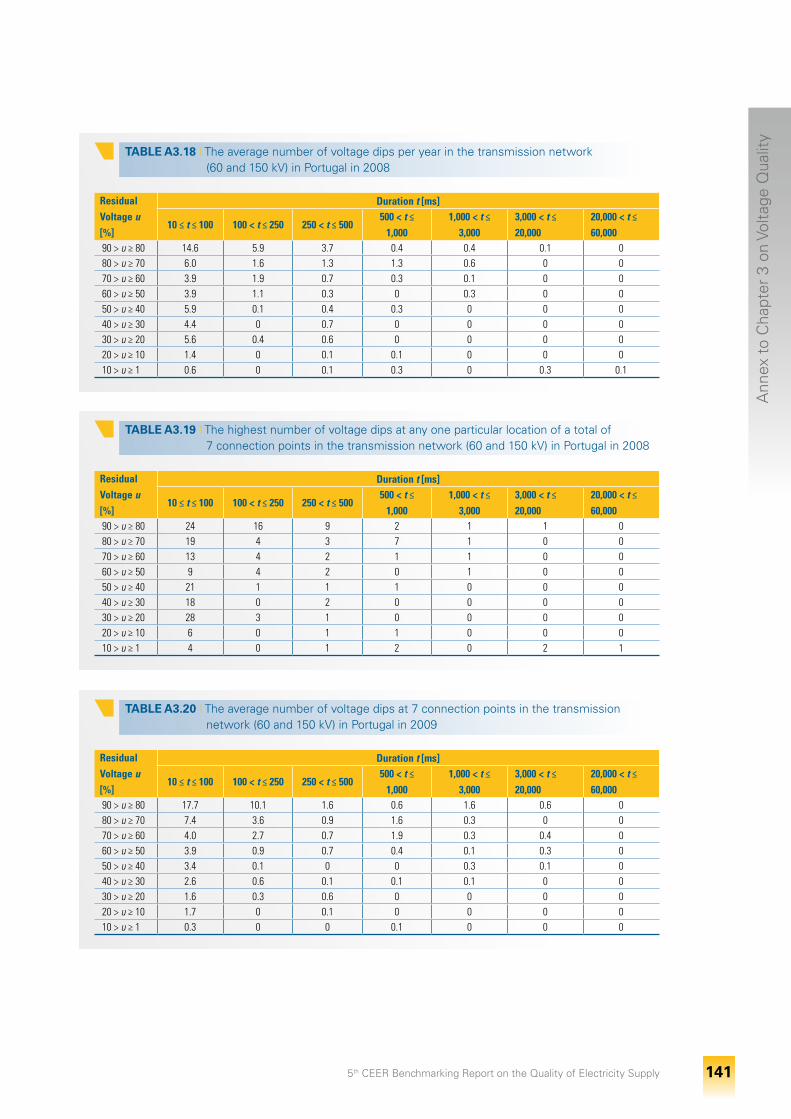
5th CEER Benchmarking Report on the Quality of Electricity Supply 141
Ann
ex t
o C
hapt
er 3
on
Volta
ge Q
ualit
y
TABLE A3.18 I Theaveragenumberofvoltagedipsperyearinthetransmissionnetwork (60and150kV)inPortugalin2008
Residual Voltage u [%]
Duration t [ms]
10 ≤ t ≤ 100 100 < t ≤ 250 250 < t ≤ 500500 < t ≤
1,0001,000 < t ≤
3,0003,000 < t ≤ 20,000
20,000 < t ≤ 60,000
90 > u ≥ 80 14.6 5.9 3.7 0.4 0.4 0.1 080 > u ≥ 70 6.0 1.6 1.3 1.3 0.6 0 070 > u ≥ 60 3.9 1.9 0.7 0.3 0.1 0 060 > u ≥ 50 3.9 1.1 0.3 0 0.3 0 050 > u ≥ 40 5.9 0.1 0.4 0.3 0 0 040 > u ≥ 30 4.4 0 0.7 0 0 0 030 > u ≥ 20 5.6 0.4 0.6 0 0 0 020 > u ≥ 10 1.4 0 0.1 0.1 0 0 010 > u ≥ 1 0.6 0 0.1 0.3 0 0.3 0.1
TABLE A3.19 I Thehighestnumberofvoltagedipsatanyoneparticularlocationofatotalof 7connectionpointsinthetransmissionnetwork(60and150kV)inPortugalin2008
Residual Voltage u [%]
Duration t [ms]
10 ≤ t ≤ 100 100 < t ≤ 250 250 < t ≤ 500500 < t ≤
1,0001,000 < t ≤
3,0003,000 < t ≤ 20,000
20,000 < t ≤ 60,000
90 > u ≥ 80 24 16 9 2 1 1 080 > u ≥ 70 19 4 3 7 1 0 070 > u ≥ 60 13 4 2 1 1 0 060 > u ≥ 50 9 4 2 0 1 0 050 > u ≥ 40 21 1 1 1 0 0 040 > u ≥ 30 18 0 2 0 0 0 030 > u ≥ 20 28 3 1 0 0 0 020 > u ≥ 10 6 0 1 1 0 0 010 > u ≥ 1 4 0 1 2 0 2 1
TABLE A3.20 I Theaveragenumberofvoltagedipsat7connectionpointsinthetransmission network(60and150kV)inPortugalin2009
Residual Voltage u [%]
Duration t [ms]
10 ≤ t ≤ 100 100 < t ≤ 250 250 < t ≤ 500500 < t ≤
1,0001,000 < t ≤
3,0003,000 < t ≤ 20,000
20,000 < t ≤ 60,000
90 > u ≥ 80 17.7 10.1 1.6 0.6 1.6 0.6 080 > u ≥ 70 7.4 3.6 0.9 1.6 0.3 0 070 > u ≥ 60 4.0 2.7 0.7 1.9 0.3 0.4 060 > u ≥ 50 3.9 0.9 0.7 0.4 0.1 0.3 050 > u ≥ 40 3.4 0.1 0 0 0.3 0.1 040 > u ≥ 30 2.6 0.6 0.1 0.1 0.1 0 030 > u ≥ 20 1.6 0.3 0.6 0 0 0 020 > u ≥ 10 1.7 0 0.1 0 0 0 010 > u ≥ 1 0.3 0 0 0.1 0 0 0
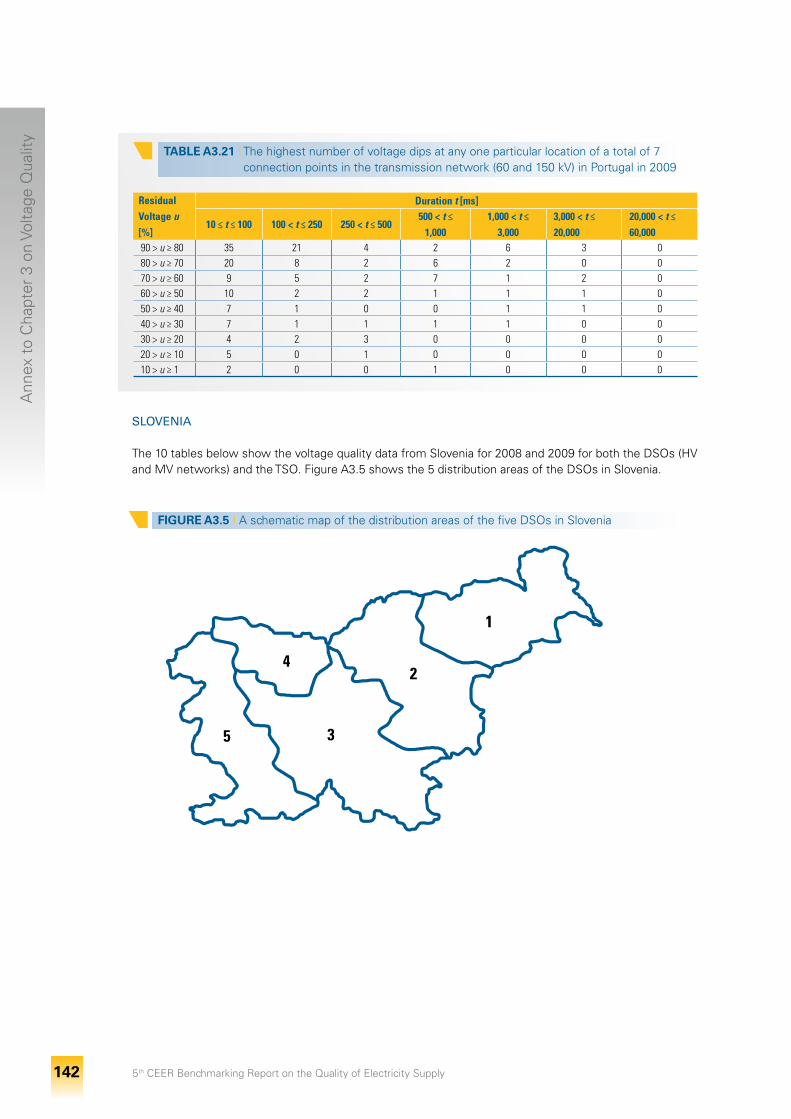
5th CEER Benchmarking Report on the Quality of Electricity Supply 142
Ann
ex t
o C
hapt
er 3
on
Volta
ge Q
ualit
y
TABLE A3.21 I Thehighestnumberofvoltagedipsatanyoneparticularlocationofatotalof7 connectionpointsinthetransmissionnetwork(60and150kV)inPortugalin2009
Residual Voltage u [%]
Duration t [ms]
10 ≤ t ≤ 100 100 < t ≤ 250 250 < t ≤ 500500 < t ≤
1,0001,000 < t ≤
3,0003,000 < t ≤ 20,000
20,000 < t ≤ 60,000
90 > u ≥ 80 35 21 4 2 6 3 080 > u ≥ 70 20 8 2 6 2 0 070 > u ≥ 60 9 5 2 7 1 2 060 > u ≥ 50 10 2 2 1 1 1 050 > u ≥ 40 7 1 0 0 1 1 040 > u ≥ 30 7 1 1 1 1 0 030 > u ≥ 20 4 2 3 0 0 0 020 > u ≥ 10 5 0 1 0 0 0 010 > u ≥ 1 2 0 0 1 0 0 0
SLOVENIA
The10tablesbelowshowthevoltagequalitydatafromSloveniafor2008and2009forboththeDSOs(HVandMVnetworks)andtheTSO.FigureA3.5showsthe5distributionareasoftheDSOsinSlovenia.
1
2
3
4
5
FIGURE A3.5 I A schematic mapofthedistributionareasofthefiveDSOsinSlovenia
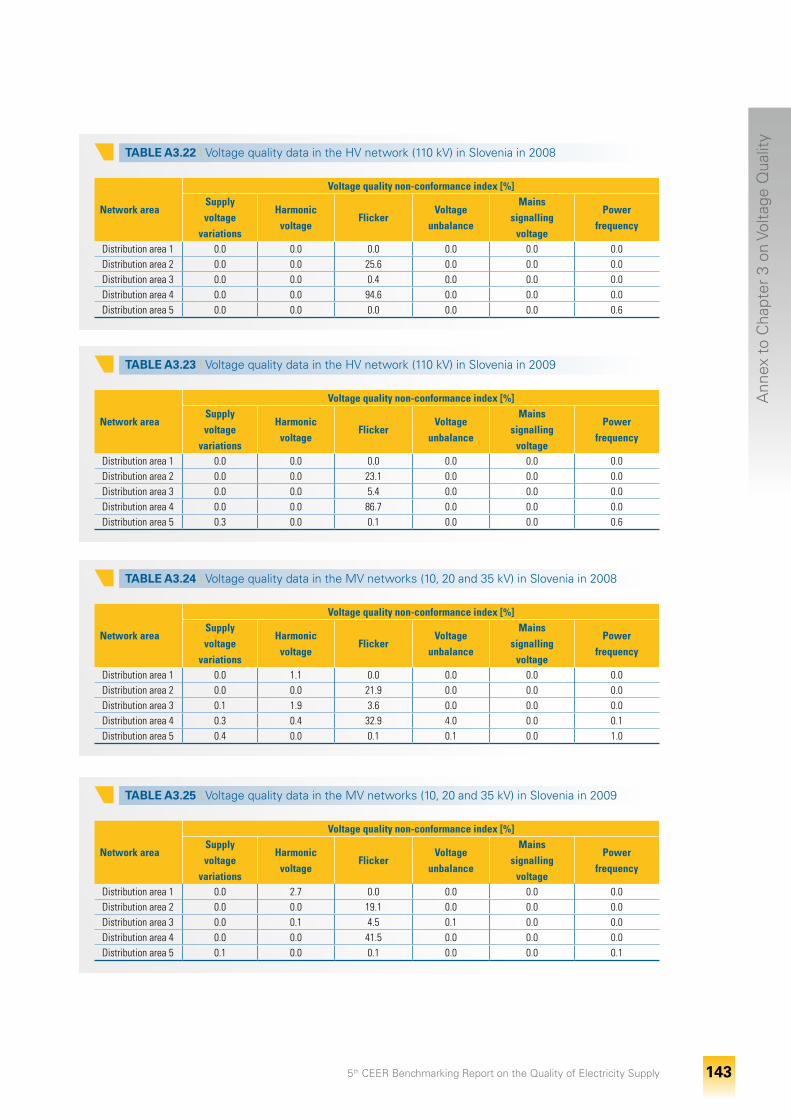
5th CEER Benchmarking Report on the Quality of Electricity Supply 143
Ann
ex t
o C
hapt
er 3
on
Volta
ge Q
ualit
y
TABLE A3.22 I VoltagequalitydataintheHVnetwork(110kV)inSloveniain2008
Network area
Voltage quality non-conformance index [%]Supply voltage
variations
Harmonic voltage
FlickerVoltage
unbalance
Mains signalling
voltage
Power frequency
Distribution area 1 0.0 0.0 0.0 0.0 0.0 0.0Distribution area 2 0.0 0.0 25.6 0.0 0.0 0.0Distribution area 3 0.0 0.0 0.4 0.0 0.0 0.0Distribution area 4 0.0 0.0 94.6 0.0 0.0 0.0Distribution area 5 0.0 0.0 0.0 0.0 0.0 0.6
TABLE A3.23 I VoltagequalitydataintheHVnetwork(110kV)inSloveniain2009
Network area
Voltage quality non-conformance index [%]Supply voltage
variations
Harmonic voltage
FlickerVoltage
unbalance
Mains signalling
voltage
Power frequency
Distribution area 1 0.0 0.0 0.0 0.0 0.0 0.0Distribution area 2 0.0 0.0 23.1 0.0 0.0 0.0Distribution area 3 0.0 0.0 5.4 0.0 0.0 0.0Distribution area 4 0.0 0.0 86.7 0.0 0.0 0.0Distribution area 5 0.3 0.0 0.1 0.0 0.0 0.6
TABLE A3.24 I VoltagequalitydataintheMVnetworks(10,20and35kV)inSloveniain2008
Network area
Voltage quality non-conformance index [%]Supply voltage
variations
Harmonic voltage
FlickerVoltage
unbalance
Mains signalling
voltage
Power frequency
Distribution area 1 0.0 1.1 0.0 0.0 0.0 0.0Distribution area 2 0.0 0.0 21.9 0.0 0.0 0.0Distribution area 3 0.1 1.9 3.6 0.0 0.0 0.0Distribution area 4 0.3 0.4 32.9 4.0 0.0 0.1Distribution area 5 0.4 0.0 0.1 0.1 0.0 1.0
TABLE A3.25 I VoltagequalitydataintheMVnetworks(10,20and35kV)inSloveniain2009
Network area
Voltage quality non-conformance index [%]Supply voltage
variations
Harmonic voltage
FlickerVoltage
unbalance
Mains signalling
voltage
Power frequency
Distribution area 1 0.0 2.7 0.0 0.0 0.0 0.0Distribution area 2 0.0 0.0 19.1 0.0 0.0 0.0Distribution area 3 0.0 0.1 4.5 0.1 0.0 0.0Distribution area 4 0.0 0.0 41.5 0.0 0.0 0.0Distribution area 5 0.1 0.0 0.1 0.0 0.0 0.1
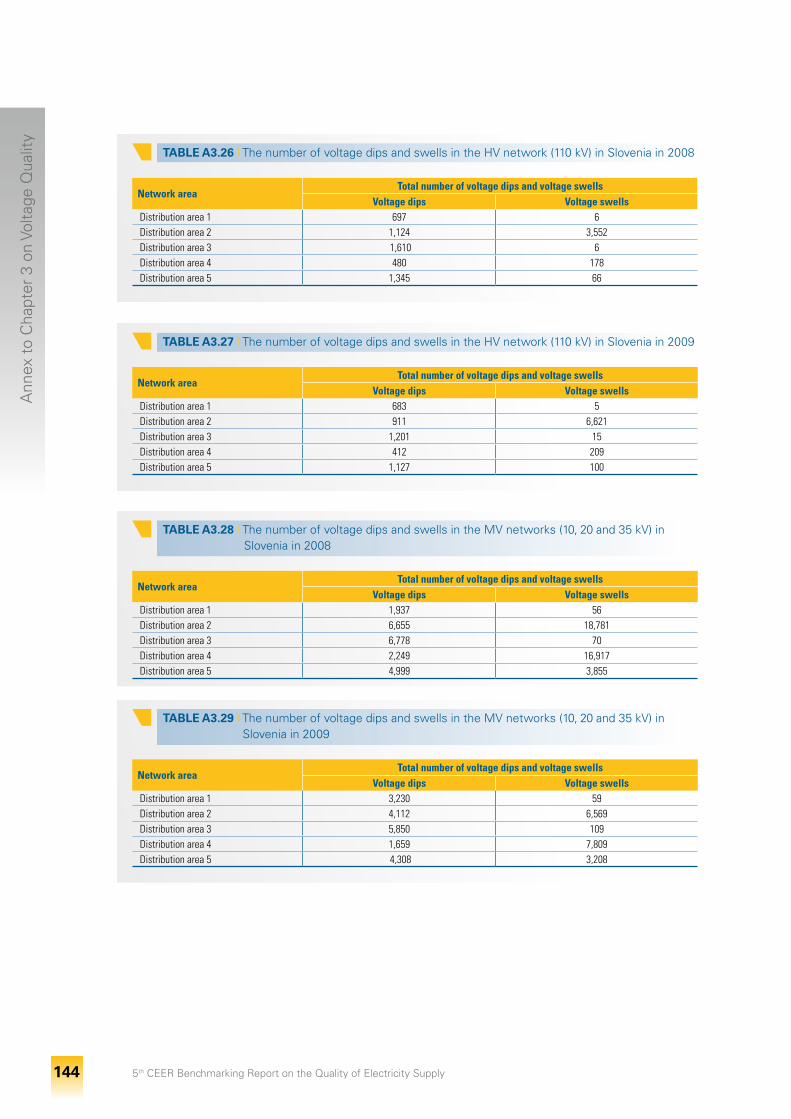
5th CEER Benchmarking Report on the Quality of Electricity Supply 144
Ann
ex t
o C
hapt
er 3
on
Volta
ge Q
ualit
y
TABLE A3.26 I ThenumberofvoltagedipsandswellsintheHVnetwork(110kV)inSloveniain2008
Network areaTotal number of voltage dips and voltage swells
Voltage dips Voltage swellsDistribution area 1 697 6Distribution area 2 1,124 3,552Distribution area 3 1,610 6Distribution area 4 480 178Distribution area 5 1,345 66
TABLE A3.27 I ThenumberofvoltagedipsandswellsintheHVnetwork(110kV)inSloveniain2009
Network areaTotal number of voltage dips and voltage swells
Voltage dips Voltage swellsDistribution area 1 683 5Distribution area 2 911 6,621Distribution area 3 1,201 15Distribution area 4 412 209Distribution area 5 1,127 100
TABLE A3.28 I ThenumberofvoltagedipsandswellsintheMVnetworks(10,20and35kV)in Sloveniain2008
Network areaTotal number of voltage dips and voltage swells
Voltage dips Voltage swellsDistribution area 1 1,937 56Distribution area 2 6,655 18,781Distribution area 3 6,778 70Distribution area 4 2,249 16,917Distribution area 5 4,999 3,855
TABLE A3.29 I ThenumberofvoltagedipsandswellsintheMVnetworks(10,20and35kV)in Sloveniain2009
Network areaTotal number of voltage dips and voltage swells
Voltage dips Voltage swellsDistribution area 1 3,230 59Distribution area 2 4,112 6,569Distribution area 3 5,850 109Distribution area 4 1,659 7,809Distribution area 5 4,308 3,208
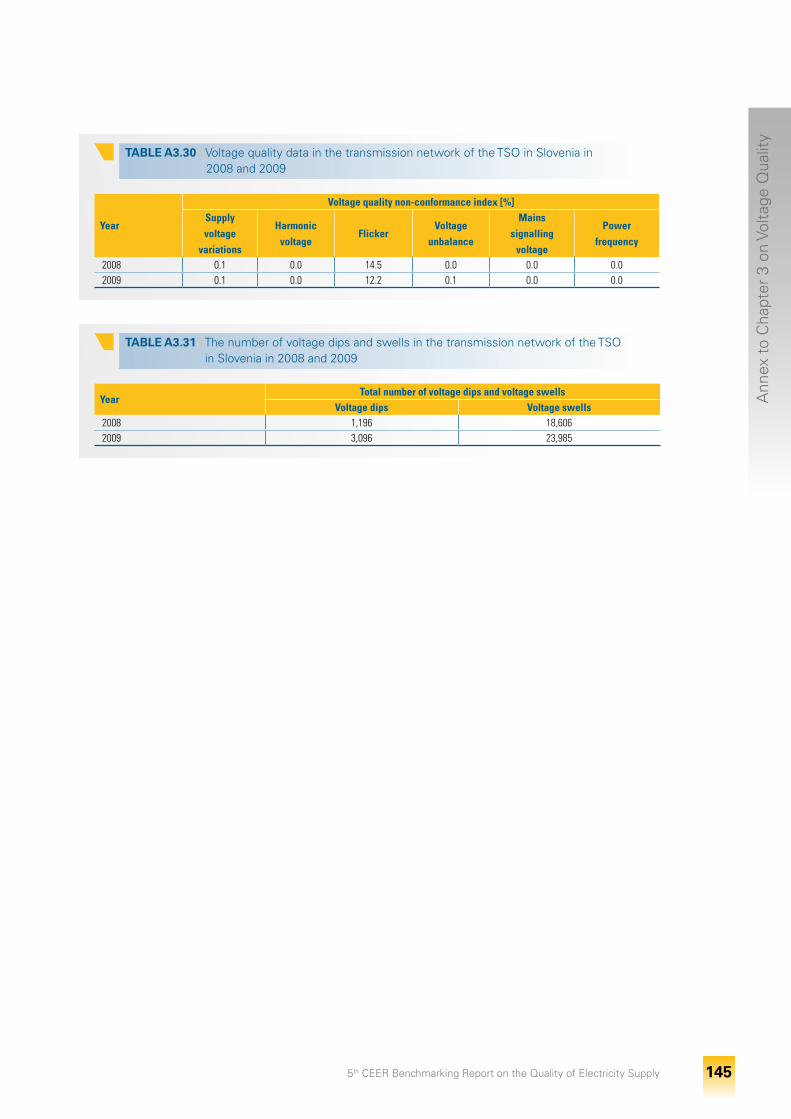
5th CEER Benchmarking Report on the Quality of Electricity Supply 145
Ann
ex t
o C
hapt
er 3
on
Volta
ge Q
ualit
y
TABLE A3.30 I VoltagequalitydatainthetransmissionnetworkoftheTSOinSloveniain 2008and2009
Year
Voltage quality non-conformance index [%]Supply voltage
variations
Harmonic voltage
FlickerVoltage
unbalance
Mains signalling
voltage
Power frequency
2008 0.1 0.0 14.5 0.0 0.0 0.02009 0.1 0.0 12.2 0.1 0.0 0.0
TABLE A3.31 I ThenumberofvoltagedipsandswellsinthetransmissionnetworkoftheTSO inSloveniain2008and2009
YearTotal number of voltage dips and voltage swells
Voltage dips Voltage swells2008 1,196 18,6062009 3,096 23,985
5th CEER Benchmarking Report on the Quality of Electricity Supply 146
Annex to Chapter 4 on Commercial Quality pre-sents detailed information on commercial quality in the countries surveyed. First, it includes a set of 17 tables referring to the features of regulating each of 15 performances and 2 sub-performances (II.6a and II.6b) listed in Table 4.1 (Part 1 of the Annex to Chapter 4 - commercial quality regulation). Next, it presents the set of corresponding 17 tables which display the actual data in 2008, 2009, 2010, when available (Part 2 of the Annex to Chapter 4 - com-mercial quality data).
The tables use the same numbering of commercial quality indicators presented in Table 4.1, e.g. Table A4.1.1 and Table A4.2.1 refer to the indicator I.1 ”Time for response to customer claim for network connection”.
As data might not be available in all countries, the tables in Part 2 of the Annex to Chapter 4 can be shorter than the tables in Part 1 of the Annex to Chapter 4. When tables in Part 2 of the Annex to Chapter 4 display the same country more than once (which might be the case when presenting a coun-try’s actual data for LV customers and actual data for MV customers), the reader is referred to the cor-responding table in Part 1 of the Annex to Chapter 4 to understand the reason for this double posting.
Annex to Chapter 4 on Commercial Quality
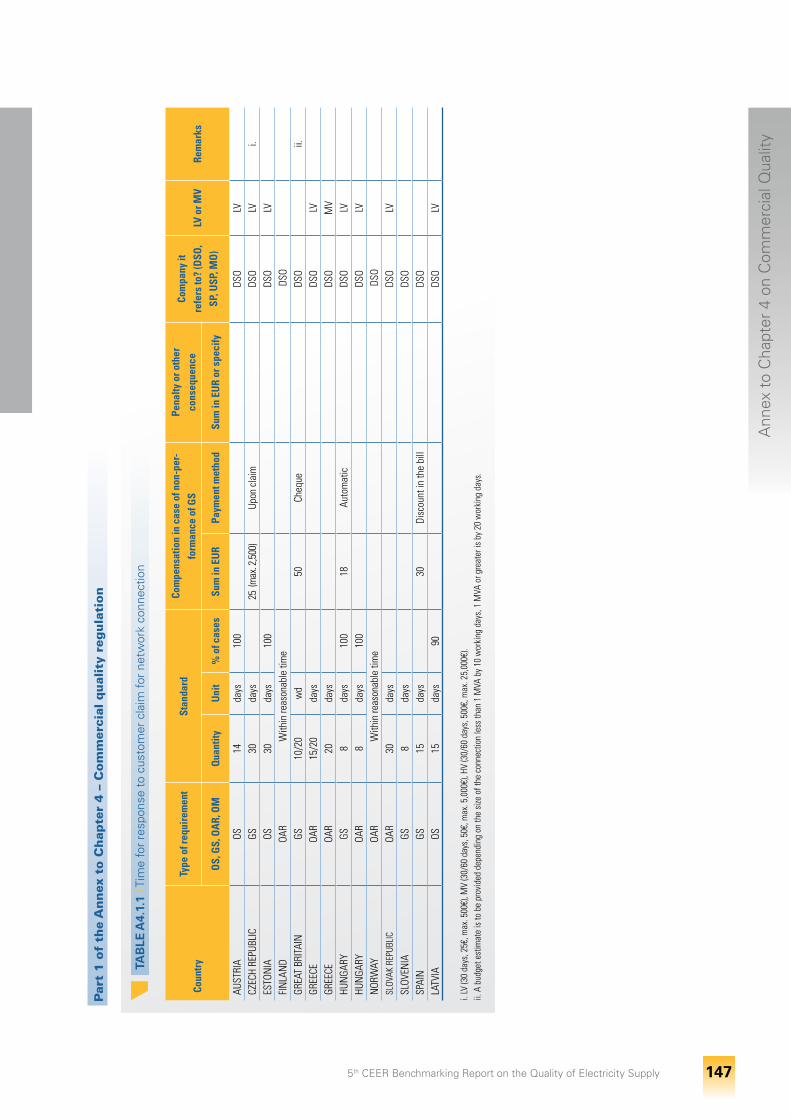
Ann
ex t
o C
hapt
er 4
on
Com
mer
cial
Qua
lity
5th CEER Benchmarking Report on the Quality of Electricity Supply 147
T
AB
LE A
4.1.
1 I T
ime
for
resp
onse
to
cust
omer
cla
im fo
r ne
twor
k co
nnec
tion
Coun
try
Type
of r
equi
rem
ent
Stan
dard
Com
pens
atio
n in
cas
e of
non
-per
-fo
rman
ce o
f GS
Pena
lty o
r oth
er
cons
eque
nce
Com
pany
it
refe
rs to
? (D
SO,
SP, U
SP, M
O)
LV o
r MV
Rem
arks
OS,
GS,
OA
R, O
MQ
uant
ityU
nit
% o
f cas
esSu
m in
EU
RPa
ymen
t met
hod
Sum
in E
UR
or s
peci
fy
AUST
RIA
OS14
days
10
0
DSO
LV
CZEC
H RE
PUBL
ICGS
30da
ys
25
(max
. 2,5
00)
Upon
cla
im
DSO
LVi.
ESTO
NIA
OS30
days
10
0
DSO
LV
FIN
LAN
DOA
RW
ithin
reas
onab
le ti
me
DSO
GREA
T BR
ITAI
NGS
10/2
0w
d
50Ch
eque
DS
O
ii.GR
EECE
OAR
15/2
0da
ys
DS
OLV
GR
EECE
OAR
20da
ys
DS
OM
V
HUN
GARY
GS8
days
100
18Au
tom
atic
DS
OLV
HU
NGA
RYOA
R8
days
100
DS
OLV
N
ORW
AYOA
RW
ithin
reas
onab
le ti
me
DSO
SLOV
AK R
EPUB
LIC
OAR
30da
ys
DS
OLV
SL
OVEN
IAGS
8da
ys
DS
O
SP
AIN
GS15
days
30
Disc
ount
in th
e bi
ll
DSO
LATV
IAOS
15da
ys90
DS
OLV
i. LV
(30
days
, 25€
, max
. 500
€), M
V (3
0/60
day
s, 5
0€, m
ax. 5
,000
€), H
V (3
0/60
day
s, 5
00€,
max
. 25,
000€
).ii.
A b
udge
t est
imat
e is
to b
e pr
ovid
ed d
epen
ding
on
the
size
of t
he c
onne
ctio
n le
ss th
an 1
MVA
by
10 w
orki
ng d
ays,
1 M
VA o
r gre
ater
is b
y 20
wor
king
day
s.
Par
t 1
of
the
An
nex
to
Ch
apte
r 4
– C
om
mer
cial
qu
alit
y re
gu
lati
on
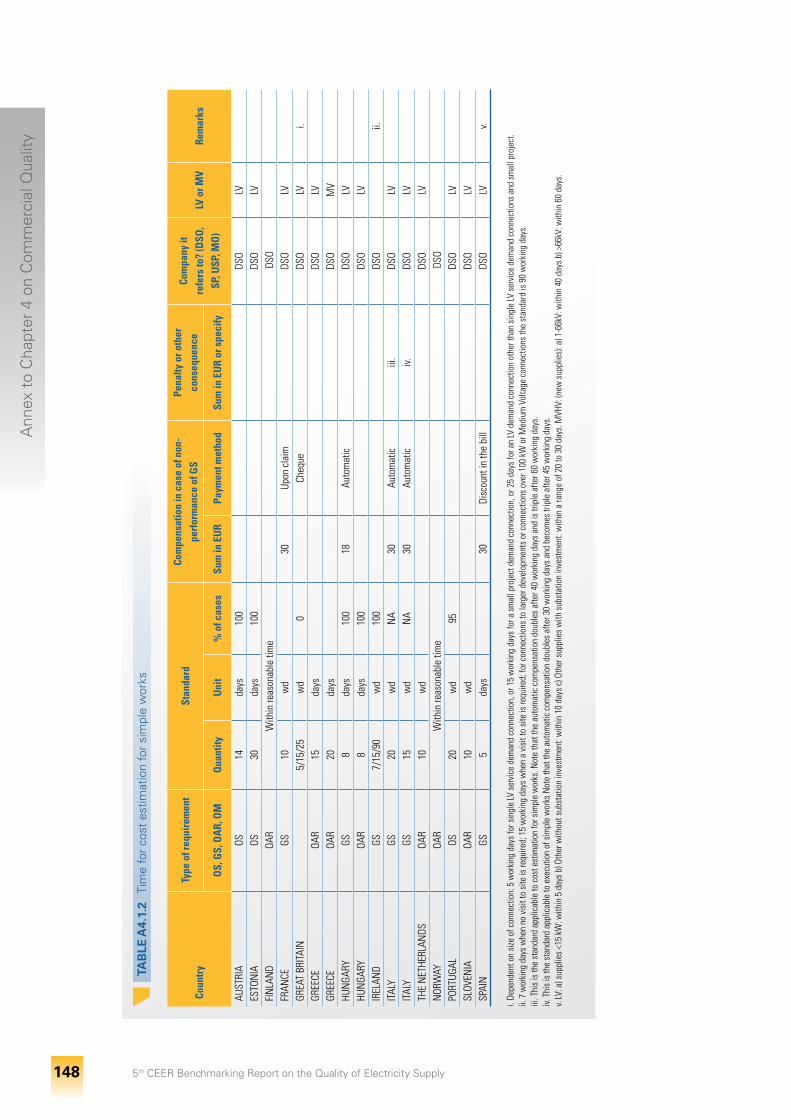
Ann
ex t
o C
hapt
er 4
on
Com
mer
cial
Qua
lity
5th CEER Benchmarking Report on the Quality of Electricity Supply 148
T
AB
LE A
4.1.
2 I T
ime
for
cost
est
imat
ion
for
sim
ple
wor
ks
Coun
try
Type
of r
equi
rem
ent
Stan
dard
Com
pens
atio
n in
cas
e of
non
-pe
rfor
man
ce o
f GS
Pena
lty o
r oth
er
cons
eque
nce
Com
pany
it
refe
rs to
? (D
SO,
SP, U
SP, M
O)
LV o
r MV
Rem
arks
OS,
GS,
OA
R, O
MQ
uant
ityU
nit
% o
f cas
esSu
m in
EU
RPa
ymen
t met
hod
Sum
in E
UR
or s
peci
fy
AUST
RIA
OS14
days
100
DS
OLV
ES
TON
IAOS
30da
ys10
0
DSO
LV
FIN
LAN
DOA
RW
ithin
reas
onab
le ti
me
DSO
FRAN
CEGS
10w
d30
Upon
cla
im
DSO
LV
GREA
T BR
ITAI
N
5/15
/25
wd
0Ch
eque
DS
OLV
i.GR
EECE
OAR
15da
ys
DS
OLV
GR
EECE
OAR
20da
ys
DS
OM
V
HUN
GARY
GS8
days
100
18Au
tom
atic
DS
OLV
HU
NGA
RYOA
R8
days
100
DS
OLV
IR
ELAN
DGS
7/15
/90
wd
100
DS
O
ii.IT
ALY
GS20
wd
NA
30Au
tom
atic
iii.
DSO
LV
ITAL
YGS
15w
dN
A30
Auto
mat
iciv.
DSO
LV
THE
NET
HERL
ANDS
OAR
10w
d
DS
OLV
N
ORW
AYOA
RW
ithin
reas
onab
le ti
me
DSO
PORT
UGAL
OS20
wd
95
DSO
LV
SLOV
ENIA
OAR
10w
d
DS
OLV
SP
AIN
GS5
days
30
Disc
ount
in th
e bi
ll
DSO
LVv.
i. De
pend
ent o
n si
ze o
f con
nect
ion:
5 w
orki
ng d
ays
for s
ingl
e LV
ser
vice
dem
and
conn
ectio
n, o
r 15
wor
king
day
s fo
r a s
mal
l pro
ject
dem
and
conn
ectio
n, o
r 25
days
for a
n LV
dem
and
conn
ectio
n ot
her t
han
sing
le LV
ser
vice
dem
and
conn
ectio
ns a
nd s
mal
l pro
ject
.ii.
7 w
orki
ng d
ays
whe
n no
vis
it to
site
is re
quire
d; 1
5 w
orki
ng d
ays
whe
n a
visi
t to
site
is re
quire
d; fo
r con
nect
ions
to la
rger
dev
elop
men
ts o
r con
nect
ions
ove
r 100
kW
or M
ediu
m V
olta
ge c
onne
ctio
ns th
e st
anda
rd is
90
wor
king
day
s.iii
. Thi
s is
the
stan
dard
app
licab
le to
cos
t est
imat
ion
for s
impl
e w
orks
. Not
e th
at th
e au
tom
atic
com
pens
atio
n do
uble
s af
ter 4
0 w
orki
ng d
ays
and
is tr
iple
afte
r 60
wor
king
day
s.iv.
Thi
s is
the
stan
dard
app
licab
le to
exe
cutio
n of
sim
ple
wor
ks N
ote
that
the
auto
mat
ic c
ompe
nsat
ion
doub
les
afte
r 30
wor
king
day
s an
d be
com
es tr
iple
afte
r 45
wor
king
day
s.v.
LV: a
) sup
plie
s <1
5 kW
: with
in 5
day
s b)
Oth
er w
ithou
t sub
stat
ion
inve
stm
ent:
with
in 1
0 da
ys c
) Oth
er s
uppl
ies
with
sub
stat
ion
inve
stm
ent:
with
in a
rang
e of
20
to 3
0 da
ys. M
VHV:
(new
sup
plie
s): a
) 1-6
6kV:
with
in 4
0 da
ys b
) >66
kV: w
ithin
60
days
.
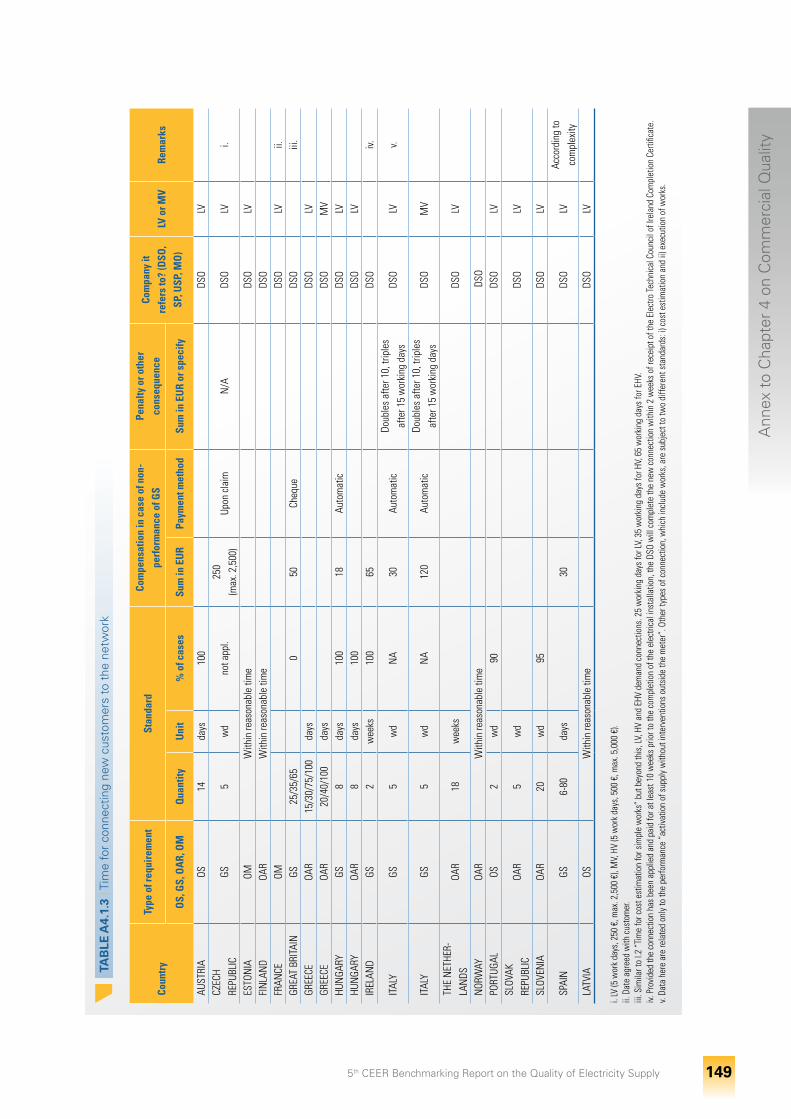
Ann
ex t
o C
hapt
er 4
on
Com
mer
cial
Qua
lity
5th CEER Benchmarking Report on the Quality of Electricity Supply 149
T
AB
LE A
4.1.
3 I T
ime
for
conn
ectin
g ne
w c
usto
mer
s to
the
net
wor
k
Coun
try
Type
of r
equi
rem
ent
Stan
dard
Com
pens
atio
n in
cas
e of
non
-pe
rfor
man
ce o
f GS
Pena
lty o
r oth
er
cons
eque
nce
Com
pany
it
refe
rs to
? (D
SO,
SP, U
SP, M
O)
LV o
r MV
Rem
arks
OS,
GS,
OA
R, O
MQ
uant
ityU
nit
% o
f cas
esSu
m in
EU
RPa
ymen
t met
hod
Sum
in E
UR
or s
peci
fy
AUST
RIA
OS14
days
100
DS
OLV
CZ
ECH
REPU
BLIC
GS5
wd
not a
ppl.
250
(max
. 2,5
00)
Upon
cla
imN
/ADS
OLV
i.
ESTO
NIA
OMW
ithin
reas
onab
le ti
me
DS
OLV
FIN
LAN
DOA
RW
ithin
reas
onab
le ti
me
DSO
FRAN
CEOM
DSO
LVii.
GR
EAT
BRIT
AIN
GS25
/35/
65
050
Cheq
ue
DSO
iii
.GR
EECE
OAR
15/3
0/75
/100
days
DSO
LV
GREE
CEOA
R20
/40/
100
days
DSO
MV
HU
NGA
RYGS
8da
ys10
018
Auto
mat
ic
DSO
LV
HUN
GARY
OAR
8da
ys10
0
DSO
LV
IREL
AND
GS2
wee
ks10
065
DSO
iv.
ITAL
YGS
5w
dN
A30
Auto
mat
icDo
uble
s af
ter 1
0, tr
iple
s af
ter 1
5 w
orki
ng d
ays
DSO
LVv.
ITAL
YGS
5w
dN
A12
0Au
tom
atic
Doub
les
afte
r 10,
trip
les
afte
r 15
wor
king
day
sDS
OM
V
THE
NET
HER-
LAN
DSOA
R18
wee
ks
DS
OLV
NOR
WAY
OAR
With
in re
ason
able
tim
e
D
SOPO
RTUG
ALOS
2w
d90
DS
OLV
SL
OVAK
RE
PUBL
ICOA
R5
wd
DSO
LV
SLOV
ENIA
OAR
20w
d95
DS
OLV
SPAI
NGS
6-80
days
30
DSO
LVAc
cord
ing
to
com
plex
ityLA
TVIA
OSW
ithin
reas
onab
le ti
me
DS
OLV
i. LV
(5 w
ork
days
, 250
€, m
ax. 2
,500
€),
MV,
HV
(5 w
ork
days
, 500
€, m
ax. 5
,000
€).
ii. D
ate
agre
ed w
ith c
usto
mer
.iii
. Sim
ilar t
o I.2
“Ti
me
for c
ost e
stim
atio
n fo
r sim
ple
wor
ks”
but b
eyon
d th
is, L
V, H
V an
d EH
V de
man
d co
nnec
tions
. 25
wor
king
day
s fo
r LV,
35
wor
king
day
s fo
r HV,
65
wor
king
day
s fo
r EHV
.iv.
Pro
vide
d th
e co
nnec
tion
has
been
app
lied
and
paid
for a
t lea
st 1
0 w
eeks
prio
r to
the
com
plet
ion
of th
e el
ectri
cal i
nsta
llatio
n, th
e DS
O w
ill c
ompl
ete
the
new
con
nect
ion
with
in 2
wee
ks o
f rec
eipt
of t
he E
lect
ro Te
chni
cal C
ounc
il of
Irel
and
Com
plet
ion
Certi
ficat
e.v.
Data
her
e ar
e re
late
d on
ly to
the
perfo
rman
ce “
activ
atio
n of
sup
ply
with
out i
nter
vent
ions
out
side
the
met
er”.
Oth
er ty
pes
of c
onne
ctio
n, w
hich
incl
ude
wor
ks, a
re s
ubje
ct to
two
diffe
rent
sta
ndar
ds: i
) cos
t est
imat
ion
and
ii) e
xecu
tion
of w
orks
.

Ann
ex t
o C
hapt
er 4
on
Com
mer
cial
Qua
lity
5th CEER Benchmarking Report on the Quality of Electricity Supply 150
T
AB
LE A
4.1.
4 I T
ime
for
disc
onne
ctio
n up
on c
usto
mer
’s r
eque
st
Coun
try
Type
of r
equi
rem
ent
Stan
dard
Com
pens
atio
n in
cas
e of
non
-pe
rfor
man
ce o
f GS
Pena
lty o
r oth
er
cons
eque
nce
Com
pany
it
refe
rs to
? (D
SO,
SP, U
SP, M
O)
LV o
r MV
Rem
arks
OS,
GS,
OA
R, O
MQ
uant
ityU
nit
% o
f cas
esSu
m in
EU
RPa
ymen
t met
hod
Sum
in E
UR
or s
peci
fy
ESTO
NIA
OS5-
8w
d10
0
DSO
LV
FIN
LAN
DOA
RW
ithin
reas
onab
le ti
me
DSO
FRAN
CEOM
5w
d
DS
OLV
IREL
AND
OM5
wd
100
DS
O
De-e
nerg
isat
ion
with
in 5
day
s
ITAL
YGS
5w
dN
A30
Auto
mat
icDo
uble
s af
ter 1
0, tr
iple
s af
ter 1
5 w
orki
ng d
ays
DSO
LV
ITAL
YGS
7w
dN
A12
0Au
tom
atic
Doub
les
afte
r 14,
trip
les
afte
r 21
wor
king
day
sDS
OM
V
NOR
WAY
OAR
With
in re
ason
able
tim
e
DS
OLA
TVIA
OS5
days
DSO
LV
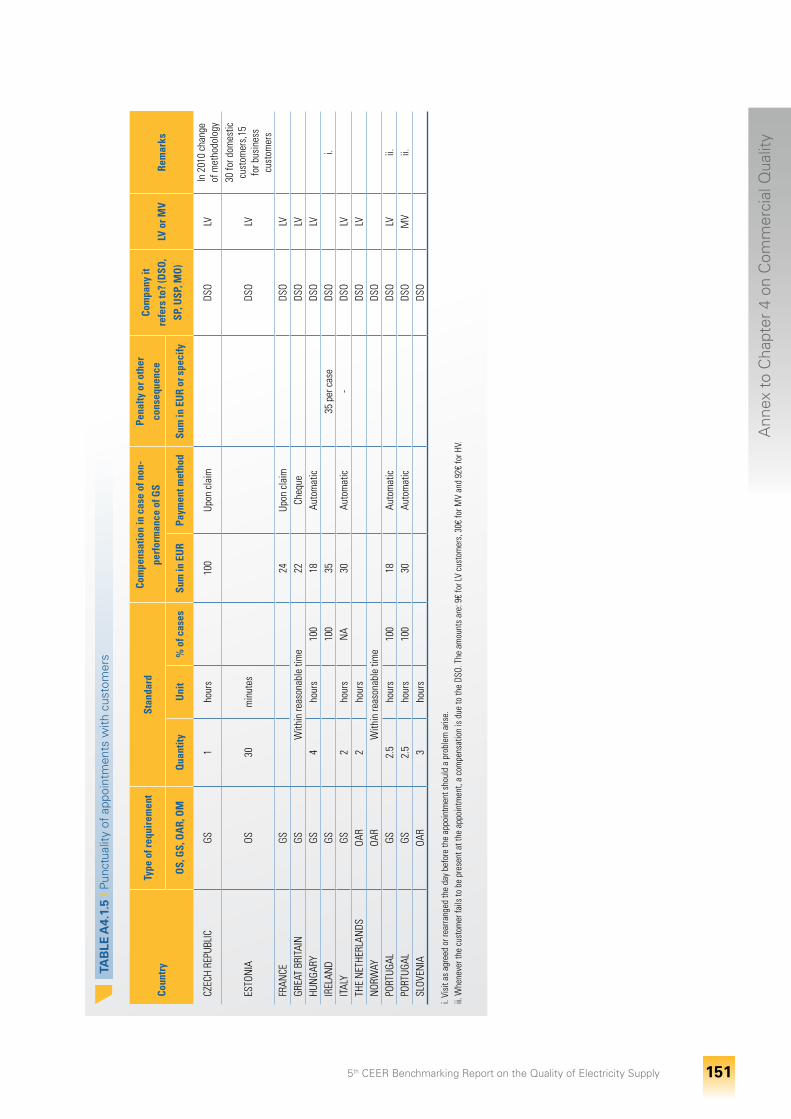
Ann
ex t
o C
hapt
er 4
on
Com
mer
cial
Qua
lity
5th CEER Benchmarking Report on the Quality of Electricity Supply 151
T
AB
LE A
4.1.
5 I P
unct
ualit
y of
app
oint
men
ts w
ith c
usto
mer
s
Coun
try
Type
of r
equi
rem
ent
Stan
dard
Com
pens
atio
n in
cas
e of
non
-pe
rfor
man
ce o
f GS
Pena
lty o
r oth
erco
nseq
uenc
eCo
mpa
ny it
re
fers
to?
(DSO
, SP
, USP
, MO
)LV
or M
VRe
mar
ks
OS,
GS,
OA
R, O
MQ
uant
ityU
nit
% o
f cas
esSu
m in
EU
RPa
ymen
t met
hod
Sum
in E
UR
or s
peci
fy
CZEC
H RE
PUBL
ICGS
1ho
urs
10
0Up
on c
laim
DS
OLV
In 2
010
chan
ge
of m
etho
dolo
gy
ESTO
NIA
OS30
min
utes
DSO
LV
30 fo
r dom
estic
cu
stom
ers,
15
for b
usin
ess
cust
omer
sFR
ANCE
GS
24Up
on c
laim
DS
OLV
GR
EAT
BRIT
AIN
GSW
ithin
reas
onab
le ti
me
22Ch
eque
DSO
LVHU
NGA
RYGS
4ho
urs
100
18Au
tom
atic
DS
OLV
IR
ELAN
DGS
100
35
35 p
er c
ase
DSO
i.
ITAL
YGS
2ho
urs
NA
30Au
tom
atic
-DS
OLV
TH
E N
ETHE
RLAN
DSOA
R2
hour
s
DS
OLV
N
ORW
AYOA
RW
ithin
reas
onab
le ti
me
DSO
PORT
UGAL
GS2.
5ho
urs
100
18Au
tom
atic
DS
OLV
ii.PO
RTUG
ALGS
2.5
hour
s10
030
Auto
mat
ic
DSO
MV
ii.SL
OVEN
IAOA
R3
hour
s
DS
O
i. Vi
sit a
s ag
reed
or r
earra
nged
the
day
befo
re th
e ap
poin
tmen
t sho
uld
a pr
oble
m a
rise.
ii. W
hene
ver t
he c
usto
mer
fails
to b
e pr
esen
t at t
he a
ppoi
ntm
ent,
a co
mpe
nsat
ion
is d
ue to
the
DSO.
The
am
ount
s ar
e: 9
€ fo
r LV
cust
omer
s, 3
0€ fo
r MV
and
92€
for H
V.
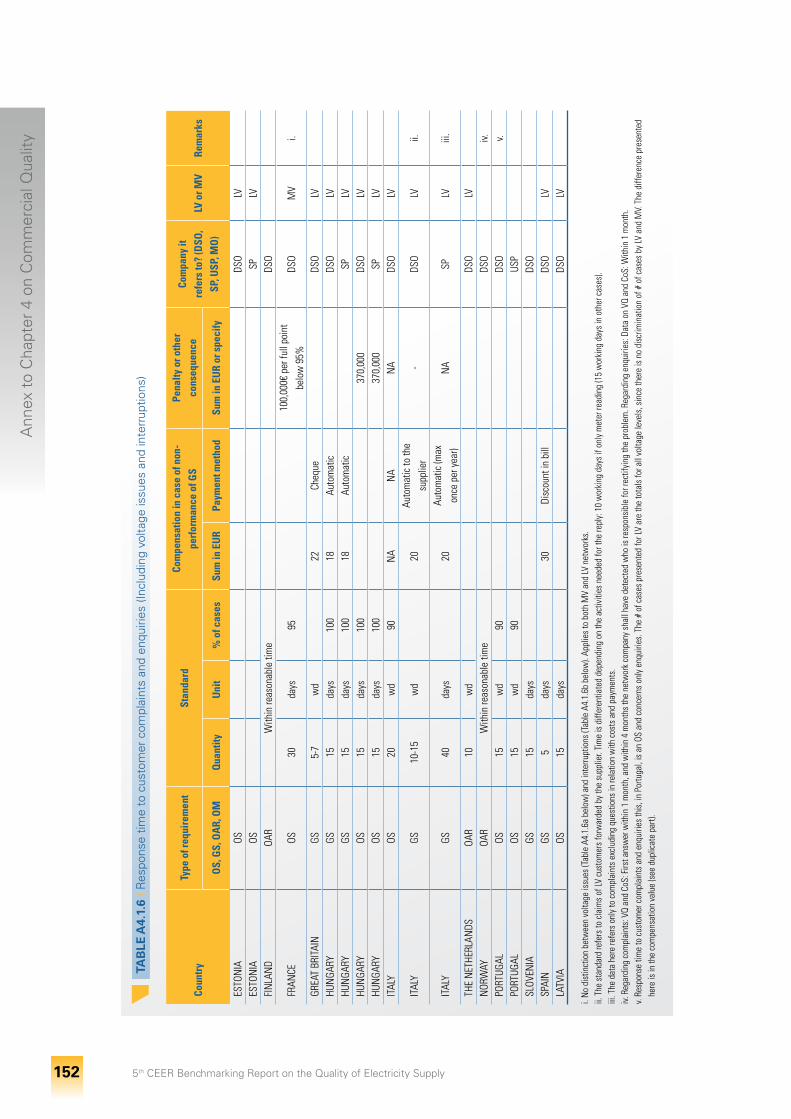
Ann
ex t
o C
hapt
er 4
on
Com
mer
cial
Qua
lity
5th CEER Benchmarking Report on the Quality of Electricity Supply 152
T
AB
LE A
4.1.
6 I R
espo
nse
time
to c
usto
mer
com
plai
nts
and
enqu
iries
(Inc
ludi
ng v
olta
ge is
sues
and
inte
rrup
tions
)
Coun
try
Type
of r
equi
rem
ent
Stan
dard
Com
pens
atio
n in
cas
e of
non
-pe
rfor
man
ce o
f GS
Pena
lty o
r oth
erco
nseq
uenc
eCo
mpa
ny it
re
fers
to?
(DSO
, SP
, USP
, MO
)LV
or M
VRe
mar
ks
OS,
GS,
OA
R, O
MQ
uant
ityU
nit
% o
f cas
esSu
m in
EU
RPa
ymen
t met
hod
Sum
in E
UR
or s
peci
fy
ESTO
NIA
OS
DS
OLV
ES
TON
IAOS
SPLV
FI
NLA
ND
OAR
With
in re
ason
able
tim
e
DS
O
FRAN
CEOS
30da
ys95
100,
000€
per
full
poin
t be
low
95%
DSO
MV
i.
GREA
T BR
ITAI
NGS
5-7
wd
22Ch
eque
DS
OLV
HU
NGA
RYGS
15da
ys10
018
Auto
mat
ic
DSO
LV
HUN
GARY
GS15
days
100
18Au
tom
atic
SP
LV
HUN
GARY
OS15
days
100
370,
000
DSO
LV
HUN
GARY
OS15
days
100
370,
000
SPLV
IT
ALY
OS20
wd
90N
AN
AN
ADS
OLV
ITAL
YGS
10-1
5w
d
20Au
tom
atic
to th
e su
pplie
r-
DSO
LVii.
ITAL
YGS
40da
ys
20Au
tom
atic
(max
on
ce p
er y
ear)
NA
SPLV
iii.
THE
NET
HERL
ANDS
OAR
10w
d
DS
OLV
N
ORW
AYOA
RW
ithin
reas
onab
le ti
me
DSO
iv.PO
RTUG
ALOS
15w
d90
DS
O
v.PO
RTUG
ALOS
15w
d90
US
P
SL
OVEN
IAGS
15da
ys
DS
O
SP
AIN
GS5
days
30
Disc
ount
in b
ill
DSO
LV
LATV
IAOS
15da
ys
DS
OLV
i. N
o di
stin
ctio
n be
twee
n vo
ltage
issu
es (T
able
A4.
1.6a
bel
ow) a
nd in
terru
ptio
ns (T
able
A4.
1.6b
bel
ow).
Appl
ies
to b
oth
MV
and
LV n
etw
orks
.ii.
The
sta
ndar
d re
fers
to c
laim
s of
LV c
usto
mer
s fo
rwar
ded
by th
e su
pplie
r. Ti
me
is d
iffer
entia
ted
depe
ndin
g on
the
activ
ities
nee
ded
for t
he re
ply:
10
wor
king
day
s if
only
met
er re
adin
g (1
5 w
orki
ng d
ays
in o
ther
cas
es).
iii. T
he d
ata
here
refe
rs o
nly
to c
ompl
aint
s ex
clud
ing
ques
tions
in re
latio
n w
ith c
osts
and
pay
men
ts.
iv. R
egar
ding
com
plai
nts:
VQ
and
CoS:
Firs
t ans
wer
with
in 1
mon
th, a
nd w
ithin
4 m
onth
s th
e ne
twor
k co
mpa
ny s
hall
have
det
ecte
d w
ho is
resp
onsi
ble
for r
ectif
ying
the
prob
lem
. Reg
ardi
ng e
nqui
ries:
Dat
a on
VQ
and
CoS:
With
in 1
mon
th.
v. Re
spon
se ti
me
to c
usto
mer
com
plai
nts
and
enqu
iries
this
, in
Portu
gal,
is a
n OS
and
con
cern
s on
ly e
nqui
ries.
The
# o
f cas
es p
rese
nted
for L
V ar
e th
e to
tals
for a
ll vo
ltage
leve
ls, s
ince
ther
e is
no
disc
rimin
atio
n of
# o
f cas
es b
y LV
and
MV.
The
diff
eren
ce p
rese
nted
he
re is
in th
e co
mpe
nsat
ion
valu
e (s
ee d
uplic
ate
part)
.

Ann
ex t
o C
hapt
er 4
on
Com
mer
cial
Qua
lity
5th CEER Benchmarking Report on the Quality of Electricity Supply 153
T
AB
LE A
4.1.
6a I
Tim
e fo
r an
swer
ing
the
volta
ge c
ompl
aint
Coun
try
Type
of r
equi
rem
ent
Stan
dard
Com
pens
atio
n in
cas
e of
non
-per
for-
man
ce o
f GS
Pena
lty o
r oth
erco
nseq
uenc
eCo
mpa
ny it
re
fers
to?
(DSO
, SP
, USP
, MO
)
LV o
r M
VRe
-m
arks
OS,
GS,
OA
R, O
MQ
uant
ityU
nit
% o
f cas
esSu
m in
EU
RPa
ymen
t met
hod
Sum
in E
UR
or s
peci
fy
CZEC
H RE
PUBL
ICGS
60da
ysN
A50
(max
. 1,2
50)
Upon
cla
imN
ADS
OLV
ESTO
NIA
OS
DS
OLV
FI
NLA
ND
OAR
With
in re
ason
able
tim
e
DS
OGR
EAT
BRIT
AIN
GS5-
7w
d22
Cheq
ue
DSO
LV
HUN
GARY
GS10
wd
100
18Au
tom
atic
DS
OLV
TH
E N
ETHE
RLAN
DSOA
R10
wd
DSO
LV
NOR
WAY
OAR
DSO
PORT
UGAL
GS15
wd
100
18Au
tom
atic
DS
OLV
PO
RTUG
ALGS
15w
d10
030
Auto
mat
ic
DSO
MV
SL
OVAK
REP
UBLI
COA
R30
days
DSO
LV
SLOV
ENIA
GS15
days
DSO
SPAI
NGS
5da
ys
30Di
scou
nt in
bill
DS
OLV
LA
TVIA
OS15
days
DSO
LV
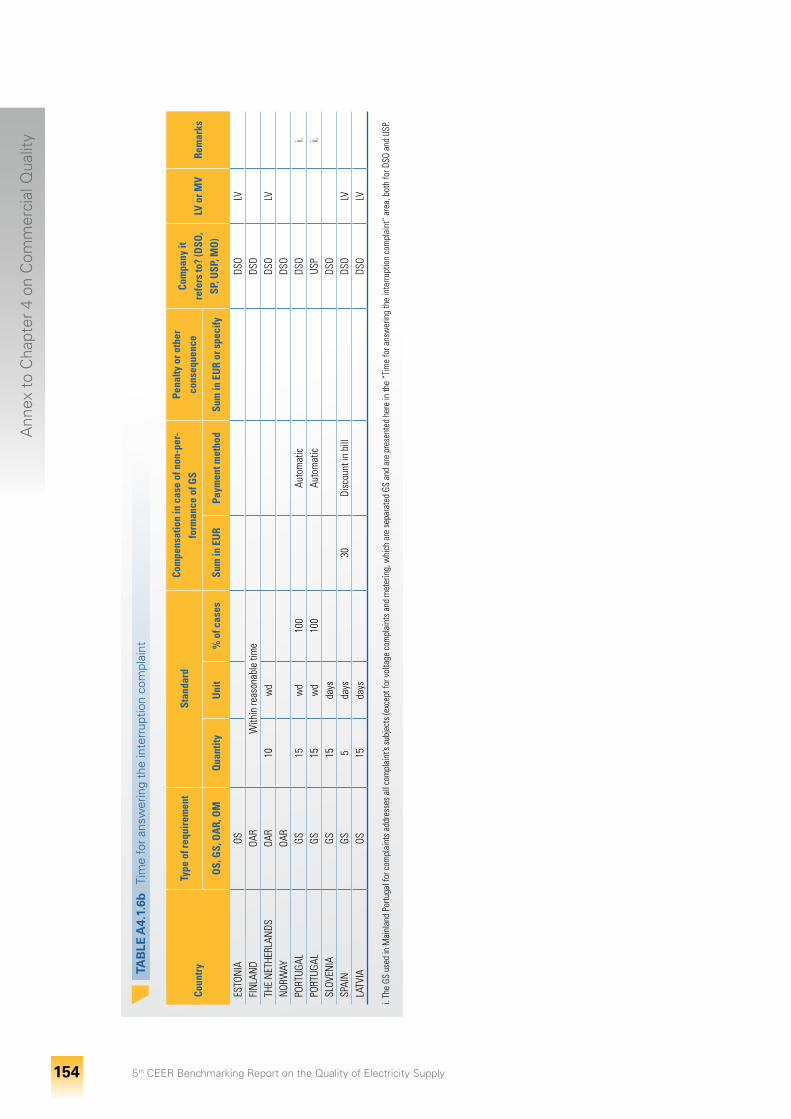
Ann
ex t
o C
hapt
er 4
on
Com
mer
cial
Qua
lity
5th CEER Benchmarking Report on the Quality of Electricity Supply 154
T
AB
LE A
4.1.
6b I
Tim
e fo
r an
swer
ing
the
inte
rrup
tion
com
plai
nt
Coun
try
Type
of r
equi
rem
ent
Stan
dard
Com
pens
atio
n in
cas
e of
non
-per
-fo
rman
ce o
f GS
Pena
lty o
r oth
erco
nseq
uenc
eCo
mpa
ny it
re
fers
to?
(DSO
, SP
, USP
, MO
)LV
or M
VRe
mar
ks
OS,
GS,
OA
R, O
MQ
uant
ityU
nit
% o
f cas
esSu
m in
EU
RPa
ymen
t met
hod
Sum
in E
UR
or s
peci
fy
ESTO
NIA
OS
DS
OLV
FI
NLA
ND
OAR
With
in re
ason
able
tim
e
DS
O TH
E N
ETHE
RLAN
DSOA
R10
wd
DSO
LV
NOR
WAY
OAR
DSO
PORT
UGAL
GS15
wd
100
Au
tom
atic
DS
O
i.PO
RTUG
ALGS
15w
d10
0
Auto
mat
ic
USP
i.
SLOV
ENIA
GS15
days
DSO
SPAI
NGS
5da
ys
30Di
scou
nt in
bill
DS
OLV
LA
TVIA
OS15
days
DSO
LV
i. Th
e GS
use
d in
Mai
nlan
d Po
rtuga
l for
com
plai
nts
addr
esse
s al
l com
plai
nt’s
subj
ects
(exc
ept f
or v
olta
ge c
ompl
aint
s an
d m
eter
ing,
whi
ch a
re s
epar
ated
GS
and
are
pres
ente
d he
re in
the
“Tim
e fo
r ans
wer
ing
the
inte
rrupt
ion
com
plai
nt”
area
, bot
h fo
r DSO
and
USP
.
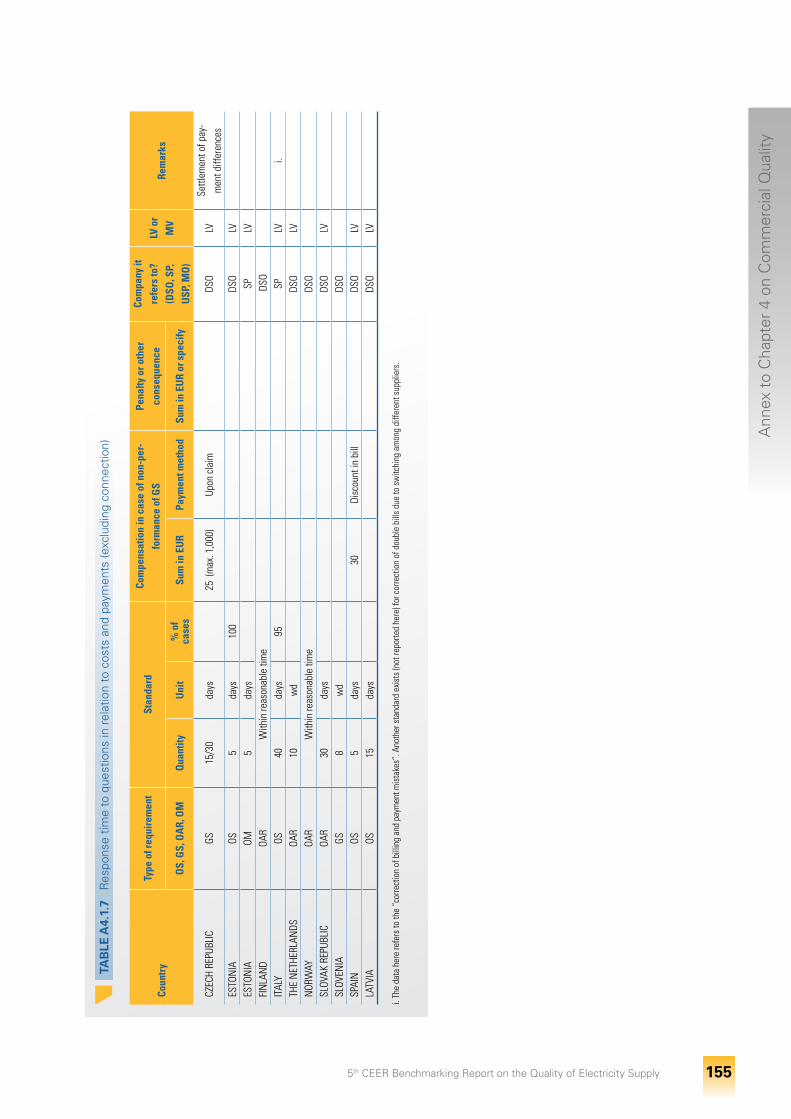
Ann
ex t
o C
hapt
er 4
on
Com
mer
cial
Qua
lity
5th CEER Benchmarking Report on the Quality of Electricity Supply 155
T
AB
LE A
4.1.
7 I R
espo
nse
time
to q
uest
ions
in r
elat
ion
to c
osts
and
pay
men
ts (e
xclu
ding
con
nect
ion)
Coun
try
Type
of r
equi
rem
ent
Stan
dard
Com
pens
atio
n in
cas
e of
non
-per
-fo
rman
ce o
f GS
Pena
lty o
r oth
erco
nseq
uenc
e
Com
pany
it
refe
rs to
? (D
SO, S
P,
USP
, MO
)
LV o
r M
VRe
mar
ks
OS,
GS,
OA
R, O
MQ
uant
ityU
nit
% o
f ca
ses
Sum
in E
UR
Paym
ent m
etho
dSu
m in
EU
R or
spe
cify
CZEC
H RE
PUBL
ICGS
15/3
0da
ys
25 (
max
. 1,0
00)
Upon
cla
imDS
OLV
Settl
emen
t of p
ay-
men
t diff
eren
ces
ESTO
NIA
OS5
days
100
DS
OLV
ES
TON
IAOM
5da
ys
SP
LV
FIN
LAN
DOA
RW
ithin
reas
onab
le ti
me
DSO
ITAL
YOS
40da
ys95
SP
LVi.
THE
NET
HERL
ANDS
OAR
10w
d
DS
OLV
N
ORW
AYOA
RW
ithin
reas
onab
le ti
me
DSO
SLOV
AK R
EPUB
LIC
OAR
30da
ys
DS
OLV
SL
OVEN
IAGS
8w
d
DS
O
SP
AIN
OS5
days
30
Disc
ount
in b
ill
DSO
LV
LATV
IAOS
15da
ys
DS
OLV
i. Th
e da
ta h
ere
refe
rs to
the
“cor
rect
ion
of b
illin
g an
d pa
ymen
t mis
take
s”. A
noth
er s
tand
ard
exis
ts (n
ot re
porte
d he
re) f
or c
orre
ctio
n of
dou
ble
bills
due
to s
witc
hing
am
ong
diffe
rent
sup
plie
rs.
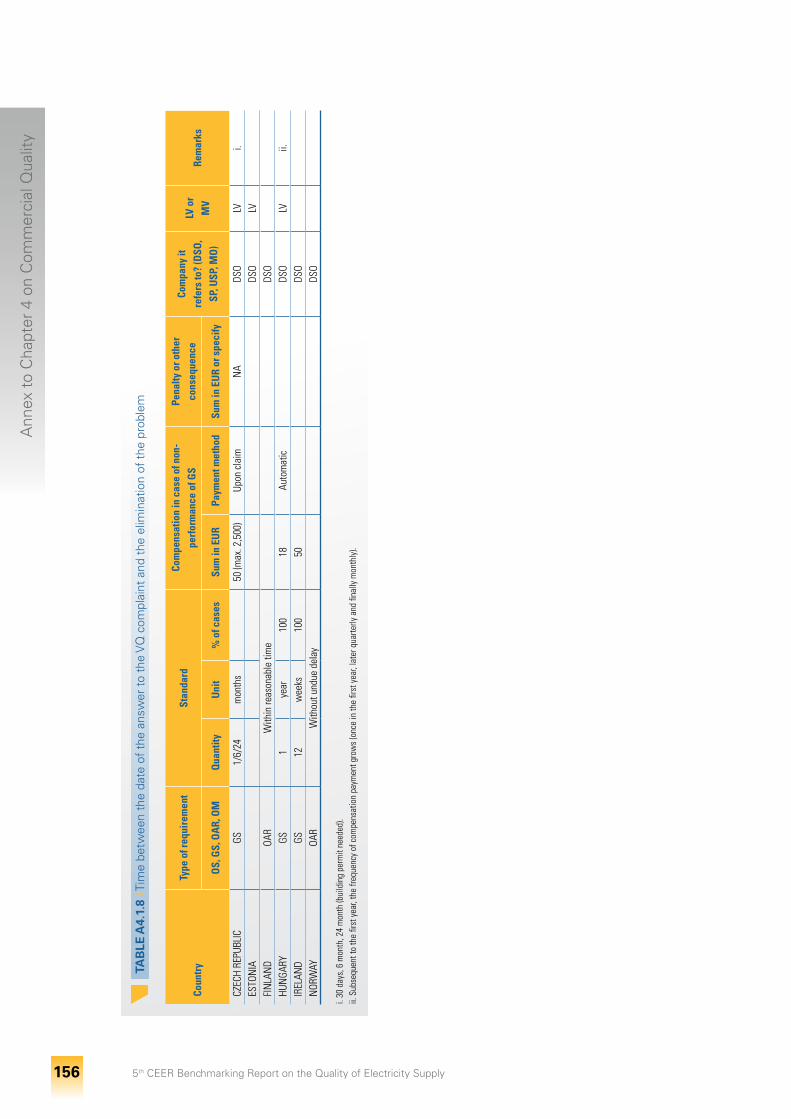
Ann
ex t
o C
hapt
er 4
on
Com
mer
cial
Qua
lity
5th CEER Benchmarking Report on the Quality of Electricity Supply 156
T
AB
LE A
4.1.
8 I T
ime
betw
een
the
date
of
the
answ
er t
o th
e V
Q c
ompl
aint
and
the
elim
inat
ion
of t
he p
robl
em
Coun
try
Type
of r
equi
rem
ent
Stan
dard
Com
pens
atio
n in
cas
e of
non
-pe
rfor
man
ce o
f GS
Pena
lty o
r oth
erco
nseq
uenc
eCo
mpa
ny it
re
fers
to?
(DSO
, SP
, USP
, MO
)
LV o
r M
VRe
mar
ks
OS,
GS,
OA
R, O
MQ
uant
ityU
nit
% o
f cas
esSu
m in
EU
RPa
ymen
t met
hod
Sum
in E
UR
or s
peci
fy
CZEC
H RE
PUBL
ICGS
1/6/
24m
onth
s
50 (m
ax. 2
,500
)Up
on c
laim
NA
DSO
LVi.
ESTO
NIA
DS
OLV
FI
NLA
ND
OAR
With
in re
ason
able
tim
e
DS
O HU
NGA
RYGS
1ye
ar10
018
Auto
mat
ic
DSO
LVii.
IREL
AND
GS12
wee
ks10
050
DSO
NOR
WAY
OAR
With
out u
ndue
del
ay
DS
O
i. 30
day
s, 6
mon
th, 2
4 m
onth
(bui
ldin
g pe
rmit
need
ed).
ii. S
ubse
quen
t to
the
first
yea
r, th
e fre
quen
cy o
f com
pens
atio
n pa
ymen
t gro
ws
(onc
e in
the
first
yea
r, la
ter q
uarte
rly a
nd fi
nally
mon
thly
).
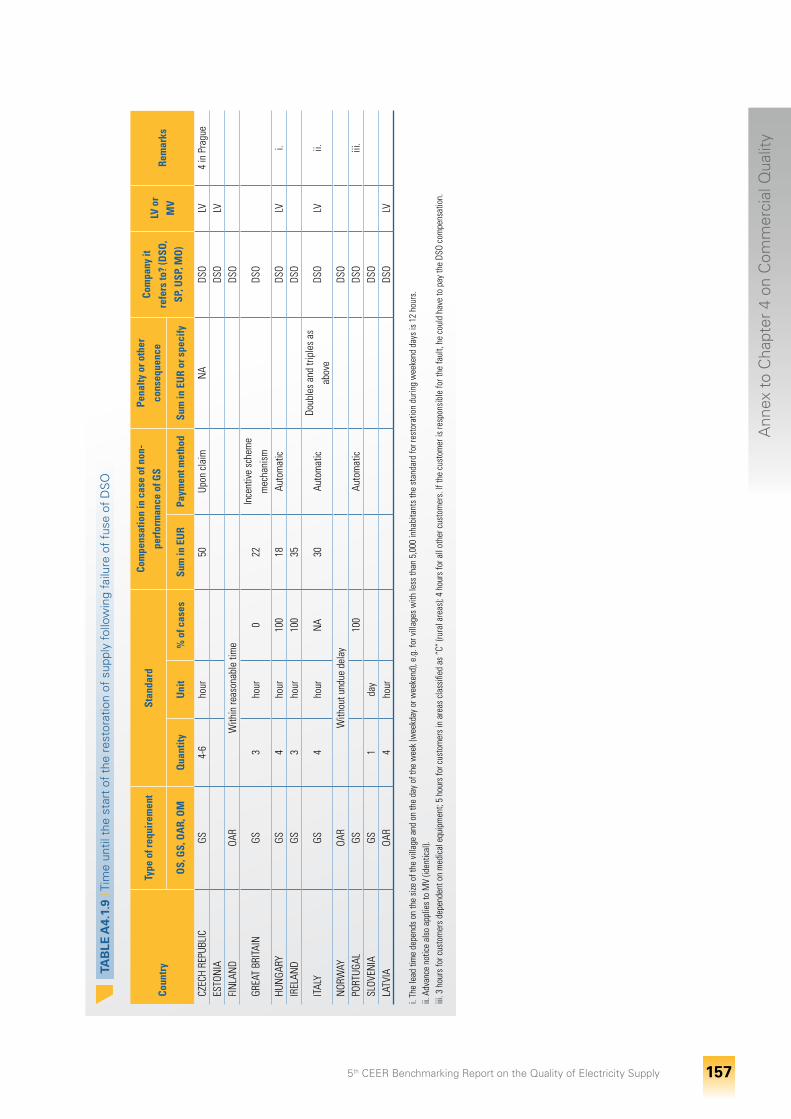
Ann
ex t
o C
hapt
er 4
on
Com
mer
cial
Qua
lity
5th CEER Benchmarking Report on the Quality of Electricity Supply 157
T
AB
LE A
4.1.
9 I T
ime
until
the
sta
rt o
f th
e re
stor
atio
n of
sup
ply
follo
win
g fa
ilure
of
fuse
of
DS
O
Coun
try
Type
of r
equi
rem
ent
Stan
dard
Com
pens
atio
n in
cas
e of
non
-pe
rfor
man
ce o
f GS
Pena
lty o
r oth
erco
nseq
uenc
eCo
mpa
ny it
re
fers
to?
(DSO
, SP
, USP
, MO
)
LV o
r M
VRe
mar
ks
OS,
GS,
OA
R, O
MQ
uant
ityU
nit
% o
f cas
esSu
m in
EU
RPa
ymen
t met
hod
Sum
in E
UR
or s
peci
fy
CZEC
H RE
PUBL
ICGS
4-6
hour
50
Upon
cla
imN
ADS
OLV
4 in
Pra
gue
ESTO
NIA
DS
OLV
FI
NLA
ND
OAR
With
in re
ason
able
tim
e
DS
O
GREA
T BR
ITAI
NGS
3ho
ur0
22In
cent
ive
sche
me
mec
hani
sm
DSO
HUN
GARY
GS4
hour
100
18Au
tom
atic
DS
OLV
i.IR
ELAN
DGS
3ho
ur10
035
DSO
ITAL
YGS
4ho
urN
A30
Auto
mat
icDo
uble
s an
d tri
ples
as
abov
eDS
OLV
ii.
NOR
WAY
OAR
With
out u
ndue
del
ay
DS
OPO
RTUG
ALGS
100
Au
tom
atic
DS
O
iii.
SLOV
ENIA
GS1
day
DSO
LATV
IAOA
R4
hour
DSO
LV
i. Th
e le
ad ti
me
depe
nds
on th
e si
ze o
f the
vill
age
and
on th
e da
y of
the
wee
k (w
eekd
ay o
r wee
kend
), e.
g. fo
r vill
ages
with
less
than
5,0
00 in
habi
tant
s th
e st
anda
rd fo
r res
tora
tion
durin
g w
eeke
nd d
ays
is 1
2 ho
urs.
ii. A
dvan
ce n
otic
e al
so a
pplie
s to
MV
(iden
tical
).iii
. 3 h
ours
for c
usto
mer
s de
pend
ent o
n m
edic
al e
quip
men
t; 5
hour
s fo
r cus
tom
ers
in a
reas
cla
ssifi
ed a
s “C
” (ru
ral a
reas
); 4
hour
s fo
r all
othe
r cus
tom
ers.
If th
e cu
stom
er is
resp
onsi
ble
for t
he fa
ult,
he c
ould
hav
e to
pay
the
DSO
com
pens
atio
n.
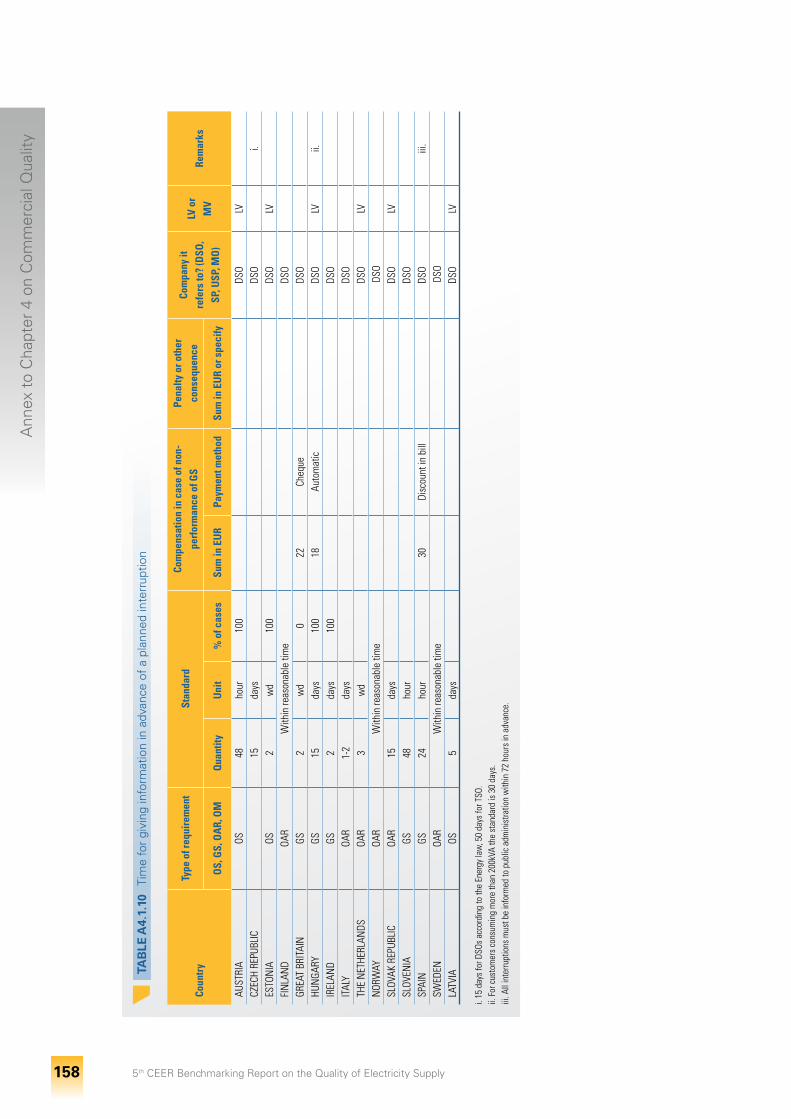
Ann
ex t
o C
hapt
er 4
on
Com
mer
cial
Qua
lity
5th CEER Benchmarking Report on the Quality of Electricity Supply 158
T
AB
LE A
4.1.
10 I
Tim
e fo
r gi
ving
info
rmat
ion
in a
dvan
ce o
f a
plan
ned
inte
rrup
tion
Coun
try
Type
of r
equi
rem
ent
Stan
dard
Com
pens
atio
n in
cas
e of
non
-pe
rfor
man
ce o
f GS
Pena
lty o
r oth
erco
nseq
uenc
eCo
mpa
ny it
re
fers
to?
(DSO
, SP
, USP
, MO
)
LV o
r M
VRe
mar
ks
OS,
GS,
OA
R, O
MQ
uant
ityU
nit
% o
f cas
esSu
m in
EU
RPa
ymen
t met
hod
Sum
in E
UR
or s
peci
fy
AUST
RIA
OS48
hour
100
DS
OLV
CZ
ECH
REPU
BLIC
15
days
DSO
i.
ESTO
NIA
OS2
wd
100
DS
OLV
FI
NLA
ND
OAR
With
in re
ason
able
tim
e
DS
O GR
EAT
BRIT
AIN
GS2
wd
022
Cheq
ue
DSO
HUN
GARY
GS15
days
100
18Au
tom
atic
DS
OLV
ii.IR
ELAN
DGS
2da
ys10
0
DSO
ITAL
YOA
R1-
2da
ys
DS
O
TH
E N
ETHE
RLAN
DSOA
R3
wd
DSO
LV
NOR
WAY
OAR
With
in re
ason
able
tim
e
D
SOSL
OVAK
REP
UBLI
COA
R15
days
DSO
LV
SLOV
ENIA
GS48
hour
DSO
SPAI
NGS
24ho
ur
30Di
scou
nt in
bill
DS
O
iii.
SWED
ENOA
RW
ithin
reas
onab
le ti
me
DSO
LATV
IAOS
5da
ys
DS
OLV
i. 15
day
s fo
r DSO
s ac
cord
ing
to th
e En
ergy
law
, 50
days
for T
SO.
ii. F
or c
usto
mer
s co
nsum
ing
mor
e th
an 2
00kV
A th
e st
anda
rd is
30
days
.iii
. All
inte
rrupt
ions
mus
t be
info
rmed
to p
ublic
adm
inis
tratio
n w
ithin
72
hour
s in
adv
ance
.
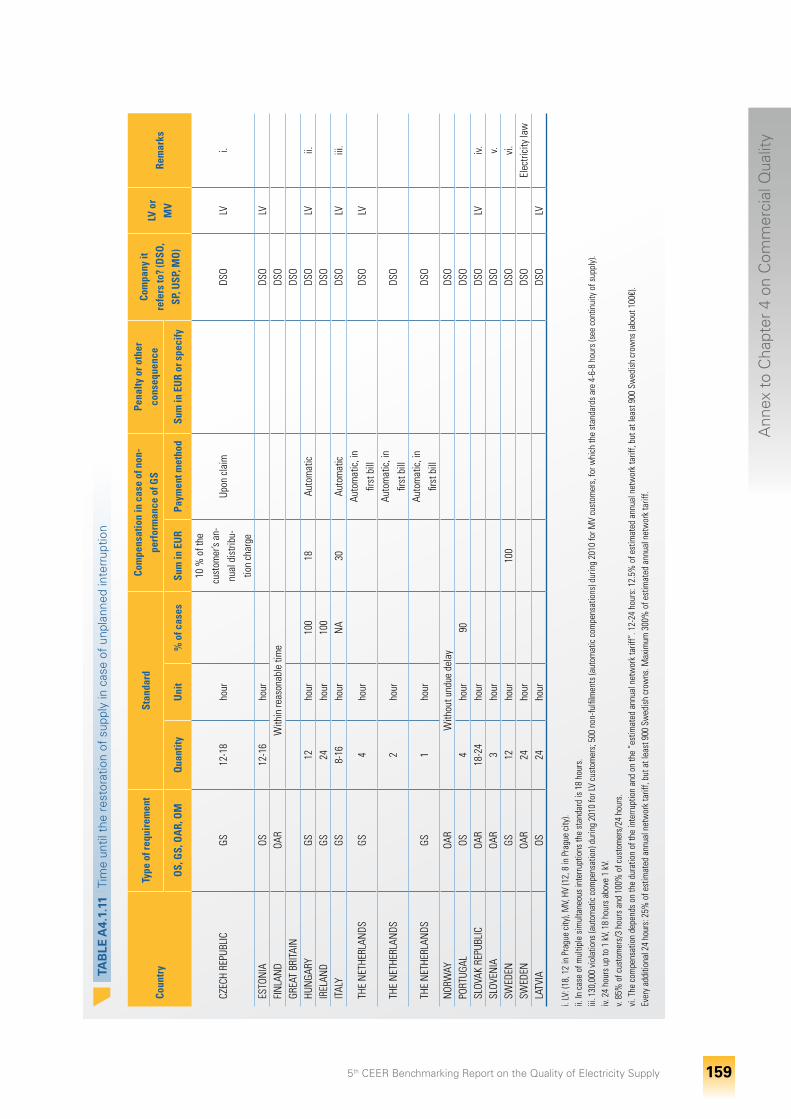
Ann
ex t
o C
hapt
er 4
on
Com
mer
cial
Qua
lity
5th CEER Benchmarking Report on the Quality of Electricity Supply 159
T
AB
LE A
4.1.
11 I
Tim
e un
til t
he r
esto
ratio
n of
sup
ply
in c
ase
of u
npla
nned
inte
rrup
tion
Coun
try
Type
of r
equi
rem
ent
Stan
dard
Com
pens
atio
n in
cas
e of
non
-pe
rfor
man
ce o
f GS
Pena
lty o
r oth
erco
nseq
uenc
eCo
mpa
ny it
re
fers
to?
(DSO
, SP
, USP
, MO
)
LV o
r M
VRe
mar
ks
OS,
GS,
OA
R, O
MQ
uant
ityU
nit
% o
f cas
esSu
m in
EU
RPa
ymen
t met
hod
Sum
in E
UR
or s
peci
fy
CZEC
H RE
PUBL
ICGS
12-1
8ho
ur
10 %
of t
he
cust
omer
’s an
-nu
al d
istri
bu-
tion
char
ge
Upon
cla
im
DSO
LVi.
ESTO
NIA
OS12
-16
hour
DSO
LV
FIN
LAN
DOA
RW
ithin
reas
onab
le ti
me
DSO
GREA
T BR
ITAI
N
DSO
HUN
GARY
GS12
hour
100
18Au
tom
atic
DS
OLV
ii.IR
ELAN
DGS
24ho
ur10
0
DSO
ITAL
YGS
8-16
hour
NA
30Au
tom
atic
DS
OLV
iii.
THE
NET
HERL
ANDS
GS4
hour
Auto
mat
ic, i
n fir
st b
ill
DSO
LV
THE
NET
HERL
ANDS
2
hour
Auto
mat
ic, i
n fir
st b
ill
DSO
THE
NET
HERL
ANDS
GS1
hour
Auto
mat
ic, i
n fir
st b
ill
DSO
NOR
WAY
OAR
With
out u
ndue
del
ay
DS
O PO
RTUG
ALOS
4ho
ur90
DS
O
SL
OVAK
REP
UBLI
COA
R18
-24
hour
DSO
LViv.
SLOV
ENIA
OAR
3ho
ur
DS
O
v.SW
EDEN
GS12
hour
10
0
DS
O
vi.
SWED
ENOA
R24
hour
DSO
El
ectri
city
law
LATV
IAOS
24ho
ur
DS
OLV
i. LV
: (18
, 12
in P
ragu
e ci
ty),
MV,
HV
(12,
8 in
Pra
gue
city
).ii.
In c
ase
of m
ultip
le s
imul
tane
ous
inte
rrupt
ions
the
stan
dard
is 1
8 ho
urs.
iii
. 130
,000
vio
latio
ns (a
utom
atic
com
pens
atio
n) d
urin
g 20
10 fo
r LV
cust
omer
s; 5
00 n
on-fu
lfilm
ents
(aut
omat
ic c
ompe
nsat
ions
) dur
ing
2010
for M
V cu
stom
ers,
for w
hich
the
stan
dard
s ar
e 4-
6-8
hour
s (s
ee c
ontin
uity
of s
uppl
y).
iv. 2
4 ho
urs
up to
1 k
V, 1
8 ho
urs
abov
e 1
kV.
v. 85
% o
f cus
tom
ers/
3 ho
urs
and
100%
of c
usto
mer
s/24
hou
rs.
vi. T
he c
ompe
nsat
ion
depe
nds
on th
e du
ratio
n of
the
inte
rrupt
ion
and
on th
e ”e
stim
ated
ann
ual n
etw
ork
tarif
f”. 1
2-24
hou
rs: 1
2.5%
of e
stim
ated
ann
ual n
etw
ork
tarif
f, bu
t at l
east
900
Sw
edis
h cr
owns
(abo
ut 1
00€)
.Ev
ery
addi
tiona
l 24
hour
s: 2
5% o
f est
imat
ed a
nnua
l net
wor
k ta
riff,
but a
t lea
st 9
00 S
wed
ish
crow
ns. M
axim
um 3
00%
of e
stim
ated
ann
ual n
etw
ork
tarif
f.
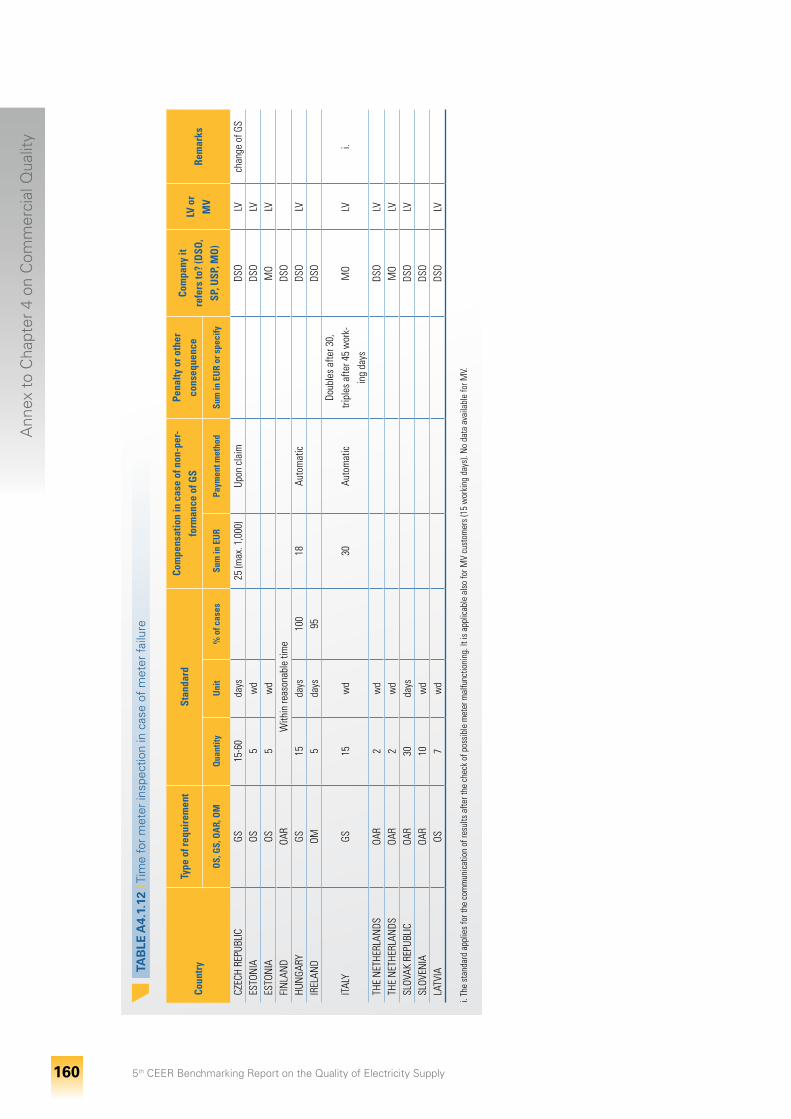
Ann
ex t
o C
hapt
er 4
on
Com
mer
cial
Qua
lity
5th CEER Benchmarking Report on the Quality of Electricity Supply 160
T
AB
LE A
4.1.
12 I
Tim
e fo
r m
eter
insp
ectio
n in
cas
e of
met
er fa
ilure
Coun
try
Type
of r
equi
rem
ent
Stan
dard
Com
pens
atio
n in
cas
e of
non
-per
-fo
rman
ce o
f GS
Pena
lty o
r oth
erco
nseq
uenc
eCo
mpa
ny it
re
fers
to?
(DSO
, SP
, USP
, MO
)
LV o
r M
VRe
mar
ks
OS,
GS,
OA
R, O
MQ
uant
ityU
nit
% o
f cas
esSu
m in
EU
RPa
ymen
t met
hod
Sum
in E
UR
or s
peci
fy
CZEC
H RE
PUBL
ICGS
15-6
0da
ys
25 (m
ax. 1
,000
)Up
on c
laim
DS
OLV
chan
ge o
f GS
ESTO
NIA
OS5
wd
DSO
LV
ESTO
NIA
OS5
wd
MO
LV
FIN
LAN
DOA
RW
ithin
reas
onab
le ti
me
DSO
HUN
GARY
GS15
days
100
18Au
tom
atic
DS
OLV
IR
ELAN
DOM
5da
ys95
DS
O
ITAL
YGS
15w
d
30Au
tom
atic
Doub
les
afte
r 30,
tri
ples
afte
r 45
wor
k-in
g da
ysM
OLV
i.
THE
NET
HERL
ANDS
OAR
2w
d
DS
OLV
TH
E N
ETHE
RLAN
DSOA
R2
wd
MO
LV
SLOV
AK R
EPUB
LIC
OAR
30da
ys
DS
OLV
SL
OVEN
IAOA
R10
wd
DSO
LATV
IAOS
7w
d
DS
OLV
i. Th
e st
anda
rd a
pplie
s fo
r the
com
mun
icat
ion
of re
sults
afte
r the
che
ck o
f pos
sibl
e m
eter
mal
func
tioni
ng. I
t is
appl
icab
le a
lso
for M
V cu
stom
ers
(15
wor
king
day
s). N
o da
ta a
vaila
ble
for M
V.
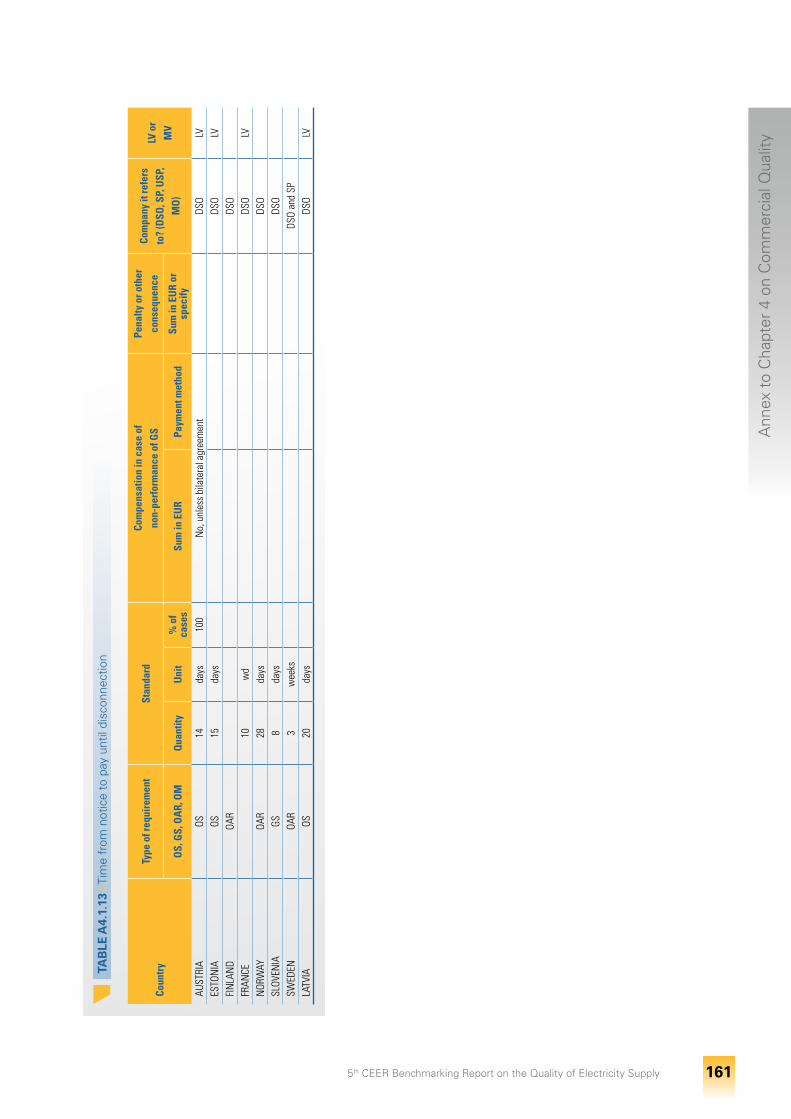
Ann
ex t
o C
hapt
er 4
on
Com
mer
cial
Qua
lity
5th CEER Benchmarking Report on the Quality of Electricity Supply 161
T
AB
LE A
4.1.
13 I
Tim
e fr
om n
otic
e to
pay
unt
il di
scon
nect
ion
Coun
try
Type
of r
equi
rem
ent
Stan
dard
Com
pens
atio
n in
cas
e of
non-
perf
orm
ance
of G
SPe
nalty
or o
ther
cons
eque
nce
Com
pany
it re
fers
to
? (D
SO, S
P, U
SP,
MO
)
LV o
r M
VO
S, G
S, O
AR,
OM
Qua
ntity
Uni
t%
of
case
sSu
m in
EU
RPa
ymen
t met
hod
Sum
in E
UR
or
spec
ifyAU
STRI
AOS
14da
ys10
0N
o, u
nles
s bi
late
ral a
gree
men
tDS
OLV
ESTO
NIA
OS15
days
DSO
LVFI
NLA
ND
OAR
DSO
FR
ANCE
10
wd
DSO
LVN
ORW
AYOA
R28
days
DSO
SL
OVEN
IAGS
8da
ys
DS
O
SWED
ENOA
R3
wee
ks
DS
O an
d SP
LA
TVIA
OS20
days
DSO
LV
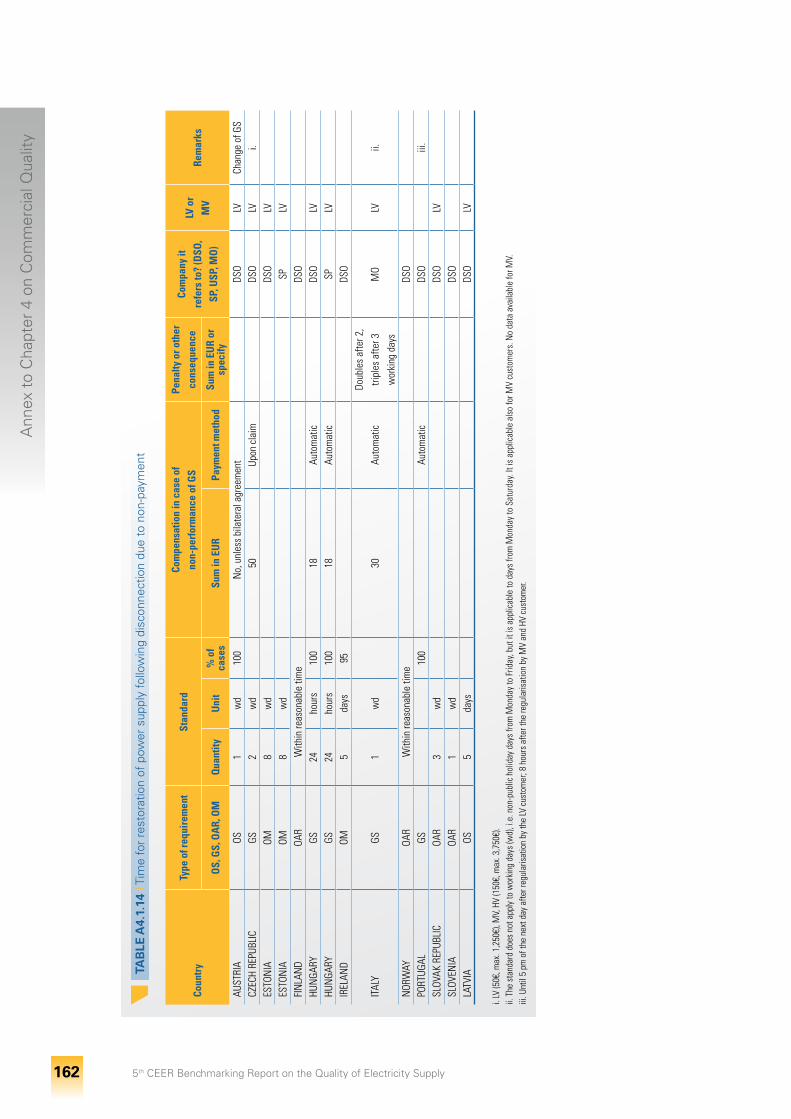
Ann
ex t
o C
hapt
er 4
on
Com
mer
cial
Qua
lity
5th CEER Benchmarking Report on the Quality of Electricity Supply 162
T
AB
LE A
4.1.
14 I
Tim
e fo
r re
stor
atio
n of
pow
er s
uppl
y fo
llow
ing
disc
onne
ctio
n du
e to
non
-pay
men
t
Coun
try
Type
of r
equi
rem
ent
Stan
dard
Com
pens
atio
n in
cas
e of
non-
perf
orm
ance
of G
SPe
nalty
or o
ther
cons
eque
nce
Com
pany
it
refe
rs to
? (D
SO,
SP, U
SP, M
O)
LV o
r M
VRe
mar
ks
OS,
GS,
OA
R, O
MQ
uant
ityU
nit
% o
f ca
ses
Sum
in E
UR
Paym
ent m
etho
dSu
m in
EU
R or
sp
ecify
AUST
RIA
OS1
wd
100
No,
unl
ess
bila
tera
l agr
eem
ent
DSO
LVCh
ange
of G
SCZ
ECH
REPU
BLIC
GS2
wd
50
Upon
cla
im
DSO
LVi.
ESTO
NIA
OM8
wd
DSO
LV
ESTO
NIA
OM8
wd
SPLV
FI
NLA
ND
OAR
With
in re
ason
able
tim
e
DS
OHU
NGA
RYGS
24ho
urs
100
18Au
tom
atic
DS
OLV
HU
NGA
RYGS
24ho
urs
100
18Au
tom
atic
SP
LV
IREL
AND
OM5
days
95
DSO
ITAL
YGS
1w
d
30Au
tom
atic
Doub
les
afte
r 2,
tripl
es a
fter 3
wor
king
day
sM
OLV
ii.
NOR
WAY
OAR
With
in re
ason
able
tim
e
DS
OPO
RTUG
ALGS
100
Au
tom
atic
DS
O
iii.
SLOV
AK R
EPUB
LIC
OAR
3w
d
DS
OLV
SL
OVEN
IAOA
R1
wd
DSO
LATV
IAOS
5da
ys
DS
OLV
i. LV
(50€
, max
. 1,2
50€)
, MV,
HV
(150
€, m
ax. 3
,750
€).
ii. T
he s
tand
ard
does
not
app
ly to
wor
king
day
s (w
d), i
.e. n
on-p
ublic
hol
iday
day
s fro
m M
onda
y to
Frid
ay, b
ut it
is a
pplic
able
to d
ays
from
Mon
day
to S
atur
day.
It is
app
licab
le a
lso
for M
V cu
stom
ers.
No
data
ava
ilabl
e fo
r MV.
iii. U
ntil
5 pm
of t
he n
ext d
ay a
fter r
egul
aris
atio
n by
the
LV c
usto
mer
; 8 h
ours
afte
r the
regu
laris
atio
n by
MV
and
HV c
usto
mer
.
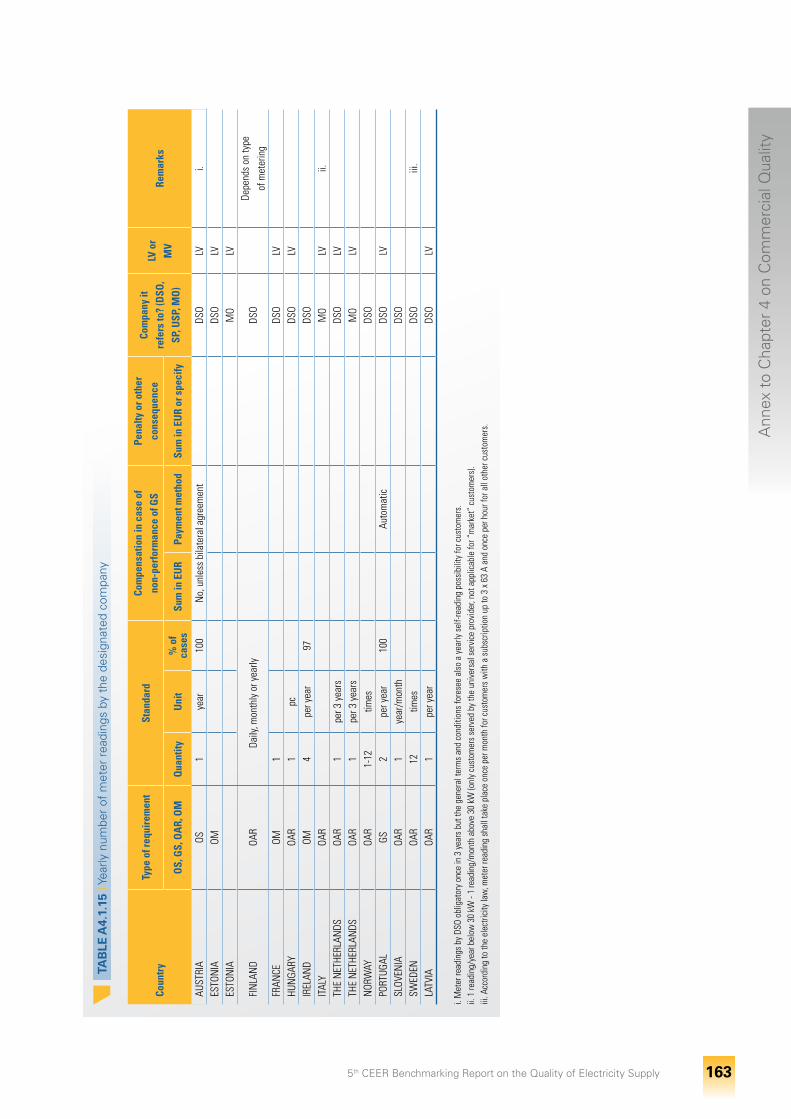
Ann
ex t
o C
hapt
er 4
on
Com
mer
cial
Qua
lity
5th CEER Benchmarking Report on the Quality of Electricity Supply 163
T
AB
LE A
4.1.
15 I
Year
ly n
umbe
r of
met
er r
eadi
ngs
by t
he d
esig
nate
d co
mpa
ny
Coun
try
Type
of r
equi
rem
ent
Stan
dard
Com
pens
atio
n in
cas
e of
non-
perf
orm
ance
of G
SPe
nalty
or o
ther
cons
eque
nce
Com
pany
it
refe
rs to
? (D
SO,
SP, U
SP, M
O)
LV o
r M
VRe
mar
ks
OS,
GS,
OA
R, O
MQ
uant
ityU
nit
% o
f ca
ses
Sum
in E
UR
Paym
ent m
etho
dSu
m in
EU
R or
spe
cify
AUST
RIA
OS1
year
100
No,
unl
ess
bila
tera
l agr
eem
ent
DSO
LVi.
ESTO
NIA
OM
DS
OLV
ES
TON
IA
MO
LV
FIN
LAN
DOA
RDa
ily, m
onth
ly o
r yea
rly
DS
ODe
pend
s on
type
of m
eter
ing
FRAN
CEOM
1
DSO
LV
HUN
GARY
OAR
1pc
DSO
LV
IREL
AND
OM4
per y
ear
97
DSO
ITAL
YOA
R
M
OLV
ii.TH
E N
ETHE
RLAN
DSOA
R1
per 3
yea
rs
DS
OLV
TH
E N
ETHE
RLAN
DSOA
R1
per 3
yea
rs
M
OLV
N
ORW
AYOA
R1-
12tim
es
DS
O
PO
RTUG
ALGS
2pe
r yea
r10
0
Auto
mat
ic
DSO
LV
SLOV
ENIA
OAR
1ye
ar/m
onth
DSO
SWED
ENOA
R12
times
DSO
iii
.LA
TVIA
OAR
1pe
r yea
r
DS
OLV
i. M
eter
read
ings
by
DSO
oblig
ator
y on
ce in
3 y
ears
but
the
gene
ral t
erm
s an
d co
nditi
ons
fore
see
also
a y
early
sel
f-rea
ding
pos
sibi
lity
for c
usto
mer
s.ii.
1 re
adin
g/ye
ar b
elow
30
kW -
1 re
adin
g/m
onth
abo
ve 3
0 kW
(onl
y cu
stom
ers
serv
ed b
y th
e un
iver
sal s
ervi
ce p
rovi
der,
not a
pplic
able
for “
mar
ket”
cus
tom
ers)
.iii
. Acc
ordi
ng to
the
elec
trici
ty la
w, m
eter
read
ing
shal
l tak
e pl
ace
once
per
mon
th fo
r cus
tom
ers
with
a s
ubsc
riptio
n up
to 3
x 6
3 A
and
once
per
hou
r for
all
othe
r cus
tom
ers.
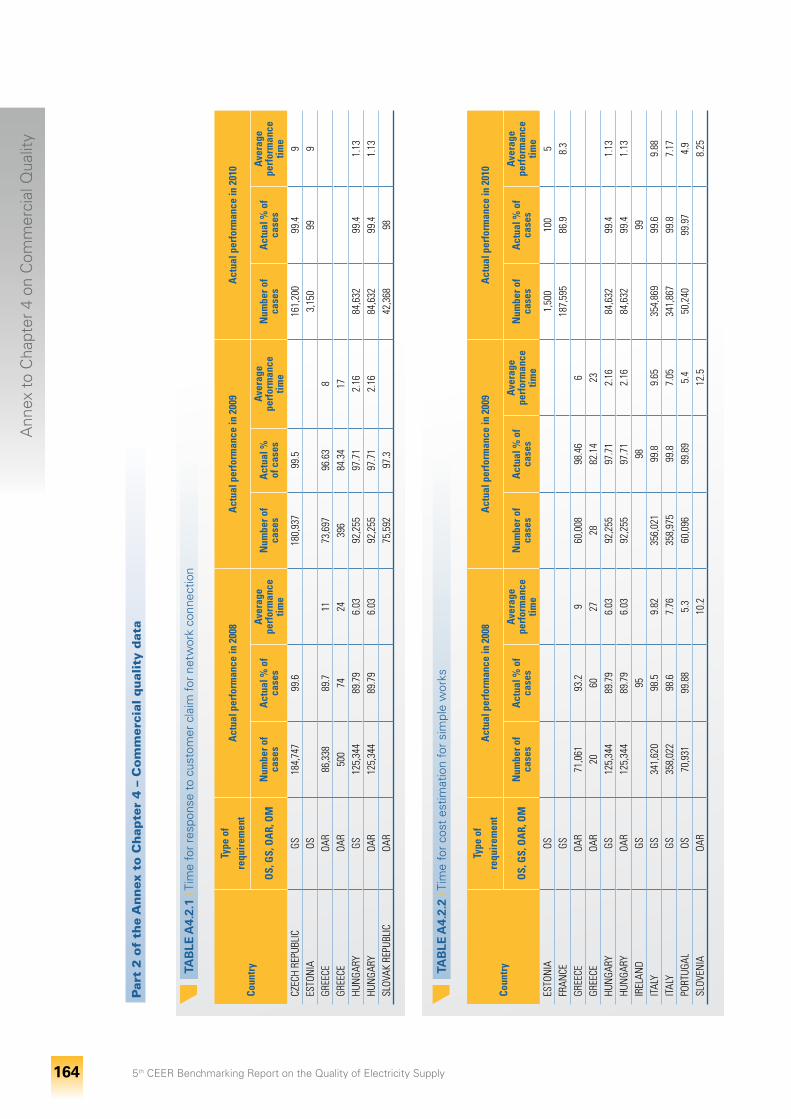
Ann
ex t
o C
hapt
er 4
on
Com
mer
cial
Qua
lity
5th CEER Benchmarking Report on the Quality of Electricity Supply 164
T
AB
LE A
4.2.
1 I T
ime
for
resp
onse
to
cust
omer
cla
im fo
r ne
twor
k co
nnec
tion
Coun
try
Type
of
requ
irem
ent
Act
ual p
erfo
rman
ce in
200
8A
ctua
l per
form
ance
in 2
009
Act
ual p
erfo
rman
ce in
201
0
OS,
GS,
OA
R, O
MN
umbe
r of
case
sA
ctua
l % o
f ca
ses
Aver
age
perf
orm
ance
tim
eN
umbe
r of
case
sA
ctua
l %
of c
ases
Aver
age
perf
orm
ance
tim
eN
umbe
r of
case
sA
ctua
l % o
f ca
ses
Aver
age
perf
orm
ance
tim
eCZ
ECH
REPU
BLIC
GS18
4,74
799
.6
180,
937
99.5
16
1,20
099
.49
ESTO
NIA
OS
3,
150
999
GREE
CEOA
R86
,338
89.7
1173
,697
96.6
38
GR
EECE
OAR
500
7424
396
84.3
417
HU
NGA
RYGS
125,
344
89.7
96.
0392
,255
97.7
12.
1684
,632
99.4
1.13
HUN
GARY
OAR
125,
344
89.7
96.
0392
,255
97.7
12.
1684
,632
99.4
1.13
SLOV
AK R
EPUB
LIC
OAR
75
,592
97.3
42
,368
98
T
AB
LE A
4.2.
2 I T
ime
for
cost
est
imat
ion
for
sim
ple
wor
ks
Coun
try
Type
of
requ
irem
ent
Act
ual p
erfo
rman
ce in
200
8A
ctua
l per
form
ance
in 2
009
Act
ual p
erfo
rman
ce in
201
0
OS,
GS,
OA
R, O
MN
umbe
r of
case
sA
ctua
l % o
f ca
ses
Aver
age
perf
orm
ance
tim
eN
umbe
r of
case
sA
ctua
l % o
f ca
ses
Aver
age
perf
orm
ance
tim
eN
umbe
r of
case
sA
ctua
l % o
f ca
ses
Aver
age
perf
orm
ance
tim
eES
TON
IAOS
1,50
010
05
FRAN
CEGS
187,
595
86.9
8.3
GREE
CEOA
R71
,061
93.2
960
,008
98.4
66
GR
EECE
OAR
2060
2728
82.1
423
HU
NGA
RYGS
125,
344
89.7
96.
0392
,255
97.7
12.
1684
,632
99.4
1.13
HUN
GARY
OAR
125,
344
89.7
96.
0392
,255
97.7
12.
1684
,632
99.4
1.13
IREL
AND
GS
95
98
99
ITAL
YGS
341,
620
98.5
9.82
356,
021
99.8
9.65
354,
869
99.6
9.88
ITAL
YGS
358,
022
98.6
7.76
358,
975
99.8
7.05
341,
867
99.8
7.17
PORT
UGAL
OS70
,931
99.8
85.
360
,096
99.8
95.
450
,240
99.9
74.
9SL
OVEN
IAOA
R
10
.2
12
.5
8.
25
Par
t 2
of
the
An
nex
to
Ch
apte
r 4
– C
om
mer
cial
qu
alit
y d
ata
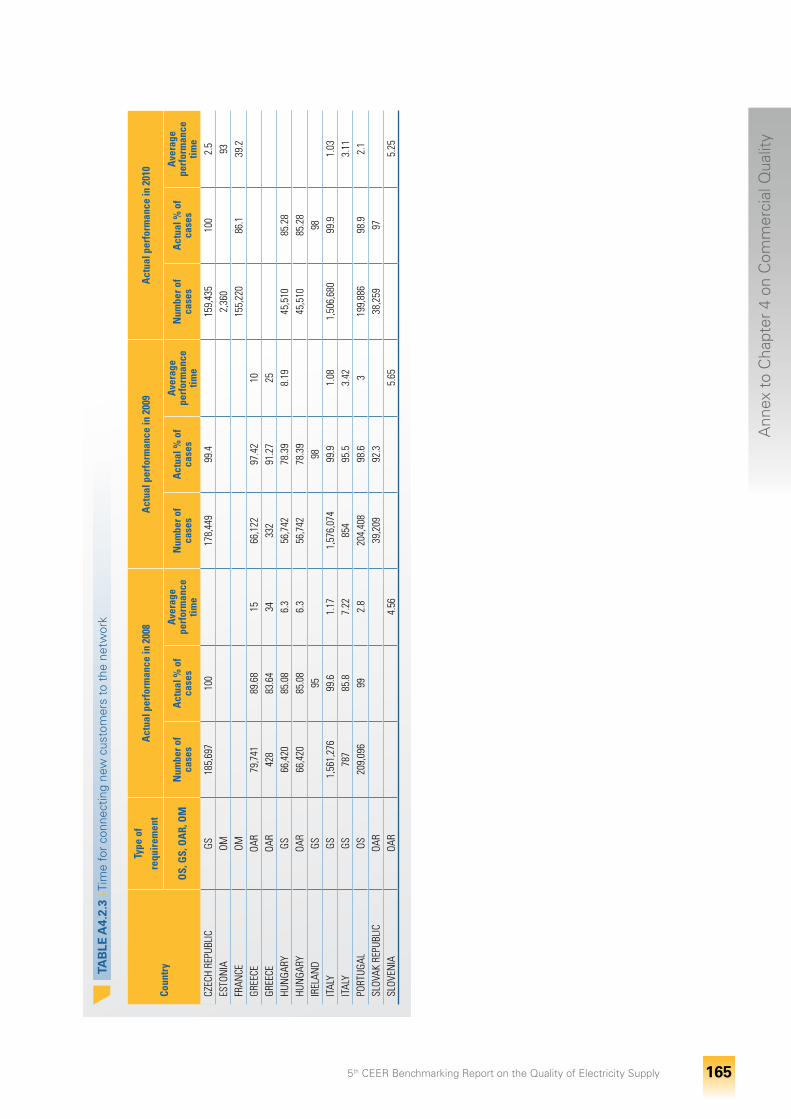
Ann
ex t
o C
hapt
er 4
on
Com
mer
cial
Qua
lity
5th CEER Benchmarking Report on the Quality of Electricity Supply 165
T
AB
LE A
4.2.
3 I T
ime
for
conn
ectin
g ne
w c
usto
mer
s to
the
net
wor
k
Coun
try
Type
of
requ
irem
ent
Act
ual p
erfo
rman
ce in
200
8A
ctua
l per
form
ance
in 2
009
Act
ual p
erfo
rman
ce in
201
0
OS,
GS,
OA
R, O
MN
umbe
r of
case
sA
ctua
l % o
f ca
ses
Aver
age
perf
orm
ance
tim
eN
umbe
r of
case
sA
ctua
l % o
f ca
ses
Aver
age
perf
orm
ance
tim
eN
umbe
r of
case
sA
ctua
l % o
f ca
ses
Aver
age
perf
orm
ance
tim
eCZ
ECH
REPU
BLIC
GS18
5,69
710
0
178,
449
99.4
15
9,43
510
02.
5ES
TON
IAOM
2,36
0
93FR
ANCE
OM
15
5,22
086
.139
.2GR
EECE
OAR
79,7
4189
.68
1566
,122
97.4
210
GR
EECE
OAR
428
83.6
434
332
91.2
725
HU
NGA
RYGS
66,4
2085
.08
6.3
56,7
4278
.39
8.19
45,5
1085
.28
HU
NGA
RYOA
R66
,420
85.0
86.
356
,742
78.3
9
45,5
1085
.28
IR
ELAN
DGS
95
98
98
IT
ALY
GS1,
561,
276
99.6
1.17
1,57
6,07
499
.91.
081,
506,
680
99.9
1.03
ITAL
YGS
787
85.8
7.22
854
95.5
3.42
3.11
PORT
UGAL
OS20
9,09
699
2.8
204,
408
98.6
319
9,88
698
.92.
1SL
OVAK
REP
UBLI
COA
R
39,2
0992
.3
38,2
5997
SL
OVEN
IAOA
R
4.
56
5.
65
5.
25
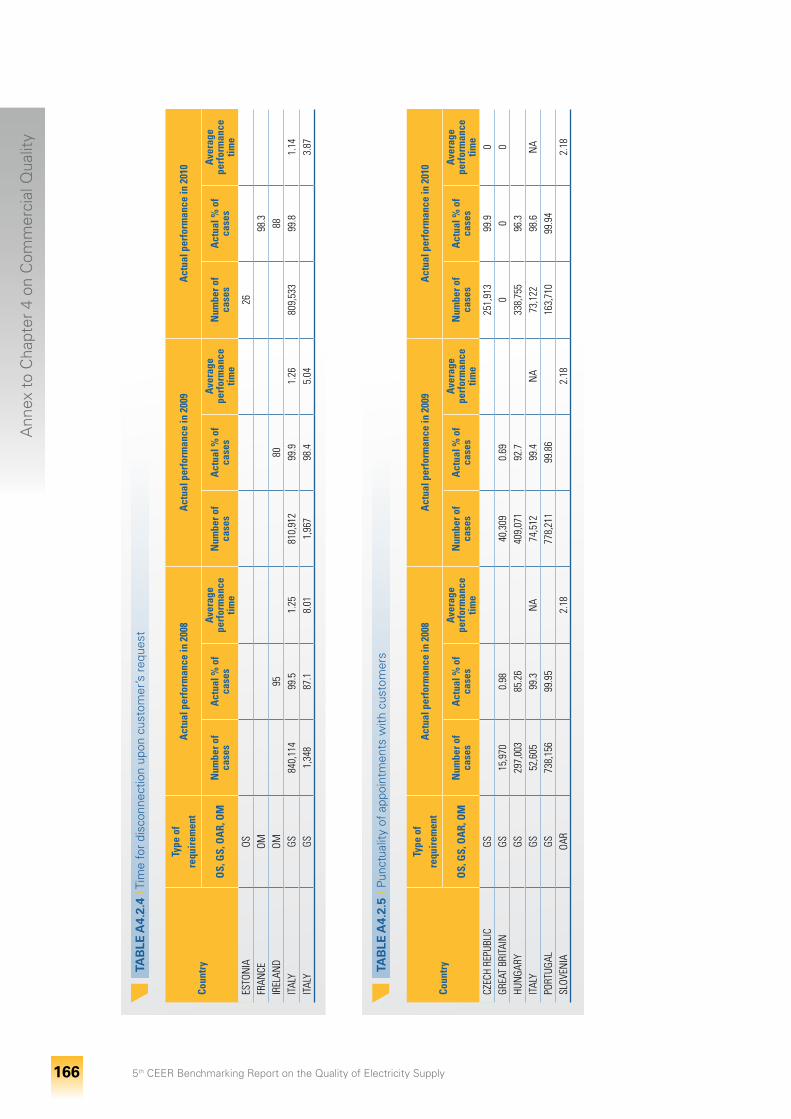
Ann
ex t
o C
hapt
er 4
on
Com
mer
cial
Qua
lity
5th CEER Benchmarking Report on the Quality of Electricity Supply 166
T
AB
LE A
4.2.
4 I T
ime
for
disc
onne
ctio
n up
on c
usto
mer
’s r
eque
st
Coun
try
Type
of
requ
irem
ent
Act
ual p
erfo
rman
ce in
200
8A
ctua
l per
form
ance
in 2
009
Act
ual p
erfo
rman
ce in
201
0
OS,
GS,
OA
R, O
MN
umbe
r of
case
sA
ctua
l % o
f ca
ses
Aver
age
perf
orm
ance
tim
eN
umbe
r of
case
sA
ctua
l % o
f ca
ses
Aver
age
perf
orm
ance
tim
eN
umbe
r of
case
sA
ctua
l % o
f ca
ses
Aver
age
perf
orm
ance
tim
eES
TON
IAOS
26
FR
ANCE
OM
98.3
IR
ELAN
DOM
95
80
88
IT
ALY
GS84
0,11
499
.51.
2581
0,91
299
.91.
2680
9,53
399
.81.
14IT
ALY
GS1,
348
87.1
8.01
1,96
798
.45.
04
3.
87
T
AB
LE A
4.2.
5 I P
unct
ualit
y of
app
oint
men
ts w
ith c
usto
mer
s
Coun
try
Type
of
requ
irem
ent
Act
ual p
erfo
rman
ce in
200
8A
ctua
l per
form
ance
in 2
009
Act
ual p
erfo
rman
ce in
201
0
OS,
GS,
OA
R, O
MN
umbe
r of
case
sA
ctua
l % o
f ca
ses
Aver
age
perf
orm
ance
tim
eN
umbe
r of
case
sA
ctua
l % o
f ca
ses
Aver
age
perf
orm
ance
tim
eN
umbe
r of
case
sA
ctua
l % o
f ca
ses
Aver
age
perf
orm
ance
tim
eCZ
ECH
REPU
BLIC
GS
25
1,91
399
.90
GREA
T BR
ITAI
NGS
15,9
700.
98
40,3
090.
69
00
0HU
NGA
RYGS
297,
003
85.2
6
409,
071
92.7
33
8,75
596
.3
ITAL
YGS
52,6
0599
.3N
A74
,512
99.4
NA
73,1
2298
.6N
APO
RTUG
ALGS
738,
156
99.9
5
778,
211
99.8
6
163,
710
99.9
4
SLOV
ENIA
OAR
2.18
2.18
2.18
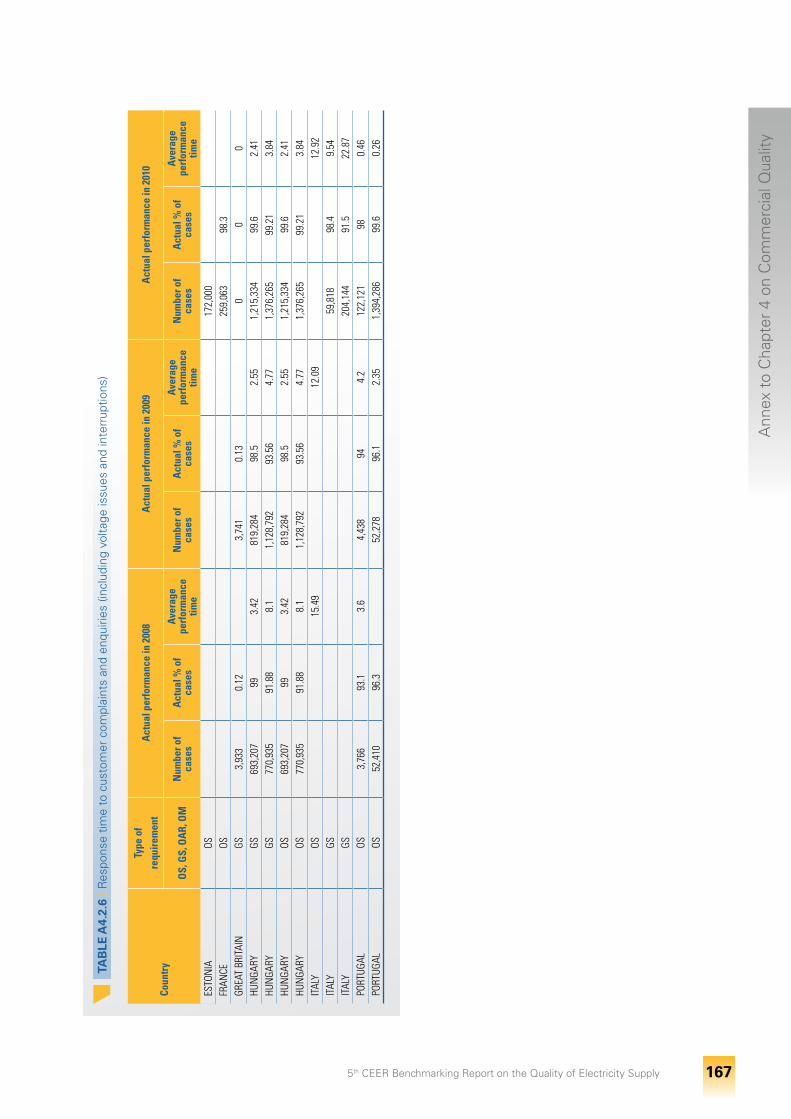
Ann
ex t
o C
hapt
er 4
on
Com
mer
cial
Qua
lity
5th CEER Benchmarking Report on the Quality of Electricity Supply 167
T
AB
LE A
4.2.
6 I R
espo
nse
time
to c
usto
mer
com
plai
nts
and
enqu
iries
(inc
ludi
ng v
olta
ge is
sues
and
inte
rrup
tions
)
Coun
try
Type
of
requ
irem
ent
Act
ual p
erfo
rman
ce in
200
8A
ctua
l per
form
ance
in 2
009
Act
ual p
erfo
rman
ce in
201
0
OS,
GS,
OA
R, O
MN
umbe
r of
case
sA
ctua
l % o
f ca
ses
Aver
age
perf
orm
ance
tim
eN
umbe
r of
case
sA
ctua
l % o
f ca
ses
Aver
age
perf
orm
ance
tim
eN
umbe
r of
case
sA
ctua
l % o
f ca
ses
Aver
age
perf
orm
ance
tim
eES
TON
IAOS
172,
000
FRAN
CEOS
259,
063
98.3
GR
EAT
BRIT
AIN
GS3,
933
0.12
3,
741
0.13
0
00
HUN
GARY
GS69
3,20
799
3.42
819,
284
98.5
2.55
1,21
5,33
499
.62.
41HU
NGA
RYGS
770,
935
91.8
88.
11,
128,
792
93.5
64.
771,
376,
265
99.2
13.
84HU
NGA
RYOS
693,
207
993.
4281
9,28
498
.52.
551,
215,
334
99.6
2.41
HUN
GARY
OS77
0,93
591
.88
8.1
1,12
8,79
293
.56
4.77
1,37
6,26
599
.21
3.84
ITAL
YOS
15.4
9
12
.09
12.9
2IT
ALY
GS
59
,818
98.4
9.54
ITAL
YGS
204,
144
91.5
22.8
7PO
RTUG
ALOS
3,76
693
.13.
64,
438
944.
212
2,12
198
0.46
PORT
UGAL
OS52
,410
96.3
52
,278
96.1
2.35
1,39
4,28
699
.60.
26
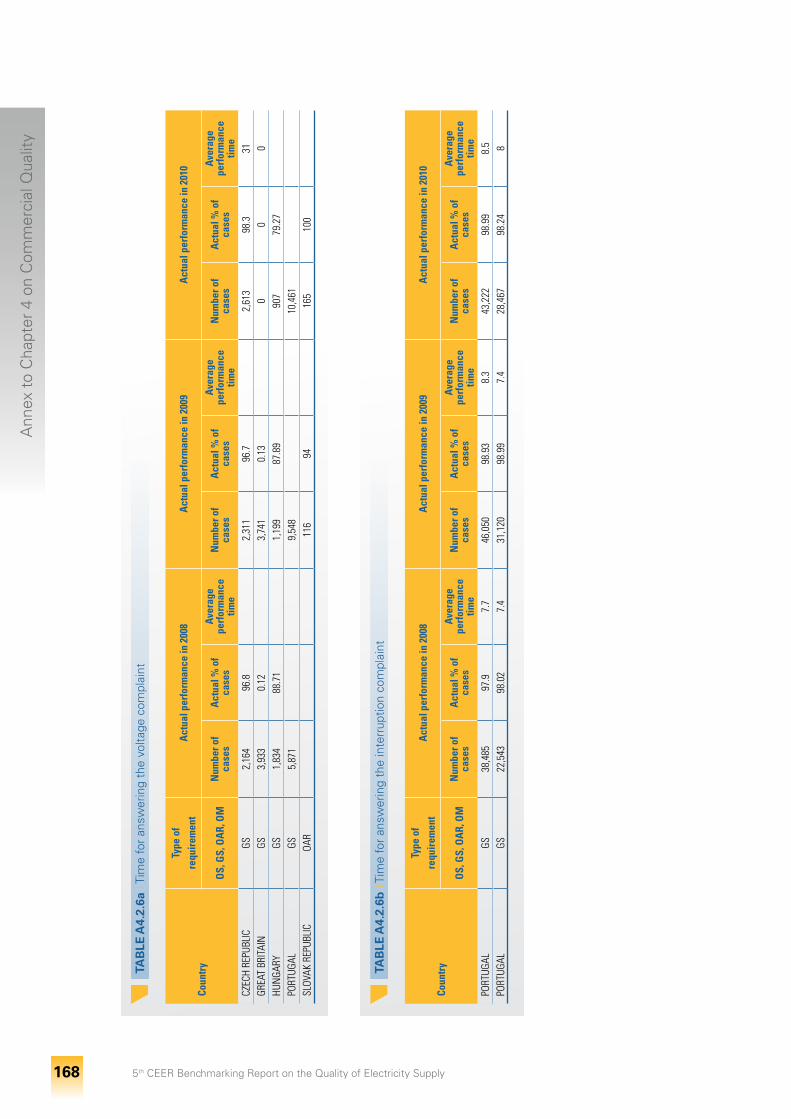
Ann
ex t
o C
hapt
er 4
on
Com
mer
cial
Qua
lity
5th CEER Benchmarking Report on the Quality of Electricity Supply 168
T
AB
LE A
4.2.
6a I
Tim
e fo
r an
swer
ing
the
volta
ge c
ompl
aint
Coun
try
Type
of
requ
irem
ent
Act
ual p
erfo
rman
ce in
200
8A
ctua
l per
form
ance
in 2
009
Act
ual p
erfo
rman
ce in
201
0
OS,
GS,
OA
R, O
MN
umbe
r of
case
sA
ctua
l % o
f ca
ses
Aver
age
perf
orm
ance
tim
eN
umbe
r of
case
sA
ctua
l % o
f ca
ses
Aver
age
perf
orm
ance
tim
eN
umbe
r of
case
sA
ctua
l % o
f ca
ses
Aver
age
perf
orm
ance
tim
eCZ
ECH
REPU
BLIC
GS2,
164
96.8
2,
311
96.7
2,
613
98.3
31GR
EAT
BRIT
AIN
GS3,
933
0.12
3,
741
0.13
0
00
HUN
GARY
GS1,
834
88.7
1
1,19
987
.89
90
779
.27
PO
RTUG
ALGS
5,87
1
9,
548
10,4
61
SL
OVAK
REP
UBLI
COA
R
116
94
165
100
T
AB
LE A
4.2.
6b I
Tim
e fo
r an
swer
ing
the
inte
rrup
tion
com
plai
nt
Coun
try
Type
of
requ
irem
ent
Act
ual p
erfo
rman
ce in
200
8A
ctua
l per
form
ance
in 2
009
Act
ual p
erfo
rman
ce in
201
0
OS,
GS,
OA
R, O
MN
umbe
r of
case
sA
ctua
l % o
f ca
ses
Aver
age
perf
orm
ance
tim
eN
umbe
r of
case
sA
ctua
l % o
f ca
ses
Aver
age
perf
orm
ance
tim
eN
umbe
r of
case
sA
ctua
l % o
f ca
ses
Aver
age
perf
orm
ance
tim
ePO
RTUG
ALGS
38,4
8597
.97.
746
,050
98.9
38.
343
,222
98.9
98.
5PO
RTUG
ALGS
22,5
4398
.02
7.4
31,1
2098
.99
7.4
28,4
6798
.24
8
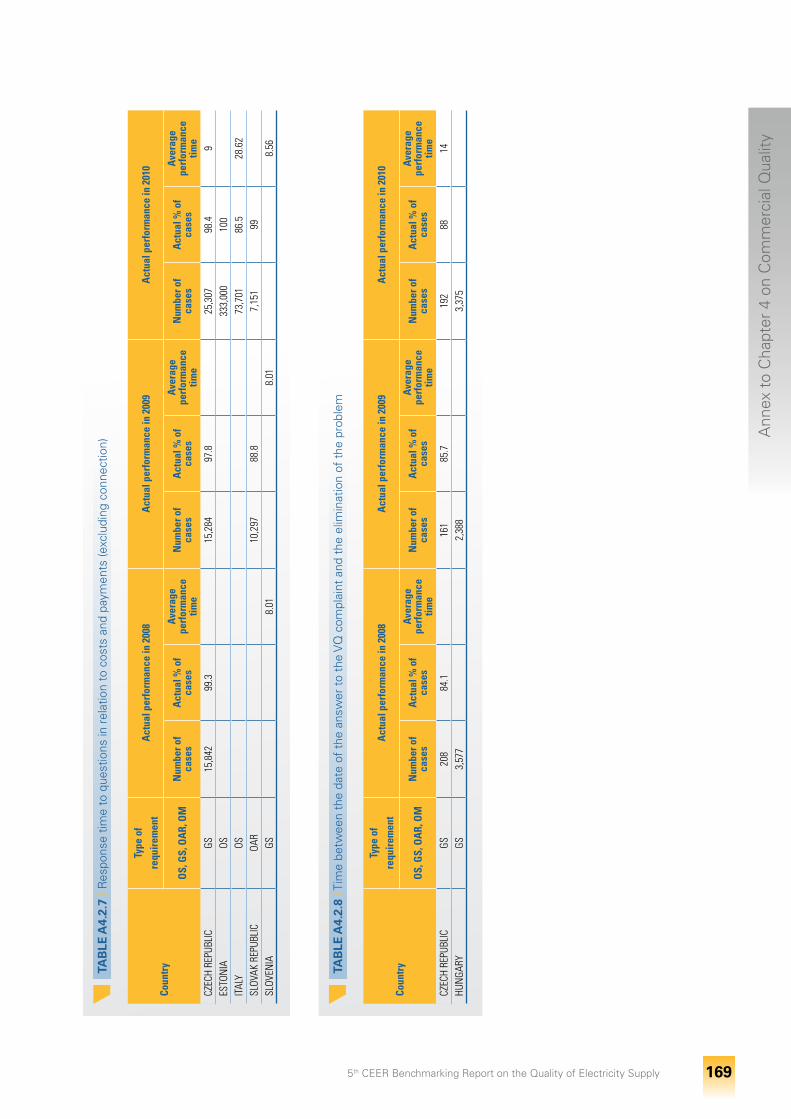
Ann
ex t
o C
hapt
er 4
on
Com
mer
cial
Qua
lity
5th CEER Benchmarking Report on the Quality of Electricity Supply 169
T
AB
LE A
4.2.
7 I R
espo
nse
time
to q
uest
ions
in r
elat
ion
to c
osts
and
pay
men
ts (e
xclu
ding
con
nect
ion)
Coun
try
Type
of
requ
irem
ent
Act
ual p
erfo
rman
ce in
200
8A
ctua
l per
form
ance
in 2
009
Act
ual p
erfo
rman
ce in
201
0
OS,
GS,
OA
R, O
MN
umbe
r of
case
sA
ctua
l % o
f ca
ses
Aver
age
perf
orm
ance
tim
eN
umbe
r of
case
sA
ctua
l % o
f ca
ses
Aver
age
perf
orm
ance
tim
eN
umbe
r of
case
sA
ctua
l % o
f ca
ses
Aver
age
perf
orm
ance
tim
eCZ
ECH
REPU
BLIC
GS15
,842
99.3
15
,284
97.8
25
,307
98.4
9ES
TON
IAOS
333,
000
100
IT
ALY
OS
73
,701
86.5
28.6
2SL
OVAK
REP
UBLI
COA
R
10,2
9788
.8
7,15
199
SL
OVEN
IAGS
8.01
8.01
8.56
T
AB
LE A
4.2.
8 I T
ime
betw
een
the
date
of
the
answ
er t
o th
e V
Q c
ompl
aint
and
the
elim
inat
ion
of t
he p
robl
em
Coun
try
Type
of
requ
irem
ent
Act
ual p
erfo
rman
ce in
200
8A
ctua
l per
form
ance
in 2
009
Act
ual p
erfo
rman
ce in
201
0
OS,
GS,
OA
R, O
MN
umbe
r of
case
sA
ctua
l % o
f ca
ses
Aver
age
perf
orm
ance
tim
eN
umbe
r of
case
sA
ctua
l % o
f ca
ses
Aver
age
perf
orm
ance
tim
eN
umbe
r of
case
sA
ctua
l % o
f ca
ses
Aver
age
perf
orm
ance
tim
eCZ
ECH
REPU
BLIC
GS20
884
.1
161
85.7
19
288
14HU
NGA
RYGS
3,57
7
2,
388
3,37
5
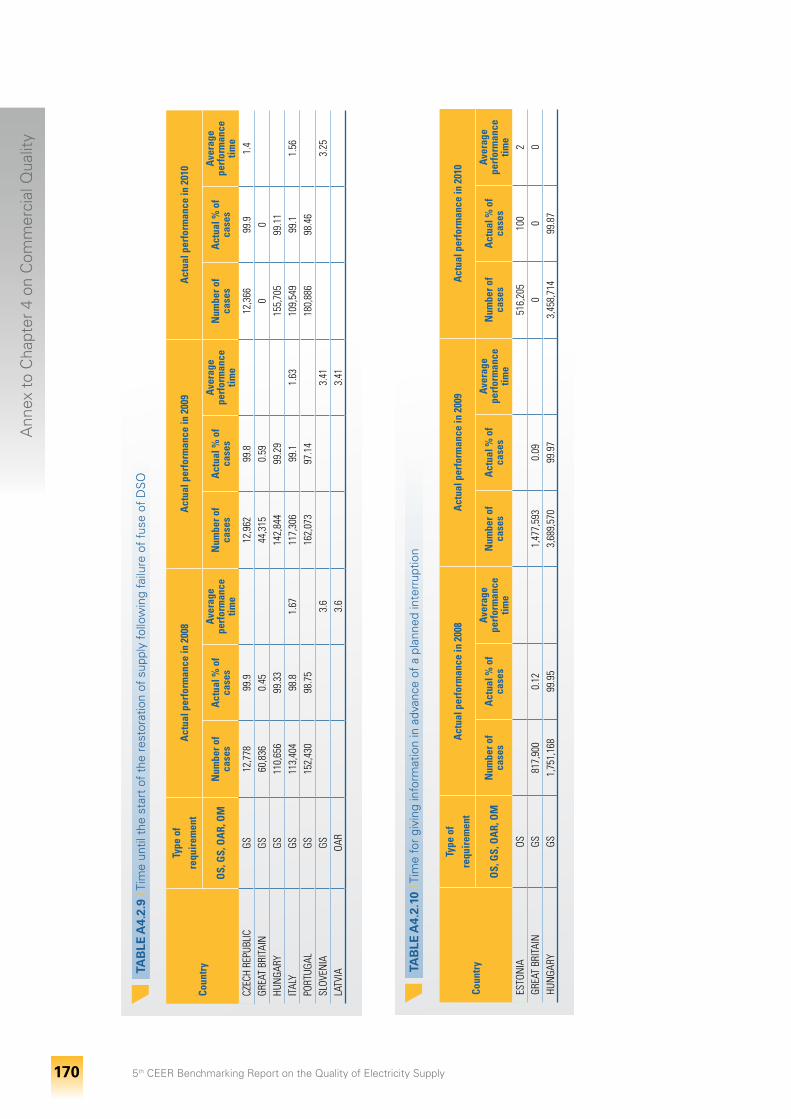
Ann
ex t
o C
hapt
er 4
on
Com
mer
cial
Qua
lity
5th CEER Benchmarking Report on the Quality of Electricity Supply 170
T
AB
LE A
4.2.
9 I T
ime
until
the
sta
rt o
f th
e re
stor
atio
n of
sup
ply
follo
win
g fa
ilure
of
fuse
of
DS
O
Coun
try
Type
of
requ
irem
ent
Act
ual p
erfo
rman
ce in
200
8A
ctua
l per
form
ance
in 2
009
Act
ual p
erfo
rman
ce in
201
0
OS,
GS,
OA
R, O
MN
umbe
r of
case
sA
ctua
l % o
f ca
ses
Aver
age
perf
orm
ance
tim
eN
umbe
r of
case
sA
ctua
l % o
f ca
ses
Aver
age
perf
orm
ance
tim
eN
umbe
r of
case
sA
ctua
l % o
f ca
ses
Aver
age
perf
orm
ance
tim
eCZ
ECH
REPU
BLIC
GS12
,778
99.9
12
,962
99.8
12
,366
99.9
1.4
GREA
T BR
ITAI
NGS
60,8
360.
45
44,3
150.
59
00
HU
NGA
RYGS
110,
656
99.3
3
142,
844
99.2
9
155,
705
99.1
1
ITAL
YGS
113,
404
98.8
1.67
117,
306
99.1
1.63
109,
549
99.1
1.56
PORT
UGAL
GS15
2,43
098
.75
16
2,07
397
.14
18
0,88
698
.46
SL
OVEN
IAGS
3.6
3.41
3.25
LATV
IAOA
R
3.
6
3.
41
T
AB
LE A
4.2.
10 I
Tim
e fo
r gi
ving
info
rmat
ion
in a
dvan
ce o
f a
plan
ned
inte
rrup
tion
Coun
try
Type
of
requ
irem
ent
Act
ual p
erfo
rman
ce in
200
8A
ctua
l per
form
ance
in 2
009
Act
ual p
erfo
rman
ce in
201
0
OS,
GS,
OA
R, O
MN
umbe
r of
case
sA
ctua
l % o
f ca
ses
Aver
age
perf
orm
ance
tim
eN
umbe
r of
case
sA
ctua
l % o
f ca
ses
Aver
age
perf
orm
ance
tim
eN
umbe
r of
case
sA
ctua
l % o
f ca
ses
Aver
age
perf
orm
ance
tim
eES
TON
IAOS
516,
205
100
2GR
EAT
BRIT
AIN
GS81
7,90
00.
12
1,47
7,59
30.
09
00
0HU
NGA
RYGS
1,75
1,16
899
.95
3,
689,
570
99.9
7
3,45
8,71
499
.87
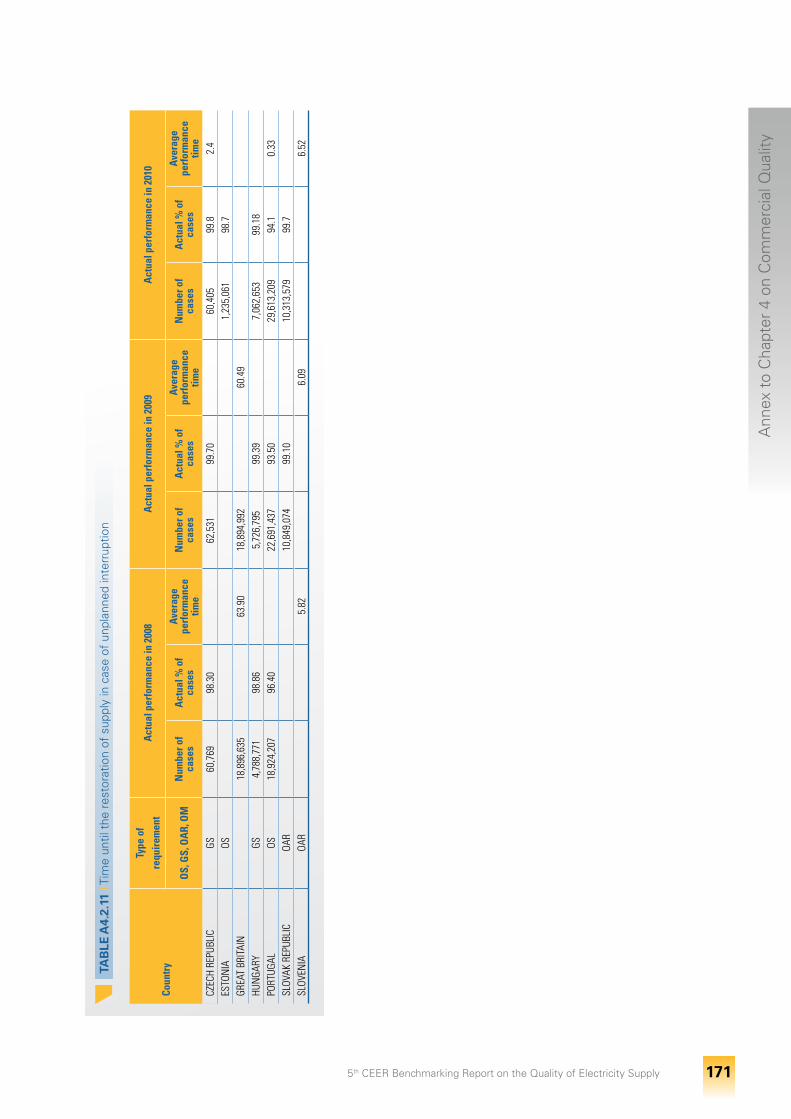
Ann
ex t
o C
hapt
er 4
on
Com
mer
cial
Qua
lity
5th CEER Benchmarking Report on the Quality of Electricity Supply 171
T
AB
LE A
4.2.
11 I
Tim
e un
til t
he r
esto
ratio
n of
sup
ply
in c
ase
of u
npla
nned
inte
rrup
tion
Coun
try
Type
of
requ
irem
ent
Act
ual p
erfo
rman
ce in
200
8A
ctua
l per
form
ance
in 2
009
Act
ual p
erfo
rman
ce in
201
0
OS,
GS,
OA
R, O
MN
umbe
r of
case
sA
ctua
l % o
f ca
ses
Aver
age
perf
orm
ance
tim
eN
umbe
r of
case
sA
ctua
l % o
f ca
ses
Aver
age
perf
orm
ance
tim
eN
umbe
r of
case
sA
ctua
l % o
f ca
ses
Aver
age
perf
orm
ance
tim
eCZ
ECH
REPU
BLIC
GS60
,769
98.3
0
62,5
3199
.70
60
,405
99.8
2.4
ESTO
NIA
OS
1,
235,
061
98.7
GR
EAT
BRIT
AIN
18
,896
,635
63
.90
18,8
94,9
92
60.4
9
HUN
GARY
GS4,
788,
771
98.8
6
5,72
6,79
599
.39
7,
062,
653
99.1
8
PORT
UGAL
OS18
,924
,207
96.4
0
22,6
91,4
3793
.50
29
,613
,209
94.1
0.33
SLOV
AK R
EPUB
LIC
OAR
10
,849
,074
99.1
0
10,3
13,5
7999
.7
SLOV
ENIA
OAR
5.82
6.09
6.52
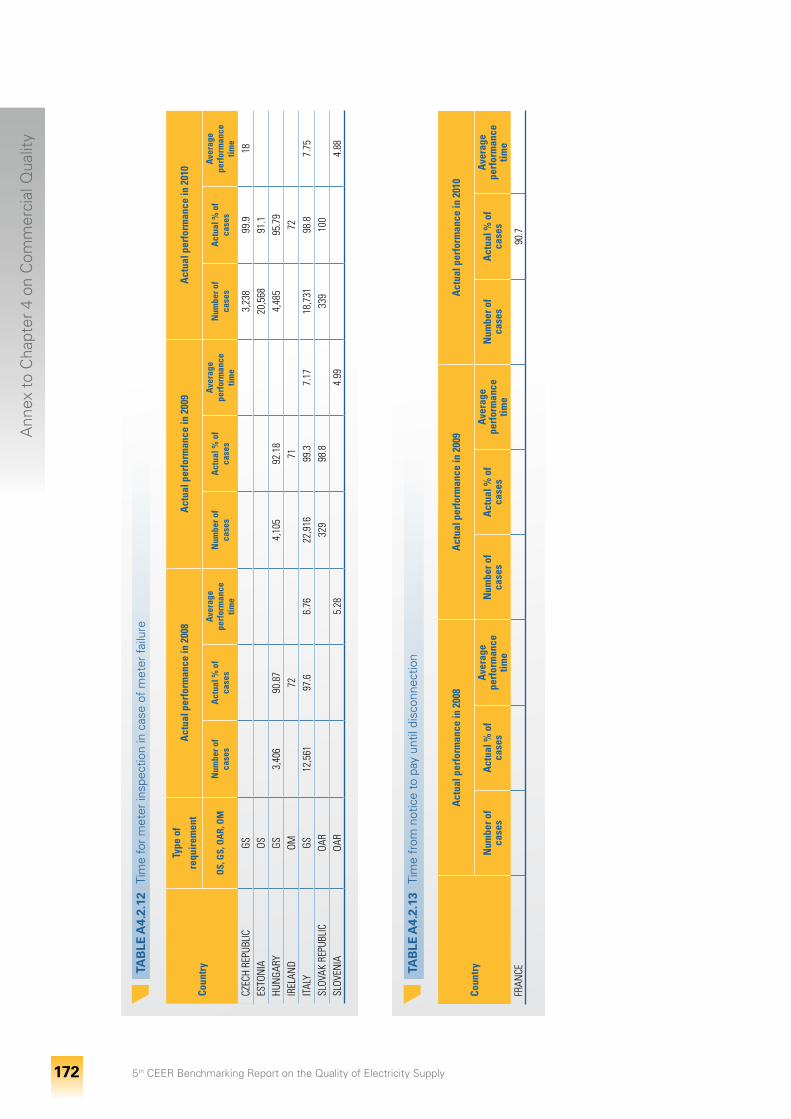
Ann
ex t
o C
hapt
er 4
on
Com
mer
cial
Qua
lity
5th CEER Benchmarking Report on the Quality of Electricity Supply 172
T
AB
LE A
4.2.
12 I
Tim
e fo
r m
eter
insp
ectio
n in
cas
e of
met
er fa
ilure
Coun
try
Type
of
requ
irem
ent
Act
ual p
erfo
rman
ce in
200
8A
ctua
l per
form
ance
in 2
009
Act
ual p
erfo
rman
ce in
201
0
OS,
GS,
OA
R, O
MN
umbe
r of
case
sA
ctua
l % o
f ca
ses
Aver
age
perf
orm
ance
tim
e
Num
ber o
f ca
ses
Act
ual %
of
case
s
Aver
age
perf
orm
ance
tim
e
Num
ber o
f ca
ses
Act
ual %
of
case
s
Aver
age
perf
orm
ance
tim
e
CZEC
H RE
PUBL
ICGS
3,23
899
.918
ESTO
NIA
OS
20
,568
91.1
HU
NGA
RYGS
3,40
690
.87
4,
105
92.1
8
4,48
595
.79
IR
ELAN
DOM
72
71
72
IT
ALY
GS12
,561
97.6
6.76
22,9
1699
.37.
1718
,731
98.8
7.75
SLOV
AK R
EPUB
LIC
OAR
32
998
.8
339
100
SL
OVEN
IAOA
R
5.
28
4.
99
4.
88
T
AB
LE A
4.2.
13 I
Tim
e fr
om n
otic
e to
pay
unt
il di
scon
nect
ion
Coun
try
Act
ual p
erfo
rman
ce in
200
8A
ctua
l per
form
ance
in 2
009
Act
ual p
erfo
rman
ce in
201
0
Num
ber o
f ca
ses
Act
ual %
of
case
sAv
erag
e pe
rfor
man
ce
time
Num
ber o
f ca
ses
Act
ual %
of
case
sAv
erag
e pe
rfor
man
ce
time
Num
ber o
f ca
ses
Act
ual %
of
case
sAv
erag
e pe
rfor
man
ce
time
FRAN
CE
90
.7
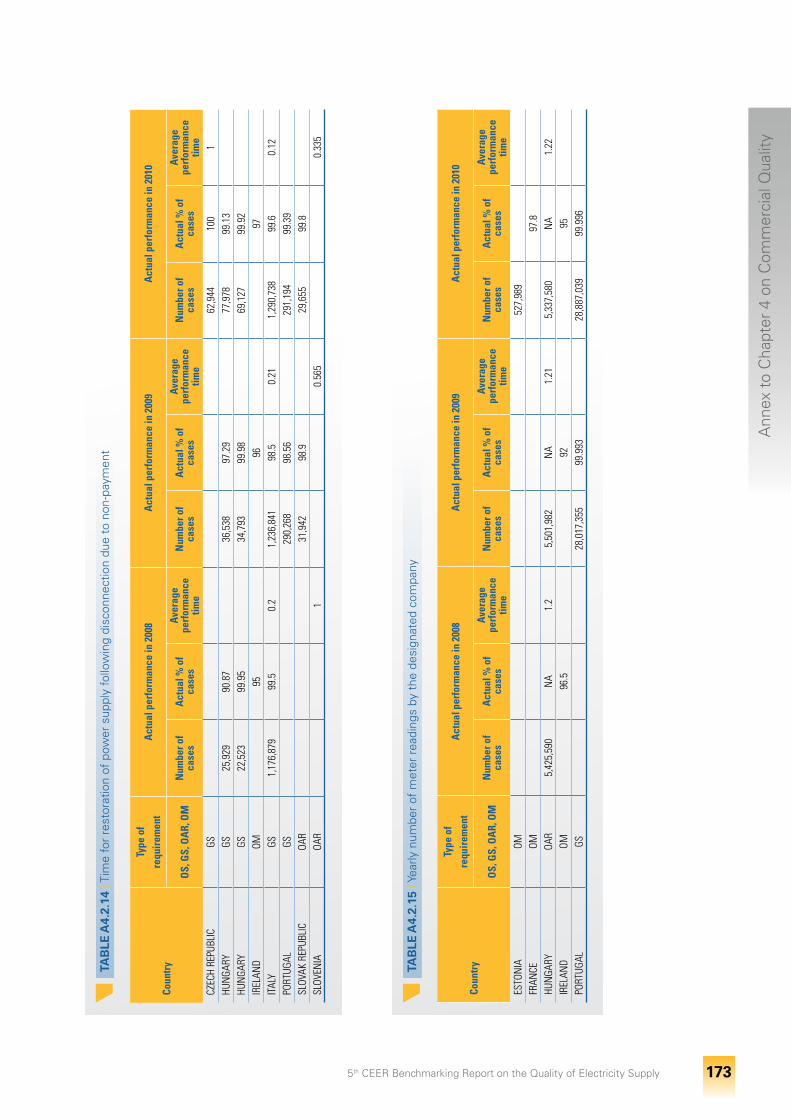
Ann
ex t
o C
hapt
er 4
on
Com
mer
cial
Qua
lity
5th CEER Benchmarking Report on the Quality of Electricity Supply 173
T
AB
LE A
4.2.
14 I
Tim
e fo
r re
stor
atio
n of
pow
er s
uppl
y fo
llow
ing
disc
onne
ctio
n du
e to
non
-pay
men
t
Coun
try
Type
of
requ
irem
ent
Act
ual p
erfo
rman
ce in
200
8A
ctua
l per
form
ance
in 2
009
Act
ual p
erfo
rman
ce in
201
0
OS,
GS,
OA
R, O
MN
umbe
r of
case
sA
ctua
l % o
f ca
ses
Aver
age
perf
orm
ance
tim
eN
umbe
r of
case
sA
ctua
l % o
f ca
ses
Aver
age
perf
orm
ance
tim
eN
umbe
r of
case
sA
ctua
l % o
f ca
ses
Aver
age
perf
orm
ance
tim
eCZ
ECH
REPU
BLIC
GS
62
,944
100
1HU
NGA
RYGS
25,9
2990
.87
36
,538
97.2
9
77,9
7899
.13
HU
NGA
RYGS
22,5
2399
.95
34
,793
99.9
8
69,1
2799
.92
IR
ELAN
DOM
95
96
97
IT
ALY
GS1,
176,
879
99.5
0.2
1,23
6,84
198
.50.
211,
290,
738
99.6
0.12
PORT
UGAL
GS
290,
268
98.5
6
291,
194
99.3
9
SLOV
AK R
EPUB
LIC
OAR
31
,942
98.9
29
,655
99.8
SL
OVEN
IAOA
R
1
0.56
5
0.
335
T
AB
LE A
4.2.
15 I
Year
ly n
umbe
r of
met
er r
eadi
ngs
by t
he d
esig
nate
d co
mpa
ny
Coun
try
Type
of
requ
irem
ent
Act
ual p
erfo
rman
ce in
200
8A
ctua
l per
form
ance
in 2
009
Act
ual p
erfo
rman
ce in
201
0
OS,
GS,
OA
R, O
MN
umbe
r of
case
sA
ctua
l % o
f ca
ses
Aver
age
perf
orm
ance
tim
eN
umbe
r of
case
sA
ctua
l % o
f ca
ses
Aver
age
perf
orm
ance
tim
eN
umbe
r of
case
sA
ctua
l % o
f ca
ses
Aver
age
perf
orm
ance
tim
eES
TON
IAOM
527,
989
FRAN
CEOM
97
.8
HUN
GARY
OAR
5,42
5,59
0N
A1.
25,
501,
982
NA
1.21
5,33
7,58
0N
A1.
22IR
ELAN
DOM
96
.5
92
95
PORT
UGAL
GS
28,0
17,3
5599
.993
28
,887
,039
99.9
96
5th CEER Benchmarking Report on the Quality of Electricity Supply 174
Annex on the 5th CEER Benchmarking Report - Quality of Electricity Supply in the Energy Community22
1. Introduction 1.1 The Energy Community
On 25 October 2005 the Treaty establishing the Energy Community (hereinafter: “the Treaty”) has been signed by the European Community and the authorities of Albania, Bulgaria, Bosnia and Herzegovina, Croatia, the Former Yugoslav Republic of Macedonia (FYR of Macedonia), Romania, Serbia, Montenegro and the United Nations Interim Mission in Kosovo (UNMIK23)24. Following signature and ratification of the Treaty Moldova and Ukraine moved from an observer status to the status of a Contracting Party (CP).
By signing the Treaty the signatory parties agreed to implement the acquis communautaire on electricity, gas, environment, competition and renewables24 with a view to realizing the objectives of the Treaty and to create a regional gas and electricity market within South East Europe (SEE).
The Energy Community Regulatory Board (ECRB)25 operates based on Article 58 of the Energy Community Treaty. As an institution of the Energy Community the ECRB advises the Energy Community Ministerial Council and Permanent High Level Group on details of statutory, technical and regulatory rules and should make recommendations in the case of cross-border disputes between regulators.
22. Approved by the ECRB in November 2011. All data, references and information referring to the date of approval.23. Pursuant to United Nations Security Council Resolution 1244.24. Following ratification, the Treaty entered into force on 1 July 2006. For details on the Treaty and the Energy Community see www.energy-
community.org.25. For details of the relevant acquis see: http://www.energy-community.org/portal/page/portal/ENC_HOME/ENERGY_COMMUNITY/Legal/Treaty26. For details see www.ecrb.eu.
5th CEER Benchmarking Report on the Quality of Electricity Supply 175
Ann
ex o
n th
e 5th
CE
ER
Ben
chm
arki
ng R
epor
t - E
CR
B
1.2 Scope
Quality of electricity supply is in the centre of the ECRB work since 200827. Also the Council of European Energy Regulators (CEER)28 puts a focus on quality of electricity supply already for a long time and prepares a Benchmarking Report on Quality of Electricity Supply in the EU Member States every third year, presenting an overview and analysis of practices related to quality of electricity supply29.
Upon agreement of the CEER General Assembly, the present 5th Benchmarking Report on Quality of Electricity Supply also includes an annex analysing the status quo in the Energy Community Contracting Parties. This, more in detail, covers all three aspects of quality of electricity supply, namely:
1. Continuity of Supply (CoS);2. Voltage Quality (VQ);3. Commercial Quality (CQ).
Relevant data is presented for Albania, Bosnia and Herzegovina, Croatia, FYR of Macedonia, Moldova, Montenegro, Serbia, Ukraine and UNMIK. Where results for Bosnia and Herzegovina differ for its entities (the Federation of Bosnia and Herzegovina and Republika Srpska), they are displayed separately in this survey.
Within each chapter the findings and recommen-dations related to various issues of quality of supply are given. Where appropriate, examples from some CPs are emphasized in yellow boxes. The present survey also provides an assessment of areas where a move towards harmonisation could further improve quality of supply.
1.3 Methodology
The analysis for the Energy Community is based on a questionnaire used for CEER’s analysis on EU level30. Therefore, the assessment for the Energy Community also bases on the definitions and theoretical background defined for the EU Member States.
1.4 Acknowledgements
The ECRB expresses its gratitude for the colleagues from the regulatory authorities (RAs), transmission system operators (TSOs) and distribution system operators (DSOs) from the Energy Community CPs for participating in the present analysis. In this context special thanks are also addressed to Mr David Batic, Mrs Jasmina Trhulj, Mr Lahorko Wagmann and Mr Zlatko Zmijarevic for their effort in preparing this survey.
The ECRB also expresses its appreciation for the support received from the EU regulators at CEER level.
27. A first survey on quality of electricity supply in the Energy Community (EnC) was prepared in 2009 (“Report on the Quality of Electricity Service Standards and Incentives in Quality Regulation”; www.ecrb.eu – documents – publications – electricity (2009). Following two workshops in 2009 and 2010, the report “Assistance to regulators in introducing and improving service quality regulation in the Energy Community” was published in 2010 (www.ecrb.eu – documents – studies).
28. www.energy-regulators.eu.
29. The first report was issued in 2001, followed by the second, third and fourth editions in 2003, 2005 and 2008. All reports are available at www.energy-regulators.eu.
30. Reduced to the elements applied in the Energy Community jurisdictions.
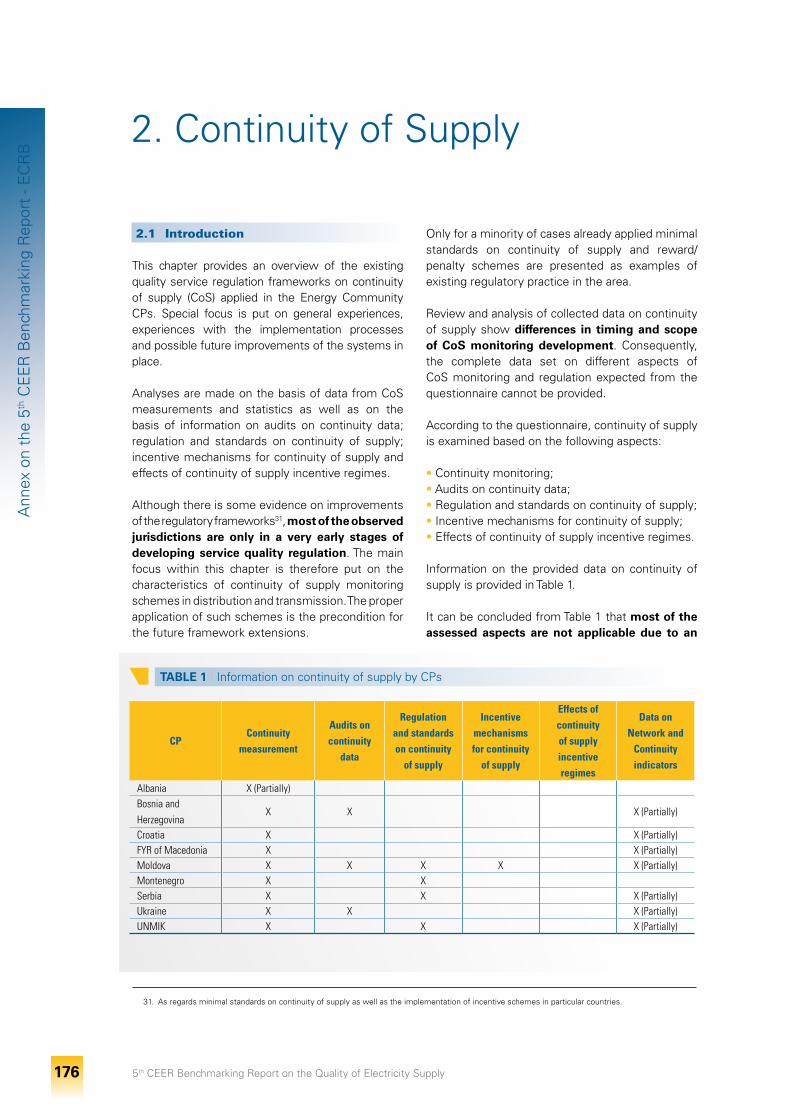
5th CEER Benchmarking Report on the Quality of Electricity Supply 176
Ann
ex o
n th
e 5th
CE
ER
Ben
chm
arki
ng R
epor
t - E
CR
B
2. Continuity of Supply
2.1 Introduction
This chapter provides an overview of the existing quality service regulation frameworks on continuity of supply (CoS) applied in the Energy Community CPs. Special focus is put on general experiences, experiences with the implementation processes and possible future improvements of the systems in place.
Analyses are made on the basis of data from CoS measurements and statistics as well as on the basis of information on audits on continuity data; regulation and standards on continuity of supply; incentive mechanisms for continuity of supply and effects of continuity of supply incentive regimes.
Although there is some evidence on improvements of the regulatory frameworks31, most of the observed jurisdictions are only in a very early stages of developing service quality regulation. The main focus within this chapter is therefore put on the characteristics of continuity of supply monitoring schemes in distribution and transmission. The proper application of such schemes is the precondition for the future framework extensions.
Only for a minority of cases already applied minimal standards on continuity of supply and reward/penalty schemes are presented as examples of existing regulatory practice in the area.
Review and analysis of collected data on continuity of supply show differences in timing and scope of CoS monitoring development. Consequently, the complete data set on different aspects of CoS monitoring and regulation expected from the questionnaire cannot be provided.
According to the questionnaire, continuity of supply is examined based on the following aspects:
• Continuity monitoring;• Audits on continuity data;• Regulation and standards on continuity of supply;• Incentive mechanisms for continuity of supply;• Effects of continuity of supply incentive regimes.
Information on the provided data on continuity of supply is provided in Table 1.
It can be concluded from Table 1 that most of the assessed aspects are not applicable due to an
31. As regards minimal standards on continuity of supply as well as the implementation of incentive schemes in particular countries.
TABLE 1 I Information on continuity of supply by CPs
CPContinuity
measurement
Audits on continuity
data
Regulation and standards on continuity
of supply
Incentive mechanisms for continuity
of supply
Effects of continuity of supply incentive regimes
Data on Network and
Continuity indicators
Albania X (Partially)Bosnia and Herzegovina
X X X (Partially)
Croatia X X (Partially)FYR of Macedonia X X (Partially)Moldova X X X X X (Partially)Montenegro X XSerbia X X X (Partially)Ukraine X X X (Partially)UnMik X X X (Partially)
5th CEER Benchmarking Report on the Quality of Electricity Supply 177
Ann
ex o
n th
e 5th
CE
ER
Ben
chm
arki
ng R
epor
t - E
CR
B
monitoring systems is essential for setting standards as well as penalties and rewards related to both monitoring levels.
In the CPs, the monitoring of continuity of supply is performed in different ways - the differences comprise different types of interruptions, different sets of indicators, as well as different approaches on the level of detail of reporting. The following sections pinpoint the differences but also the concepts that are harmonised among the CPs. Harmonisation, where existing, has not been enforced by law but has been implemented through examples of good practice in the EU33.
2.2.1 Types of Interruptions Monitored
All jurisdictions use some sort of monitoring of interruptions. The types of monitored interruptions are shown in Table 2.
The actual focus of the individual CPs is mainly on long-term interruptions (duration > 3 minutes). The qualitative information on long interruptions is essential for the calculation of continuity indicators that are widely used in regulation.
Three regulators claim to have access to the information regarding the number of short-term interruptions, namely Ukraine, FYR of Macedonia34
and (partly) Bosnia and Herzegovina.
In this context it is important to explain the way how short-term interruptions are currently monitored, especially due to the fact that Supervisory control and data acquisition (SCADA) is not yet fully implemented in the networks of the CPs. Therefore, those CPs that reported monitoring of short-term interruptions were additionally asked to provide a brief information on the type of measurement method that is used35.
In Bosnia and Herzegovina, most of the distribution facilities do not have equipment for remote supervision and control installed36. All (short and long) interruptions are recorded manually and stored locally in registers (registry books). Contingency statistics are recorded manually by the staff on duty. Registered data is consolidated in the main dispatching centres for the distribution network control. These data are subject to checks by the regulatory authority.
early stage of continuity of supply regulation in all CPs. The lack of data limits the possibility of benchmarking the actual levels and trends of continuity of supply in the investigated markets.
According to the current status of implementation, the following chapters mainly focus on an overview of the monitoring concepts and on the aspects and characteristics of the regulation frameworks applied (including standards on continuity of supply). The aim is to benchmark the implementation process of continuity of supply monitoring and regulation and to look deeper into their prerequisites, namely:
• the establishment of legal framework; • usage of standards and guidelines of good
practice;• the implementation of the continuity of supply
monitoring system;• continuity standards and incentive schemes.
Such structured information might be of especial help for RAs that have plans to introduce quality regulation regime in depth in the future.
In the subsequent sections different terms for the network user are used, namely “customers”, “consumers” and “(network) users”. “Network user” (or simply “user”, comprising both generators and other consumers), certainly, is the appropriate term. However, since there is no harmonisation on the terms used, different terms with the same meaning are used.
Also, different terminology is used when referring to the party responsible for continuity of supply. Although the EU Electricity Directives32 (2nd and 3rd
package) provide a definition of transmission and distribution system operators (or simply “system operators”) the concept of system operation refers to dispatching of generators and it is different from network ownership and operation.
2.2 Continuity of Supply Monitoring
Monitoring of quality levels by the use of indicators and standards is the basis for regulating quality. In general, the actual monitoring of continuity of supply can be performed on two different levels, namely on the system level and on the consumer-specific level. The implementation of adequate
32. http://ec.europa.eu/energy/gas_electricity/legislation/third_legislative_package_en.htm 33. By adopting standards as EN 50160 and others. 34. However, details for FYR of Macedonia have not been reported. 35. I.e. manual recording, use of SCADA DMS, local substation logging, counter readings on reclosing devices or other methods. 36. Except for the facilities of one out of the five distribution companies in RS which have the SCADA system installed at MV.
5th CEER Benchmarking Report on the Quality of Electricity Supply 178
Ann
ex o
n th
e 5th
CE
ER
Ben
chm
arki
ng R
epor
t - E
CR
B
Considering the general lack of SCADA, it can be concluded that local substation logging and counter readings on reclosing relays are the most commonly used practices for recording the interruptions.
Unplanned long interruptions are monitored in all investigated markets. However, not all CPs monitor this type of interruptions at all voltage levels.
Moreover, usually there is also a distinct and separate data collection for planned and unplanned interruptions. An “on time” announcement of the planned action reduces the effect of the interruption on the consumer.
Only Moldova has established rules on automatic logging of interruptions. Bosnia and Herzegovina and FYR of Macedonia have also accomplished to set some rules with limited scope37. The other investigated jurisdictions either have not set any rules yet or are only in a planning phase for establishing the rules and implement the SCADA system.
Nearly half of the CPs established some sort of standardised way for recording and reporting by means of dedicated application software or by use of harmonised forms for data collection. This is usually a result of regulations imposing obligations on companies to implement reporting without taking into consideration technical preconditions for interruption monitoring and time for such implementation. EU experiences showed that this is not the best approach and such practice should be gradually replaced by the automated logging of interruptions by SCADA and associate software solutions38.
The definitions regarding the duration of long, short, and transient interruptions in different CPs are shown in Table 3.
The Albanian definition significantly differs from the other CPs as well as from standard definitions39
which classify unplanned interruption40 as:
• long interruption (>3 min);• short interruption (≤ 3 min).
The deviation in Ukraine, where the interruption lasting exactly 3 minutes is classified as long-term interruption, is minor. The same can be concluded for UNMIK, where the same type of interruptions (duration = 3 min) is excluded from monitoring.
Some minor differences of definitions are also identified related to the duration of short interruptions, especially concerning the setting the lower limits41.
Albania, again, is the only CP that defines a category of transient interruptions; the transient interruptions in Albania would classify as short interruptions in other countries.
2.2.2 Planned and Unplanned Interruptions
An overview on the definitions of unplanned42 and planned43 interruptions, as well as the rule on advance notice regarding the planned interruptions is provided in Table 4. The majority of investigated markets (8 out of 9) use definitions for both planned and unplanned interruptions referring to the availability of advance notices to customers. Both types of interruptions are monitored accordingly. There is no explicit definition of unplanned interruption in Croatia.
Most CPs use similar definitions for planned interruptions. However, they do not refer to EN 50160 or any other standards, international guidelines or norms. Advanced notification is necessary for an interruption to be classified as a planned interruption. More detailed descriptions of definitions, comprising also some information on exemptions, were provided by Ukraine, Bosnia and Herzegovina and Croatia.
All CPs apply rules on notice to customers affected, whereas the requirements for advance notice vary between 24 hours up to 10 days.
37. SCADA installed at certain voltage level or proprietary solutions by DSOs. 38. DMS, GIS and etc.39. EN 50160.40. Using the term “accidental supply” interruption.41. Some definitions do not set lower bounds, some set the limit at 1.0 second or 1.5 seconds.42. An unplanned interruption is defined in EN 50160 as an interruption caused by permanent or transient faults, mostly related to the external events,
equipment failures or interference.43. A planned interruption is defined in EN 50160 as an interruption for which customers are informed in advance to allow the execution of scheduled
works on the distribution system.
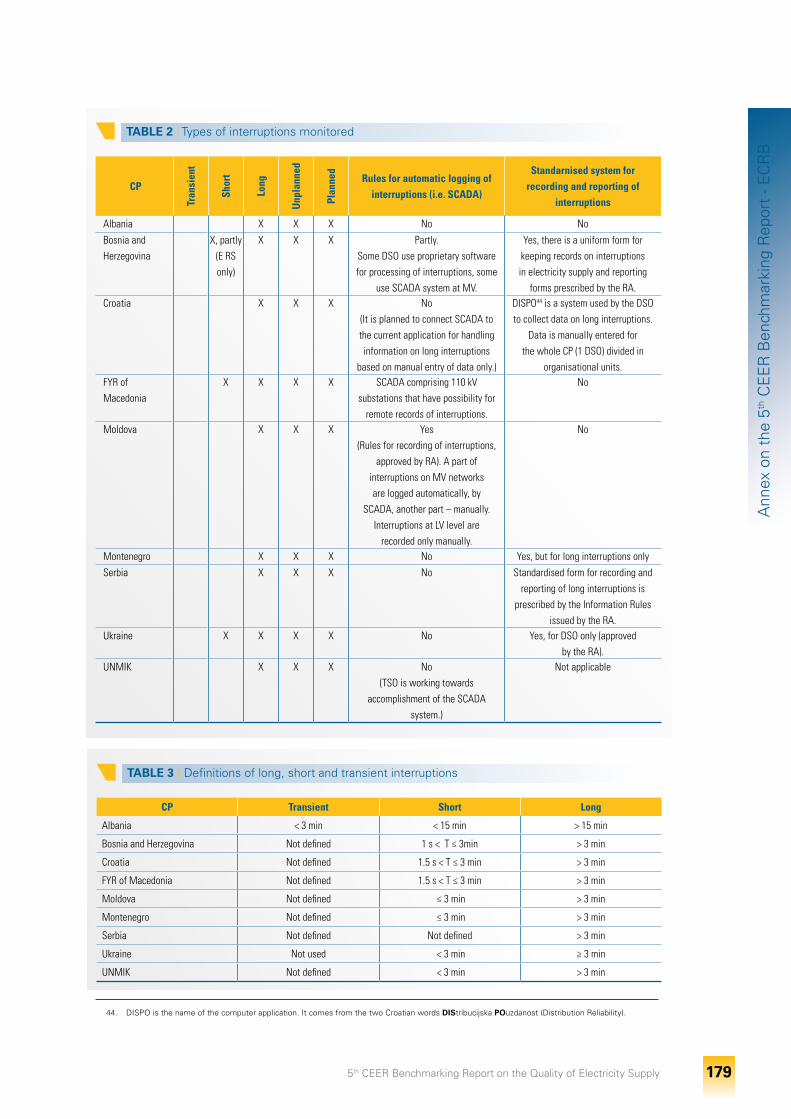
5th CEER Benchmarking Report on the Quality of Electricity Supply 179
Ann
ex o
n th
e 5th
CE
ER
Ben
chm
arki
ng R
epor
t - E
CR
B
TABLE 2 I Types of interruptions monitored
CPTr
ansi
ent
Shor
t
Long
Unp
lann
ed
Plan
ned
Rules for automatic logging of interruptions (i.e. SCADA)
Standarnised system for recording and reporting of
interruptions
Albania X X X no no
Bosnia and Herzegovina
X, partly (E RS only)
X X X Partly.Some DSO use proprietary software for processing of interruptions, some
use SCADA system at MV.
Yes, there is a uniform form for keeping records on interruptions in electricity supply and reporting
forms prescribed by the RA.Croatia X X X no
(it is planned to connect SCADA to the current application for handling information on long interruptions
based on manual entry of data only.)
DiSPO44 is a system used by the DSO to collect data on long interruptions.
Data is manually entered for the whole CP (1 DSO) divided in
organisational units.FYR of Macedonia
X X X X SCADA comprising 110 kV substations that have possibility for
remote records of interruptions.
no
Moldova X X X Yes (Rules for recording of interruptions,
approved by RA). A part of interruptions on MV networks are logged automatically, by
SCADA, another part – manually. interruptions at LV level are
recorded only manually.
no
Montenegro X X X no Yes, but for long interruptions only
Serbia X X X no Standardised form for recording and reporting of long interruptions is
prescribed by the information Rules issued by the RA.
Ukraine X X X X no Yes, for DSO only (approved by the RA).
UnMik X X X no (TSO is working towards
accomplishment of the SCADA system.)
not applicable
TABLE 3 I Definitions of long, short and transient interruptions
CP Transient Short Long
Albania < 3 min < 15 min > 15 min
Bosnia and Herzegovina not defined 1 s < T ≤ 3min > 3 min
Croatia not defined 1.5 s < T ≤ 3 min > 3 min
FYR of Macedonia not defined 1.5 s < T ≤ 3 min > 3 min
Moldova not defined ≤ 3 min > 3 min
Montenegro not defined ≤ 3 min > 3 min
Serbia not defined not defined > 3 min
Ukraine not used < 3 min ≥ 3 min
UnMik not defined < 3 min > 3 min
44. DISPO is the name of the computer application. It comes from the two Croatian words DIStribucijska POuzdanost (Distribution Reliability).
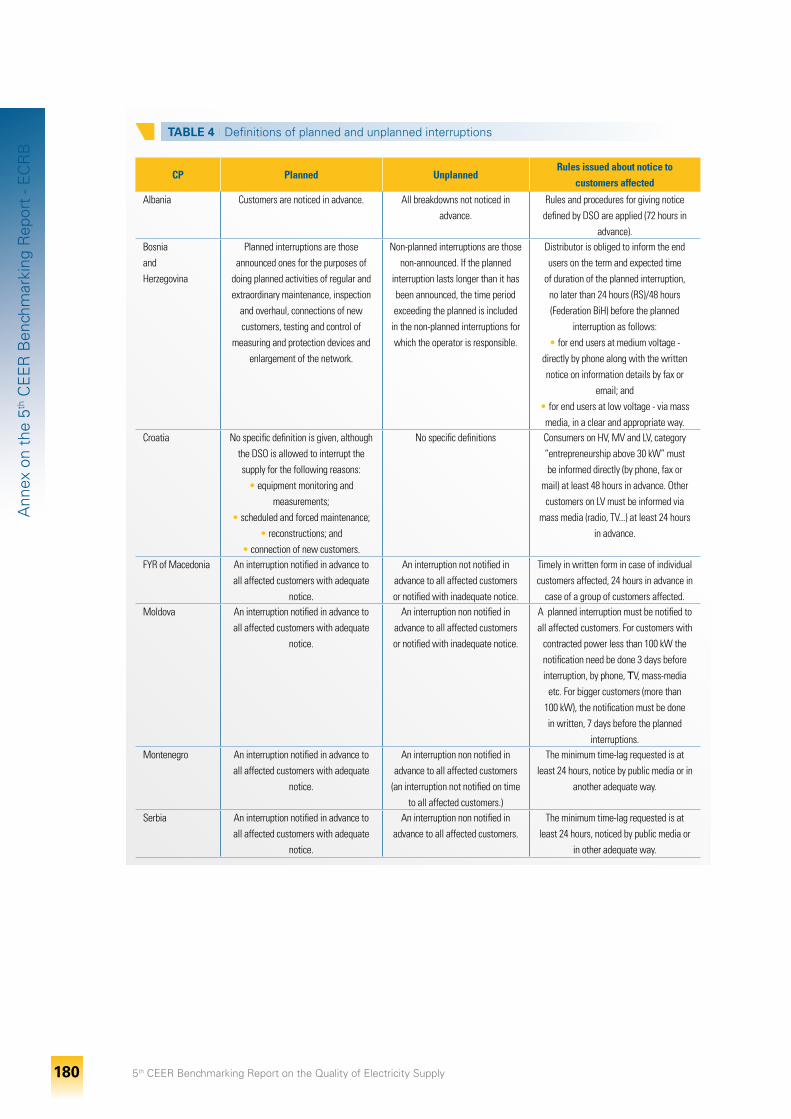
5th CEER Benchmarking Report on the Quality of Electricity Supply 180
Ann
ex o
n th
e 5th
CE
ER
Ben
chm
arki
ng R
epor
t - E
CR
B
TABLE 4 I Definitions of planned and unplanned interruptions
CP Planned UnplannedRules issued about notice to
customers affected
Albania Customers are noticed in advance. All breakdowns not noticed in advance.
Rules and procedures for giving notice defined by DSO are applied (72 hours in
advance).Bosnia and Herzegovina
Planned interruptions are those announced ones for the purposes of
doing planned activities of regular and extraordinary maintenance, inspection
and overhaul, connections of new customers, testing and control of
measuring and protection devices and enlargement of the network.
non-planned interruptions are those non-announced. if the planned
interruption lasts longer than it has been announced, the time period exceeding the planned is included
in the non-planned interruptions for which the operator is responsible.
Distributor is obliged to inform the end users on the term and expected time
of duration of the planned interruption, no later than 24 hours (RS)/48 hours (Federation BiH) before the planned
interruption as follows: • for end users at medium voltage -
directly by phone along with the written notice on information details by fax or
email; and • for end users at low voltage - via mass
media, in a clear and appropriate way.Croatia no specific definition is given, although
the DSO is allowed to interrupt the supply for the following reasons:
• equipment monitoring and measurements;
• scheduled and forced maintenance; • reconstructions; and
• connection of new customers.
no specific definitions Consumers on HV, MV and LV, category “entrepreneurship above 30 kW” must be informed directly (by phone, fax or
mail) at least 48 hours in advance. Other customers on LV must be informed via
mass media (radio, TV...) at least 24 hours in advance.
FYR of Macedonia An interruption notified in advance to all affected customers with adequate
notice.
An interruption not notified in advance to all affected customers or notified with inadequate notice.
Timely in written form in case of individual customers affected, 24 hours in advance in
case of a group of customers affected.Moldova An interruption notified in advance to
all affected customers with adequate notice.
An interruption non notified in advance to all affected customers or notified with inadequate notice.
A planned interruption must be notified to all affected customers. For customers with
contracted power less than 100 kW the notification need be done 3 days before interruption, by phone, TV, mass-media
etc. For bigger customers (more than 100 kW), the notification must be done in written, 7 days before the planned
interruptions.Montenegro An interruption notified in advance to
all affected customers with adequate notice.
An interruption non notified in advance to all affected customers
(an interruption not notified on time to all affected customers.)
The minimum time-lag requested is at least 24 hours, notice by public media or in
another adequate way.
Serbia An interruption notified in advance to all affected customers with adequate
notice.
An interruption non notified in advance to all affected customers.
The minimum time-lag requested is at least 24 hours, noticed by public media or
in other adequate way.
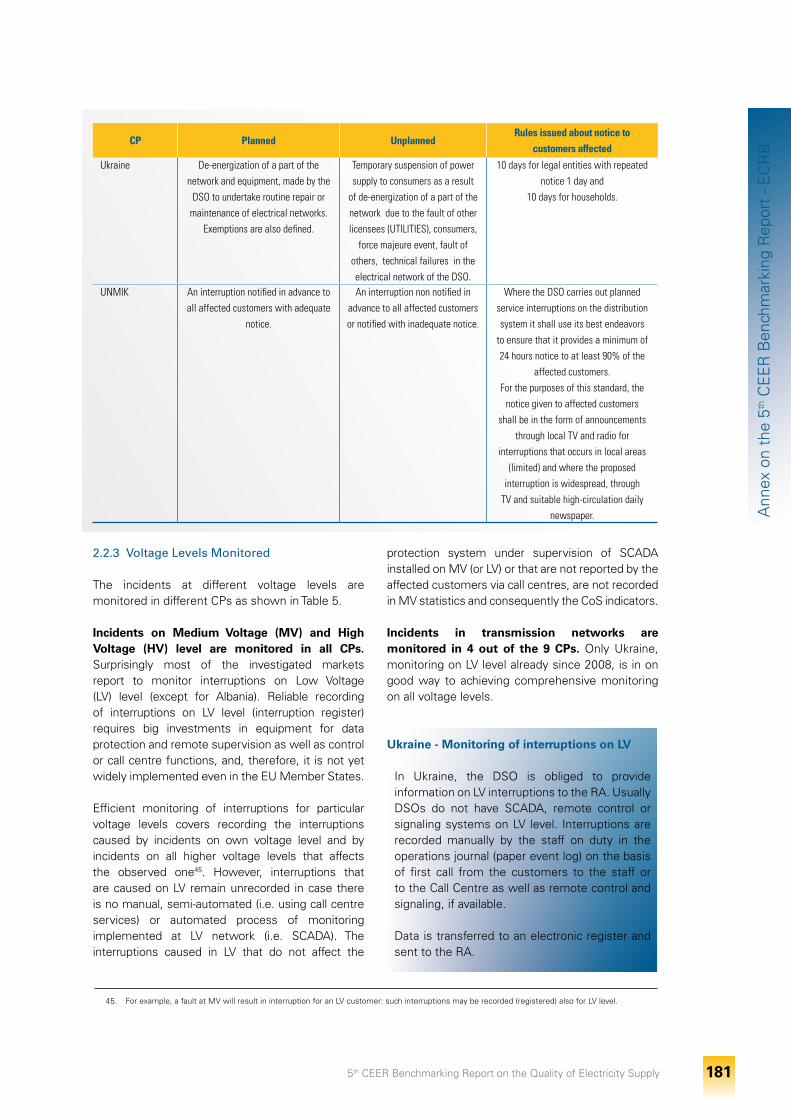
5th CEER Benchmarking Report on the Quality of Electricity Supply 181
Ann
ex o
n th
e 5th
CE
ER
Ben
chm
arki
ng R
epor
t - E
CR
B
2.2.3 Voltage Levels Monitored
The incidents at different voltage levels are monitored in different CPs as shown in Table 5.
Incidents on Medium Voltage (MV) and High Voltage (HV) level are monitored in all CPs. Surprisingly most of the investigated markets report to monitor interruptions on Low Voltage (LV) level (except for Albania). Reliable recording of interruptions on LV level (interruption register) requires big investments in equipment for data protection and remote supervision as well as control or call centre functions, and, therefore, it is not yet widely implemented even in the EU Member States.
Efficient monitoring of interruptions for particular voltage levels covers recording the interruptions caused by incidents on own voltage level and by incidents on all higher voltage levels that affects the observed one45. However, interruptions that are caused on LV remain unrecorded in case there is no manual, semi-automated (i.e. using call centre services) or automated process of monitoring implemented at LV network (i.e. SCADA). The interruptions caused in LV that do not affect the
protection system under supervision of SCADA installed on MV (or LV) or that are not reported by the affected customers via call centres, are not recorded in MV statistics and consequently the CoS indicators.
Incidents in transmission networks are monitored in 4 out of the 9 CPs. Only Ukraine, monitoring on LV level already since 2008, is in on good way to achieving comprehensive monitoring on all voltage levels.
Ukraine - Monitoring of interruptions on LV
In Ukraine, the DSO is obliged to provide information on LV interruptions to the RA. Usually DSOs do not have SCADA, remote control or signaling systems on LV level. Interruptions are recorded manually by the staff on duty in the operations journal (paper event log) on the basis of first call from the customers to the staff or to the Call Centre as well as remote control and signaling, if available.
Data is transferred to an electronic register and sent to the RA.
CP Planned UnplannedRules issued about notice to
customers affected
Ukraine De-energization of a part of the network and equipment, made by the
DSO to undertake routine repair or maintenance of electrical networks.
Exemptions are also defined.
Temporary suspension of power supply to consumers as a result
of de-energization of a part of the network due to the fault of other licensees (UTiLiTiES), consumers,
force majeure event, fault of others, technical failures in the electrical network of the DSO.
10 days for legal entities with repeated notice 1 day and
10 days for households.
UnMik An interruption notified in advance to all affected customers with adequate
notice.
An interruption non notified in advance to all affected customers or notified with inadequate notice.
Where the DSO carries out planned service interruptions on the distribution system it shall use its best endeavors
to ensure that it provides a minimum of 24 hours notice to at least 90% of the
affected customers. For the purposes of this standard, the
notice given to affected customers shall be in the form of announcements
through local TV and radio for interruptions that occurs in local areas
(limited) and where the proposed interruption is widespread, through
TV and suitable high-circulation daily newspaper.
45. For example, a fault at MV will result in interruption for an LV customer: such interruptions may be recorded (registered) also for LV level.
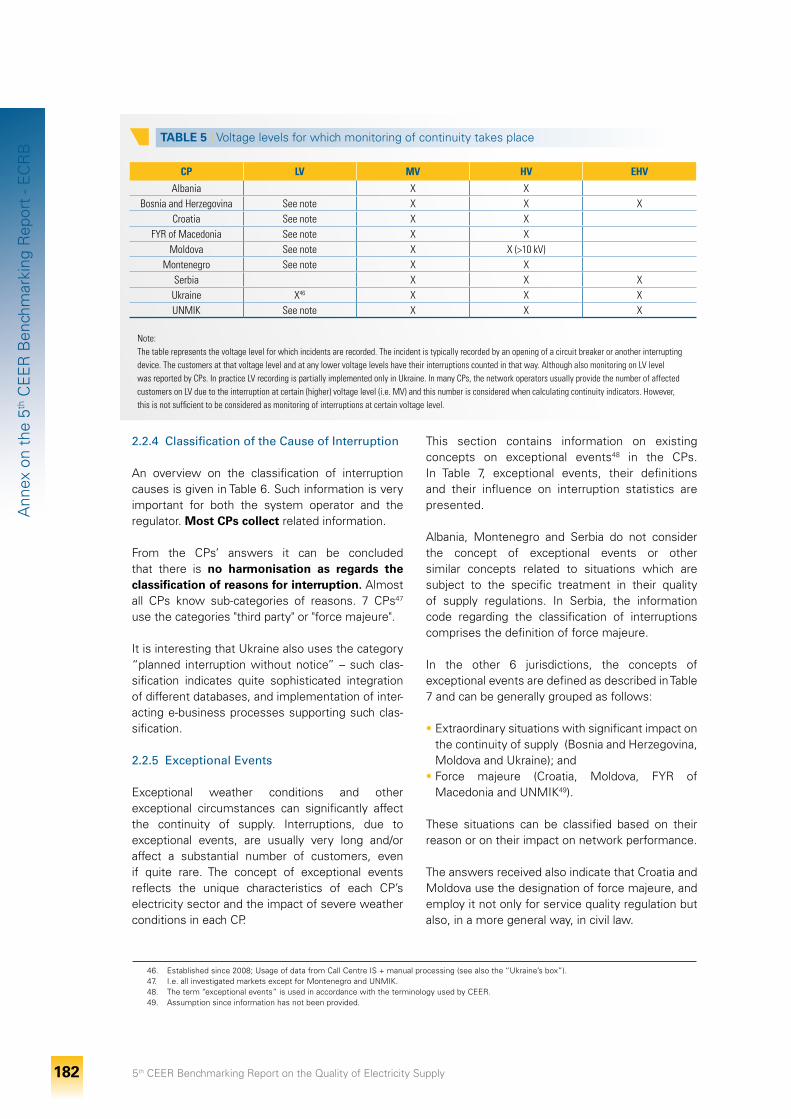
5th CEER Benchmarking Report on the Quality of Electricity Supply 182
Ann
ex o
n th
e 5th
CE
ER
Ben
chm
arki
ng R
epor
t - E
CR
B
2.2.4 Classification of the Cause of Interruption
An overview on the classification of interruption causes is given in Table 6. Such information is very important for both the system operator and the regulator. Most CPs collect related information.
From the CPs’ answers it can be concluded that there is no harmonisation as regards the classification of reasons for interruption. Almost all CPs know sub-categories of reasons. 7 CPs47 use the categories "third party" or "force majeure".
It is interesting that Ukraine also uses the category “planned interruption without notice” – such clas-sification indicates quite sophisticated integration of different databases, and implementation of inter-acting e-business processes supporting such clas-sification.
2.2.5 Exceptional Events
Exceptional weather conditions and other exceptional circumstances can significantly affect the continuity of supply. Interruptions, due to exceptional events, are usually very long and/or affect a substantial number of customers, even if quite rare. The concept of exceptional events reflects the unique characteristics of each CP’s electricity sector and the impact of severe weather conditions in each CP.
This section contains information on existing concepts on exceptional events48 in the CPs. In Table 7, exceptional events, their definitions and their influence on interruption statistics are presented.
Albania, Montenegro and Serbia do not consider the concept of exceptional events or other similar concepts related to situations which are subject to the specific treatment in their quality of supply regulations. In Serbia, the information code regarding the classification of interruptions comprises the definition of force majeure.
In the other 6 jurisdictions, the concepts of exceptional events are defined as described in Table 7 and can be generally grouped as follows:
• Extraordinary situations with significant impact on the continuity of supply (Bosnia and Herzegovina, Moldova and Ukraine); and
• Force majeure (Croatia, Moldova, FYR of Macedonia and UNMIK49).
These situations can be classified based on their reason or on their impact on network performance.
The answers received also indicate that Croatia and Moldova use the designation of force majeure, and employ it not only for service quality regulation but also, in a more general way, in civil law.
46. Established since 2008; Usage of data from Call Centre IS + manual processing (see also the “Ukraine’s box”).47. I.e. all investigated markets except for Montenegro and UNMIK. 48. The term “exceptional events” is used in accordance with the terminology used by CEER. 49. Assumption since information has not been provided.
TABLE 5 I Voltage levels for which monitoring of continuity takes place
CP LV MV HV EHV
Albania X X Bosnia and Herzegovina See note X X X
Croatia See note X X FYR of Macedonia See note X X
Moldova See note X X (>10 kV) Montenegro See note X X
Serbia X X XUkraine X46 X X XUnMik See note X X X
note:The table represents the voltage level for which incidents are recorded. The incident is typically recorded by an opening of a circuit breaker or another interrupting device. The customers at that voltage level and at any lower voltage levels have their interruptions counted in that way. Although also monitoring on LV level was reported by CPs. in practice LV recording is partially implemented only in Ukraine. in many CPs, the network operators usually provide the number of affected customers on LV due to the interruption at certain (higher) voltage level (i.e. MV) and this number is considered when calculating continuity indicators. However, this is not sufficient to be considered as monitoring of interruptions at certain voltage level.
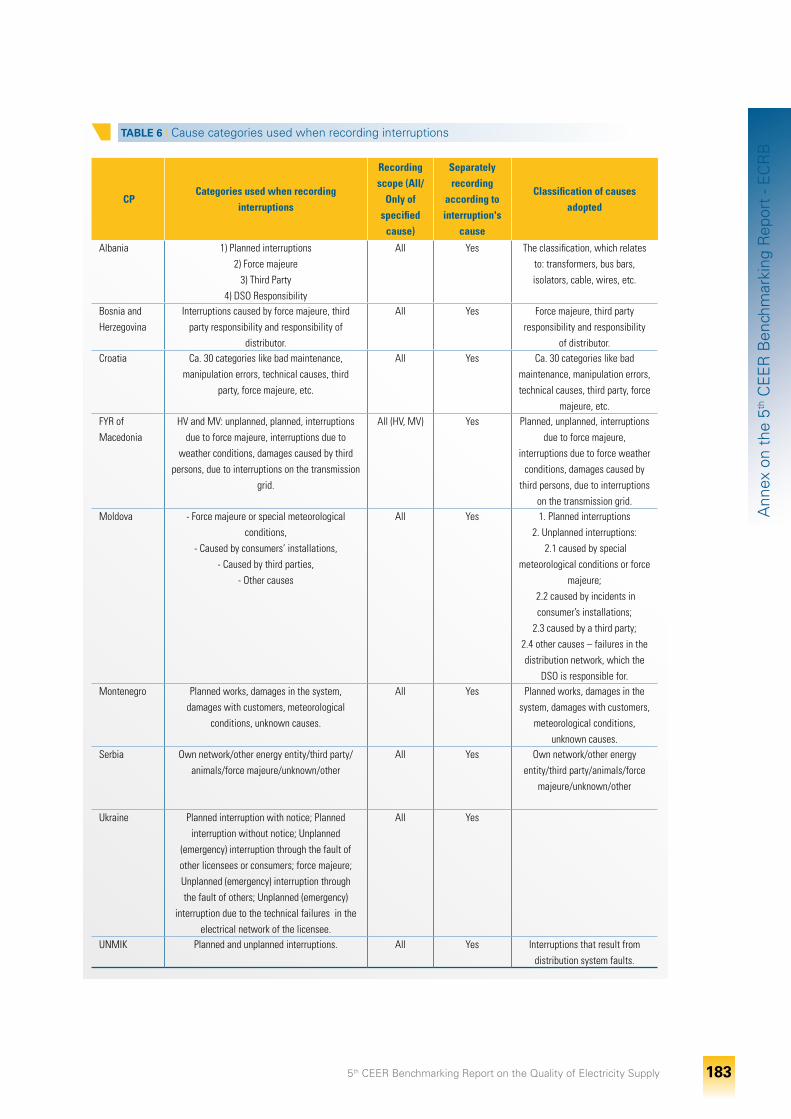
5th CEER Benchmarking Report on the Quality of Electricity Supply 183
Ann
ex o
n th
e 5th
CE
ER
Ben
chm
arki
ng R
epor
t - E
CR
B
TABLE 6 I Cause categories used when recording interruptions
CPCategories used when recording
interruptions
Recording scope (All/
Only of specified
cause)
Separately recording
according to interruption's
cause
Classification of causes adopted
Albania 1) Planned interruptions 2) Force majeure
3) Third Party 4) DSO Responsibility
All Yes The classification, which relates to: transformers, bus bars, isolators, cable, wires, etc.
Bosnia and Herzegovina
interruptions caused by force majeure, third party responsibility and responsibility of
distributor.
All Yes Force majeure, third party responsibility and responsibility
of distributor.Croatia Ca. 30 categories like bad maintenance,
manipulation errors, technical causes, third party, force majeure, etc.
All Yes Ca. 30 categories like bad maintenance, manipulation errors, technical causes, third party, force
majeure, etc.FYR of Macedonia
HV and MV: unplanned, planned, interruptions due to force majeure, interruptions due to
weather conditions, damages caused by third persons, due to interruptions on the transmission
grid.
All (HV, MV) Yes Planned, unplanned, interruptions due to force majeure,
interruptions due to force weather conditions, damages caused by
third persons, due to interruptions on the transmission grid.
Moldova - Force majeure or special meteorological conditions,
- Caused by consumers’ installations,- Caused by third parties,
- Other causes
All Yes 1. Planned interruptions 2. Unplanned interruptions:
2.1 caused by special meteorological conditions or force
majeure; 2.2 caused by incidents in consumer’s installations;
2.3 caused by a third party; 2.4 other causes – failures in the distribution network, which the
DSO is responsible for.Montenegro Planned works, damages in the system,
damages with customers, meteorological conditions, unknown causes.
All Yes Planned works, damages in the system, damages with customers,
meteorological conditions, unknown causes.
Serbia Own network/other energy entity/third party/animals/force majeure/unknown/other
All Yes Own network/other energy entity/third party/animals/force
majeure/unknown/other
Ukraine Planned interruption with notice; Planned interruption without notice; Unplanned
(emergency) interruption through the fault of other licensees or consumers; force majeure; Unplanned (emergency) interruption through the fault of others; Unplanned (emergency)
interruption due to the technical failures in the electrical network of the licensee.
All Yes
UnMik Planned and unplanned interruptions. All Yes interruptions that result from distribution system faults.
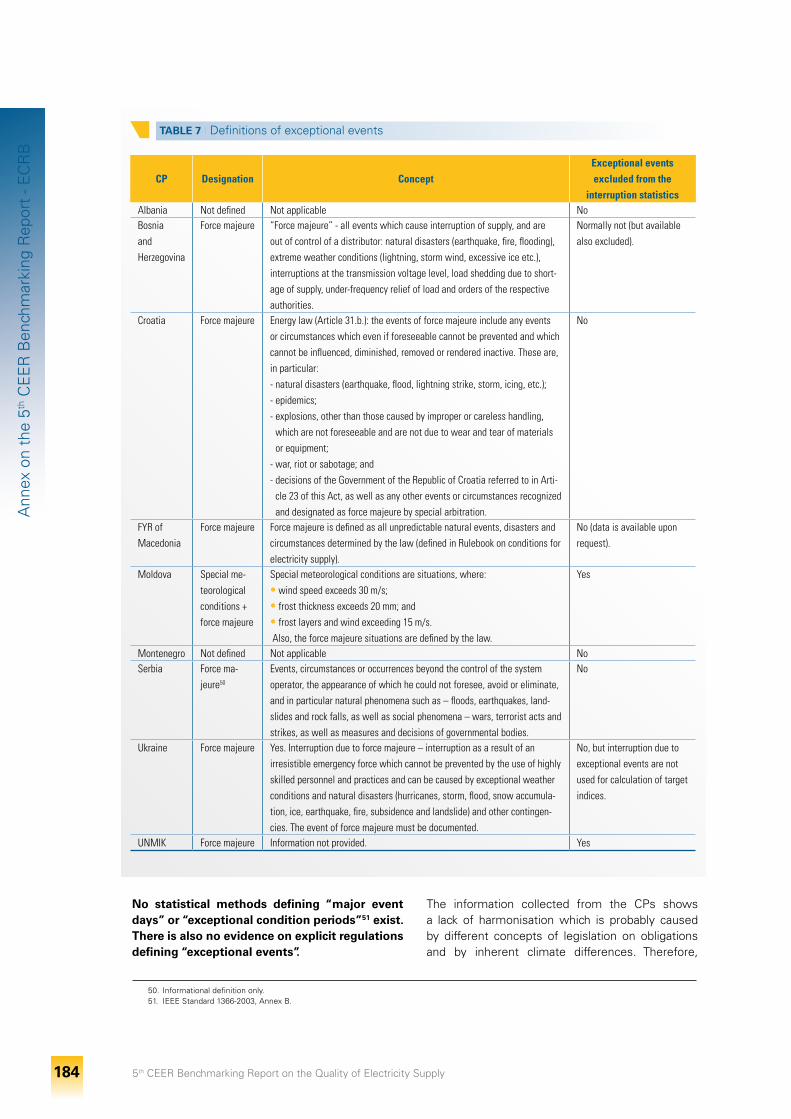
5th CEER Benchmarking Report on the Quality of Electricity Supply 184
Ann
ex o
n th
e 5th
CE
ER
Ben
chm
arki
ng R
epor
t - E
CR
B
No statistical methods defining “major event days” or “exceptional condition periods”51 exist. There is also no evidence on explicit regulations defining “exceptional events”.
TABLE 7 I Definitions of exceptional events
CP Designation ConceptExceptional events excluded from the
interruption statisticsAlbania not defined not applicable noBosniaandHerzegovina
Force majeure “Force majeure” - all events which cause interruption of supply, and are out of control of a distributor: natural disasters (earthquake, fire, flooding), extreme weather conditions (lightning, storm wind, excessive ice etc.), interruptions at the transmission voltage level, load shedding due to short-age of supply, under-frequency relief of load and orders of the respective authorities.
normally not (but available also excluded).
Croatia Force majeure Energy law (Article 31.b.): the events of force majeure include any events or circumstances which even if foreseeable cannot be prevented and which cannot be influenced, diminished, removed or rendered inactive. These are, in particular: - natural disasters (earthquake, flood, lightning strike, storm, icing, etc.);- epidemics; - explosions, other than those caused by improper or careless handling,
which are not foreseeable and are not due to wear and tear of materials or equipment;
- war, riot or sabotage; and - decisions of the Government of the Republic of Croatia referred to in Arti-
cle 23 of this Act, as well as any other events or circumstances recognized and designated as force majeure by special arbitration.
no
FYR of Macedonia
Force majeure Force majeure is defined as all unpredictable natural events, disasters and circumstances determined by the law (defined in Rulebook on conditions for electricity supply).
no (data is available upon request).
Moldova Special me-teorological conditions + force majeure
Special meteorological conditions are situations, where: • wind speed exceeds 30 m/s; • frost thickness exceeds 20 mm; and • frost layers and wind exceeding 15 m/s. Also, the force majeure situations are defined by the law.
Yes
Montenegro not defined not applicable noSerbia Force ma-
jeure50
Events, circumstances or occurrences beyond the control of the system operator, the appearance of which he could not foresee, avoid or eliminate, and in particular natural phenomena such as – floods, earthquakes, land-slides and rock falls, as well as social phenomena – wars, terrorist acts and strikes, as well as measures and decisions of governmental bodies.
no
Ukraine Force majeure Yes. interruption due to force majeure – interruption as a result of an irresistible emergency force which cannot be prevented by the use of highly skilled personnel and practices and can be caused by exceptional weather conditions and natural disasters (hurricanes, storm, flood, snow accumula-tion, ice, earthquake, fire, subsidence and landslide) and other contingen-cies. The event of force majeure must be documented.
no, but interruption due to exceptional events are not used for calculation of target indices.
UnMik Force majeure information not provided. Yes
50. Informational definition only. 51. IEEE Standard 1366-2003, Annex B.
The information collected from the CPs shows a lack of harmonisation which is probably caused by different concepts of legislation on obligations and by inherent climate differences. Therefore,
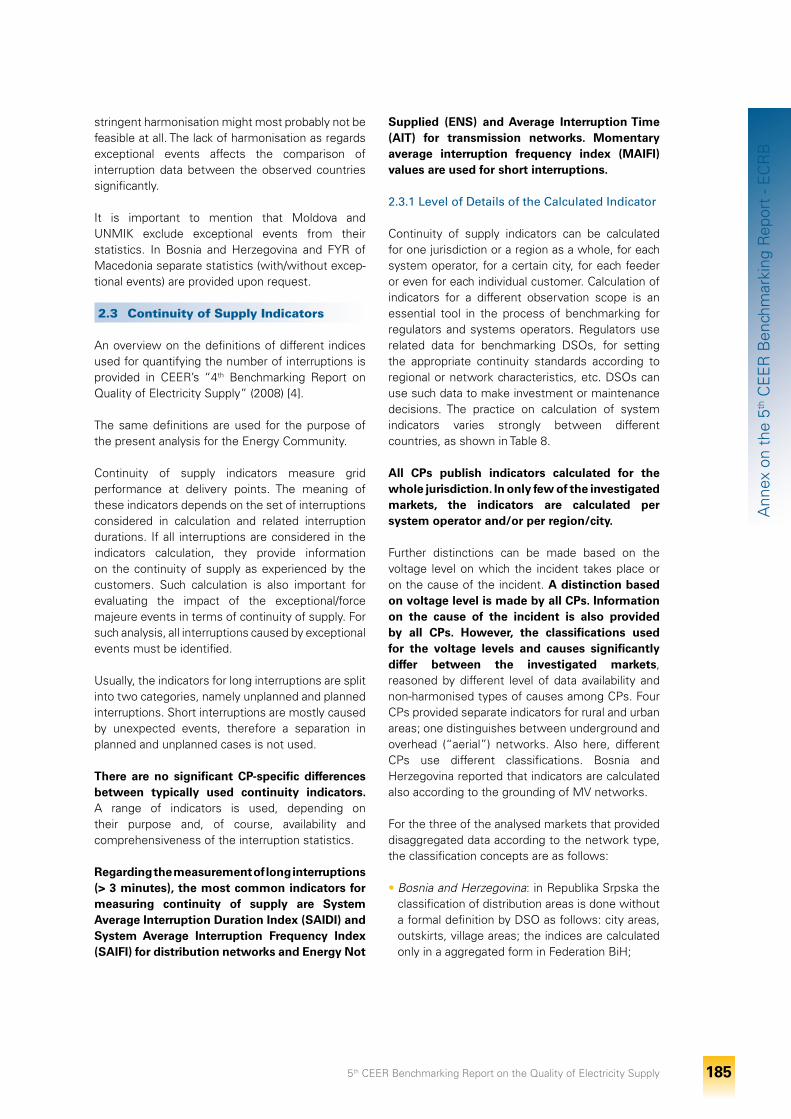
5th CEER Benchmarking Report on the Quality of Electricity Supply 185
Ann
ex o
n th
e 5th
CE
ER
Ben
chm
arki
ng R
epor
t - E
CR
B
stringent harmonisation might most probably not be feasible at all. The lack of harmonisation as regards exceptional events affects the comparison of interruption data between the observed countries significantly.
It is important to mention that Moldova and UNMIK exclude exceptional events from their statistics. In Bosnia and Herzegovina and FYR of Macedonia separate statistics (with/without excep-tional events) are provided upon request.
2.3 Continuity of Supply Indicators
An overview on the definitions of different indices used for quantifying the number of interruptions is provided in CEER’s “4th Benchmarking Report on Quality of Electricity Supply” (2008) [4].
The same definitions are used for the purpose of the present analysis for the Energy Community.
Continuity of supply indicators measure grid performance at delivery points. The meaning of these indicators depends on the set of interruptions considered in calculation and related interruption durations. If all interruptions are considered in the indicators calculation, they provide information on the continuity of supply as experienced by the customers. Such calculation is also important for evaluating the impact of the exceptional/force majeure events in terms of continuity of supply. For such analysis, all interruptions caused by exceptional events must be identified.
Usually, the indicators for long interruptions are split into two categories, namely unplanned and planned interruptions. Short interruptions are mostly caused by unexpected events, therefore a separation in planned and unplanned cases is not used.
There are no significant CP-specific differences between typically used continuity indicators. A range of indicators is used, depending on their purpose and, of course, availability and comprehensiveness of the interruption statistics.
Regarding the measurement of long interruptions (> 3 minutes), the most common indicators for measuring continuity of supply are System Average Interruption Duration Index (SAIDI) and System Average Interruption Frequency Index (SAIFI) for distribution networks and Energy Not
Supplied (ENS) and Average Interruption Time (AIT) for transmission networks. Momentary average interruption frequency index (MAIFI) values are used for short interruptions.
2.3.1 Level of Details of the Calculated Indicator
Continuity of supply indicators can be calculated for one jurisdiction or a region as a whole, for each system operator, for a certain city, for each feeder or even for each individual customer. Calculation of indicators for a different observation scope is an essential tool in the process of benchmarking for regulators and systems operators. Regulators use related data for benchmarking DSOs, for setting the appropriate continuity standards according to regional or network characteristics, etc. DSOs can use such data to make investment or maintenance decisions. The practice on calculation of system indicators varies strongly between different countries, as shown in Table 8.
All CPs publish indicators calculated for the whole jurisdiction. In only few of the investigated markets, the indicators are calculated per system operator and/or per region/city.
Further distinctions can be made based on the voltage level on which the incident takes place or on the cause of the incident. A distinction based on voltage level is made by all CPs. Information on the cause of the incident is also provided by all CPs. However, the classifications used for the voltage levels and causes significantly differ between the investigated markets, reasoned by different level of data availability and non-harmonised types of causes among CPs. Four CPs provided separate indicators for rural and urban areas; one distinguishes between underground and overhead (“aerial”) networks. Also here, different CPs use different classifications. Bosnia and Herzegovina reported that indicators are calculated also according to the grounding of MV networks.
For the three of the analysed markets that provided disaggregated data according to the network type, the classification concepts are as follows:
• Bosnia and Herzegovina: in Republika Srpska the classification of distribution areas is done without a formal definition by DSO as follows: city areas, outskirts, village areas; the indices are calculated only in a aggregated form in Federation BiH;
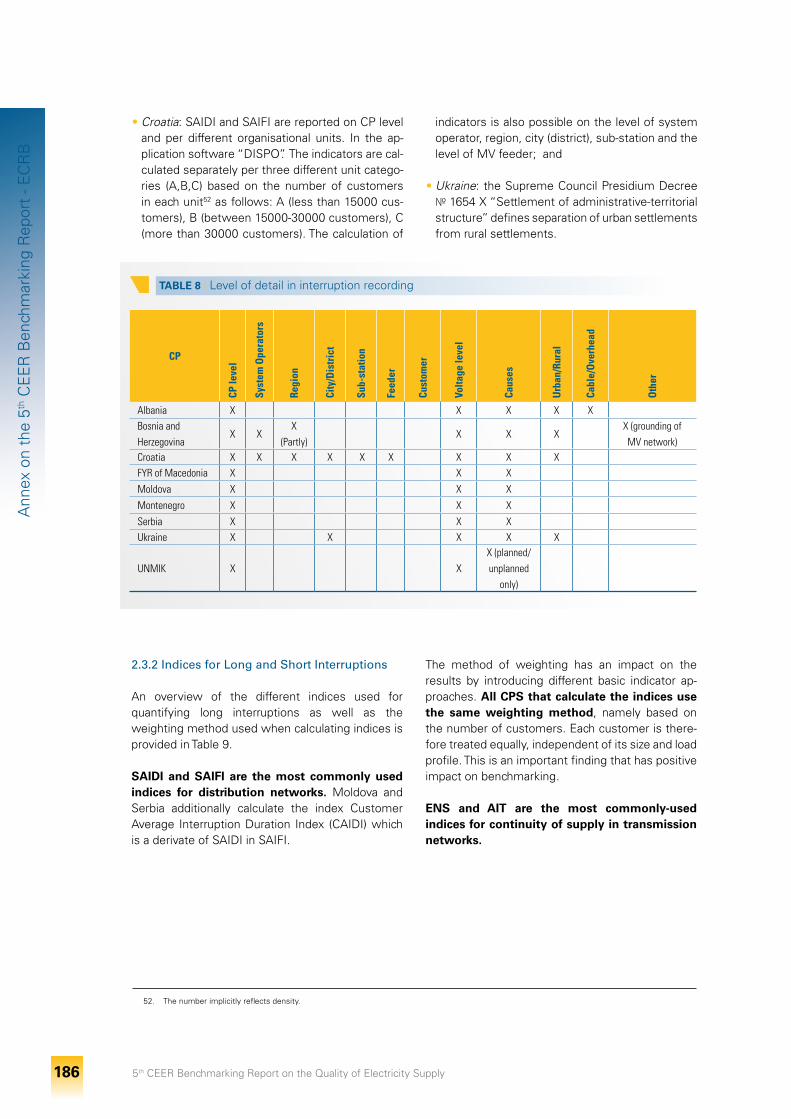
5th CEER Benchmarking Report on the Quality of Electricity Supply 186
Ann
ex o
n th
e 5th
CE
ER
Ben
chm
arki
ng R
epor
t - E
CR
B
• Croatia: SAIDI and SAIFI are reported on CP level and per different organisational units. In the ap-plication software “DISPO”. The indicators are cal-culated separately per three different unit catego-ries (A,B,C) based on the number of customers in each unit52 as follows: A (less than 15000 cus-tomers), B (between 15000-30000 customers), C (more than 30000 customers). The calculation of
indicators is also possible on the level of system operator, region, city (district), sub-station and the level of MV feeder; and
• Ukraine: the Supreme Council Presidium Decree № 1654 X “Settlement of administrative-territorial structure” defines separation of urban settlements from rural settlements.
52. The number implicitly reflects density.
The method of weighting has an impact on the results by introducing different basic indicator ap-proaches. All CPS that calculate the indices use the same weighting method, namely based on the number of customers. Each customer is there-fore treated equally, independent of its size and load profile. This is an important finding that has positive impact on benchmarking.
ENS and AIT are the most commonly-used indices for continuity of supply in transmission networks.
2.3.2 Indices for Long and Short Interruptions
An overview of the different indices used for quantifying long interruptions as well as the weighting method used when calculating indices is provided in Table 9.
SAIDI and SAIFI are the most commonly used indices for distribution networks. Moldova and Serbia additionally calculate the index Customer Average Interruption Duration Index (CAIDI) which is a derivate of SAIDI in SAIFI.
TABLE 8 I Level of detail in interruption recording
CP
CP le
vel
Syst
em O
pera
tors
Regi
on
City
/Dis
tric
t
Sub-
stat
ion
Feed
er
Cust
omer
Volta
ge le
vel
Caus
es
Urb
an/R
ural
Cabl
e/O
verh
ead
Oth
er
Albania X X X X X Bosnia and Herzegovina
X XX
(Partly) X X X
X (grounding of MV network)
Croatia X X X X X X X X X FYR of Macedonia X X X
Moldova X X X
Montenegro X X X
Serbia X X X Ukraine X X X X X
UnMik X XX (planned/unplanned
only)
5th CEER Benchmarking Report on the Quality of Electricity Supply 187
Ann
ex o
n th
e 5th
CE
ER
Ben
chm
arki
ng R
epor
t - E
CR
B
TABLE 9 I Long interruption – indices for quantifying
CP Index Weighting (N/A for ENS)
AlbaniaRaw data on interruption properties and
location of interruption only.The number of customers (identified
manually).
Bosnia and HerzegovinaSAiDi & SAiFi
EnS (transmission)The number of customers (manually, using
the connectivity models or estimated).
Croatia SAiDi & SAiFiThe number of customers (enumerated
manually or estimated).
FYR of Macedonia none not applicable (no rules, SCADA is used on
HV level).
MoldovaSAiDi, SAiFi, CAiDi,
EnS, AiT (transmission - data not yet available)
The number of customers (automatically through the connectivity model).
Montenegro none53 not applicable
SerbiaDistribution -SAiDi, SAiFi, CAiDi;
AiT, EnS (transmission);
Distribution indicators (SAiDi, SAiFi) - number of customers; transmission
indicators (AiT)- average power supplied (weighting is done manually according to the
RA rules).
UkraineSAiDi, SAiFi,
EnS (transmission - data not yet available)
The number of customers (according to the average number of customers per MV/
LV transformer and average number of customers per LV feeder).
UnMikSAiDi, SAiFi,
EnS (transmission)The number of customers (manually by DSO).
53. TSO and DSO are not obliged to provide data on interruptions (AIT, ENS, SAIDI, SAIFI, CAIDI …). RA plans to introduce such obligations in the future.
The number of short interruptions per year (MAIFI) is used as indicator in Bosnia and Herzegovina (but only for the distribution network of the power utility “Elektroprivreda Republike Srpske”) and in Ukraine, based on SCADA, where available. None of the CPs gathers data on transient interruptions.
Bosnia and Herzegovina – recording of short interruptions
In Bosnia and Herzegovina, the majority of DSOs use equipment for remote supervision and control installed (except for the facilities of one of the five distribution companies in Republika Srpska that uses SCADA at MV level). Short interruptions are recorded manually and stored locally in registers (records on outages). Short interruptions are recorded manually by the staff on duty. Registered data is consolidated in the main dispatching centres for the distribution network control. This data is also subject to checks by the RA staff during monitoring activities.
Ukraine – recording of short interruptions
Only few DSOs have SCADA installed. Almost all of them have a remote control or signaling system on MV and HV levels. Short interruptions are recorded manually by the staff on duty in the operator’s journal (paper event log) on the basis of remote control and signaling: SCADA (if available); and call from the staff in transformer substation.
Data is transferred to the electronic register and sent to the RA.
5th CEER Benchmarking Report on the Quality of Electricity Supply 188
Ann
ex o
n th
e 5th
CE
ER
Ben
chm
arki
ng R
epor
t - E
CR
B
2.4 Analysis of Data on Continuity of Supply
This section provides an overview of the CPs´ networks and compares the values of the most important indicators over a number of years. Even though the calculation methods slightly differ between the analysed markets, the results are shown in the same diagrams. When interpreting the results, the differences in calculation and scope of monitoring (voltage levels) should be considered.
Albania and Montenegro did not provide answers and are therefore not reflected in the assessment. FYR of Macedonia provided some data on the number and duration for long and short interruptions for different voltage levels, however data on indices is not available.
The other CPs54 provided very different sets of data on indicators. In terms of the diversity of indicators used, Croatia, Bosnia and Herzegovina and Ukraine provided the most comprehensive responses.
However, some of the indices provided by Bosnia and Herzegovina did not cover the whole jurisdiction55. The indices calculated on CP level have been provided to the extent possible, aggregating the contribution from Federation BiH (F-BiH) and Republika Srpska56.
Some CPs provided data both with and without exceptional events57, whereas others58 provided one dataset or the other, mainly due to problems related to the identification of exceptional events. The majority of analysed markets (7 out of 9) do not exclude exceptional events from their statistics on continuity of supply. Only in Croatia all reported indices explicitly comprise the interruptions due to
exceptional events59. For ensuring comparability, data on indices that exclude exceptional events provided by some CPs is therefore excluded from the assessment.
For the purpose of this benchmarking it is crucial to exclude the influence of CP specific factors from indices, caused by non-harmonised proprietary rules applied for interruption monitoring. The typical example is the influence of exceptional events. As it was not possible to neutralize the consequences of these differences between the CPs from the reported CoS index values by excluding the impact of exceptional events60, it is also very difficult to assess how exceptional events influence the interruption statistics of each CP. Accordingly, any conclusion concerning the level of continuity of supply that exclusive relates to the responsibility of the performance of system operators is not feasible.
Due to the lack of availability of required data and problems of comparability, the benchmarking analysis is focused on the indices that have been provided by at least four CPs61:
• representing the value aggregated on CP level;• comprising interruptions at all voltage levels
monitored; and• including the interruptions caused by exceptional
events.
Furthermore, some additional analysis on the impact of planned interruptions is shown in the total statistics.
The reported set of indices per CP and the indices that are used in comparison (bold “X”) are shown in Table 10.
54. Covering HV, MV and aggregation (HV+MV) for both unplanned and planned interruptions.55. There is no data available for a separate administrative unit in Brcko District.56. Usually, data is available, split among the power utilities as follows: [1] Power Utility “Elektroprivreda Republike Srpske” (E RS); data refers to Repub-
lika Srpska; [2] Power Utility “Elektorprivreda BiH” and the Power Utility “Elektroprivreda HZHB”; data refers to Federation BiH (FBiH).57. Bosnia and Herzegovina and Ukraine.58. Croatia, Moldova, Serbia and UNMIK.59. Regardless of the classification of the indices in the questionnaire. 60. Exceptional events are mostly not excluded from the interruption statistics. 61. The same type of index has been benchmarked by CEER.
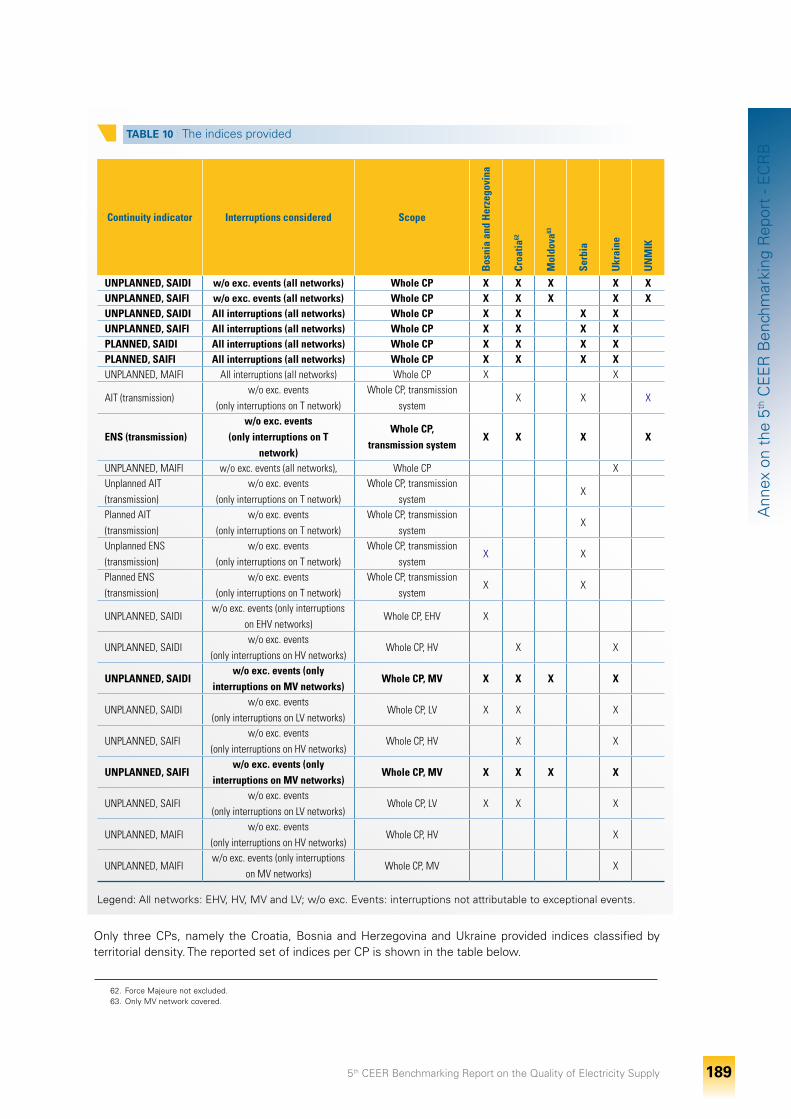
5th CEER Benchmarking Report on the Quality of Electricity Supply 189
Ann
ex o
n th
e 5th
CE
ER
Ben
chm
arki
ng R
epor
t - E
CR
B
TABLE 10 I The indices provided
Continuity indicator Interruptions considered Scope
Bos
nia
and
Her
zego
vina
Croa
tia62
Mol
dova
63
Serb
ia
Ukr
aine
UN
MIK
UNPLANNED, SAIDI w/o exc. events (all networks) Whole CP X X X X XUNPLANNED, SAIFI w/o exc. events (all networks) Whole CP X X X X XUNPLANNED, SAIDI All interruptions (all networks) Whole CP X X X XUNPLANNED, SAIFI All interruptions (all networks) Whole CP X X X XPLANNED, SAIDI All interruptions (all networks) Whole CP X X X XPLANNED, SAIFI All interruptions (all networks) Whole CP X X X XUnPLAnnED, MAiFi All interruptions (all networks) Whole CP X X
AiT (transmission)w/o exc. events
(only interruptions on T network)Whole CP, transmission
systemX X X
ENS (transmission)w/o exc. events
(only interruptions on T network)
Whole CP, transmission system
X X X X
UnPLAnnED, MAiFi w/o exc. events (all networks), Whole CP XUnplanned AiT (transmission)
w/o exc. events(only interruptions on T network)
Whole CP, transmission system
X
Planned AiT (transmission)
w/o exc. events(only interruptions on T network)
Whole CP, transmission system
X
Unplanned EnS (transmission)
w/o exc. events(only interruptions on T network)
Whole CP, transmission system
X X
Planned EnS (transmission)
w/o exc. events(only interruptions on T network)
Whole CP, transmission system
X X
UnPLAnnED, SAiDiw/o exc. events (only interruptions
on EHV networks)Whole CP, EHV X
UnPLAnnED, SAiDiw/o exc. events
(only interruptions on HV networks)Whole CP, HV X X
UNPLANNED, SAIDIw/o exc. events (only
interruptions on MV networks)Whole CP, MV X X X X
UnPLAnnED, SAiDiw/o exc. events
(only interruptions on LV networks)Whole CP, LV X X X
UnPLAnnED, SAiFiw/o exc. events
(only interruptions on HV networks)Whole CP, HV X X
UNPLANNED, SAIFIw/o exc. events (only
interruptions on MV networks)Whole CP, MV X X X X
UnPLAnnED, SAiFiw/o exc. events
(only interruptions on LV networks)Whole CP, LV X X X
UnPLAnnED, MAiFiw/o exc. events
(only interruptions on HV networks)Whole CP, HV X
UnPLAnnED, MAiFiw/o exc. events (only interruptions
on MV networks)Whole CP, MV X
Legend: All networks: EHV, HV, MV and LV; w/o exc. Events: interruptions not attributable to exceptional events.
Only three CPs, namely the Croatia, Bosnia and Herzegovina and Ukraine provided indices classified by territorial density. The reported set of indices per CP is shown in the table below.
62. Force Majeure not excluded. 63. Only MV network covered.
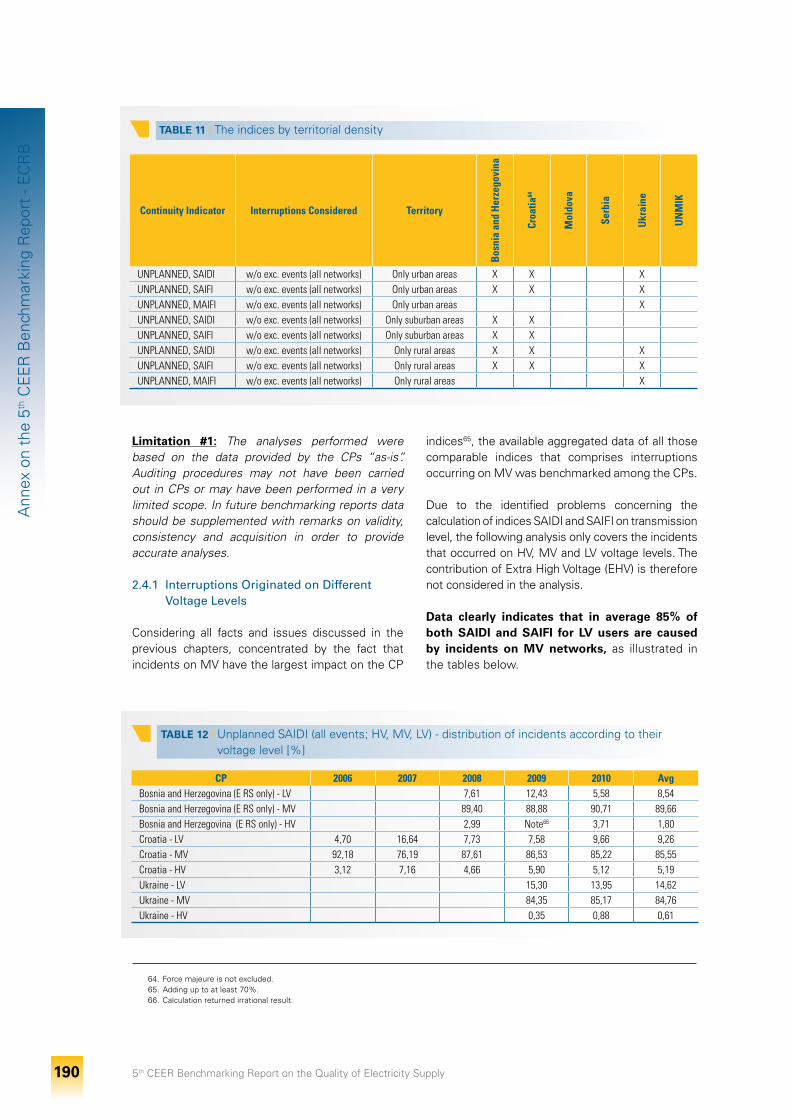
5th CEER Benchmarking Report on the Quality of Electricity Supply 190
Ann
ex o
n th
e 5th
CE
ER
Ben
chm
arki
ng R
epor
t - E
CR
B
Limitation #1: The analyses performed were based on the data provided by the CPs “as-is”. Auditing procedures may not have been carried out in CPs or may have been performed in a very limited scope. In future benchmarking reports data should be supplemented with remarks on validity, consistency and acquisition in order to provide accurate analyses.
2.4.1 Interruptions Originated on Different Voltage Levels
Considering all facts and issues discussed in the previous chapters, concentrated by the fact that incidents on MV have the largest impact on the CP
indices65, the available aggregated data of all those comparable indices that comprises interruptions occurring on MV was benchmarked among the CPs.
Due to the identified problems concerning the calculation of indices SAIDI and SAIFI on transmission level, the following analysis only covers the incidents that occurred on HV, MV and LV voltage levels. The contribution of Extra High Voltage (EHV) is therefore not considered in the analysis.
Data clearly indicates that in average 85% of both SAIDI and SAIFI for LV users are caused by incidents on MV networks, as illustrated in the tables below.
64. Force majeure is not excluded. 65. Adding up to at least 70%. 66. Calculation returned irrational result.
TABLE 11 I The indices by territorial density
Continuity Indicator Interruptions Considered Territory
Bos
nia
and
Her
zego
vina
Croa
tia64
Mol
dova
Serb
ia
Ukr
aine
UN
MIK
UnPLAnnED, SAiDi w/o exc. events (all networks) Only urban areas X X X UnPLAnnED, SAiFi w/o exc. events (all networks) Only urban areas X X X UnPLAnnED, MAiFi w/o exc. events (all networks) Only urban areas X UnPLAnnED, SAiDi w/o exc. events (all networks) Only suburban areas X X UnPLAnnED, SAiFi w/o exc. events (all networks) Only suburban areas X X UnPLAnnED, SAiDi w/o exc. events (all networks) Only rural areas X X X UnPLAnnED, SAiFi w/o exc. events (all networks) Only rural areas X X X UnPLAnnED, MAiFi w/o exc. events (all networks) Only rural areas X
TABLE 12 I Unplanned SAIDI (all events; HV, MV, LV) - distribution of incidents according to their voltage level [%]
CP 2006 2007 2008 2009 2010 AvgBosnia and Herzegovina (E RS only) - LV 7,61 12,43 5,58 8,54Bosnia and Herzegovina (E RS only) - MV 89,40 88,88 90,71 89,66Bosnia and Herzegovina (E RS only) - HV 2,99 note66 3,71 1,80Croatia - LV 4,70 16,64 7,73 7,58 9,66 9,26Croatia - MV 92,18 76,19 87,61 86,53 85,22 85,55Croatia - HV 3,12 7,16 4,66 5,90 5,12 5,19Ukraine - LV 15,30 13,95 14,62Ukraine - MV 84,35 85,17 84,76Ukraine - HV 0,35 0,88 0,61
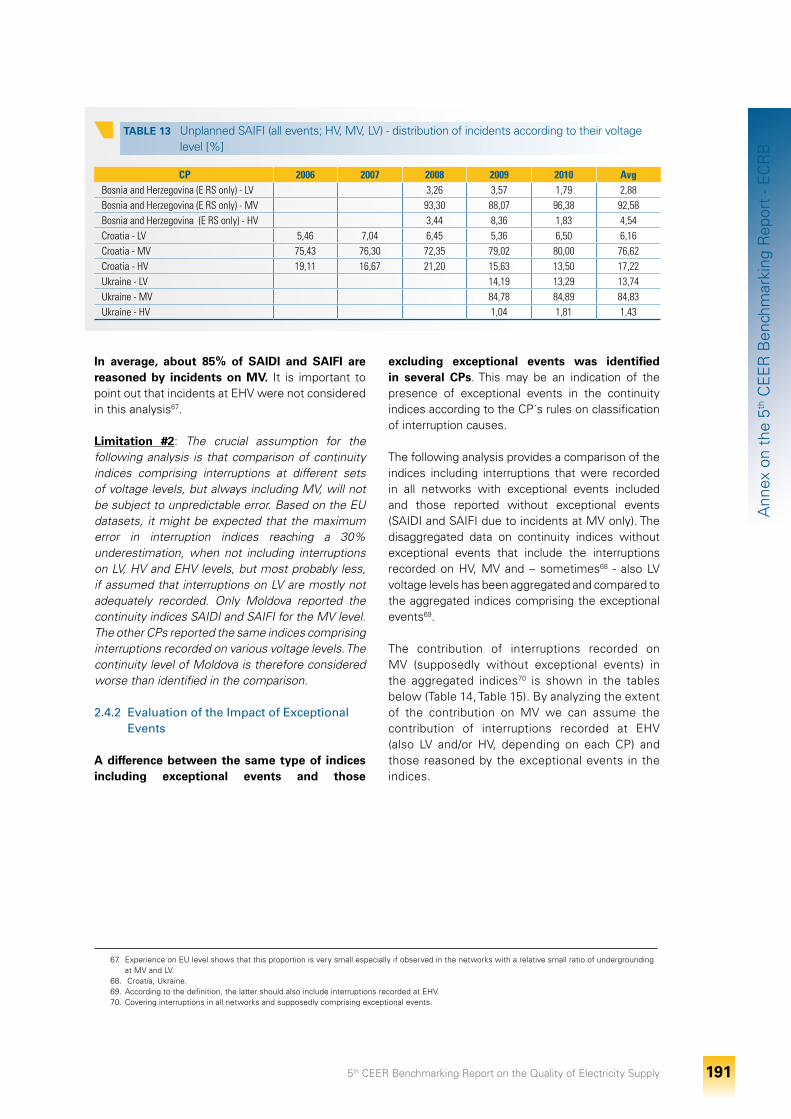
5th CEER Benchmarking Report on the Quality of Electricity Supply 191
Ann
ex o
n th
e 5th
CE
ER
Ben
chm
arki
ng R
epor
t - E
CR
B
In average, about 85% of SAIDI and SAIFI are reasoned by incidents on MV. It is important to point out that incidents at EHV were not considered in this analysis67.
Limitation #2: The crucial assumption for the following analysis is that comparison of continuity indices comprising interruptions at different sets of voltage levels, but always including MV, will not be subject to unpredictable error. Based on the EU datasets, it might be expected that the maximum error in interruption indices reaching a 30% underestimation, when not including interruptions on LV, HV and EHV levels, but most probably less, if assumed that interruptions on LV are mostly not adequately recorded. Only Moldova reported the continuity indices SAIDI and SAIFI for the MV level. The other CPs reported the same indices comprising interruptions recorded on various voltage levels. The continuity level of Moldova is therefore considered worse than identified in the comparison.
2.4.2 Evaluation of the Impact of Exceptional Events
A difference between the same type of indices including exceptional events and those
excluding exceptional events was identified in several CPs. This may be an indication of the presence of exceptional events in the continuity indices according to the CP´s rules on classification of interruption causes.
The following analysis provides a comparison of the indices including interruptions that were recorded in all networks with exceptional events included and those reported without exceptional events (SAIDI and SAIFI due to incidents at MV only). The disaggregated data on continuity indices without exceptional events that include the interruptions recorded on HV, MV and – sometimes68 - also LV voltage levels has been aggregated and compared to the aggregated indices comprising the exceptional events69.
The contribution of interruptions recorded on MV (supposedly without exceptional events) in the aggregated indices70 is shown in the tables below (Table 14, Table 15). By analyzing the extent of the contribution on MV we can assume the contribution of interruptions recorded at EHV (also LV and/or HV, depending on each CP) and those reasoned by the exceptional events in the indices.
67. Experience on EU level shows that this proportion is very small especially if observed in the networks with a relative small ratio of undergrounding at MV and LV.
68. Croatia, Ukraine.69. According to the definition, the latter should also include interruptions recorded at EHV.70. Covering interruptions in all networks and supposedly comprising exceptional events.
TABLE 13 I Unplanned SAIFI (all events; HV, MV, LV) - distribution of incidents according to their voltage level [%]
CP 2006 2007 2008 2009 2010 AvgBosnia and Herzegovina (E RS only) - LV 3,26 3,57 1,79 2,88Bosnia and Herzegovina (E RS only) - MV 93,30 88,07 96,38 92,58Bosnia and Herzegovina (E RS only) - HV 3,44 8,36 1,83 4,54Croatia - LV 5,46 7,04 6,45 5,36 6,50 6,16Croatia - MV 75,43 76,30 72,35 79,02 80,00 76,62Croatia - HV 19,11 16,67 21,20 15,63 13,50 17,22Ukraine - LV 14,19 13,29 13,74Ukraine - MV 84,78 84,89 84,83Ukraine - HV 1,04 1,81 1,43
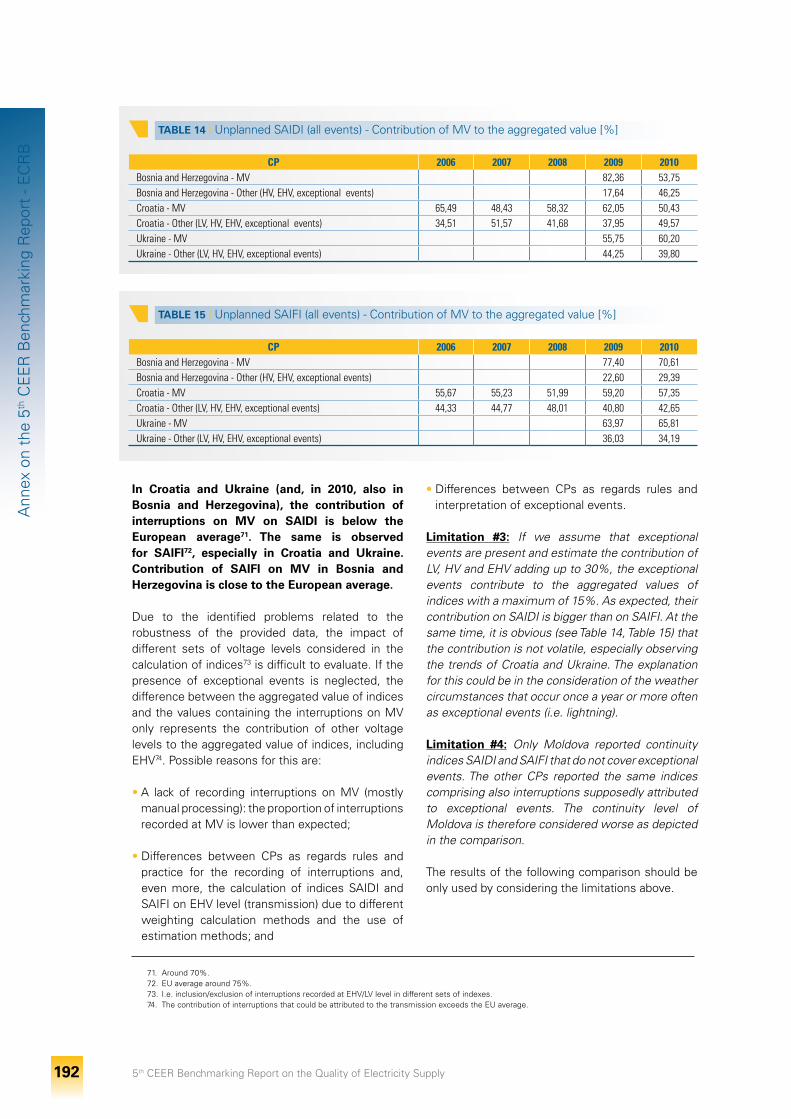
5th CEER Benchmarking Report on the Quality of Electricity Supply 192
Ann
ex o
n th
e 5th
CE
ER
Ben
chm
arki
ng R
epor
t - E
CR
B
In Croatia and Ukraine (and, in 2010, also in Bosnia and Herzegovina), the contribution of interruptions on MV on SAIDI is below the European average71. The same is observed for SAIFI72, especially in Croatia and Ukraine. Contribution of SAIFI on MV in Bosnia and Herzegovina is close to the European average.
Due to the identified problems related to the robustness of the provided data, the impact of different sets of voltage levels considered in the calculation of indices73 is difficult to evaluate. If the presence of exceptional events is neglected, the difference between the aggregated value of indices and the values containing the interruptions on MV only represents the contribution of other voltage levels to the aggregated value of indices, including EHV74. Possible reasons for this are:
• A lack of recording interruptions on MV (mostly manual processing): the proportion of interruptions recorded at MV is lower than expected;
• Differences between CPs as regards rules and practice for the recording of interruptions and, even more, the calculation of indices SAIDI and SAIFI on EHV level (transmission) due to different weighting calculation methods and the use of estimation methods; and
• Differences between CPs as regards rules and interpretation of exceptional events.
Limitation #3: If we assume that exceptional events are present and estimate the contribution of LV, HV and EHV adding up to 30%, the exceptional events contribute to the aggregated values of indices with a maximum of 15%. As expected, their contribution on SAIDI is bigger than on SAIFI. At the same time, it is obvious (see Table 14, Table 15) that the contribution is not volatile, especially observing the trends of Croatia and Ukraine. The explanation for this could be in the consideration of the weather circumstances that occur once a year or more often as exceptional events (i.e. lightning).
Limitation #4: Only Moldova reported continuity indices SAIDI and SAIFI that do not cover exceptional events. The other CPs reported the same indices comprising also interruptions supposedly attributed to exceptional events. The continuity level of Moldova is therefore considered worse as depicted in the comparison.
The results of the following comparison should be only used by considering the limitations above.
TABLE 15 I Unplanned SAIFI (all events) - Contribution of MV to the aggregated value [%]
CP 2006 2007 2008 2009 2010Bosnia and Herzegovina - MV 77,40 70,61Bosnia and Herzegovina - Other (HV, EHV, exceptional events) 22,60 29,39Croatia - MV 55,67 55,23 51,99 59,20 57,35Croatia - Other (LV, HV, EHV, exceptional events) 44,33 44,77 48,01 40,80 42,65Ukraine - MV 63,97 65,81Ukraine - Other (LV, HV, EHV, exceptional events) 36,03 34,19
71. Around 70%.72. EU average around 75%.73. I.e. inclusion/exclusion of interruptions recorded at EHV/LV level in different sets of indexes.74. The contribution of interruptions that could be attributed to the transmission exceeds the EU average.
TABLE 14 I Unplanned SAIDI (all events) - Contribution of MV to the aggregated value [%]
CP 2006 2007 2008 2009 2010Bosnia and Herzegovina - MV 82,36 53,75Bosnia and Herzegovina - Other (HV, EHV, exceptional events) 17,64 46,25Croatia - MV 65,49 48,43 58,32 62,05 50,43Croatia - Other (LV, HV, EHV, exceptional events) 34,51 51,57 41,68 37,95 49,57Ukraine - MV 55,75 60,20Ukraine - Other (LV, HV, EHV, exceptional events) 44,25 39,80
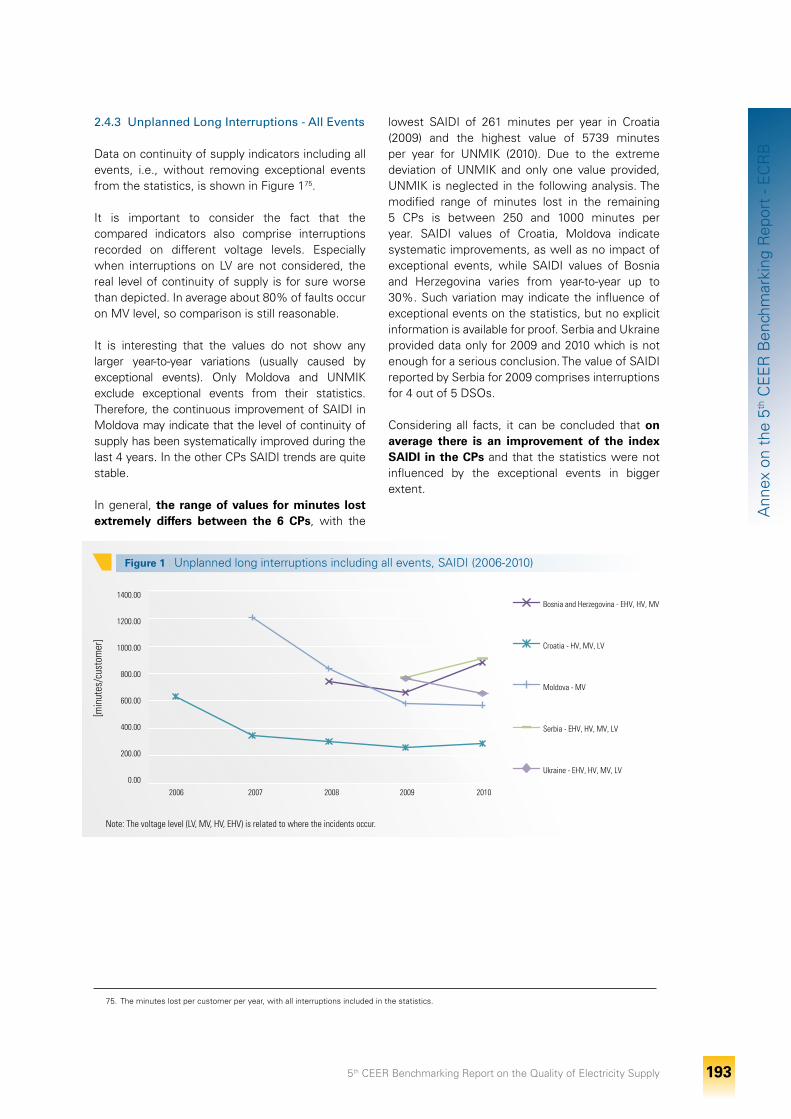
5th CEER Benchmarking Report on the Quality of Electricity Supply 193
Ann
ex o
n th
e 5th
CE
ER
Ben
chm
arki
ng R
epor
t - E
CR
B
2.4.3 Unplanned Long Interruptions - All Events
Data on continuity of supply indicators including all events, i.e., without removing exceptional events from the statistics, is shown in Figure 175.
It is important to consider the fact that the compared indicators also comprise interruptions recorded on different voltage levels. Especially when interruptions on LV are not considered, the real level of continuity of supply is for sure worse than depicted. In average about 80% of faults occur on MV level, so comparison is still reasonable.
It is interesting that the values do not show any larger year-to-year variations (usually caused by exceptional events). Only Moldova and UNMIK exclude exceptional events from their statistics. Therefore, the continuous improvement of SAIDI in Moldova may indicate that the level of continuity of supply has been systematically improved during the last 4 years. In the other CPs SAIDI trends are quite stable.
In general, the range of values for minutes lost extremely differs between the 6 CPs, with the
lowest SAIDI of 261 minutes per year in Croatia (2009) and the highest value of 5739 minutes per year for UNMIK (2010). Due to the extreme deviation of UNMIK and only one value provided, UNMIK is neglected in the following analysis. The modified range of minutes lost in the remaining 5 CPs is between 250 and 1000 minutes per year. SAIDI values of Croatia, Moldova indicate systematic improvements, as well as no impact of exceptional events, while SAIDI values of Bosnia and Herzegovina varies from year-to-year up to 30%. Such variation may indicate the influence of exceptional events on the statistics, but no explicit information is available for proof. Serbia and Ukraine provided data only for 2009 and 2010 which is not enough for a serious conclusion. The value of SAIDI reported by Serbia for 2009 comprises interruptions for 4 out of 5 DSOs.
Considering all facts, it can be concluded that on average there is an improvement of the index SAIDI in the CPs and that the statistics were not influenced by the exceptional events in bigger extent.
75. The minutes lost per customer per year, with all interruptions included in the statistics.
Figure 1 I Unplanned long interruptions including all events, SAIDI (2006-2010)
1400.00
1200.00
1000.00
800.00
600.00
400.00
200.00
0.00
2006 2007 2008 2009 2010
[min
utes
/cus
tom
er]
Bosnia and Herzegovina - EHV, HV, MV
Croatia - HV, MV, LV
Moldova - MV
Serbia - EHV, HV, MV, LV
Ukraine - EHV, HV, MV, LV
note: The voltage level (LV, MV, HV, EHV) is related to where the incidents occur.
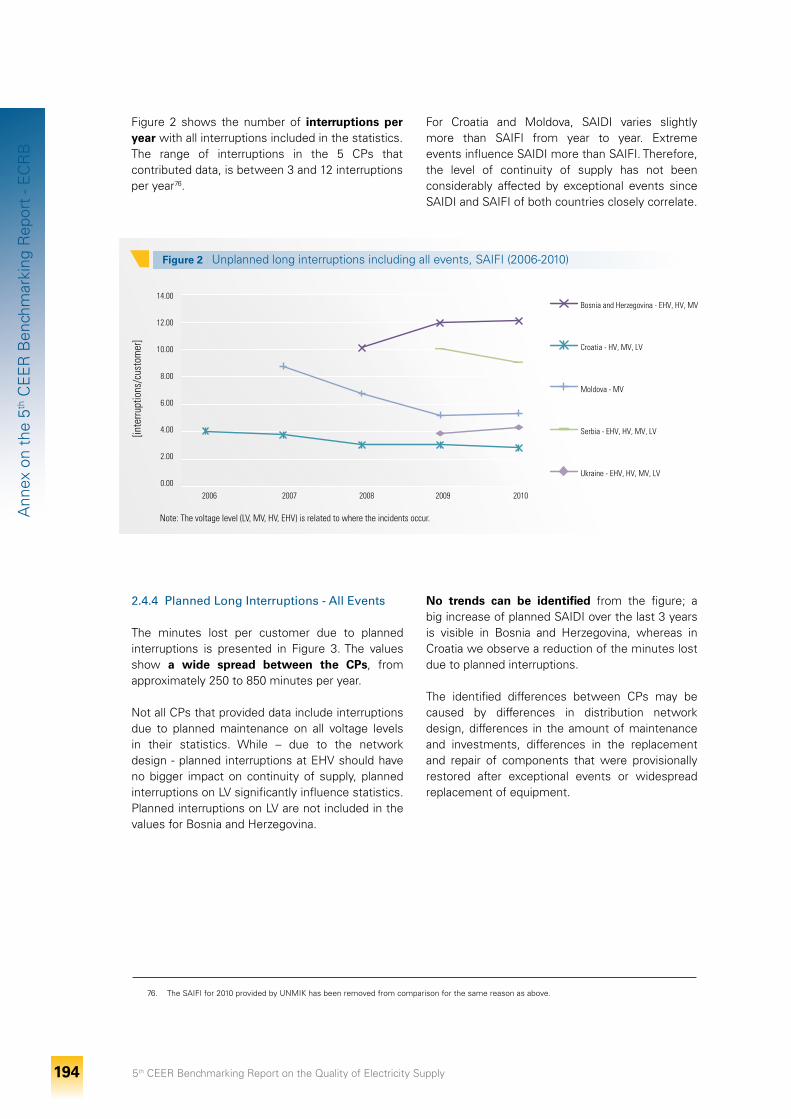
5th CEER Benchmarking Report on the Quality of Electricity Supply 194
Ann
ex o
n th
e 5th
CE
ER
Ben
chm
arki
ng R
epor
t - E
CR
B
Figure 2 shows the number of interruptions per year with all interruptions included in the statistics. The range of interruptions in the 5 CPs that contributed data, is between 3 and 12 interruptions per year76.
For Croatia and Moldova, SAIDI varies slightly more than SAIFI from year to year. Extreme events influence SAIDI more than SAIFI. Therefore, the level of continuity of supply has not been considerably affected by exceptional events since SAIDI and SAIFI of both countries closely correlate.
76. The SAIFI for 2010 provided by UNMIK has been removed from comparison for the same reason as above.
Figure 2 I Unplanned long interruptions including all events, SAIFI (2006-2010)
note: The voltage level (LV, MV, HV, EHV) is related to where the incidents occur.
14.00
12.00
10.00
8.00
6.00
4.00
2.00
0.00
[inte
rrupt
ions
/cus
tom
er]
2006 2007 2008 2009 2010
Bosnia and Herzegovina - EHV, HV, MV
Croatia - HV, MV, LV
Moldova - MV
Serbia - EHV, HV, MV, LV
Ukraine - EHV, HV, MV, LV
2.4.4 Planned Long Interruptions - All Events
The minutes lost per customer due to planned interruptions is presented in Figure 3. The values show a wide spread between the CPs, from approximately 250 to 850 minutes per year.
Not all CPs that provided data include interruptions due to planned maintenance on all voltage levels in their statistics. While – due to the network design - planned interruptions at EHV should have no bigger impact on continuity of supply, planned interruptions on LV significantly influence statistics. Planned interruptions on LV are not included in the values for Bosnia and Herzegovina.
No trends can be identified from the figure; a big increase of planned SAIDI over the last 3 years is visible in Bosnia and Herzegovina, whereas in Croatia we observe a reduction of the minutes lost due to planned interruptions.
The identified differences between CPs may be caused by differences in distribution network design, differences in the amount of maintenance and investments, differences in the replacement and repair of components that were provisionally restored after exceptional events or widespread replacement of equipment.
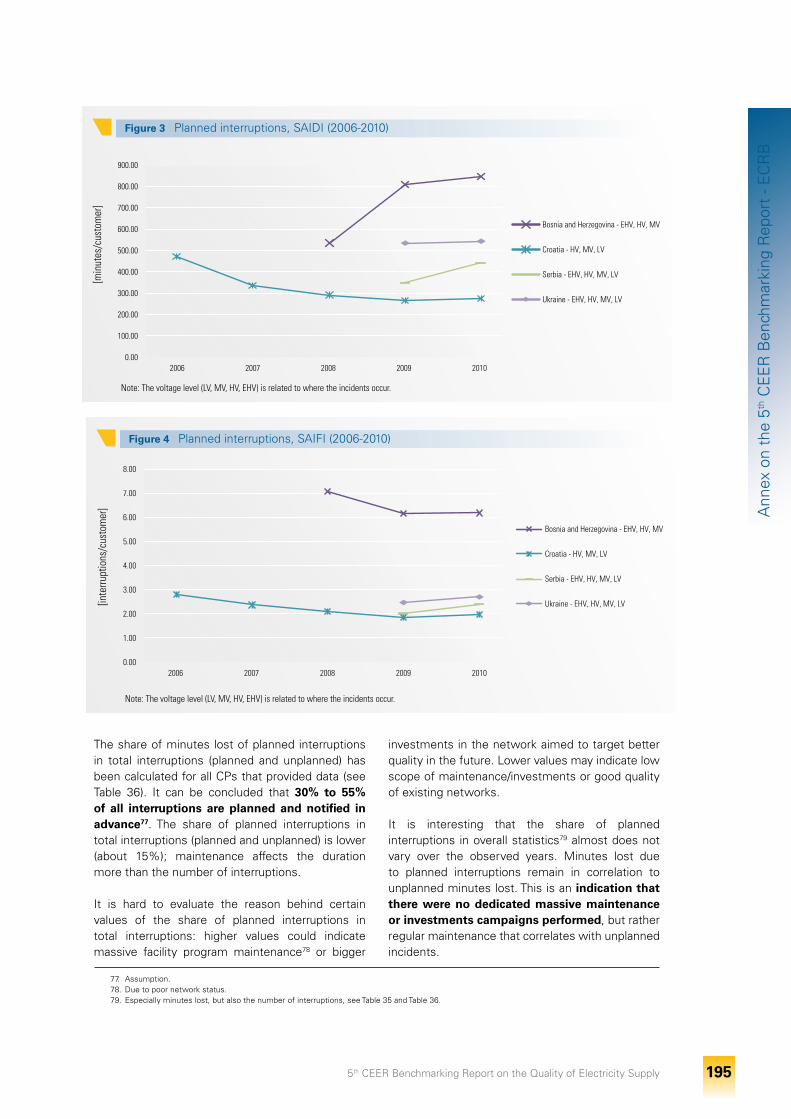
5th CEER Benchmarking Report on the Quality of Electricity Supply 195
Ann
ex o
n th
e 5th
CE
ER
Ben
chm
arki
ng R
epor
t - E
CR
B
77. Assumption.78. Due to poor network status. 79. Especially minutes lost, but also the number of interruptions, see Table 35 and Table 36.
Figure 3 I Planned interruptions, SAIDI (2006-2010)
note: The voltage level (LV, MV, HV, EHV) is related to where the incidents occur.
2006 2007 2008 2009 2010
[min
utes
/cus
tom
er]
0.00
100.00
200.00
300.00
400.00
500.00
600.00
700.00
800.00
900.00
Bosnia and Herzegovina - EHV, HV, MV
Croatia - HV, MV, LV
Serbia - EHV, HV, MV, LV
Ukraine - EHV, HV, MV, LV
Figure 4 I Planned interruptions, SAIFI (2006-2010)
note: The voltage level (LV, MV, HV, EHV) is related to where the incidents occur.
2006 2007 2008 2009 20100.00
1.00
2.00
3.00
4.00
5.00
6.00
7.00
8.00
[inte
rrupt
ions
/cus
tom
er]
Bosnia and Herzegovina - EHV, HV, MV
Croatia - HV, MV, LV
Serbia - EHV, HV, MV, LV
Ukraine - EHV, HV, MV, LV
The share of minutes lost of planned interruptions in total interruptions (planned and unplanned) has been calculated for all CPs that provided data (see Table 36). It can be concluded that 30% to 55% of all interruptions are planned and notified in advance77. The share of planned interruptions in total interruptions (planned and unplanned) is lower (about 15%); maintenance affects the duration more than the number of interruptions.
It is hard to evaluate the reason behind certain values of the share of planned interruptions in total interruptions: higher values could indicate massive facility program maintenance78 or bigger
investments in the network aimed to target better quality in the future. Lower values may indicate low scope of maintenance/investments or good quality of existing networks.
It is interesting that the share of planned interruptions in overall statistics79 almost does not vary over the observed years. Minutes lost due to planned interruptions remain in correlation to unplanned minutes lost. This is an indication that there were no dedicated massive maintenance or investments campaigns performed, but rather regular maintenance that correlates with unplanned incidents.
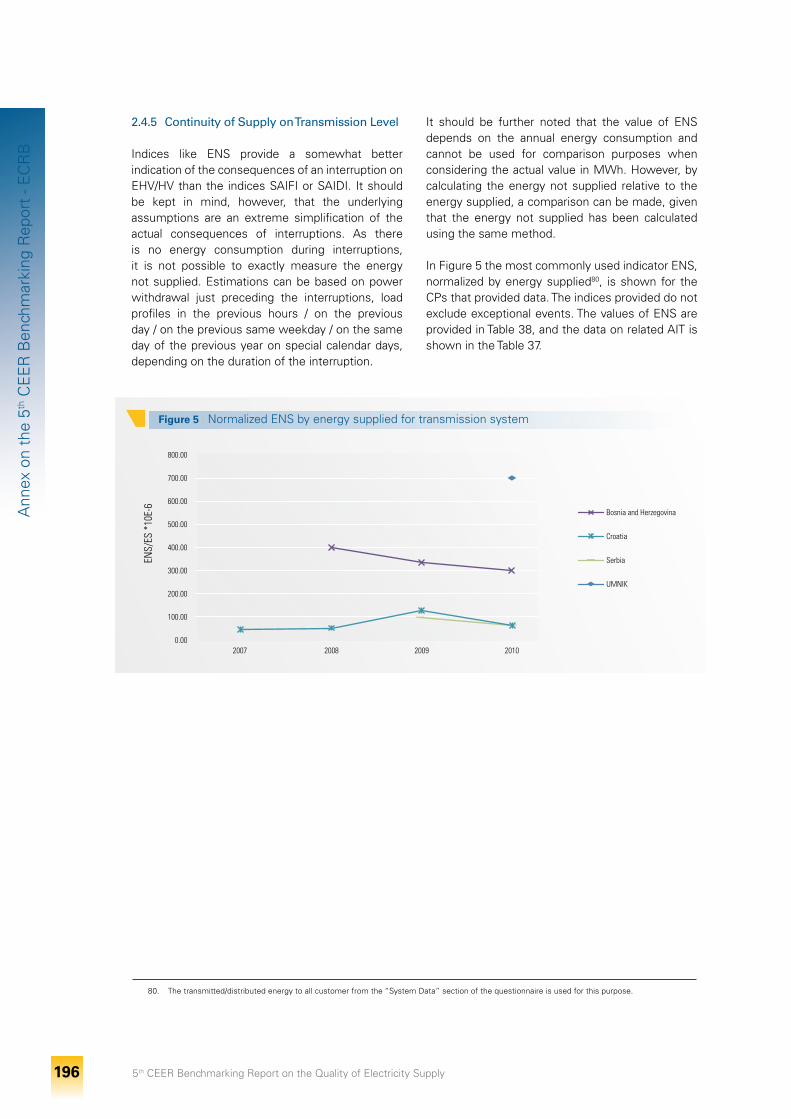
5th CEER Benchmarking Report on the Quality of Electricity Supply 196
Ann
ex o
n th
e 5th
CE
ER
Ben
chm
arki
ng R
epor
t - E
CR
B
2.4.5 Continuity of Supply on Transmission Level
Indices like ENS provide a somewhat better indication of the consequences of an interruption on EHV/HV than the indices SAIFI or SAIDI. It should be kept in mind, however, that the underlying assumptions are an extreme simplification of the actual consequences of interruptions. As there is no energy consumption during interruptions, it is not possible to exactly measure the energy not supplied. Estimations can be based on power withdrawal just preceding the interruptions, load profiles in the previous hours / on the previous day / on the previous same weekday / on the same day of the previous year on special calendar days, depending on the duration of the interruption.
It should be further noted that the value of ENS depends on the annual energy consumption and cannot be used for comparison purposes when considering the actual value in MWh. However, by calculating the energy not supplied relative to the energy supplied, a comparison can be made, given that the energy not supplied has been calculated using the same method.
In Figure 5 the most commonly used indicator ENS, normalized by energy supplied80, is shown for the CPs that provided data. The indices provided do not exclude exceptional events. The values of ENS are provided in Table 38, and the data on related AIT is shown in the Table 37.
Figure 5 I Normalized ENS by energy supplied for transmission system
2007 2008 2009 20100.00
100.00
200.00
300.00
400.00
500.00
600.00
700.00
800.00
ENS/
ES *
10E-
6
Bosnia and Herzegovina
Croatia
Serbia
UMNIK
80. The transmitted/distributed energy to all customer from the “System Data” section of the questionnaire is used for this purpose.
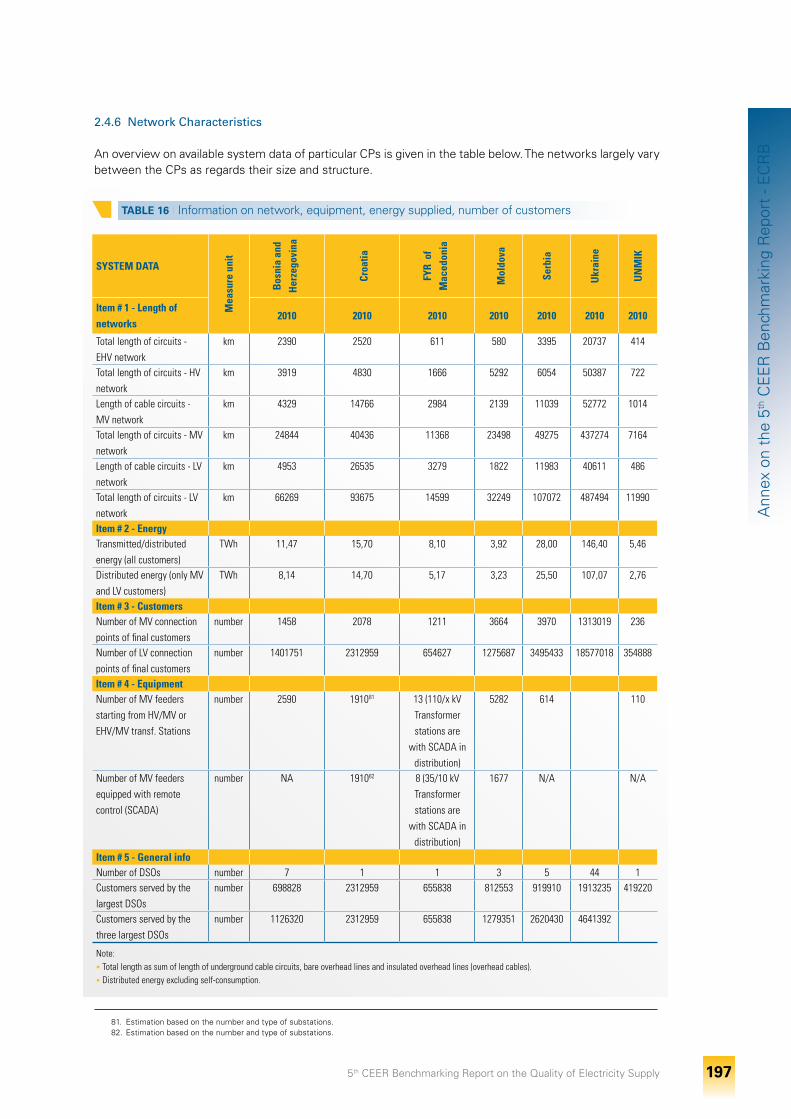
5th CEER Benchmarking Report on the Quality of Electricity Supply 197
Ann
ex o
n th
e 5th
CE
ER
Ben
chm
arki
ng R
epor
t - E
CR
B
2.4.6 Network Characteristics
An overview on available system data of particular CPs is given in the table below. The networks largely vary between the CPs as regards their size and structure.
TABLE 16 I Information on network, equipment, energy supplied, number of customers
SYSTEM DATA
Mea
sure
uni
t
Bos
nia
and
Her
zego
vina
Croa
tia
FYR
of
Mac
edon
ia
Mol
dova
Serb
ia
Ukr
aine
UN
MIK
Item # 1 - Length of networks
2010 2010 2010 2010 2010 2010 2010
Total length of circuits - EHV network
km 2390 2520 611 580 3395 20737 414
Total length of circuits - HV network
km 3919 4830 1666 5292 6054 50387 722
Length of cable circuits - MV network
km 4329 14766 2984 2139 11039 52772 1014
Total length of circuits - MV network
km 24844 40436 11368 23498 49275 437274 7164
Length of cable circuits - LV network
km 4953 26535 3279 1822 11983 40611 486
Total length of circuits - LV network
km 66269 93675 14599 32249 107072 487494 11990
Item # 2 - EnergyTransmitted/distributed energy (all customers)
TWh 11,47 15,70 8,10 3,92 28,00 146,40 5,46
Distributed energy (only MV and LV customers)
TWh 8,14 14,70 5,17 3,23 25,50 107,07 2,76
Item # 3 - Customersnumber of MV connection points of final customers
number 1458 2078 1211 3664 3970 1313019 236
number of LV connection points of final customers
number 1401751 2312959 654627 1275687 3495433 18577018 354888
Item # 4 - Equipmentnumber of MV feeders starting from HV/MV or EHV/MV transf. Stations
number 2590 191081 13 (110/x kV Transformer stations are
with SCADA in distribution)
5282 614 110
number of MV feeders equipped with remote control (SCADA)
number nA 191082 8 (35/10 kV Transformer stations are
with SCADA in distribution)
1677 n/A n/A
Item # 5 - General infonumber of DSOs number 7 1 1 3 5 44 1Customers served by the largest DSOs
number 698828 2312959 655838 812553 919910 1913235 419220
Customers served by the three largest DSOs
number 1126320 2312959 655838 1279351 2620430 4641392
note: • Total length as sum of length of underground cable circuits, bare overhead lines and insulated overhead lines (overhead cables).• Distributed energy excluding self-consumption.
81. Estimation based on the number and type of substations.82. Estimation based on the number and type of substations.
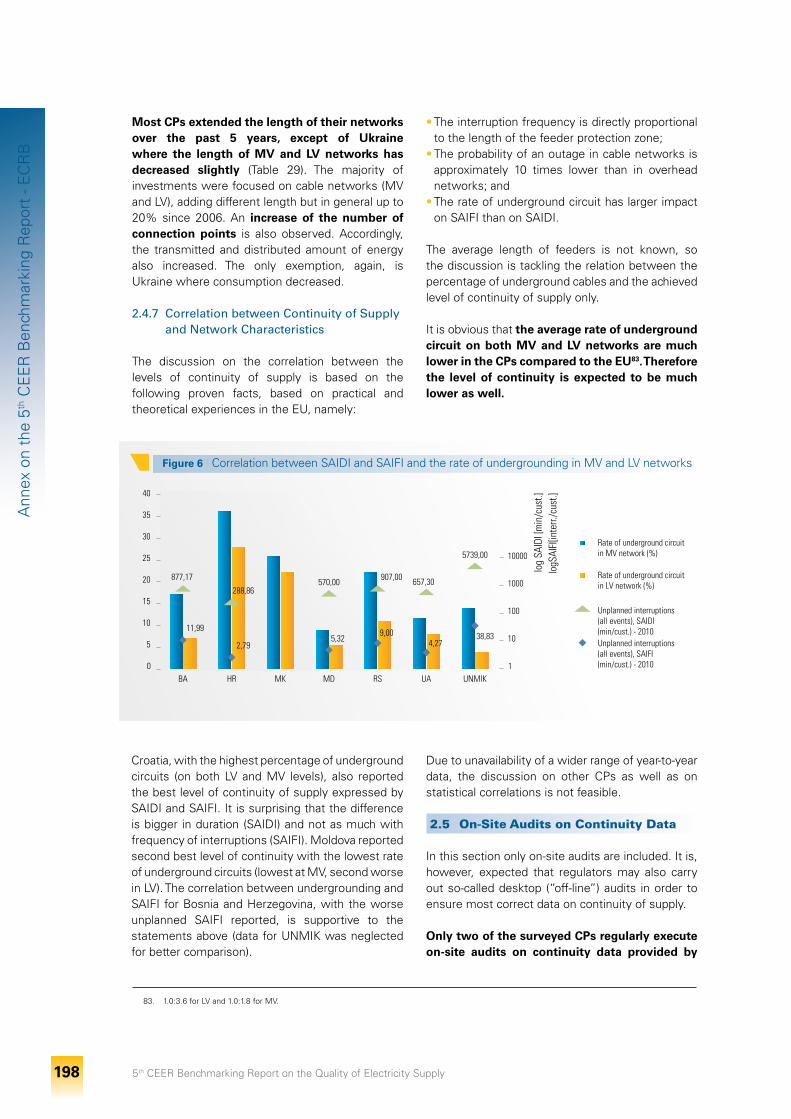
5th CEER Benchmarking Report on the Quality of Electricity Supply 198
Ann
ex o
n th
e 5th
CE
ER
Ben
chm
arki
ng R
epor
t - E
CR
B
Most CPs extended the length of their networks over the past 5 years, except of Ukraine where the length of MV and LV networks has decreased slightly (Table 29). The majority of investments were focused on cable networks (MV and LV), adding different length but in general up to 20% since 2006. An increase of the number of connection points is also observed. Accordingly, the transmitted and distributed amount of energy also increased. The only exemption, again, is Ukraine where consumption decreased.
2.4.7 Correlation between Continuity of Supply and Network Characteristics
The discussion on the correlation between the levels of continuity of supply is based on the following proven facts, based on practical and theoretical experiences in the EU, namely:
• The interruption frequency is directly proportional to the length of the feeder protection zone;
• The probability of an outage in cable networks is approximately 10 times lower than in overhead networks; and
• The rate of underground circuit has larger impact on SAIFI than on SAIDI.
The average length of feeders is not known, so the discussion is tackling the relation between the percentage of underground cables and the achieved level of continuity of supply only.
It is obvious that the average rate of underground circuit on both MV and LV networks are much lower in the CPs compared to the EU83. Therefore the level of continuity is expected to be much lower as well.
Figure 6 I Correlation between SAIDI and SAIFI and the rate of undergrounding in MV and LV networks
83. 1.0:3.6 for LV and 1.0:1.8 for MV.
Rate of underground circuitin MV network (%)
Rate of underground circuitin LV network (%)
Unplanned interruptions(all events), SAIDI(min/cust.) - 2010Unplanned interruptions(all events), SAIFI(min/cust.) - 2010
40
35
30
25
20
15
10
5
0
10000
1000
100
10
570,00877,17
288,86
2,79
11,995,32
9,00
907,00 657,30
5739,00
38,834,27
1BA HR MK MD RS UA UNMIK
log
SAiD
i [m
in/c
ust.]
logS
AiFi
[inte
rr./c
ust.]
Croatia, with the highest percentage of underground circuits (on both LV and MV levels), also reported the best level of continuity of supply expressed by SAIDI and SAIFI. It is surprising that the difference is bigger in duration (SAIDI) and not as much with frequency of interruptions (SAIFI). Moldova reported second best level of continuity with the lowest rate of underground circuits (lowest at MV, second worse in LV). The correlation between undergrounding and SAIFI for Bosnia and Herzegovina, with the worse unplanned SAIFI reported, is supportive to the statements above (data for UNMIK was neglected for better comparison).
Due to unavailability of a wider range of year-to-year data, the discussion on other CPs as well as on statistical correlations is not feasible.
2.5 On-Site Audits on Continuity Data
In this section only on-site audits are included. It is, however, expected that regulators may also carry out so-called desktop (“off-line”) audits in order to ensure most correct data on continuity of supply.
Only two of the surveyed CPs regularly execute on-site audits on continuity data provided by
5th CEER Benchmarking Report on the Quality of Electricity Supply 199
Ann
ex o
n th
e 5th
CE
ER
Ben
chm
arki
ng R
epor
t - E
CR
B
the companies, namely Bosnia and Herzegovina and Ukraine. The relevant on-site audit is conducted by the regulatory authority.
In Bosnia and Herzegovina, the procedure of collection and processing of interruptions has been audited on-site84 once per year by the RA since 2008; compliance with the document that defines the monitoring procedure of the licensees for distribution of electricity prescribes, among others, the quality of supply monitoring requirements. If the audit closes with negatives results, a decision on the measures to be taken is made.
Moldova reports that auditing is foreseen but that a formal methodology has not yet been developed and applied.
In Ukraine, the reports and electronic registers submitted to the RA (by 44 utilities) are subject to on-site audits are conducted once per year by the RA. Penalties are foreseen, rules on auditing are currently in preparation.
The other analysed CPs have not yet designed audit procedures but are interested in implementing such procedures in the future according to the development of their service quality regulation frameworks.
2.6 Continuity Standards and Incentive Schemes
The following section provides an overview of the existing frameworks of continuity of supply regulation in the CPs. It will also illustrate which indicators and standards are used in this regard.
In the subsequent sections different terminology is used for the required performance defined by the RAs by means of setting the targets on continuity at the system level:
• continuity standards set on system level;
• overall (continuity) standards;
• (average) required performance; and
• (average) performance targets.
While some of the terms are not frequently used, some have a sound basis in the documents of the European Energy Regulators85. However, harmonisation has not been achieved yet.
The regulation frameworks are assessed on two different levels:
1. Continuity standards at system level with the quality reward/penalty regimes;
2. Continuity standards at single-customer level with the customer compensation schemes.
The development of regulation frameworks in the CPs is on an initial stage in the prevailing number of cases. The main emphasis is put on continuity monitoring. However, from the responses provided, it can be concluded that activities for assuring maintenance and improvement of continuity levels, as well as activities for protecting the worst served customers are ongoing or will start soon. Two CPs, namely FYR of Macedonia and Montenegro, reported 2012 as a milestone for the first implementations of more comprehensive frameworks. It can be expected that the other CPs will follow and developed their frameworks till 2015.
84. 1 TSO, 7 DSO.85. I.e. papers on "Smart Grids: Position Paper on Smart Grids" http://www.energy-regulators.eu/portal/page/portal/EER_HOME/EER_CONSULT/CLOSED%20
PUBLIC%20CONSULTATIONS/ELECTRICITY/Smart%20Grids/CD and "CEER status review of regulatory approaches to smart electricity grids" http://www.energy-regulators.eu/portal/page/portal/EER_HOME/EER_CONSULT/CLOSED%20PUBLIC%20CONSULTATIONS/ELECTRICITY/Smart%20Grids/CD/C11-EQS-45-04_SmartGridsApproach_6%20July%202011.pdf
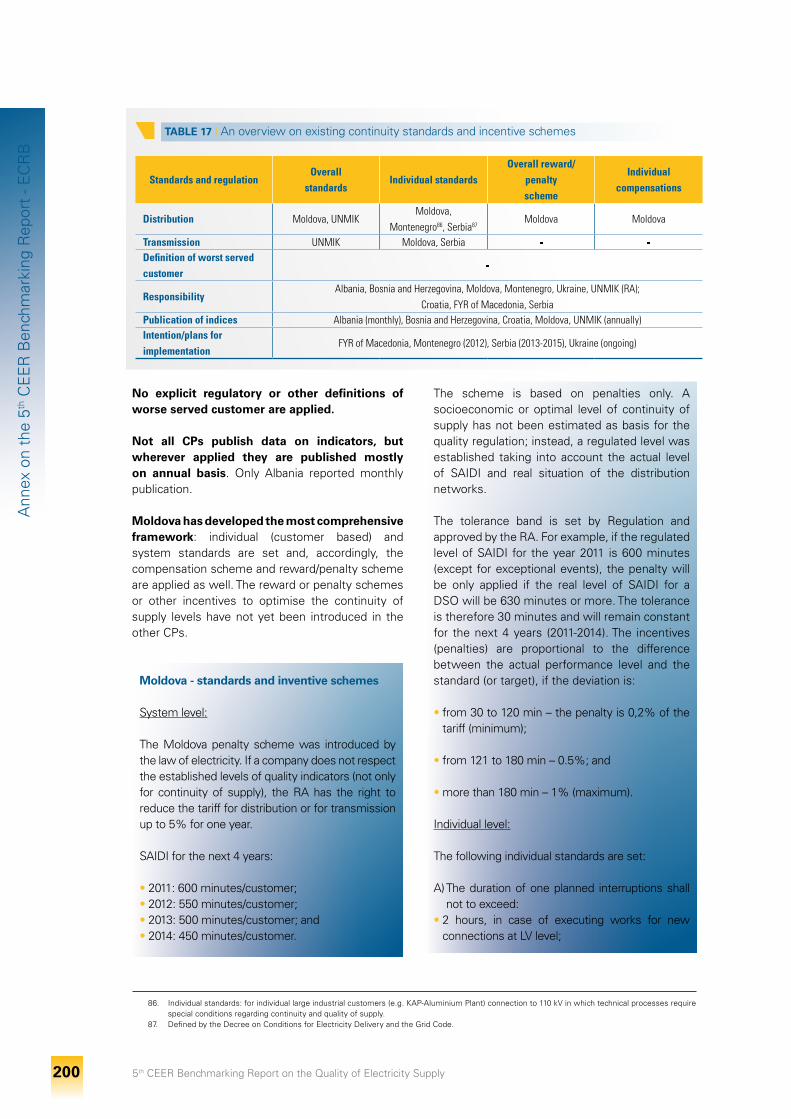
5th CEER Benchmarking Report on the Quality of Electricity Supply 200
Ann
ex o
n th
e 5th
CE
ER
Ben
chm
arki
ng R
epor
t - E
CR
B
No explicit regulatory or other definitions of worse served customer are applied.
Not all CPs publish data on indicators, but wherever applied they are published mostly on annual basis. Only Albania reported monthly publication.
Moldova has developed the most comprehensive framework: individual (customer based) and system standards are set and, accordingly, the compensation scheme and reward/penalty scheme are applied as well. The reward or penalty schemes or other incentives to optimise the continuity of supply levels have not yet been introduced in the other CPs.
Moldova - standards and inventive schemes
System level:
The Moldova penalty scheme was introduced by the law of electricity. If a company does not respect the established levels of quality indicators (not only for continuity of supply), the RA has the right to reduce the tariff for distribution or for transmission up to 5% for one year.
SAIDI for the next 4 years:
• 2011: 600 minutes/customer;• 2012: 550 minutes/customer;• 2013: 500 minutes/customer; and• 2014: 450 minutes/customer.
The scheme is based on penalties only. A socioeconomic or optimal level of continuity of supply has not been estimated as basis for the quality regulation; instead, a regulated level was established taking into account the actual level of SAIDI and real situation of the distribution networks.
The tolerance band is set by Regulation and approved by the RA. For example, if the regulated level of SAIDI for the year 2011 is 600 minutes (except for exceptional events), the penalty will be only applied if the real level of SAIDI for a DSO will be 630 minutes or more. The tolerance is therefore 30 minutes and will remain constant for the next 4 years (2011-2014). The incentives (penalties) are proportional to the difference between the actual performance level and the standard (or target), if the deviation is:
• from 30 to 120 min – the penalty is 0,2% of the tariff (minimum);
• from 121 to 180 min – 0.5%; and
• more than 180 min – 1% (maximum).
Individual level:
The following individual standards are set:
A) The duration of one planned interruptions shall not to exceed:
• 2 hours, in case of executing works for new connections at LV level;
86. Individual standards: for individual large industrial customers (e.g. KAP-Aluminium Plant) connection to 110 kV in which technical processes require special conditions regarding continuity and quality of supply.
87. Defined by the Decree on Conditions for Electricity Delivery and the Grid Code.
TABLE 17 I An overview on existing continuity standards and incentive schemes
Standards and regulationOverall
standardsIndividual standards
Overall reward/penaltyscheme
Individual compensations
Distribution Moldova, UnMikMoldova,
Montenegro86, Serbia87Moldova Moldova
Transmission UnMik Moldova, Serbia - -Definition of worst served customer
-
ResponsibilityAlbania, Bosnia and Herzegovina, Moldova, Montenegro, Ukraine, UnMik (RA);
Croatia, FYR of Macedonia, Serbia Publication of indices Albania (monthly), Bosnia and Herzegovina, Croatia, Moldova, UnMik (annually)Intention/plans for implementation
FYR of Macedonia, Montenegro (2012), Serbia (2013-2015), Ukraine (ongoing)
5th CEER Benchmarking Report on the Quality of Electricity Supply 201
Ann
ex o
n th
e 5th
CE
ER
Ben
chm
arki
ng R
epor
t - E
CR
B
• 4 hours, in case of new connections, reconnections at MV level;
• 12 hours, in case of works for prophylaxis, current repairs of electric equipment etc.; and
• 24 hours, in case of a capital repair of electric lines.
B) The duration of one unplanned interruptions shall not to exceed:
• 24 hours, where it is necessary to repair or replace a damaged electric line sector88;
• 16 hours, for interruptions, produced at nighttime and caused by defects of MV networks;
• 6 hours in urban areas and 8 hours in rural areas in other cases.
C) The annual number of planned interruptions: • 5 for urban areas and 8 for rural areas.
D) The annual number of unplanned interruptions: • For urban areas – 6 (at MV level) and 9 (at LV
level); and• For rural areas – 9 (at MV level) and 12 (al LV level).
E) The annual duration of unplanned interruptions:• For urban areas – 36 hours; and • For rural areas – 48 hours.
Compensations payments are differentiated in 3 groups:• Household customers;• Non-household consumers, under installed
power less than or equal to 100 kW; and • Non-household consumers, under installed
power higher than 100 kW.
The compensation level has been set taking into account the experience of other CPs89 and also considering the level of salaries. The compensation level is capped. The compensation payments are issued per request. Exemptions from compensations are as well defined:
• force majeure situations; • events caused by end consumers’ installations,
emergencies at interconnection lines; • special meteorological conditions; • in the case of electricity supply interruptions
caused by third parties; and• in the case of unscheduled interruptions
exceeding 3 minutes.
Montenegro protects special large industrial customers only by individual standards on continuity of supply. Serbia also applies individual standards and set minimal requirements on duration of interruptions but no compensation scheme.
Serbia - standards and inventive schemes
Individual level: The Decree on Conditions for Electricity Delivery defines that each unplanned interruption of electricity delivery has to be restored to the customer within 2 hours, and maximum within 72 hours in case of force majeure or some other exceptional event.
The Grid Code issued by the TSO defines that each connection point shall not be affected by unplanned interruptions of supply due to a cause in the transmission network for longer than 2 hours/year for the generation connection point, 4 hours/year for the other connection points in the HV (400/220/110 kV) network and 6 hours/year for the connection points in the MV and LV network.
Also in UNMIK overall standards on continuity of supply were applied in 2011.
UNMIK - standards and inventive schemes
System level: for 2011 the following overall standards on CP level have been set - SAIDI shall not exceed:
• twenty (20) hours of planned interruptions per customer; and
• thirty (30) hours of unplanned interruptions.
The economic effects and outcomes of the regulatory actions cannot be addressed, since no data is available.
88. Several damaged or fallen posts, defects of underground cable lines or a powerful transformer. 89. Ex. from benchmarking reports on quality of electricity supply.
5th CEER Benchmarking Report on the Quality of Electricity Supply 202
Ann
ex o
n th
e 5th
CE
ER
Ben
chm
arki
ng R
epor
t - E
CR
B
2.7 Expected Developments on Continuity of Supply Regulation
Regulation of continuity of supply will be for sure subject to further changes and developments in the future. Those CPs that have not implemented related rules yet will do so, while others will focus on improving their regulations. Making use of the experience and good regulatory practice within the EU will be of great help to the CPs.
Bigger improvements are expected for the period from 2012-2015: there are plans to define minimal continuity standards and strengthen regulation in FYR of Macedonia, Montenegro and Serbia. Ongoing developments are also reported for Ukraine. Also the other CPs are working on a more comprehensive approach on regulating continuity of supply, some analysing the possibility of introducing a reward-penalty mechanism90.
All observed CPs have initially put emphasis on the improvement and assurance of the preconditions for the regulation of continuity of supply. Monitoring of continuity of supply on all levels with the highest level of detail, backed up with harmonised and standardised rules shall be wrapped up with the continuous publication of data. The transparency of the achieved level of continuity of supply is the very first step of a long journey towards better regulation.
2.8 Findings and Recommendations on Continuity of Supply
Monitoring is applied in all CPs that participated in the survey. As a first objective pursued by the regulators and as the core component of the service quality regulation framework, monitoring has widely reached a phase that can start to back-up regulatory decisions successfully. Different approaches to the regulation - driven by CP legal frameworks and, in particular, different monitoring methodologies used, combined with different geographical, meteorological characteristics, different networks structures and age - make benchmarking of actual levels of continuity of supply difficult.
A comparative analysis of the monitoring schemes and the continuity of supply regulation in the CPs shows that regulators have generally approached continuity issues with emphasis on long interruptions first, treating the planned and unplanned interruptions separately. Distinction is made between different voltage levels and the reasons of interruptions. In several CPs both the number and duration of interruptions are available and almost harmonised combinations of indicators (SAIDI, SAIFI) are used. Short interruptions are barely recorded. Few examples of regulatory practices on advanced regulation instruments are identified in the region as well by means of continuity standards and incentive schemes.
Monitoring schemes are developing and are currently in different development stages:
• monitoring is focused mostly on long interruptions; • monitoring on transmission level is not applied in
all CPs91;• monitoring is performed in different detail levels;• different sets of indicators are used, although
basic indicators (i.e. SAIDI, SAIFI, ENS) are widely used; and
• not all incidents are considered in the statistics (i.e. LV).
A lack of harmonisation of the basic monitoring rules is also identified, but it is not predominant. The lack of emphasis on monitoring of continuity on transmission level in some CPs may be the result of underestimation of its importance due to the robust network design enabling high reliability (“n-1” operational criteria), the apparently low number of customers connected to the transmission network, problems of weighting and the estimations (i.e. “ENS” based indices).
All CPs are encouraged to strengthen their efforts on further developing and optimising their monitoring process and make further steps towards comprehensive and robust monitoring schemes. The transparency of data and its quality is essential.
90. Link between the continuity and tariffs. 91. Atypical customers, specifics in calculation of certain continuity indexes.
5th CEER Benchmarking Report on the Quality of Electricity Supply 203
Ann
ex o
n th
e 5th
CE
ER
Ben
chm
arki
ng R
epor
t - E
CR
B
The findings and recommendations are provided as follows.
Finding #1 Rules, business processes and tools for automatic logging of interruptions are not applied in all CPs
Many CPs reported only limited use of SCADA and prevailing manual recording of interruptions is applied. Lack of rules for automatic recording of interruptions has a direct impact on completeness, robustness and the quality of data. Decisions taken (by the regulator or the system operator) on the basis of such data may be misleading. Also auditing such data is time consuming and not efficient.
Finding #2Harmonisation of interruption definitions is not achieved - monitoring schemes lack comprehensiveness and efficiency
Some minor differences in definitions of interruptions exist. However, only Albania has a completely different classification for the duration of interruptions. Available standards (EN 50160) and guidelines of good practice92 are widely not used.
Not all types of interruptions are monitored. Only two CPs reported that monitoring of short interruptions is applied and performed in a limited scope, i.e. Bosnia and Herzegovina and Ukraine. Transient interruptions are not monitored by any of the CPs.
The monitoring schemes are lacking efficiency. The main problem lies in the way how interruptions are recorded – in the absence of SCADA or Advanced Metering Infrastructure (AMI) (i.e. for recording the
interruptions on LV), manual logging of interruptions and data processing does not assure the required efficiency and reliability of data.
Finding #3
92. CEER, 4th Benchmarking report on Quality of Electricity Supply, 2008; http://www.energy-regulators.eu
Recommendation #1
Efficient rules for automatic logging of interruptions have to be introduced
Implementation of SCADA and its Distribution Management System (DMS) functions that to a larger extent enable automatic logging (at least for EHV, HV and MV voltage levels) is crucial for efficient monitoring of continuity of supply.
It is recommended that all CPs define rules for automatic logging of interruptions. These rules on recording should be harmonised. Deviations or CP specific rules can be upheld.
Recommendation #2
Monitoring of all basic interruptions types should be introduced, based on harmonised definitions
It is recommended to harmonise their definitions for basic interruption types (firstly long, secondly short and, if justifiable, transient). Available norms and examples of good practice could be used as a basis for this harmonisation process.
Harmonisation should be introduced for:• long interruptions > 3 min;• short interruptions > 1 s and ≤ 3 min; and • transient interruptions ≤ 1 s.
As such, the definitions of interruptions should be aligned with the definitions of EN 50160, as well as with European practices.
Short interruptions do not only have negative impact on households but also business and industrial customers and should therefore also receive appropriate attention by the regulators.
The fact that SCADA will still be need to be implemented in many CPs from scratch provides a good opportunity for the CPs to plan appropriate SCADA functions and the appropriate of network coverage by SCADA to ensure automatic recording of short interruptions. SCADA is usually implemented starting at the highest voltage level, moving to the high-load-density parts of the lower-voltage levels. Short interruptions mainly occur in the low-load-density parts of the lower-voltage levels. This important technical issue needs to be considered when planning the introduction of SCADA. The costs needed for such a comprehensive monitoring scheme will be lower in comparison to an upgrade of existing SCADA functionalities. It is important for CPs to consider all related aspects; among those are rules for aggregation of interruptions that occur in a short time span.
RAs should also decide on the extension of monitoring schemes for transient interrup-tions.
5th CEER Benchmarking Report on the Quality of Electricity Supply 204
Ann
ex o
n th
e 5th
CE
ER
Ben
chm
arki
ng R
epor
t - E
CR
B
Continuity statistics do not include incidents at all voltage levels
None of the CPs has established efficient monitoring schemes for recording interruptions on all voltage levels.
While interruptions are recorded separately according to the particular voltage level in most CPs, monitoring is not always performed on all voltage levels. Usually, data is collected on HV and MV level only but LV is not been sufficiently covered yet93.
The lack of monitoring or inefficient monitoring on LV94 level could result in a significant underestimation of the number and duration of interruptions experienced by low voltage customers (unplanned and planned), especially in urban areas but also on CP level. Indeed, even if incidents on LV will affect much less customers than incidents on MV and higher voltage levels, incidents on LV cannot be neglected: the resulting interruptions often last longer95 than interruptions due to incidents at higher voltage levels and are also significant in number.96
The SAIDI contribution from LV, therefore, might be even underestimated.
93. The EU made similar experience in the past.94. Which are all domestic customers and the majority of non-domestic customers.95. LV networks are usually radial networks without redundancy.96. According to the experience of some EU countries, the contribution of interruptions from LV to the continuity indicators (SAIFI and SAIDI) varies
between 7% and 30% on country level - this analysis is based on the evaluation of impacts of incidents on LV networks that are mostly estimated based on notification via phone calls (AMI is not installed).
Recommendation #3
Interruptions should be also monitored on LV Level
It is recommended that the measurement of interruptions should cover all network levels.
All CPs are encouraged to include monitoring of interruptions at all voltage levels including LV in the continuity of supply statistics. A cost-benefit analysis should be performed to evaluate the different possibilities:
• automated recording based on AMI; • development of methods for estimation of
duration and number of affected customers (i.e. using call centres); and
• other (i.e. protection equipment in LV feeders under supervision of SCADA).
Wherever manual logging is applied, system operators should be more vigilant regarding manual entries of outages in LV networks. This can be supported by appropriate organisational and technical measures.
5th CEER Benchmarking Report on the Quality of Electricity Supply 205
Ann
ex o
n th
e 5th
CE
ER
Ben
chm
arki
ng R
epor
t - E
CR
B
Finding #4Categories of interruption causes vary between CPs
Information on interruption causes is essential for DSOs to improve continuity of supply but also for RAs to identify and approve appropriate investments in time. Such information should be collected by system operators as detailed as possible. There is no need for harmonisation of the specific reasoning types but it may be useful to achieve harmonisation of the main categories. Especially, the treatment of so called “third party” causes is sometimes mixed with the category “exceptional events”.
97. To avoid mixing the “third party” and “exceptional events”.
Finding #5 Level of detail in calculating continuity indicators differs between CPs
6 CPs provided data on continuity indicators. This allows an initial benchmarking. Two third of the CPs that provided at least 3-year data (2 out of 3) show a decreasing unavailability (SAIDI). However, due to the fact that continuity is benchmarked by using indices that include exceptional events and that explicit information on such events was not provided, any conclusion on trends would be misleading. More historical, year-to-year data would be needed for an in-depth analysis.
Calculation on the level of individual system operators, region and area is not common practice in the CPs. Only two CPs calculate indices in such detail. Also, only 4 CPs reported that they calculate indices per network type (according to the population density); among them, only 3 CPs provided data on related indices. In each of these CPs, the continuity of supply is much better in urban areas than in rural areas.
The lack of disaggregated CoS data creates a barrier for RAs’ and system operators’ decisions on necessary measures. Undergrounding is a good example of possible measures for improvement of continuity: although the best level of continuity in the region (using the aggregated data) clearly correlates with the highest rate of underground network (Croatia), the same correlation should be assessed using disaggregated continuity data (i.e. SAIDI and SAIFI covering interruptions at certain voltage level only) to strengthen the findings.
Recommendation #4
Harmonisation of Basic Cause Categorization
The harmonisation of basic cause categories between the CPs is recommended. Also, a clean split between third party and exceptional events categories is highly recommended. We recommend the use of the following three main cause categories:
1. responsibility of system operator;2. third party; and3. exceptional events.
Each interruption cause (not necessarily harmonised) shall be linked to the appropriate category. The use of causes like “other”, “not available”, “unexplained” as main categories should be avoided as much as possible. Such causes may be only used as sub-types.
Among the interruption causes in the category “third party”, the responsibility of another system operator for an interruption should be specifically identified in the monitoring activity with a view to make them easily identifiable.
The distinction between the main cause categories97 shall be achieved by clear definitions.
5th CEER Benchmarking Report on the Quality of Electricity Supply 206
Ann
ex o
n th
e 5th
CE
ER
Ben
chm
arki
ng R
epor
t - E
CR
B
Finding #6Lack of explicit information on the use of concepts of “exceptional events” hinder the impact analysis of “exceptional events” on the level of continuity
Some interruptions are considered to be due to exceptional events and are therefore either not reflected in the continuity statistics or are treated separately. From the information available, it is hard to evaluate the real use of the concept of “exceptional events”, even if its application is widely reported by CPs. Different CPs use different criteria for defining an interruption as exceptional event.
Where exceptional events are displayed in the statistics, knowledge on the contribution of exceptional events is of utmost importance when analysing continuity of supply data. Although concepts of “exceptional events” are reported to be applied, the impact of exceptional events is not clear – the estimated contribution of exceptional events is more or less constant. This indicates that the concepts of “exceptional events” are not properly defined or used – exceptional events may also include interruptions due to weather circumstances that occur once a year or more often (as lightning etc.).
98. Control area, i.e. population density (urban/suburban/rural), voltage level, network type (cable/overhead), cause, sub-cause etc.99. For example the differences in the level of continuity of supply according to the population density should be considered when applying the mini-
mal continuity standards.
Recommendation #5
Logging of interruptions shall comprise all necessary details to enable disaggregated calculation of continuity indices
Network operators should use an extended set of interruption properties98 when recording and post-processing interruption data. Such com-prehensive approach enables the calculation of disaggregated indices. For that purpose, system operators should meet the technical precondi-tions for obtaining such data and implement the appropriate business processes for backing up the necessary post-processing of data.
System operators should be required to provide aggregated and disaggregated continuity data (on voltage levels, network types, etc.) to the RA.
For RAs it is important to calculate the indices per system operator with a view to benchmark their performance and identify possible larger continuity of supply differences.
The calculation of indices according to the network type (rural/suburban/urban networks) provides essential information for decisions on measures for improvement of continuity of supply. It is therefore recommended that indicators are calculated for each system operator separately as well as according to the population density (urban/suburban/rural). The latter requires the rules for classification that may not be harmonised, due to differences in the network structure and geography, as well as demographic characteristics of CPs. Non aggregated calculation of indices will ensure more flexibility for RAs when designing regulatory incentive schemes99.
RAs are encouraged to continue monitoring of CoS based on an extended set of indicators. Historic data, aggregated and disaggregated data (on voltage levels, network types, etc.) is essential for identifying trends and performing correlation analyses. Monitoring scheme should evolve in a way to assure CoS data for wider time-spans, as well as in greater detail: disaggregated data should be calculated in order to identify problems and direct priorities.
5th CEER Benchmarking Report on the Quality of Electricity Supply 207
Ann
ex o
n th
e 5th
CE
ER
Ben
chm
arki
ng R
epor
t - E
CR
B
Finding #7The set of indicators used does not provide a complete picture of Continuity of Supply
Most of the CPs calculate SAIDI and SAIFI (some also MAIFI) for distribution networks and ENS
(also AIT) for transmission networks. The main interruption properties (duration and frequency) are therefore covered on distribution level only.
Some CPs do not calculate indices for transmission, some use of (rough) estimations when calculating indices. Besides, indicators that express the level of continuity in terms of interruption frequency in transmission networks are not calculated.
100. For example, if snowstorms are not an exceptional event in the northern CPs, it could be seen as an exceptional event in southern parts of the Energy Community".
Recommendation #6
Proper use and transparency of concepts of “exceptional events”
The possibilities for harmonisation of definitions on exceptional events should be explored. It is recommended that CPs harmonise the definition by means of the common characteristics of the natural and non-natural exceptional event. An exceptional event t is beyond the control of the system operator and is characterized as:
1. unforeseeable;2. unpredictable;3. unpreventable;4. unavoidable.
All four event characteristics must be confirmed for the event to classify as “exceptional”. Furthermore, the weather circumstances that occur once a year or more often should not be considered as exceptional events. Lightning should not be treated as an exceptional event anywhere in the Energy Community (it is foreseeable and predictable event in all CPs).
The CP specifics aggravate the harmonisation in further detail100. Harmonisation in such detail is not feasible.
Until adequate harmonisation has been achieved, it is recommended for each CP to transparently use the definitions and designations of their own regulation. The use of expressions, such as “exceptional events”, with an apparent intuitive meaning but without a clear definition of the manner in which it is used can result in misinterpretation.
Network operators should appropriately and reasonably minimise effects of events that are outside of their control, in line with appropriate regulatory schemes.
Recommendation #7
The number of continuity indices used should be extended
The use of multiple indicators to quantify CoS provides more information and, therefore, more possibilities to observe trends. Frequency and duration should be monitored from different aspects, using different indicators.
CPs are encouraged to gradually extend the set of continuity indicators. For a balanced view on the achieved level of CoS, indices should always cover both duration and frequency of interruptions. The recommended set could be SAIDI, SAIFI, MAIFI for distribution and ENS, AIT, SAIFI and MAIFI for transmission. The following transmission user types can be used for the calculation of SAIFI and MAIFI (transmission):
1. using three types of transmission users: HV transformation stations (counted each as 1 user, independently from number and size of transformers installed), HV/EHV final customer (large industry) and producers connected to transmission grid); or
2. using the whole number of the affected network users (on transmission and all lower voltage levels (distribution).
Whenever the first option is chosen, the results should be accompanied by information on the weighting method. Also, the aggregation of the indicators calculated using different user types (i.e. on transmission and distribution levels) should be avoided.
The minimal set of indices used for measuring the level of continuity of supply on distribution and transmission level should be harmonised.
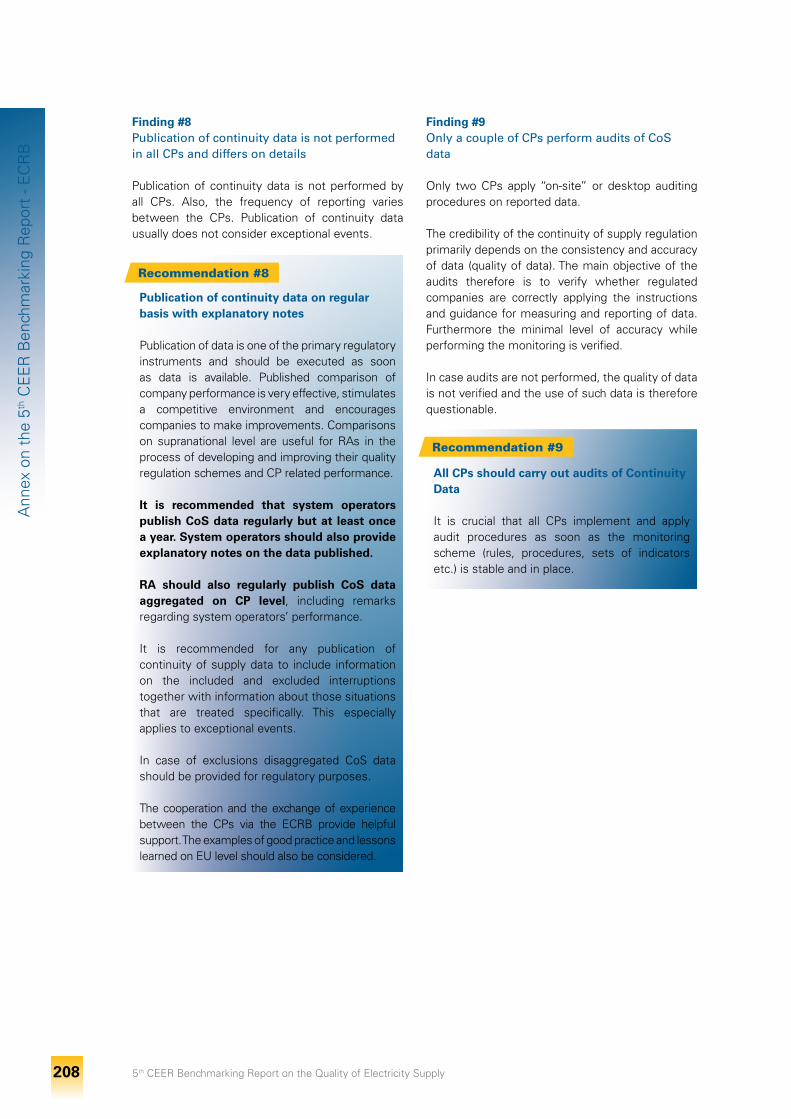
5th CEER Benchmarking Report on the Quality of Electricity Supply 208
Ann
ex o
n th
e 5th
CE
ER
Ben
chm
arki
ng R
epor
t - E
CR
B
Finding #8Publication of continuity data is not performed in all CPs and differs on details
Publication of continuity data is not performed by all CPs. Also, the frequency of reporting varies between the CPs. Publication of continuity data usually does not consider exceptional events.
Finding #9Only a couple of CPs perform audits of CoS data
Only two CPs apply “on-site” or desktop auditing procedures on reported data.
The credibility of the continuity of supply regulation primarily depends on the consistency and accuracy of data (quality of data). The main objective of the audits therefore is to verify whether regulated companies are correctly applying the instructions and guidance for measuring and reporting of data. Furthermore the minimal level of accuracy while performing the monitoring is verified.
In case audits are not performed, the quality of data is not verified and the use of such data is therefore questionable.
Recommendation #8
Publication of continuity data on regular basis with explanatory notes
Publication of data is one of the primary regulatory instruments and should be executed as soon as data is available. Published comparison of company performance is very effective, stimulates a competitive environment and encourages companies to make improvements. Comparisons on supranational level are useful for RAs in the process of developing and improving their quality regulation schemes and CP related performance.
It is recommended that system operators publish CoS data regularly but at least once a year. System operators should also provide explanatory notes on the data published.
RA should also regularly publish CoS data aggregated on CP level, including remarks regarding system operators’ performance.
It is recommended for any publication of continuity of supply data to include information on the included and excluded interruptions together with information about those situations that are treated specifically. This especially applies to exceptional events.
In case of exclusions disaggregated CoS data should be provided for regulatory purposes.
The cooperation and the exchange of experience between the CPs via the ECRB provide helpful support. The examples of good practice and lessons learned on EU level should also be considered.
Recommendation #9
All CPs should carry out audits of Continuity Data
It is crucial that all CPs implement and apply audit procedures as soon as the monitoring scheme (rules, procedures, sets of indicators etc.) is stable and in place.
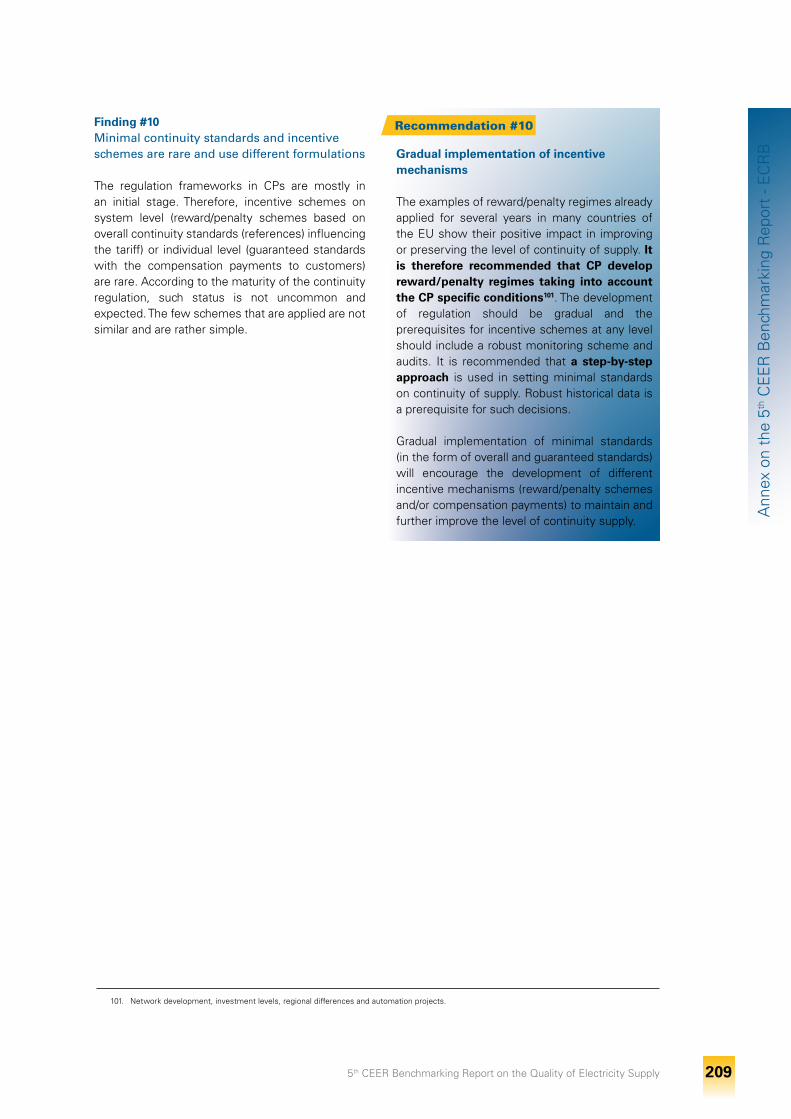
5th CEER Benchmarking Report on the Quality of Electricity Supply 209
Ann
ex o
n th
e 5th
CE
ER
Ben
chm
arki
ng R
epor
t - E
CR
B
Finding #10Minimal continuity standards and incentive schemes are rare and use different formulations
The regulation frameworks in CPs are mostly in an initial stage. Therefore, incentive schemes on system level (reward/penalty schemes based on overall continuity standards (references) influencing the tariff) or individual level (guaranteed standards with the compensation payments to customers) are rare. According to the maturity of the continuity regulation, such status is not uncommon and expected. The few schemes that are applied are not similar and are rather simple.
101. Network development, investment levels, regional differences and automation projects.
Recommendation #10
Gradual implementation of incentive mechanisms
The examples of reward/penalty regimes already applied for several years in many countries of the EU show their positive impact in improving or preserving the level of continuity of supply. It is therefore recommended that CP develop reward/penalty regimes taking into account the CP specific conditions101. The development of regulation should be gradual and the prerequisites for incentive schemes at any level should include a robust monitoring scheme and audits. It is recommended that a step-by-step approach is used in setting minimal standards on continuity of supply. Robust historical data is a prerequisite for such decisions.
Gradual implementation of minimal standards (in the form of overall and guaranteed standards) will encourage the development of different incentive mechanisms (reward/penalty schemes and/or compensation payments) to maintain and further improve the level of continuity supply.
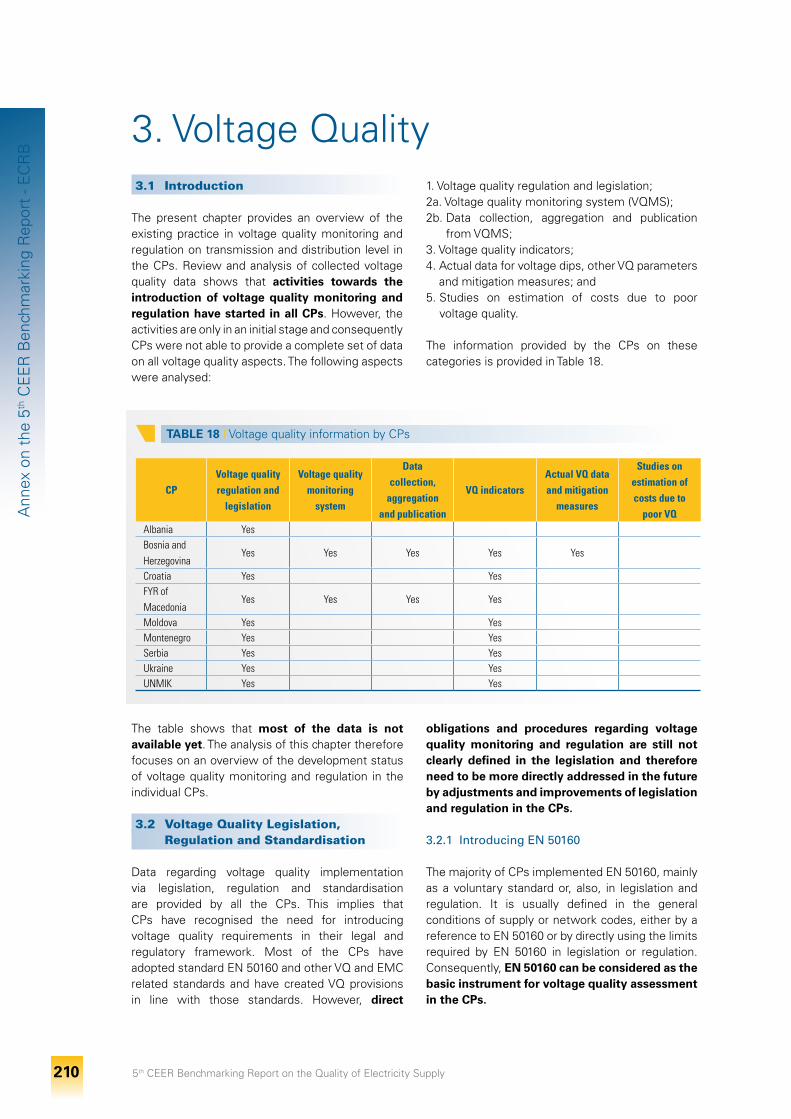
5th CEER Benchmarking Report on the Quality of Electricity Supply 210
Ann
ex o
n th
e 5th
CE
ER
Ben
chm
arki
ng R
epor
t - E
CR
B
3. Voltage Quality1. Voltage quality regulation and legislation; 2a. Voltage quality monitoring system (VQMS);2b. Data collection, aggregation and publication
from VQMS;3. Voltage quality indicators;4. Actual data for voltage dips, other VQ parameters
and mitigation measures; and5. Studies on estimation of costs due to poor
voltage quality.
The information provided by the CPs on these categories is provided in Table 18.
TABLE 18 I Voltage quality information by CPs
CPVoltage quality regulation and
legislation
Voltage quality monitoring
system
Data collection,
aggregation and publication
VQ indicatorsActual VQ data and mitigation
measures
Studies on estimation of costs due to
poor VQAlbania Yes Bosnia and Herzegovina
Yes Yes Yes Yes Yes
Croatia Yes Yes FYR of Macedonia
Yes Yes Yes Yes
Moldova Yes Yes Montenegro Yes Yes Serbia Yes Yes Ukraine Yes Yes UnMik Yes Yes
3.1 Introduction
The present chapter provides an overview of the existing practice in voltage quality monitoring and regulation on transmission and distribution level in the CPs. Review and analysis of collected voltage quality data shows that activities towards the introduction of voltage quality monitoring and regulation have started in all CPs. However, the activities are only in an initial stage and consequently CPs were not able to provide a complete set of data on all voltage quality aspects. The following aspects were analysed:
The table shows that most of the data is not available yet. The analysis of this chapter therefore focuses on an overview of the development status of voltage quality monitoring and regulation in the individual CPs.
3.2 Voltage Quality Legislation, Regulation and Standardisation
Data regarding voltage quality implementation via legislation, regulation and standardisation are provided by all the CPs. This implies that CPs have recognised the need for introducing voltage quality requirements in their legal and regulatory framework. Most of the CPs have adopted standard EN 50160 and other VQ and EMC related standards and have created VQ provisions in line with those standards. However, direct
obligations and procedures regarding voltage quality monitoring and regulation are still not clearly defined in the legislation and therefore need to be more directly addressed in the future by adjustments and improvements of legislation and regulation in the CPs.
3.2.1 Introducing EN 50160
The majority of CPs implemented EN 50160, mainly as a voluntary standard or, also, in legislation and regulation. It is usually defined in the general conditions of supply or network codes, either by a reference to EN 50160 or by directly using the limits required by EN 50160 in legislation or regulation. Consequently, EN 50160 can be considered as the basic instrument for voltage quality assessment in the CPs.
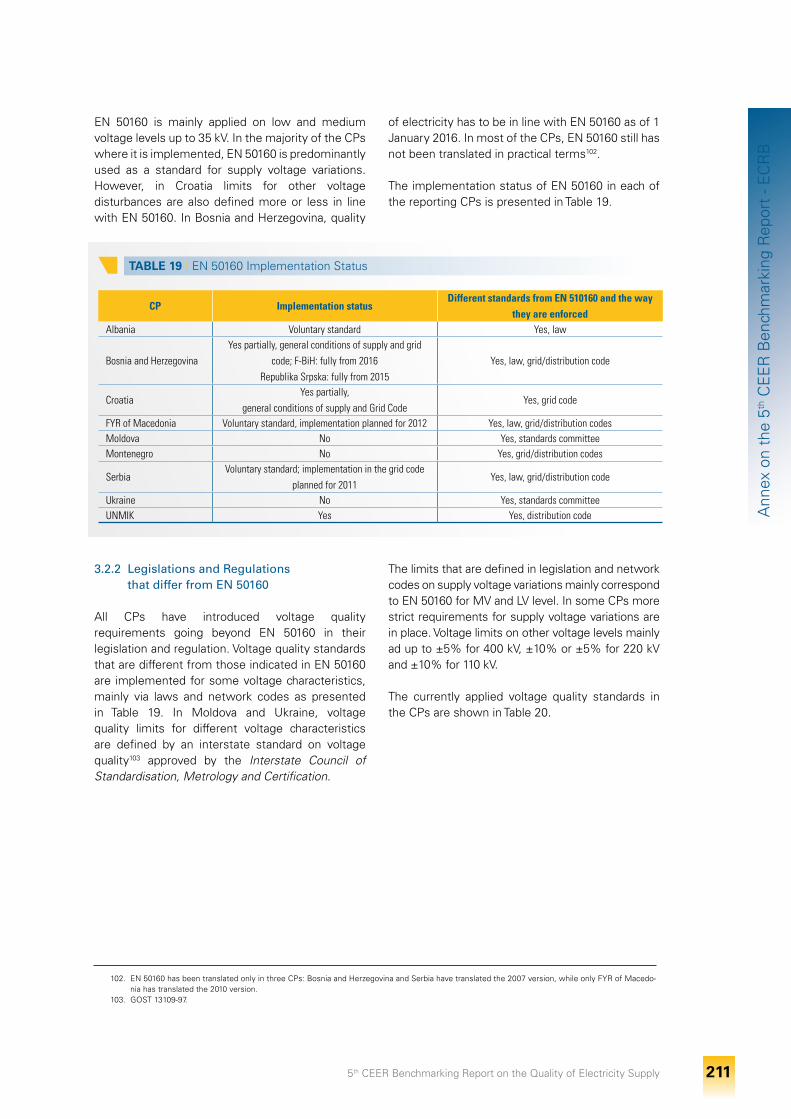
5th CEER Benchmarking Report on the Quality of Electricity Supply 211
Ann
ex o
n th
e 5th
CE
ER
Ben
chm
arki
ng R
epor
t - E
CR
B
102. EN 50160 has been translated only in three CPs: Bosnia and Herzegovina and Serbia have translated the 2007 version, while only FYR of Macedo-nia has translated the 2010 version.
103. GOST 13109-97.
EN 50160 is mainly applied on low and medium voltage levels up to 35 kV. In the majority of the CPs where it is implemented, EN 50160 is predominantly used as a standard for supply voltage variations. However, in Croatia limits for other voltage disturbances are also defined more or less in line with EN 50160. In Bosnia and Herzegovina, quality
of electricity has to be in line with EN 50160 as of 1 January 2016. In most of the CPs, EN 50160 still has not been translated in practical terms102.
The implementation status of EN 50160 in each of the reporting CPs is presented in Table 19.
TABLE 19 I EN 50160 Implementation Status
CP Implementation statusDifferent standards from EN 510160 and the way
they are enforcedAlbania Voluntary standard Yes, law
Bosnia and HerzegovinaYes partially, general conditions of supply and grid
code; F-BiH: fully from 2016 Republika Srpska: fully from 2015
Yes, law, grid/distribution code
CroatiaYes partially,
general conditions of supply and Grid CodeYes, grid code
FYR of Macedonia Voluntary standard, implementation planned for 2012 Yes, law, grid/distribution codesMoldova no Yes, standards committeeMontenegro no Yes, grid/distribution codes
SerbiaVoluntary standard; implementation in the grid code
planned for 2011Yes, law, grid/distribution code
Ukraine no Yes, standards committeeUnMik Yes Yes, distribution code
3.2.2 Legislations and Regulations that differ from EN 50160
All CPs have introduced voltage quality requirements going beyond EN 50160 in their legislation and regulation. Voltage quality standards that are different from those indicated in EN 50160 are implemented for some voltage characteristics, mainly via laws and network codes as presented in Table 19. In Moldova and Ukraine, voltage quality limits for different voltage characteristics are defined by an interstate standard on voltage quality103 approved by the Interstate Council of Standardisation, Metrology and Certification.
The limits that are defined in legislation and network codes on supply voltage variations mainly correspond to EN 50160 for MV and LV level. In some CPs more strict requirements for supply voltage variations are in place. Voltage limits on other voltage levels mainly ad up to ±5% for 400 kV, ±10% or ±5% for 220 kV and ±10% for 110 kV.
The currently applied voltage quality standards in the CPs are shown in Table 20.
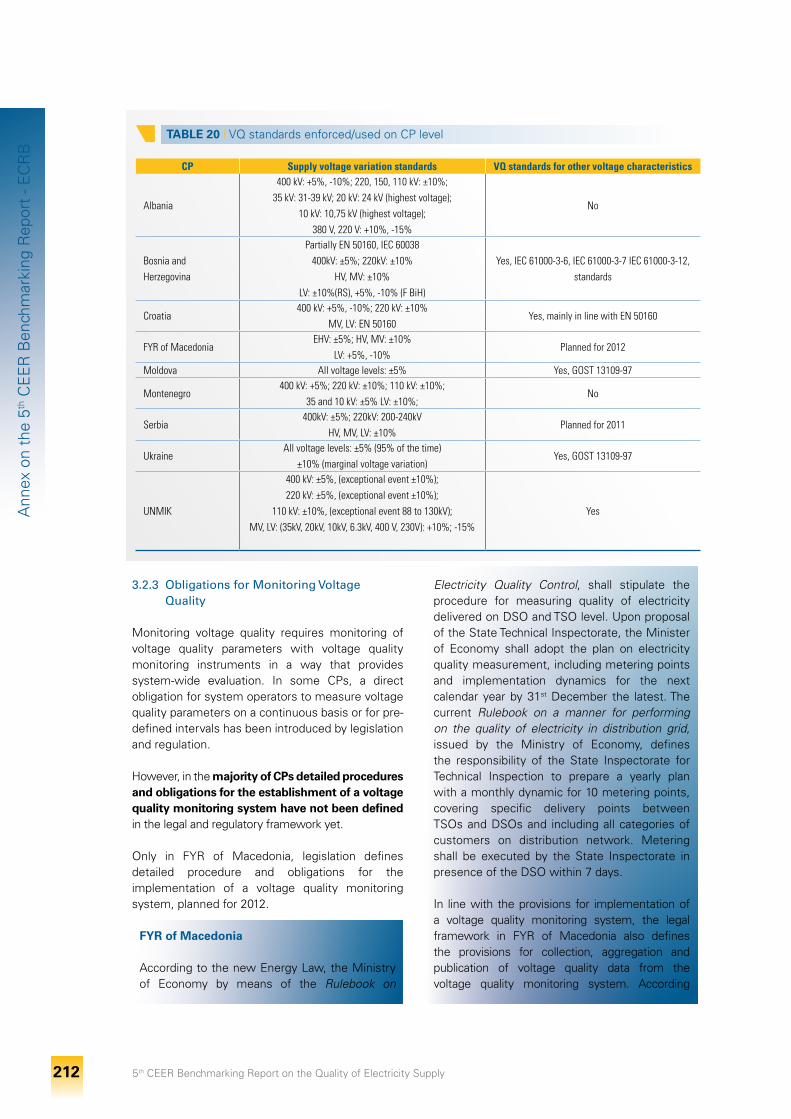
5th CEER Benchmarking Report on the Quality of Electricity Supply 212
Ann
ex o
n th
e 5th
CE
ER
Ben
chm
arki
ng R
epor
t - E
CR
B
3.2.3 Obligations for Monitoring Voltage Quality
Monitoring voltage quality requires monitoring of voltage quality parameters with voltage quality monitoring instruments in a way that provides system-wide evaluation. In some CPs, a direct obligation for system operators to measure voltage quality parameters on a continuous basis or for pre-defined intervals has been introduced by legislation and regulation.
However, in the majority of CPs detailed procedures and obligations for the establishment of a voltage quality monitoring system have not been defined in the legal and regulatory framework yet.
Only in FYR of Macedonia, legislation defines detailed procedure and obligations for the implementation of a voltage quality monitoring system, planned for 2012.
FYR of Macedonia
According to the new Energy Law, the Ministry of Economy by means of the Rulebook on
Electricity Quality Control, shall stipulate the procedure for measuring quality of electricity delivered on DSO and TSO level. Upon proposal of the State Technical Inspectorate, the Minister of Economy shall adopt the plan on electricity quality measurement, including metering points and implementation dynamics for the next calendar year by 31st December the latest. The current Rulebook on a manner for performing on the quality of electricity in distribution grid, issued by the Ministry of Economy, defines the responsibility of the State Inspectorate for Technical Inspection to prepare a yearly plan with a monthly dynamic for 10 metering points, covering specific delivery points between TSOs and DSOs and including all categories of customers on distribution network. Metering shall be executed by the State Inspectorate in presence of the DSO within 7 days.
In line with the provisions for implementation of a voltage quality monitoring system, the legal framework in FYR of Macedonia also defines the provisions for collection, aggregation and publication of voltage quality data from the voltage quality monitoring system. According
TABLE 20 I VQ standards enforced/used on CP level
CP Supply voltage variation standards VQ standards for other voltage characteristics
Albania
400 kV: +5%, -10%; 220, 150, 110 kV: ±10%; 35 kV: 31-39 kV; 20 kV: 24 kV (highest voltage);
10 kV: 10,75 kV (highest voltage); 380 V, 220 V: +10%, -15%
no
Bosnia and Herzegovina
Partially En 50160, iEC 60038 400kV: ±5%; 220kV: ±10%
HV, MV: ±10% LV: ±10%(RS), +5%, -10% (F BiH)
Yes, iEC 61000-3-6, iEC 61000-3-7 iEC 61000-3-12, standards
Croatia400 kV: +5%, -10%; 220 kV: ±10%
MV, LV: En 50160Yes, mainly in line with En 50160
FYR of MacedoniaEHV: ±5%; HV, MV: ±10%
LV: +5%, -10%Planned for 2012
Moldova All voltage levels: ±5% Yes, GOST 13109-97
Montenegro400 kV: +5%; 220 kV: ±10%; 110 kV: ±10%;
35 and 10 kV: ±5% LV: ±10%;no
Serbia400kV: ±5%; 220kV: 200-240kV
HV, MV, LV: ±10%Planned for 2011
UkraineAll voltage levels: ±5% (95% of the time)
±10% (marginal voltage variation) Yes, GOST 13109-97
UnMik
400 kV: ±5%, (exceptional event ±10%); 220 kV: ±5%, (exceptional event ±10%);
110 kV: ±10%, (exceptional event 88 to 130kV); MV, LV: (35kV, 20kV, 10kV, 6.3kV, 400 V, 230V): +10%; -15%
Yes
5th CEER Benchmarking Report on the Quality of Electricity Supply 213
Ann
ex o
n th
e 5th
CE
ER
Ben
chm
arki
ng R
epor
t - E
CR
B
to the legislation, voltage quality data shall be collected and stored by the State Inspectorate for Technical Inspection. By 15th March the latest, the State Inspectorate shall submit to the Ministry of Economy and the RA the report on the implementation of the plan for the previous calendar year. The yearly report shall be published on the website of the State Technical Inspectorate and the Ministry of Economy. Aggregated/individual voltage quality data shall be made available upon request of the RA and current users.
In the other CPs, no specific requirements regarding voltage quality measuring have been implemented in legislation and regulation, except for Bosnia and Herzegovina where the General Conditions require that measurements of voltage quality have to be executed in accordance with IEC 61000-4 or with the respective standard in Bosnia and Herzegovina (BAS). In some CPs, certain requirements for voltage quality monitoring instruments still exist from the time before the RA became operational.
3.2.4 Individual Voltage Quality Verification
In the majority of CPs, TSO/DSOs are legally obliged to install a voltage quality recorder only upon request of an end-user who experiences problems due to insufficient voltage quality at its connection point. For the other CPs, voltage quality monitoring is performed even if the TSO/DSOs are not legally obliged to do so. In most of the cases, the costs are covered by the TSO/DSO, while in some CPs the costs are charged to the customer in case voltage quality proofs to comply with the requirements. A possibility for an end-user to install its own voltage quality recorder and the measured data in a dispute with the TSO/DSOs is not recognized in the majority of the CPs, with the exception of Ukraine.
Financial penalties for violation of quality limits are only foreseen in Ukraine.
Ukraine
The Electricity Law provides the consumer with the right for compensation in case the DSO does not provide voltage quality in line with the standards. The compensation is calculated as 25% of the cost of electricity consumed during the billing period.
Customers need to address their supplier to conduct a joint measurement of voltage quality parameters and file a claim in which all details (period of time, type of parameters and deviation from standards) have to be indicated104. In case the supplier does not meet the relevant customer within the time limits require by the rules105, the consumer is entitled to file the claim directly and without form requirements. In case the energy supplier refuses to sign the claim, the claim is still considered valid if signed by at least three customers or by the consumer and any RA representative. In case the energy supplier refuses to execute the necessary voltage quality measurements, the customer has the right to organise such measurements by himself. In this case the energy supplier has to reimburse the customer for all related expenses.
Based on the claim the supplier within 10 days has to either take appropriate measures and recalculation of payment for low voltage quality or provide the customer with a reasonable justification for refusal. In case the energy supplier refuses compensation payments, the customer has the right to sue the payment in court.
3.2.5 Individual Information on Voltage Quality
The obligation of providing individual information on voltage quality is still not legally defined in the majority of the CPs. Only in Bosnia and Herzegovina TSO/DSOs are legally obliged to inform the end-user about the past or expected future voltage quality levels. However, it seems that even without legal obligation, TSO/DSOs inform customers about voltage quality levels upon their request.
An overview of the legal obligations covered in Sections 3.2.3, 3.2.4 and 3.2.5 is provided in Table 21.
In most of the CPs, the responsibility for improving the overall voltage quality and/or rectifying voltage disturbances is shared between the State Inspectorate, the TSO/DSOs, customers and the RA. However, responsibilities are not clearly legally defined. The role of the RA is mainly limited to approving codes, while the direct authority for voltage quality regulation is not defined.
104. A template is part of the rules of electricity use for households. 105. 3 days for urban and 7 days for rural areas after receipt of the request.
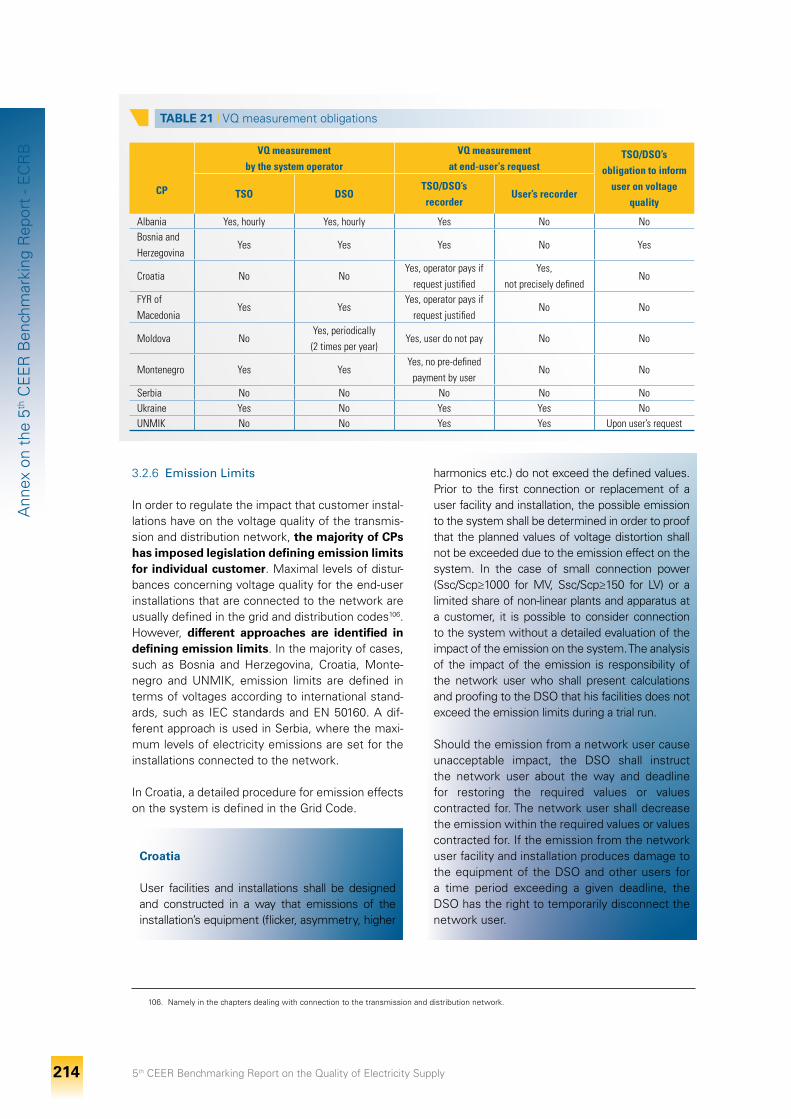
5th CEER Benchmarking Report on the Quality of Electricity Supply 214
Ann
ex o
n th
e 5th
CE
ER
Ben
chm
arki
ng R
epor
t - E
CR
B
3.2.6 Emission Limits
In order to regulate the impact that customer instal-lations have on the voltage quality of the transmis-sion and distribution network, the majority of CPs has imposed legislation defining emission limits for individual customer. Maximal levels of distur-bances concerning voltage quality for the end-user installations that are connected to the network are usually defined in the grid and distribution codes106. However, different approaches are identified in defining emission limits. In the majority of cases, such as Bosnia and Herzegovina, Croatia, Monte-negro and UNMIK, emission limits are defined in terms of voltages according to international stand-ards, such as IEC standards and EN 50160. A dif-ferent approach is used in Serbia, where the maxi-mum levels of electricity emissions are set for the installations connected to the network.
In Croatia, a detailed procedure for emission effects on the system is defined in the Grid Code.
Croatia
User facilities and installations shall be designed and constructed in a way that emissions of the installation’s equipment (flicker, asymmetry, higher
harmonics etc.) do not exceed the defined values. Prior to the first connection or replacement of a user facility and installation, the possible emission to the system shall be determined in order to proof that the planned values of voltage distortion shall not be exceeded due to the emission effect on the system. In the case of small connection power (Ssc/Scp≥1000 for MV, Ssc/Scp≥150 for LV) or a limited share of non-linear plants and apparatus at a customer, it is possible to consider connection to the system without a detailed evaluation of the impact of the emission on the system. The analysis of the impact of the emission is responsibility of the network user who shall present calculations and proofing to the DSO that his facilities does not exceed the emission limits during a trial run.
Should the emission from a network user cause unacceptable impact, the DSO shall instruct the network user about the way and deadline for restoring the required values or values contracted for. The network user shall decrease the emission within the required values or values contracted for. If the emission from the network user facility and installation produces damage to the equipment of the DSO and other users for a time period exceeding a given deadline, the DSO has the right to temporarily disconnect the network user.
106. Namely in the chapters dealing with connection to the transmission and distribution network.
TABLE 21 I VQ measurement obligations
CP
VQ measurement by the system operator
VQ measurement at end-user‘s request
TSO/DSO’s obligation to inform
user on voltage quality
TSO DSOTSO/DSO’s recorder
User’s recorder
Albania Yes, hourly Yes, hourly Yes no noBosnia and Herzegovina
Yes Yes Yes no Yes
Croatia no noYes, operator pays if
request justifiedYes,
not precisely definedno
FYR of Macedonia
Yes YesYes, operator pays if
request justifiedno no
Moldova noYes, periodically (2 times per year)
Yes, user do not pay no no
Montenegro Yes YesYes, no pre-defined
payment by userno no
Serbia no no no no noUkraine Yes no Yes Yes noUnMik no no Yes Yes Upon user’s request
5th CEER Benchmarking Report on the Quality of Electricity Supply 215
Ann
ex o
n th
e 5th
CE
ER
Ben
chm
arki
ng R
epor
t - E
CR
B
Penalties for customers in case of violation of the maximum levels of disturbances - other than disconnection - are not envisaged in any of the observed CPs.
3.3 Voltage Quality Monitoring Systems and Data
A voltage quality monitoring system has been implemented only in Bosnia and Herzegovina and consequently actual voltage quality data has been provided by Bosnia and Herzegovina only. The other CPs still have not installed voltage quality monitoring system.
3.3.1 Development of Voltage Quality Monitoring Systems
Bosnia and Herzegovina has voluntarily implemented a voltage quality monitoring system for the purpose of statistics and research. Voltage quality monitoring is mainly executed on HV/MV delivery points between the TSO and the DSO with portable instruments, namely with one instrument per location and type of network points monitored, on a rolling basis. Pre-defined tariffs exist for the cost of monitoring.
3.3.2 Smart Meters and Voltage Quality Monitoring
In most of the CPs smart meters have not been introduced for the time being. However, in some CPs a small number of smart meters have been already installed. However, those meters do not allow for voltage quality monitoring and there are no related functionality requirements for smart meters imposed.
3.3.3 Data Collection, Aggregation and Publication from Voltage Quality Monitoring System
Taking into account that most of the surveyed CPs still do not have any voltage quality monitoring system implemented, they also do not have any practice and procedures established for data collection, aggregation and publication.
Consequently, only Bosnia and Herzegovina provided information on current practice in collection, aggregation and publication of voltage quality data from the voltage quality monitoring system. Collected data is stored centrally and
available upon request of the RA and network users. This data has been published only in studies, since responsibility for publication has not been defined yet.
3.3.4 Actual Data for Voltage Dips, other VQ Parameters and Mitigation Measures
Almost no CP was able to provide any actual data on voltage dips and other VQ parameters. Also, data on mitigation measures is not available.
Only Bosnia and Herzegovina provided some monitoring data on VQ parameters, reporting a value of 132 voltage dips per HV substation delivery points per year (estimated) based on 33 voltage dips registered in the measurement campaign at a limited number of locations (6) during part of 2008 (91 day). Data for the following years were not available. In the period 27 March, to 2 May 2010 high voltages were recorded in 400 kV and 220 kV network in Bosnia and Herzegovina where practically in all nodes at 400 kV and in some nodes at 220 kV, voltages exceeded the upper limits up to 32% of the total measuring time. In order to resolve VQ problems in the network, study has been done and non-allowed voltages were identified.
3.4 Findings and Recommendations on Voltage Quality
Finding #1EN 50160 is implemented in most CPs
EN 50160 is implemented in most CPs, mainly as voluntary standard but also by legislation and regulation. It is usually defined in the general conditions of supply or network codes, either by reference to the EN 50160 or by taking its limits over. EN 50160 is mainly applied on low and medium voltage levels up to 35 kV. Additionally, it is predominantly used as standard for supply voltage variations.
In most of the CPs, EN 50160 has not been translated.
Voltage quality standards that differ from EN 50160, such as IEC 61000-x-x have been introduced for some voltage characteristics, mainly via national legislation and network codes. Different standards are introduced for different reasons: historical, different network characteristics, introducing new stricter limits, etc.
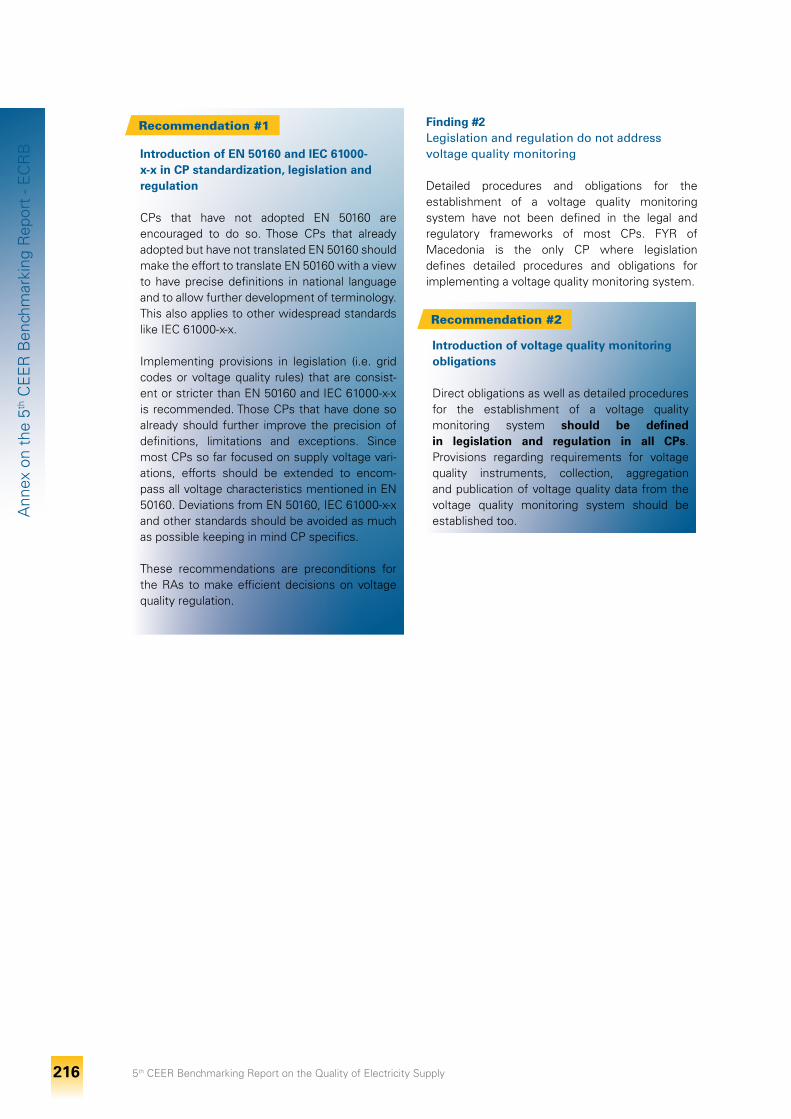
5th CEER Benchmarking Report on the Quality of Electricity Supply 216
Ann
ex o
n th
e 5th
CE
ER
Ben
chm
arki
ng R
epor
t - E
CR
B
Finding #2Legislation and regulation do not address voltage quality monitoring
Detailed procedures and obligations for the establishment of a voltage quality monitoring system have not been defined in the legal and regulatory frameworks of most CPs. FYR of Macedonia is the only CP where legislation defines detailed procedures and obligations for implementing a voltage quality monitoring system.
Recommendation #2
Introduction of voltage quality monitoring obligations
Direct obligations as well as detailed procedures for the establishment of a voltage quality monitoring system should be defined in legislation and regulation in all CPs. Provisions regarding requirements for voltage quality instruments, collection, aggregation and publication of voltage quality data from the voltage quality monitoring system should be established too.
Recommendation #1
Introduction of EN 50160 and IEC 61000-x-x in CP standardization, legislation and regulation
CPs that have not adopted EN 50160 are encouraged to do so. Those CPs that already adopted but have not translated EN 50160 should make the effort to translate EN 50160 with a view to have precise definitions in national language and to allow further development of terminology. This also applies to other widespread standards like IEC 61000-x-x.
Implementing provisions in legislation (i.e. grid codes or voltage quality rules) that are consist-ent or stricter than EN 50160 and IEC 61000-x-x is recommended. Those CPs that have done so already should further improve the precision of definitions, limitations and exceptions. Since most CPs so far focused on supply voltage vari-ations, efforts should be extended to encom-pass all voltage characteristics mentioned in EN 50160. Deviations from EN 50160, IEC 61000-x-x and other standards should be avoided as much as possible keeping in mind CP specifics.
These recommendations are preconditions for the RAs to make efficient decisions on voltage quality regulation.

5th CEER Benchmarking Report on the Quality of Electricity Supply 217
Ann
ex o
n th
e 5th
CE
ER
Ben
chm
arki
ng R
epor
t - E
CR
B
Finding #3Voltage quality monitoring systems have not been implemented
Voltage quality monitoring systems for continuous voltage quality monitoring have not been installed in any of the CPs. Data on actual voltage quality levels therefore is not available. Only in Bosnia and Herzegovina, a voltage quality monitoring system for the purpose of research has been voluntarily installed, and consequently some data has been provided.
Finding #4Individual voltage quality verification is available in the majority of the CPs
In most CPs, TSO/DSOs are legally obliged to provide individual voltage quality verification upon request of end-users who experiences voltage quality problems. In several CPs, even without a legal obligation, in practice, TSO/DSOs perform individual voltage quality verification. In most of the cases, costs are covered by the TSO/DSO, while in some CPs costs are covered by the customer in case that voltage quality proofs to comply with the requirements. The obligation of providing individual information on voltage quality is still not legally defined in the majority of the CPs.
Recommendation #3
Voltage quality monitoring systems should be implemented
CPs should courage TSO/DSOs to develop voltage quality monitoring systems for continuous voltage quality monitoring in their networks. Monitoring should take place at locations at which a good estimation of the voltage quality as experienced by customers can be made. It is further acknowledged that the data from continuous voltage quality monitoring can provide useful information for the TSO/DSOs, resulting in significant cost savings and information to support investment decisions.
Having in mind that implementation of voltage quality monitoring systems have not started yet in the CPs, it is recommended for the CPs - prior to the implementation - to undertake joint activities towards harmonisation of voltage quality parameters and measurement methods.
The key scope of compulsory or regulator-controlled monitoring should be to verify compliance with voltage quality requirements (both overall and for individual customers); to provide information to customers on their actual or expected voltage quality; and to obtain information for the setting of appropriate future requirements. This should be considered when deciding about the need for compulsory or regulator-controlled monitoring.
Recommendation #4
Introduction and development of individual voltage quality verification provisions
The legal obligation for TSO/DSOs to provide individual voltage quality verification upon user’s request should be adopted in all CPs. This obligation should be accompanied by a detailed description of the procedure by the TSO/DSOs ensuring that all relevant information about the procedure is available to customers, including the definition and allocation of costs related to the verification.
Statistics on complaints and verification results should be used by system operators for identifying areas that need improvements. RAs should use such statistics for regulatory decisions regarding voltage quality.
It is further recommended that statistics on complaints and verification results correlate with the results from continuous voltage quality monitoring (if in place).
In the verification process, the system operator should make reasonable efforts to identify the cause of the disturbance.
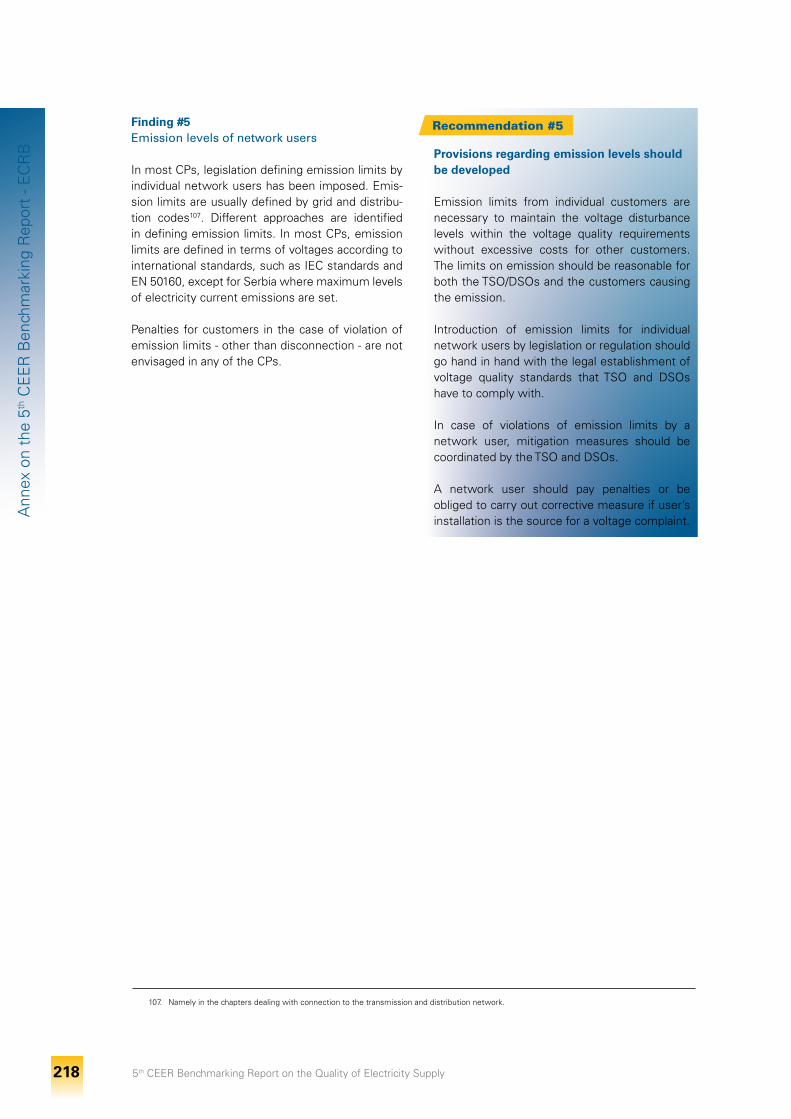
5th CEER Benchmarking Report on the Quality of Electricity Supply 218
Ann
ex o
n th
e 5th
CE
ER
Ben
chm
arki
ng R
epor
t - E
CR
B
Finding #5Emission levels of network users
In most CPs, legislation defining emission limits by individual network users has been imposed. Emis-sion limits are usually defined by grid and distribu-tion codes107. Different approaches are identified in defining emission limits. In most CPs, emission limits are defined in terms of voltages according to international standards, such as IEC standards and EN 50160, except for Serbia where maximum levels of electricity current emissions are set.
Penalties for customers in the case of violation of emission limits - other than disconnection - are not envisaged in any of the CPs.
Recommendation #5
Provisions regarding emission levels should be developed
Emission limits from individual customers are necessary to maintain the voltage disturbance levels within the voltage quality requirements without excessive costs for other customers. The limits on emission should be reasonable for both the TSO/DSOs and the customers causing the emission.
Introduction of emission limits for individual network users by legislation or regulation should go hand in hand with the legal establishment of voltage quality standards that TSO and DSOs have to comply with.
In case of violations of emission limits by a network user, mitigation measures should be coordinated by the TSO and DSOs.
A network user should pay penalties or be obliged to carry out corrective measure if user’s installation is the source for a voltage complaint.
107. Namely in the chapters dealing with connection to the transmission and distribution network.
5th CEER Benchmarking Report on the Quality of Electricity Supply 219
Ann
ex o
n th
e 5th
CE
ER
Ben
chm
arki
ng R
epor
t - E
CR
B
4.Commercial Quality
4.1 Introduction
The present benchmarking activity is the first major effort to systematically investigate Commercial Quality (CQ) in the CPs. The answers received indicate that regulation of Commercial Quality still is in an early stage in all assessed CPs.
The questionnaire used for the present report stressed the complexity of Commercial Quality with multiple suppliers and regulated entities like DSO and Universal Service Providers. A brief examination of a supposedly simple business process, like solving a Voltage Quality complaint, reveals that CQ standards strongly correlate with the market design and legal framework. For most CPs this implies the need to further develop the legislation and practice to accommodate even basic service quality regulation. For example, on the process of solving a Voltage Complaint, precise definitions of triggers and time intervals are crucial, as well as defining the entity on which a certain trigger/event/process applies to, since it is really different if the customer calls his supplier in comparison to the scenario where the customer calls to DSO directly.
4.2 Overview of Commercial Quality Standards in CPs
As suggested by the previous CEER Benchmarking reports and the questionnaire used for the present benchmarking, CQ requirements have been categorised in two main: Guaranteed Standards (GSs) and Overall Standards (OSs) and two supplementary: Other Available Requirements (OAR) and Only Monitoring (OM) standards. The explanation of the standards can be found in Section 4.4.3 of Chapter 4 (Commercial quality chapter) of this Benchmarking Report.
Commercial quality has been reviewed by using the same four groups of indicators applied in Section 4.4.1 of Chapter 4 (Commercial quality chapter) of this Benchmarking Report:1. Connection (Group I);2. Customer Care (Group II);3. Technical Service (Group III); and4. Metering and billing (Group IV).
The assessment shows an overwhelming use of explicit provisions regarding quality where
the standard is applied to all (100%) cases (Table 22). Although such provisions are in essence GS, in line with the benchmarking guidelines, such standards are labeled as OAR because there is no compensation for individual customers and often there is no penalty defined. For most of these standards, penalties are based either on vague and imprecise general penal provisions or simply do not exists (even if required by primary legislation). Additionally, it should be mentioned that the OARs present in the Energy Community CPs are usually not influenced by the RA, but are rather defined in primary or secondary legislation.
Table 22 shows that commercial quality is largely enforced by OAR (91 out of a total of 116). All analysed CPs approximately have the same number of standards - in the range of [9, 16] - with the exception of Albania that reported just 3 standards. Higher values for Serbia and UNMIK are a result of multiple standards set within an indicator (i.e. Serbia usually has different standards for LV and MV).
Table 23 shows that there is no particular group with a prevailing number of standards. This means that CQ is equally developed (or rather equally undeveloped) in all indicator groups, with the exception of group II – Customer Care which has twice as many indicators in comparison to other groups.
If the total number of standards per indicator is considered (again Table 23), it shows that indicator “I.3 Time for connecting new customers to the network” has the highest number of standards. Closely following are indicators dealing with connections claims and disconnections (I.3, I.4 and IV.16). Also, handling complaints is important with a high total of standards (II.6, II.6a).
For the present benchmarking the distinction between standards applied to DSOs, Suppliers and Universal Suppliers (USPs) is presently not informative since national electricity markets are developing. Therefore, an overview of standards and data availability with respect to the relevant company is skipped. However, some remarks will be given in the chapters analysing particular groups of indicators.
It should be noted that the current benchmarking is mainly focused on commercial performances of
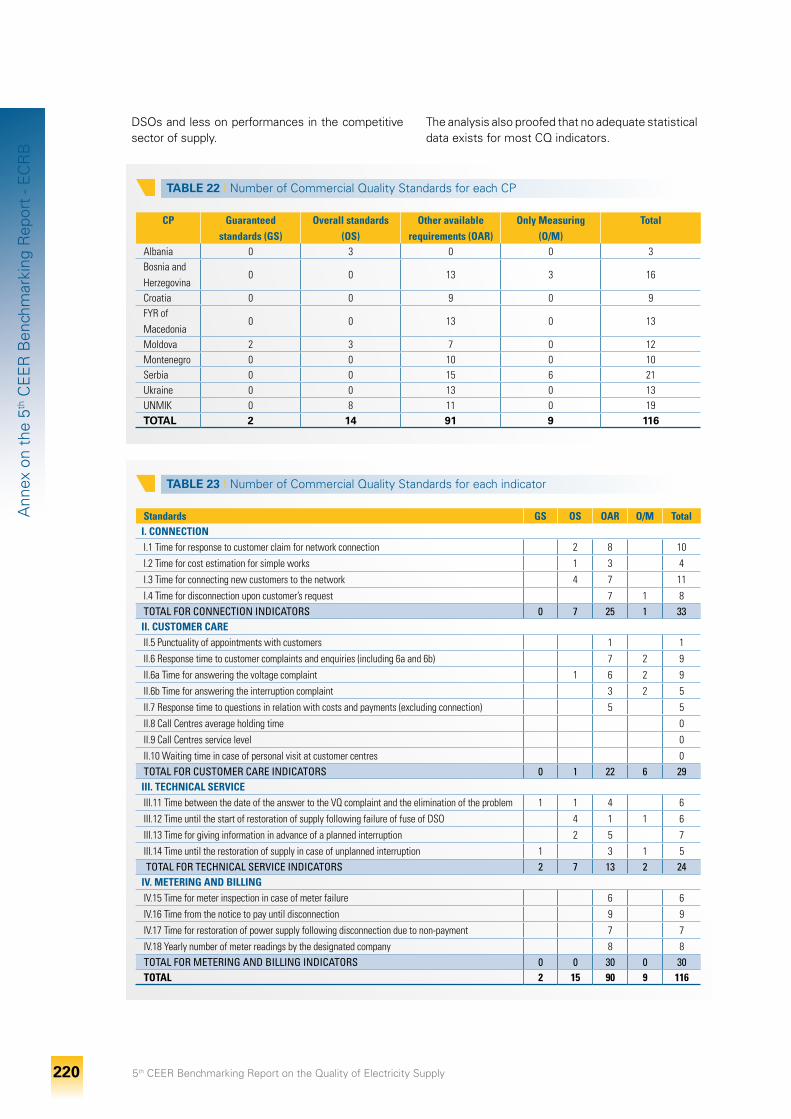
5th CEER Benchmarking Report on the Quality of Electricity Supply 220
Ann
ex o
n th
e 5th
CE
ER
Ben
chm
arki
ng R
epor
t - E
CR
B
TABLE 22 I Number of Commercial Quality Standards for each CP
CP Guaranteed standards (GS)
Overall standards (OS)
Other available requirements (OAR)
Only Measuring (O/M)
Total
Albania 0 3 0 0 3Bosnia and Herzegovina
0 0 13 3 16
Croatia 0 0 9 0 9FYR of Macedonia
0 0 13 0 13
Moldova 2 3 7 0 12Montenegro 0 0 10 0 10Serbia 0 0 15 6 21Ukraine 0 0 13 0 13UnMik 0 8 11 0 19TOTAL 2 14 91 9 116
TABLE 23 I Number of Commercial Quality Standards for each indicator
Standards GS OS OAR O/M TotalI. CONNECTIONi.1 Time for response to customer claim for network connection 2 8 10
i.2 Time for cost estimation for simple works 1 3 4
i.3 Time for connecting new customers to the network 4 7 11
i.4 Time for disconnection upon customer’s request 7 1 8TOTAL FOR CONNECTION INDICATORS 0 7 25 1 33II. CUSTOMER CAREii.5 Punctuality of appointments with customers 1 1
ii.6 Response time to customer complaints and enquiries (including 6a and 6b) 7 2 9
ii.6a Time for answering the voltage complaint 1 6 2 9
ii.6b Time for answering the interruption complaint 3 2 5
ii.7 Response time to questions in relation with costs and payments (excluding connection) 5 5
ii.8 Call Centres average holding time 0
ii.9 Call Centres service level 0
ii.10 Waiting time in case of personal visit at customer centres 0TOTAL FOR CUSTOMER CARE INDICATORS 0 1 22 6 29III. TECHNICAL SERVICEiii.11 Time between the date of the answer to the VQ complaint and the elimination of the problem 1 1 4 6
iii.12 Time until the start of restoration of supply following failure of fuse of DSO 4 1 1 6
iii.13 Time for giving information in advance of a planned interruption 2 5 7
iii.14 Time until the restoration of supply in case of unplanned interruption 1 3 1 5 TOTAL FOR TECHNICAL SERVICE INDICATORS 2 7 13 2 24IV. METERING AND BILLINGiV.15 Time for meter inspection in case of meter failure 6 6
iV.16 Time from the notice to pay until disconnection 9 9
iV.17 Time for restoration of power supply following disconnection due to non-payment 7 7
iV.18 Yearly number of meter readings by the designated company 8 8TOTAL FOR METERING AND BILLING INDICATORS 0 0 30 0 30TOTAL 2 15 90 9 116
DSOs and less on performances in the competitive sector of supply.
The analysis also proofed that no adequate statistical data exists for most CQ indicators.
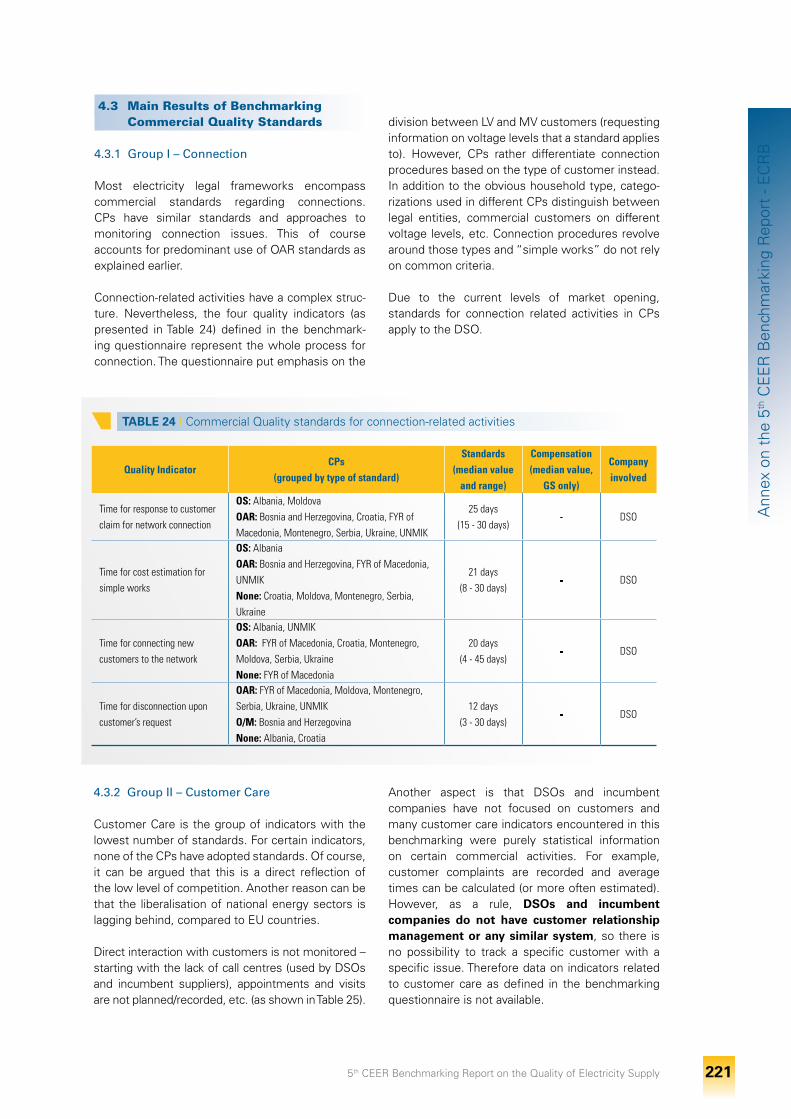
5th CEER Benchmarking Report on the Quality of Electricity Supply 221
Ann
ex o
n th
e 5th
CE
ER
Ben
chm
arki
ng R
epor
t - E
CR
B
4.3 Main Results of Benchmarking Commercial Quality Standards
4.3.1 Group I – Connection
Most electricity legal frameworks encompass commercial standards regarding connections. CPs have similar standards and approaches to monitoring connection issues. This of course accounts for predominant use of OAR standards as explained earlier.
Connection-related activities have a complex struc-ture. Nevertheless, the four quality indicators (as presented in Table 24) defined in the benchmark-ing questionnaire represent the whole process for connection. The questionnaire put emphasis on the
division between LV and MV customers (requesting information on voltage levels that a standard applies to). However, CPs rather differentiate connection procedures based on the type of customer instead. In addition to the obvious household type, catego-rizations used in different CPs distinguish between legal entities, commercial customers on different voltage levels, etc. Connection procedures revolve around those types and “simple works” do not rely on common criteria.
Due to the current levels of market opening, standards for connection related activities in CPs apply to the DSO.
TABLE 24 I Commercial Quality standards for connection-related activities
Quality IndicatorCPs
(grouped by type of standard)
Standards (median value
and range)
Compensation (median value,
GS only)
Company involved
Time for response to customer claim for network connection
OS: Albania, Moldova OAR: Bosnia and Herzegovina, Croatia, FYR of Macedonia, Montenegro, Serbia, Ukraine, UnMik
25 days (15 - 30 days)
- DSO
Time for cost estimation for simple works
OS: Albania OAR: Bosnia and Herzegovina, FYR of Macedonia, UnMik None: Croatia, Moldova, Montenegro, Serbia, Ukraine
21 days (8 - 30 days)
- DSO
Time for connecting new customers to the network
OS: Albania, UnMik OAR: FYR of Macedonia, Croatia, Montenegro, Moldova, Serbia, Ukraine None: FYR of Macedonia
20 days (4 - 45 days)
- DSO
Time for disconnection upon customer’s request
OAR: FYR of Macedonia, Moldova, Montenegro, Serbia, Ukraine, UnMik O/M: Bosnia and Herzegovina None: Albania, Croatia
12 days (3 - 30 days)
- DSO
4.3.2 Group II – Customer Care
Customer Care is the group of indicators with the lowest number of standards. For certain indicators, none of the CPs have adopted standards. Of course, it can be argued that this is a direct reflection of the low level of competition. Another reason can be that the liberalisation of national energy sectors is lagging behind, compared to EU countries.
Direct interaction with customers is not monitored – starting with the lack of call centres (used by DSOs and incumbent suppliers), appointments and visits are not planned/recorded, etc. (as shown in Table 25).
Another aspect is that DSOs and incumbent companies have not focused on customers and many customer care indicators encountered in this benchmarking were purely statistical information on certain commercial activities. For example, customer complaints are recorded and average times can be calculated (or more often estimated). However, as a rule, DSOs and incumbent companies do not have customer relationship management or any similar system, so there is no possibility to track a specific customer with a specific issue. Therefore data on indicators related to customer care as defined in the benchmarking questionnaire is not available.
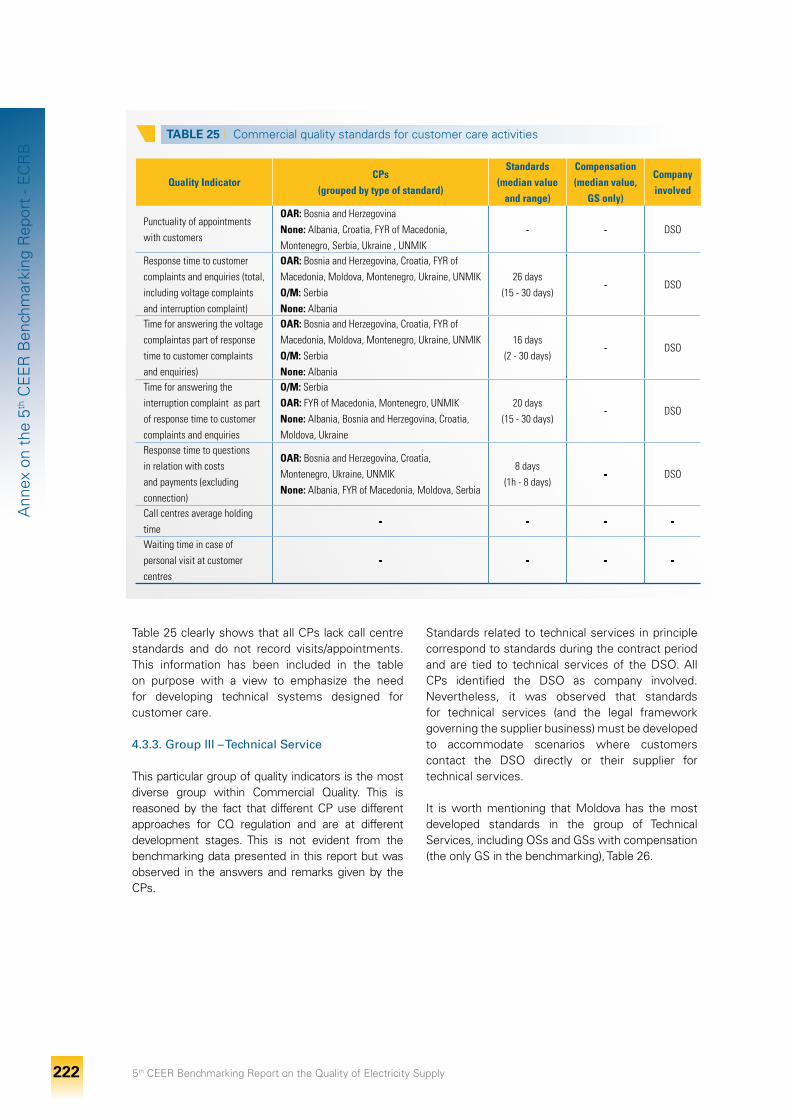
5th CEER Benchmarking Report on the Quality of Electricity Supply 222
Ann
ex o
n th
e 5th
CE
ER
Ben
chm
arki
ng R
epor
t - E
CR
B
Table 25 clearly shows that all CPs lack call centre standards and do not record visits/appointments. This information has been included in the table on purpose with a view to emphasize the need for developing technical systems designed for customer care.
4.3.3. Group III – Technical Service
This particular group of quality indicators is the most diverse group within Commercial Quality. This is reasoned by the fact that different CP use different approaches for CQ regulation and are at different development stages. This is not evident from the benchmarking data presented in this report but was observed in the answers and remarks given by the CPs.
Standards related to technical services in principle correspond to standards during the contract period and are tied to technical services of the DSO. All CPs identified the DSO as company involved. Nevertheless, it was observed that standards for technical services (and the legal framework governing the supplier business) must be developed to accommodate scenarios where customers contact the DSO directly or their supplier for technical services.
It is worth mentioning that Moldova has the most developed standards in the group of Technical Services, including OSs and GSs with compensation (the only GS in the benchmarking), Table 26.
TABLE 25 I Commercial quality standards for customer care activities
Quality IndicatorCPs
(grouped by type of standard)
Standards (median value
and range)
Compensation (median value,
GS only)
Company involved
Punctuality of appointments with customers
OAR: Bosnia and Herzegovina None: Albania, Croatia, FYR of Macedonia, Montenegro, Serbia, Ukraine , UnMik
- - DSO
Response time to customer complaints and enquiries (total, including voltage complaints and interruption complaint)
OAR: Bosnia and Herzegovina, Croatia, FYR of Macedonia, Moldova, Montenegro, Ukraine, UnMik O/M: Serbia None: Albania
26 days (15 - 30 days)
- DSO
Time for answering the voltage complaintas part of response time to customer complaints and enquiries)
OAR: Bosnia and Herzegovina, Croatia, FYR of Macedonia, Moldova, Montenegro, Ukraine, UnMik O/M: Serbia None: Albania
16 days (2 - 30 days)
- DSO
Time for answering the interruption complaint as part of response time to customer complaints and enquiries
O/M: Serbia OAR: FYR of Macedonia, Montenegro, UnMik None: Albania, Bosnia and Herzegovina, Croatia, Moldova, Ukraine
20 days (15 - 30 days)
- DSO
Response time to questions in relation with costs and payments (excluding connection)
OAR: Bosnia and Herzegovina, Croatia, Montenegro, Ukraine, UnMik None: Albania, FYR of Macedonia, Moldova, Serbia
8 days (1h - 8 days)
- DSO
Call centres average holding time
- - - -
Waiting time in case of personal visit at customer centres
- - - -
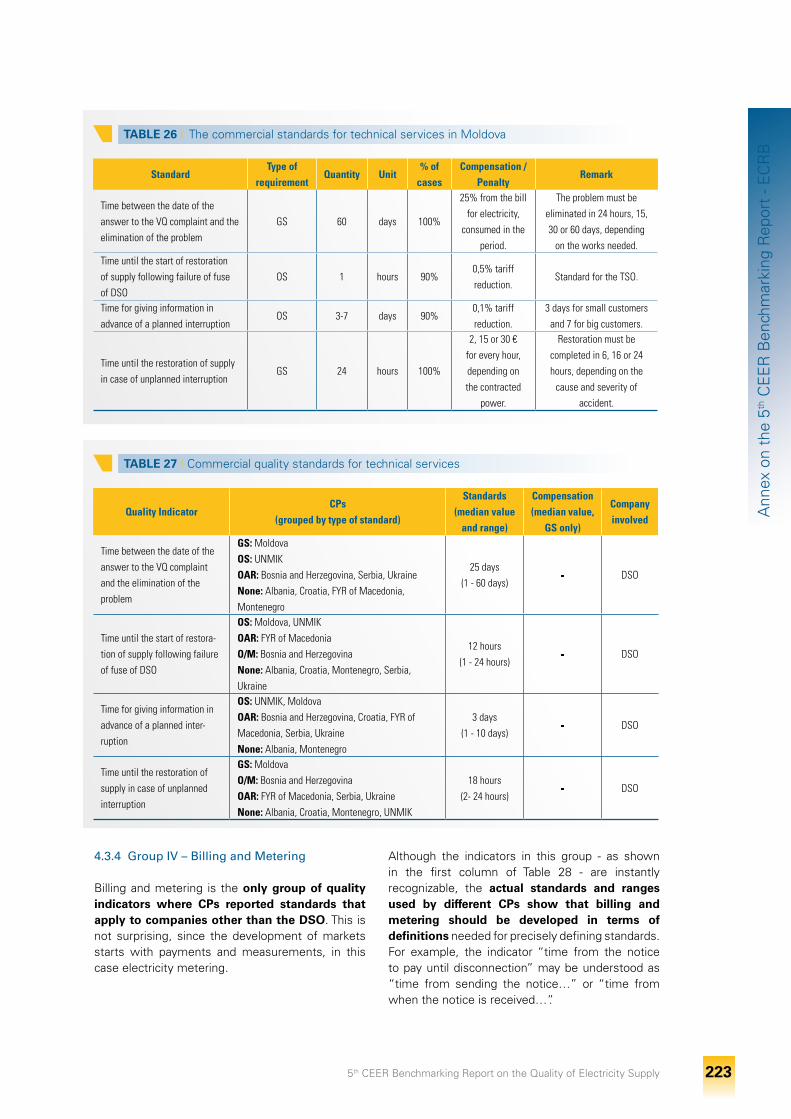
5th CEER Benchmarking Report on the Quality of Electricity Supply 223
Ann
ex o
n th
e 5th
CE
ER
Ben
chm
arki
ng R
epor
t - E
CR
B
4.3.4 Group IV – Billing and Metering
Billing and metering is the only group of quality indicators where CPs reported standards that apply to companies other than the DSO. This is not surprising, since the development of markets starts with payments and measurements, in this case electricity metering.
Although the indicators in this group - as shown in the first column of Table 28 - are instantly recognizable, the actual standards and ranges used by different CPs show that billing and metering should be developed in terms of definitions needed for precisely defining standards. For example, the indicator “time from the notice to pay until disconnection” may be understood as “time from sending the notice…” or “time from when the notice is received…”.
TABLE 26 I The commercial standards for technical services in Moldova
StandardType of
requirementQuantity Unit
% of cases
Compensation / Penalty
Remark
Time between the date of the answer to the VQ complaint and the elimination of the problem
GS 60 days 100%
25% from the bill for electricity,
consumed in the period.
The problem must be eliminated in 24 hours, 15, 30 or 60 days, depending
on the works needed.Time until the start of restoration of supply following failure of fuse of DSO
OS 1 hours 90%0,5% tariff reduction.
Standard for the TSO.
Time for giving information in advance of a planned interruption
OS 3-7 days 90%0,1% tariff reduction.
3 days for small customers and 7 for big customers.
Time until the restoration of supply in case of unplanned interruption
GS 24 hours 100%
2, 15 or 30 € for every hour, depending on the contracted
power.
Restoration must be completed in 6, 16 or 24 hours, depending on the
cause and severity of accident.
TABLE 27 I Commercial quality standards for technical services
Quality IndicatorCPs
(grouped by type of standard)
Standards (median value
and range)
Compensation (median value,
GS only)
Company involved
Time between the date of the answer to the VQ complaint and the elimination of the problem
GS: Moldova OS: UnMik OAR: Bosnia and Herzegovina, Serbia, Ukraine None: Albania, Croatia, FYR of Macedonia, Montenegro
25 days (1 - 60 days)
- DSO
Time until the start of restora-tion of supply following failure of fuse of DSO
OS: Moldova, UnMik OAR: FYR of Macedonia O/M: Bosnia and Herzegovina None: Albania, Croatia, Montenegro, Serbia, Ukraine
12 hours (1 - 24 hours)
- DSO
Time for giving information in advance of a planned inter-ruption
OS: UnMik, Moldova OAR: Bosnia and Herzegovina, Croatia, FYR of Macedonia, Serbia, UkraineNone: Albania, Montenegro
3 days (1 - 10 days)
- DSO
Time until the restoration of supply in case of unplanned interruption
GS: Moldova O/M: Bosnia and Herzegovina OAR: FYR of Macedonia, Serbia, Ukraine None: Albania, Croatia, Montenegro, UnMik
18 hours (2- 24 hours)
- DSO
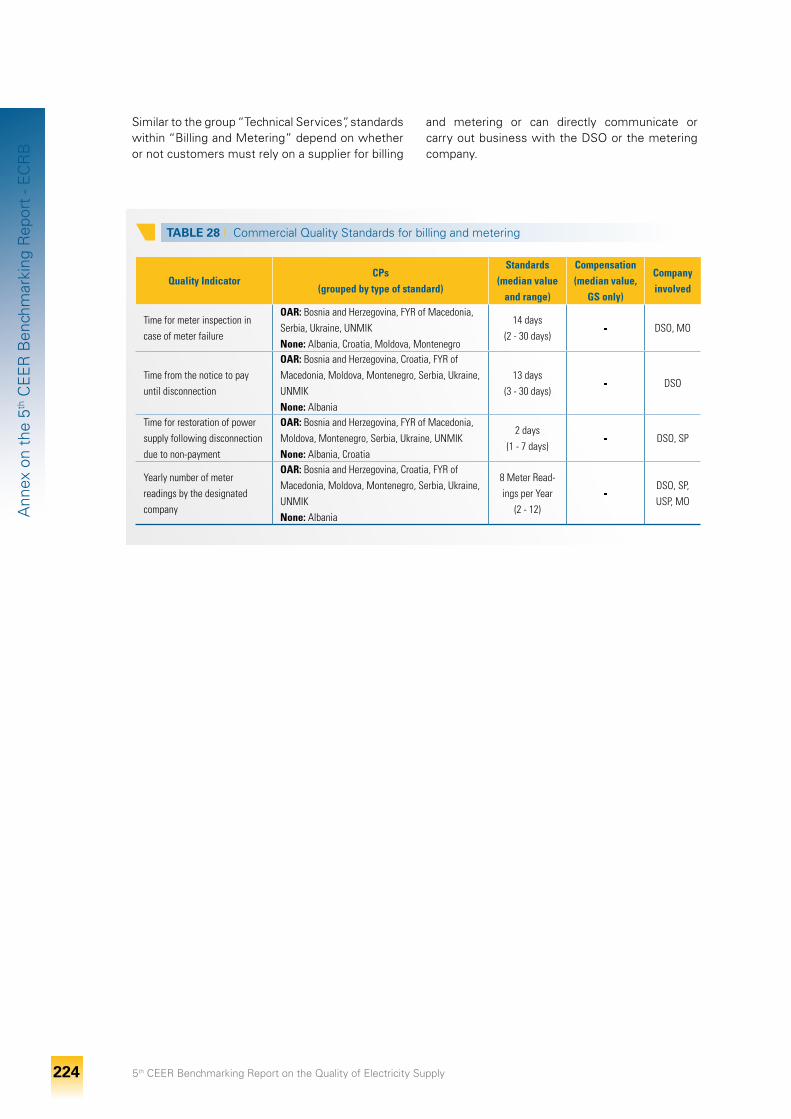
5th CEER Benchmarking Report on the Quality of Electricity Supply 224
Ann
ex o
n th
e 5th
CE
ER
Ben
chm
arki
ng R
epor
t - E
CR
B
Similar to the group “Technical Services”, standards within “Billing and Metering” depend on whether or not customers must rely on a supplier for billing
TABLE 28 I Commercial Quality Standards for billing and metering
Quality IndicatorCPs
(grouped by type of standard)
Standards (median value
and range)
Compensation (median value,
GS only)
Company involved
Time for meter inspection in case of meter failure
OAR: Bosnia and Herzegovina, FYR of Macedonia, Serbia, Ukraine, UnMik None: Albania, Croatia, Moldova, Montenegro
14 days (2 - 30 days)
- DSO, MO
Time from the notice to pay until disconnection
OAR: Bosnia and Herzegovina, Croatia, FYR of Macedonia, Moldova, Montenegro, Serbia, Ukraine, UnMik None: Albania
13 days (3 - 30 days)
- DSO
Time for restoration of power supply following disconnection due to non-payment
OAR: Bosnia and Herzegovina, FYR of Macedonia, Moldova, Montenegro, Serbia, Ukraine, UnMik None: Albania, Croatia
2 days (1 - 7 days)
- DSO, SP
Yearly number of meter readings by the designated company
OAR: Bosnia and Herzegovina, Croatia, FYR of Macedonia, Moldova, Montenegro, Serbia, Ukraine, UnMik None: Albania
8 Meter Read-ings per Year
(2 - 12)-
DSO, SP, USP, MO
and metering or can directly communicate or carry out business with the DSO or the metering company.
5th CEER Benchmarking Report on the Quality of Electricity Supply 225
Ann
ex o
n th
e 5th
CE
ER
Ben
chm
arki
ng R
epor
t - E
CR
B
4.4 Findings and Recommendations on Commercial Quality
In general, commercial quality is in an early stage in all surveyed CPs. Therefore, all general recommendations for developing quality of service can apply. However, there are four issues that are specific the CPs should be recognised.
It should also be mentioned that Commercial Quality in the CPs should be considered in a broader perspective. Customer rights are definitely lagging behind in comparison to customer rights in the EU.
Finding #1 There is an overwhelming use of standards that apply to all customers
There is an overwhelming use of explicit provisions that apply to all (100%) customers (cases). These provisions are in essence GS but they do not entail compensation for individual customers or a penalty for the company.
Recommendation #1
Existing standards that apply to all customers should be more specific
At first sight, it would not be difficult to develop such OARs into GS. It would be a simple matter of defining compensation for individual customers.
However, that approach would be risky since quality standards should be introduced gradually – initially starting with measuring performance. Applying a GS without a proper quantitative analysis can affect companies financially much more than expected or initiate a tremendous number of complaints that must be handled (by the utility or the RA).
Therefore, starting from the existing standards, new ones should be created based on the following approach:
• Exemptions should be possible, allowing some flexibility until a proper percentage of cases can be defined within a GS;
• Definitions should be developed in order to allow monitoring and acquisition of data; proper regulatory decisions or standards can be adopted only based on statistical data; and
• For those standards or regulatory provisions that lack compensation for customers or penalties for companies, the most appropriate penance should be found. In other words, an investigation should be made regarding compensation vs. penalty or GS vs. OS (or even a combination) to accommodate practice and regulatory schemes.
Of course, OAR standards are not predetermined to be supplemented by a GS. With a gradual approach for creating standards, an OAR can be transformed into one or more different standards of different type. The process can also maintain the original OAR standard if necessary.
The 4th CEER Benchmarking Report on Quality of Electricity Supply showed that countries in the Central East of Europe (CEE) predominantly use guaranteed standards. Due to similarities between CEE countries and CPs, it may be worthwhile to investigate their experiences in CQ.
5th CEER Benchmarking Report on the Quality of Electricity Supply 226
Ann
ex o
n th
e 5th
CE
ER
Ben
chm
arki
ng R
epor
t - E
CR
B
Finding #2 CQ standards are not specifically applied to suppliers or operators
Commercial Quality Standards may be applied to different market participants and operators. As the benchmarking questionnaire suggests, standards can apply to DSOs, Suppliers, USPs and others.
Currently, the distinction between standards applied to DSOs, Suppliers and USPs is not informative for the CPs since electricity markets are developing.
Finding #3CQ standards are usually loosely defined
During the benchmarking, it was observed that many CQ indicators were rather obvious (according to the wording), but only superficially defined. Minor differences in legal provisions or practice between CPs showed that standards need to be defined on precise terms and supported with explanations and exceptions.
The indicator “time from the notice to pay until disconnection” can be used here to clarify. The standard should precisely define the initial trigger and define the closing event. Otherwise, there could be questions like – does this standard imply time counted from the post of notice or from the reception of the notice?
Recommendation #2
CQ standards should be created having in mind different entities (DSOs, Suppliers, USPs, etc.) and different market models
The existence of different entities (DSOs, Suppliers, USPs, etc.) requires that standards should be defined with very specific definitions and with specific business processes in mind. For example, CQ standards related to interruptions can be different depending of the (retail) market model. In one market, customers could be compelled to call their supplier for power restoration with no direct contact with the DSO. In another market, customers could have the choice to call either their supplier or the DSO. Consequently, the category “time until the restoration of supply in case of unplanned interruption” is not universally applicable and may distort benchmarking results.
This also implies that RAs should have deep insight rights in the procedures of suppliers. It may be argued that CQ standards should be tied to regulated activities (DSO/USP/ regulated Supplier). However, using CQ standards for all market players may be beneficial in a couple of ways:
• required publication of CQ performance can be used as a tool for making the market more active by forcing the suppliers to differentiate by CQ performance;
• with new market entrants, some customer groups could be troubled (i.e. residential custom-ers switching to new suppliers) by dominant in-cumbent electricity companies, so CQ standards are necessary to resolve certain problems;
• poor performance of a supplier may indicate to the RA a more serious issue afflicting the supplier.
Recommendation #3
CQ standards should be based on specific and precise definitions
This issue does not need a specific solution since the recommendation is rather obvious. However, RAs and DSOs should cooperate by sharing experiences or participating in benchmarks. By doing so, the development of definitions and standards will be more efficient and rapid.
Of course, practice of EU member states should also be considered.
Since most CPs did not provide historic data, it would be beneficial to commence with measuring performance in any way possible. The framework for measuring performance will gradually evolve, producing basis for introducing adequate definitions and standards.
It should be emphasized that Directive 2009/72/EC calls for regulation of CQ, particularly with Article 3 dealing with “public service obligations and customer protection”.
5th CEER Benchmarking Report on the Quality of Electricity Supply 227
Ann
ex o
n th
e 5th
CE
ER
Ben
chm
arki
ng R
epor
t - E
CR
B
Finding #4 DSOs and incumbent companies do not place emphasis on interaction with customers
DSOs and incumbent companies have not focused on customers but predominantly on their own activities. Most of their statistical data that can correlate with commercial standards is related to the “system”. Historically, there was no need to track a specific customer with a specific issue. Consequently, data regarding commercial quality, especially to customer care, is not available.
Recommendation #4
DSOs and suppliers should implement Customer Relationship Management (CRM)
DSOs and suppliers should implement IT solutions for CRM. Apart from inherently adopting customer care, the use of such tools is essential for CQ standards.
The most important paradigm for companies is to implement the ability of tracking a specific customer with a specific issue. Apart from having better and more efficient relations with specific customers, statistics on an issue (time, cases, etc.) are statistics relevant for CQ standards related to Customer Care.
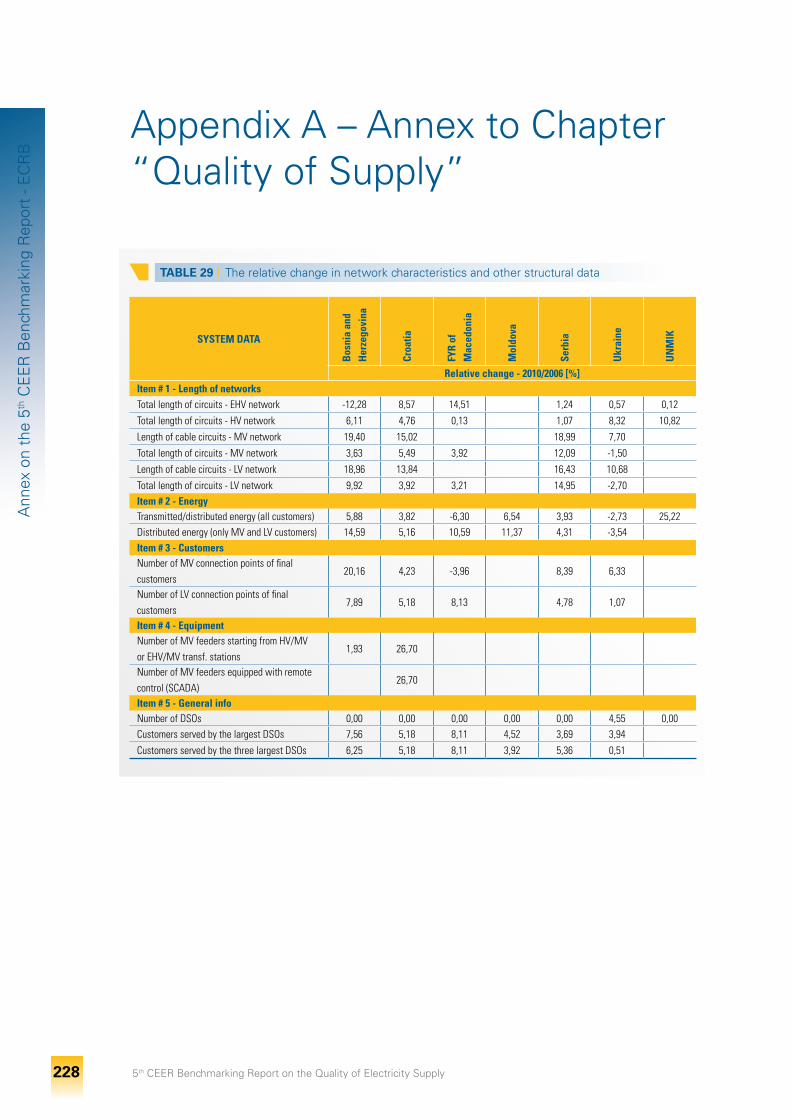
5th CEER Benchmarking Report on the Quality of Electricity Supply 228
Ann
ex o
n th
e 5th
CE
ER
Ben
chm
arki
ng R
epor
t - E
CR
B
Appendix A – Annex to Chapter “Quality of Supply”
TABLE 29 I The relative change in network characteristics and other structural data
SYSTEM DATAB
osni
a an
d H
erze
govi
na
Croa
tia
FYR
of
Mac
edon
ia
Mol
dova
Serb
ia
Ukr
aine
UN
MIK
Relative change - 2010/2006 [%]Item # 1 - Length of networksTotal length of circuits - EHV network -12,28 8,57 14,51 1,24 0,57 0,12
Total length of circuits - HV network 6,11 4,76 0,13 1,07 8,32 10,82
Length of cable circuits - MV network 19,40 15,02 18,99 7,70
Total length of circuits - MV network 3,63 5,49 3,92 12,09 -1,50
Length of cable circuits - LV network 18,96 13,84 16,43 10,68
Total length of circuits - LV network 9,92 3,92 3,21 14,95 -2,70Item # 2 - EnergyTransmitted/distributed energy (all customers) 5,88 3,82 -6,30 6,54 3,93 -2,73 25,22Distributed energy (only MV and LV customers) 14,59 5,16 10,59 11,37 4,31 -3,54Item # 3 - Customersnumber of MV connection points of final customers
20,16 4,23 -3,96 8,39 6,33
number of LV connection points of final customers
7,89 5,18 8,13 4,78 1,07
Item # 4 - Equipmentnumber of MV feeders starting from HV/MV or EHV/MV transf. stations
1,93 26,70
number of MV feeders equipped with remote control (SCADA)
26,70
Item # 5 - General infonumber of DSOs 0,00 0,00 0,00 0,00 0,00 4,55 0,00Customers served by the largest DSOs 7,56 5,18 8,11 4,52 3,69 3,94
Customers served by the three largest DSOs 6,25 5,18 8,11 3,92 5,36 0,51
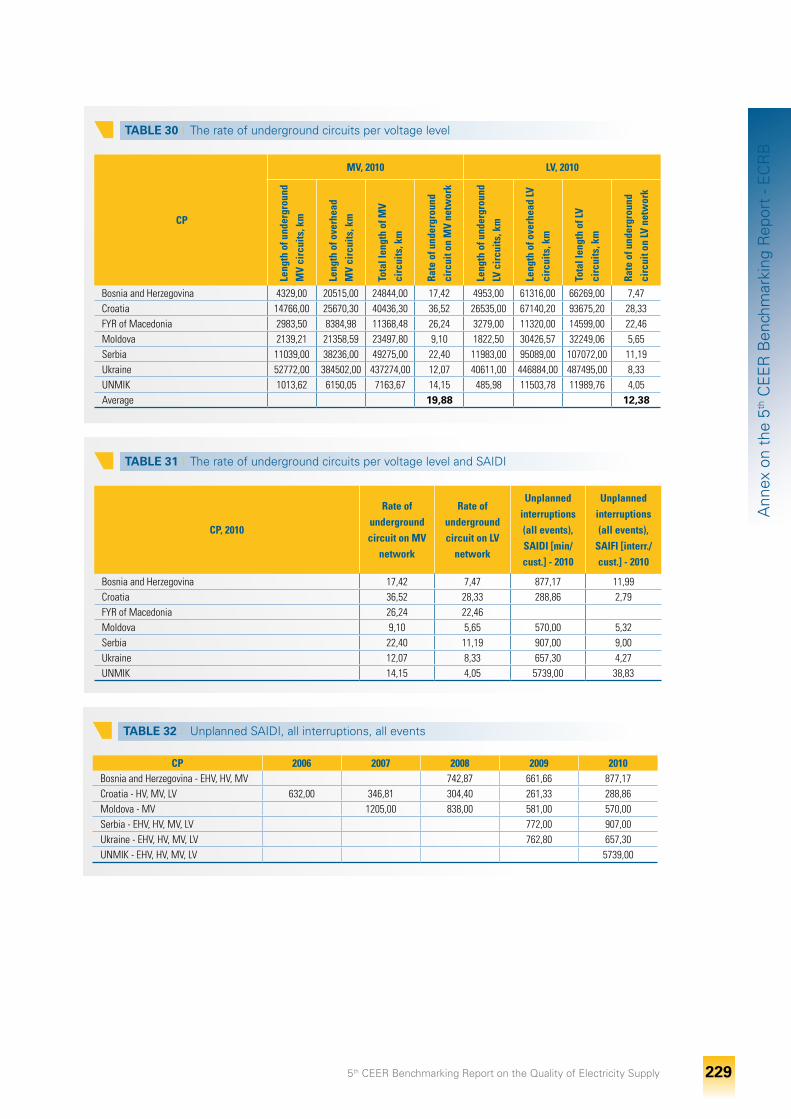
5th CEER Benchmarking Report on the Quality of Electricity Supply 229
Ann
ex o
n th
e 5th
CE
ER
Ben
chm
arki
ng R
epor
t - E
CR
B
TABLE 30 I The rate of underground circuits per voltage level
CP
MV, 2010 LV, 2010
Leng
th o
f und
ergr
ound
M
V ci
rcui
ts, k
m
Leng
th o
f ove
rhea
d M
V ci
rcui
ts, k
m
Tota
l len
gth
of M
V ci
rcui
ts, k
m
Rate
of u
nder
grou
nd
circ
uit o
n M
V ne
twor
k
Leng
th o
f und
ergr
ound
LV
cir
cuits
, km
Leng
th o
f ove
rhea
d LV
ci
rcui
ts, k
m
Tota
l len
gth
of LV
ci
rcui
ts, k
m
Rate
of u
nder
grou
nd
circ
uit o
n LV
net
wor
k
Bosnia and Herzegovina 4329,00 20515,00 24844,00 17,42 4953,00 61316,00 66269,00 7,47Croatia 14766,00 25670,30 40436,30 36,52 26535,00 67140,20 93675,20 28,33FYR of Macedonia 2983,50 8384,98 11368,48 26,24 3279,00 11320,00 14599,00 22,46Moldova 2139,21 21358,59 23497,80 9,10 1822,50 30426,57 32249,06 5,65Serbia 11039,00 38236,00 49275,00 22,40 11983,00 95089,00 107072,00 11,19Ukraine 52772,00 384502,00 437274,00 12,07 40611,00 446884,00 487495,00 8,33UnMik 1013,62 6150,05 7163,67 14,15 485,98 11503,78 11989,76 4,05Average 19,88 12,38
TABLE 31 I The rate of underground circuits per voltage level and SAIDI
CP, 2010
Rate of underground circuit on MV
network
Rate of underground circuit on LV
network
Unplanned interruptions (all events), SAIDI [min/cust.] - 2010
Unplanned interruptions (all events),
SAIFI [interr./cust.] - 2010
Bosnia and Herzegovina 17,42 7,47 877,17 11,99Croatia 36,52 28,33 288,86 2,79FYR of Macedonia 26,24 22,46 Moldova 9,10 5,65 570,00 5,32Serbia 22,40 11,19 907,00 9,00Ukraine 12,07 8,33 657,30 4,27UnMik 14,15 4,05 5739,00 38,83
TABLE 32 I Unplanned SAIDI, all interruptions, all events
CP 2006 2007 2008 2009 2010Bosnia and Herzegovina - EHV, HV, MV 742,87 661,66 877,17Croatia - HV, MV, LV 632,00 346,81 304,40 261,33 288,86Moldova - MV 1205,00 838,00 581,00 570,00Serbia - EHV, HV, MV, LV 772,00 907,00Ukraine - EHV, HV, MV, LV 762,80 657,30UnMik - EHV, HV, MV, LV 5739,00
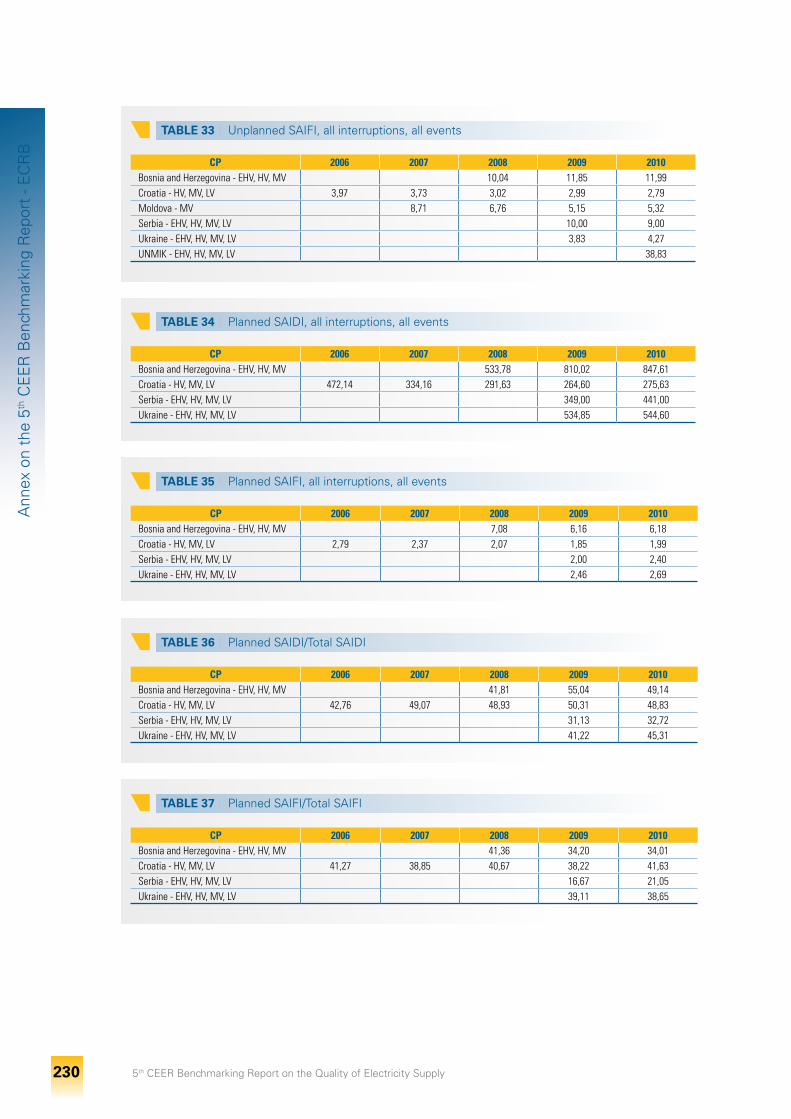
5th CEER Benchmarking Report on the Quality of Electricity Supply 230
Ann
ex o
n th
e 5th
CE
ER
Ben
chm
arki
ng R
epor
t - E
CR
B
TABLE 33 I Unplanned SAIFI, all interruptions, all events
CP 2006 2007 2008 2009 2010Bosnia and Herzegovina - EHV, HV, MV 10,04 11,85 11,99Croatia - HV, MV, LV 3,97 3,73 3,02 2,99 2,79Moldova - MV 8,71 6,76 5,15 5,32Serbia - EHV, HV, MV, LV 10,00 9,00Ukraine - EHV, HV, MV, LV 3,83 4,27UnMik - EHV, HV, MV, LV 38,83
TABLE 34 I Planned SAIDI, all interruptions, all events
CP 2006 2007 2008 2009 2010Bosnia and Herzegovina - EHV, HV, MV 533,78 810,02 847,61Croatia - HV, MV, LV 472,14 334,16 291,63 264,60 275,63Serbia - EHV, HV, MV, LV 349,00 441,00Ukraine - EHV, HV, MV, LV 534,85 544,60
TABLE 35 I Planned SAIFI, all interruptions, all events
CP 2006 2007 2008 2009 2010Bosnia and Herzegovina - EHV, HV, MV 7,08 6,16 6,18Croatia - HV, MV, LV 2,79 2,37 2,07 1,85 1,99Serbia - EHV, HV, MV, LV 2,00 2,40Ukraine - EHV, HV, MV, LV 2,46 2,69
TABLE 36 I Planned SAIDI/Total SAIDI
CP 2006 2007 2008 2009 2010Bosnia and Herzegovina - EHV, HV, MV 41,81 55,04 49,14Croatia - HV, MV, LV 42,76 49,07 48,93 50,31 48,83Serbia - EHV, HV, MV, LV 31,13 32,72Ukraine - EHV, HV, MV, LV 41,22 45,31
TABLE 37 I Planned SAIFI/Total SAIFI
CP 2006 2007 2008 2009 2010Bosnia and Herzegovina - EHV, HV, MV 41,36 34,20 34,01Croatia - HV, MV, LV 41,27 38,85 40,67 38,22 41,63Serbia - EHV, HV, MV, LV 16,67 21,05Ukraine - EHV, HV, MV, LV 39,11 38,65
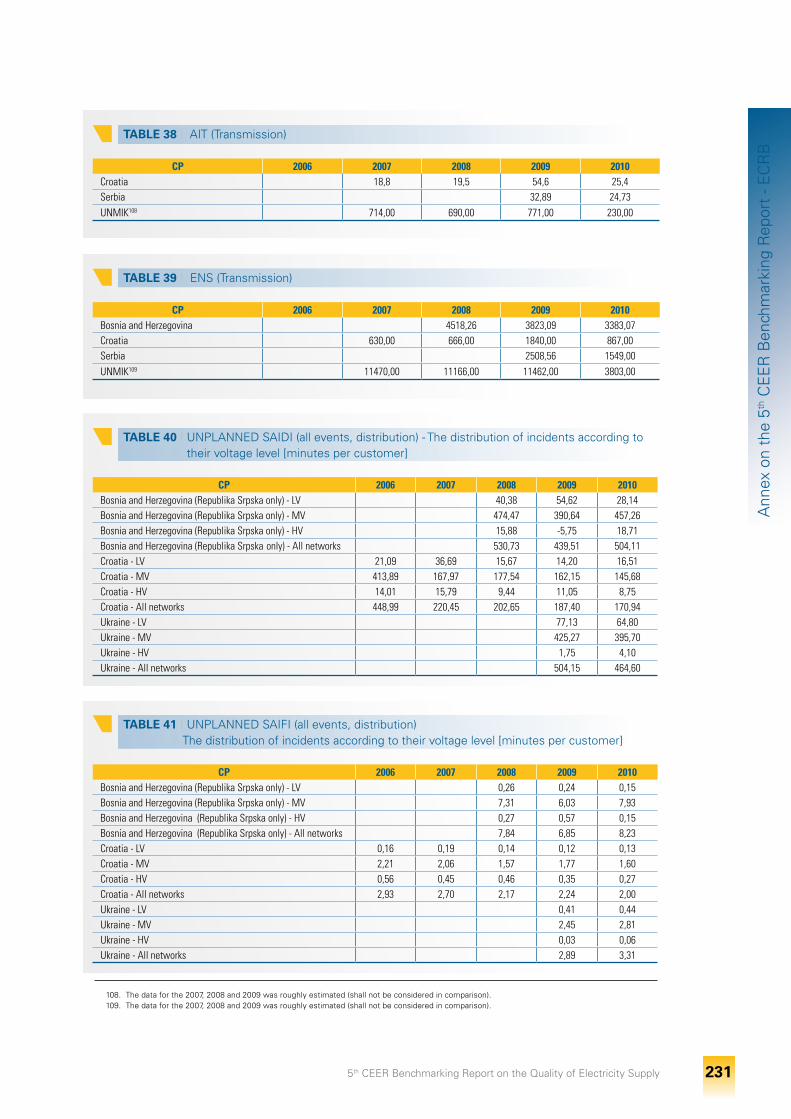
5th CEER Benchmarking Report on the Quality of Electricity Supply 231
Ann
ex o
n th
e 5th
CE
ER
Ben
chm
arki
ng R
epor
t - E
CR
B
TABLE 39 I ENS (Transmission)
CP 2006 2007 2008 2009 2010Bosnia and Herzegovina 4518,26 3823,09 3383,07Croatia 630,00 666,00 1840,00 867,00Serbia 2508,56 1549,00UnMik109 11470,00 11166,00 11462,00 3803,00
TABLE 38 I AIT (Transmission)
CP 2006 2007 2008 2009 2010Croatia 18,8 19,5 54,6 25,4Serbia 32,89 24,73UnMik108 714,00 690,00 771,00 230,00
TABLE 40 I UNPLANNED SAIDI (all events, distribution) - The distribution of incidents according to their voltage level [minutes per customer]
CP 2006 2007 2008 2009 2010Bosnia and Herzegovina (Republika Srpska only) - LV 40,38 54,62 28,14Bosnia and Herzegovina (Republika Srpska only) - MV 474,47 390,64 457,26Bosnia and Herzegovina (Republika Srpska only) - HV 15,88 -5,75 18,71Bosnia and Herzegovina (Republika Srpska only) - All networks 530,73 439,51 504,11Croatia - LV 21,09 36,69 15,67 14,20 16,51Croatia - MV 413,89 167,97 177,54 162,15 145,68Croatia - HV 14,01 15,79 9,44 11,05 8,75Croatia - All networks 448,99 220,45 202,65 187,40 170,94Ukraine - LV 77,13 64,80Ukraine - MV 425,27 395,70Ukraine - HV 1,75 4,10Ukraine - All networks 504,15 464,60
TABLE 41 I UNPLANNED SAIFI (all events, distribution) The distribution of incidents according to their voltage level [minutes per customer]
CP 2006 2007 2008 2009 2010Bosnia and Herzegovina (Republika Srpska only) - LV 0,26 0,24 0,15Bosnia and Herzegovina (Republika Srpska only) - MV 7,31 6,03 7,93Bosnia and Herzegovina (Republika Srpska only) - HV 0,27 0,57 0,15Bosnia and Herzegovina (Republika Srpska only) - All networks 7,84 6,85 8,23Croatia - LV 0,16 0,19 0,14 0,12 0,13Croatia - MV 2,21 2,06 1,57 1,77 1,60Croatia - HV 0,56 0,45 0,46 0,35 0,27Croatia - All networks 2,93 2,70 2,17 2,24 2,00Ukraine - LV 0,41 0,44Ukraine - MV 2,45 2,81Ukraine - HV 0,03 0,06Ukraine - All networks 2,89 3,31
108. The data for the 2007, 2008 and 2009 was roughly estimated (shall not be considered in comparison). 109. The data for the 2007, 2008 and 2009 was roughly estimated (shall not be considered in comparison).
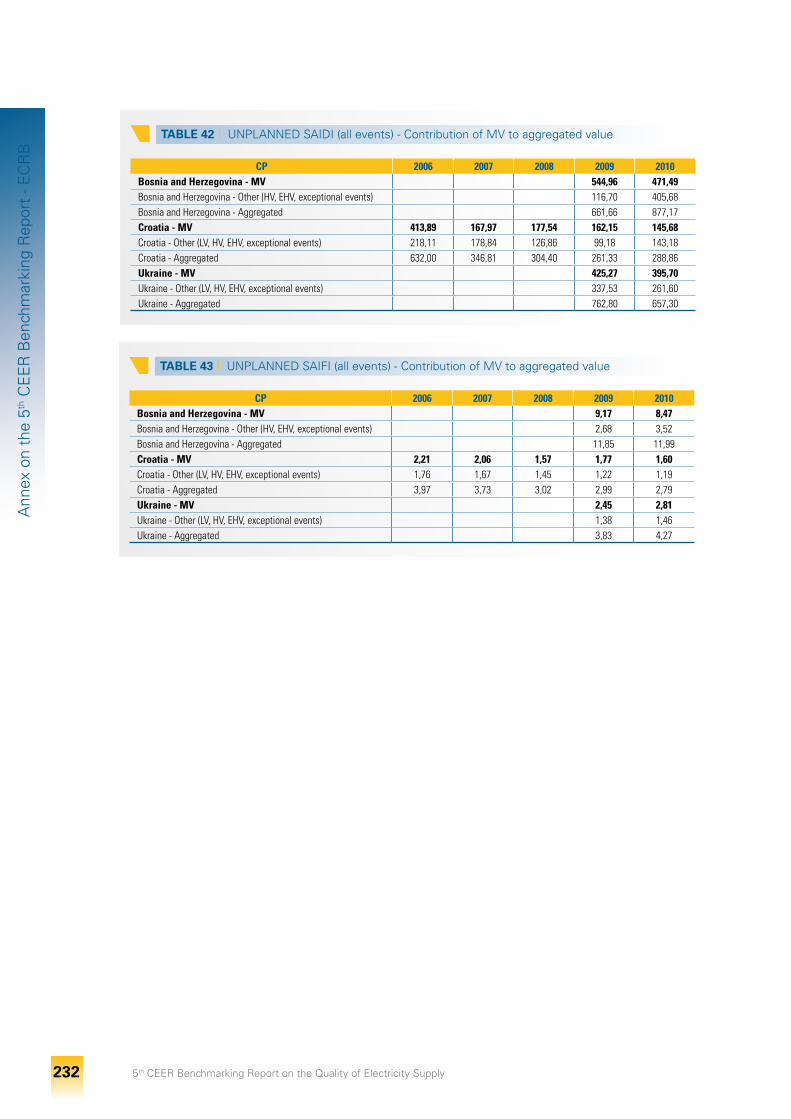
5th CEER Benchmarking Report on the Quality of Electricity Supply 232
Ann
ex o
n th
e 5th
CE
ER
Ben
chm
arki
ng R
epor
t - E
CR
B
TABLE 42 I UNPLANNED SAIDI (all events) - Contribution of MV to aggregated value
CP 2006 2007 2008 2009 2010Bosnia and Herzegovina - MV 544,96 471,49Bosnia and Herzegovina - Other (HV, EHV, exceptional events) 116,70 405,68Bosnia and Herzegovina - Aggregated 661,66 877,17Croatia - MV 413,89 167,97 177,54 162,15 145,68Croatia - Other (LV, HV, EHV, exceptional events) 218,11 178,84 126,86 99,18 143,18Croatia - Aggregated 632,00 346,81 304,40 261,33 288,86Ukraine - MV 425,27 395,70Ukraine - Other (LV, HV, EHV, exceptional events) 337,53 261,60Ukraine - Aggregated 762,80 657,30
TABLE 43 I UNPLANNED SAIFI (all events) - Contribution of MV to aggregated value
CP 2006 2007 2008 2009 2010Bosnia and Herzegovina - MV 9,17 8,47Bosnia and Herzegovina - Other (HV, EHV, exceptional events) 2,68 3,52Bosnia and Herzegovina - Aggregated 11,85 11,99Croatia - MV 2,21 2,06 1,57 1,77 1,60Croatia - Other (LV, HV, EHV, exceptional events) 1,76 1,67 1,45 1,22 1,19Croatia - Aggregated 3,97 3,73 3,02 2,99 2,79Ukraine - MV 2,45 2,81Ukraine - Other (LV, HV, EHV, exceptional events) 1,38 1,46Ukraine - Aggregated 3,83 4,27
5th CEER Benchmarking Report on the Quality of Electricity Supply 233
Ann
ex o
n th
e 5th
CE
ER
Ben
chm
arki
ng R
epor
t - E
CR
B
Appendix B – List of Tables
Table 1 Information on continuity of supply by CPs 176Table 2 Types of interruptions monitored 179Table 3 Definitions of long, short and transient interruptions 179Table 4 Definitions of planned and unplanned interruptions 180Table 5 Voltage levels for which monitoring of continuity takes place 182Table 6 Cause categories used when recording interruptions 183Table 7 Definitions of exceptional events 184Table 8 Level of detail in interruption recording 186Table 9 Long interruption – indices for quantifying 187Table 10 The indices provided 189Table 11 The indices by territorial density 190Table 12 Unplanned SAIDI (all events; HV, MV, LV) - distribution of incidents according to their
voltage level [%] 190Table 13 Unplanned SAIFI (all events; HV, MV, LV) - distribution of incidents according to their
voltage level [%] 191Table 14 Unplanned SAIDI (all events) - Contribution of MV to the aggregated value [%] 192Table 15 Unplanned SAIFI (all events) - Contribution of MV to the aggregated value [%] 192Table 16 Information on network, equipment, energy supplied, number of customers 197Table 17 An overview on existing continuity standards and incentive schemes 200Table 18 Voltage quality information by CPs 210Table 19 EN 50160 Implementation Status 211Table 20 VQ standards enforced/used on CP level 211Table 21 VQ measurement obligations 213Table 22 Number of Commercial Quality Standards for each CP 220Table 23 Number of Commercial Quality Standards for each indicator 220Table 24 Commercial Quality standards for connection-related activities 221Table 25 Commercial quality standards for customer care activities 222Table 26 The commercial standards for technical services in Moldova 223Table 27 Commercial quality standards for technical services 223Table 28 Commercial Quality Standards for billing and metering 224Table 29 The relative change in network characteristics and other structural data 228Table 30 The rate of underground circuits per voltage level 229Table 31 The rate of underground circuits per voltage level and SAIDI 229Table 32 Unplanned SAIDI, all interruptions, all events 229Table 33 Unplanned SAIFI, all interruptions, all events 230Table 34 Planned SAIDI, all interruptions, all events 230Table 35 Planned SAIFI, all interruptions, all events 230Table 36 Planned SAIDI/Total SAIDI 230Table 37 Planned SAIFI/Total SAIFI 230Table 38 AIT (Transmission) 231Table 39 ENS (Transmission) 231Table 40 UNPLANNED SAIDI (all events, distribution) - The distribution of incidents according to
their voltage level [minutes per customer] 231Table 41 UNPLANNED SAIFI (all events, distribution) - The distribution of incidents according to
their voltage level [minutes per customer] 231Table 42 UNPLANNED SAIDI (all events) - Contribution of MV to aggregated value 232Table 43 UNPLANNED SAIFI (all events) - Contribution of MV to aggregated value 232
5th CEER Benchmarking Report on the Quality of Electricity Supply 234
Ann
ex o
n th
e 5th
CE
ER
Ben
chm
arki
ng R
epor
t - E
CR
B
Appendix C – List of Figures
Figure 1 Unplanned long interruptions including all events, SAIDI (2006-2010) 193Figure 2 Unplanned long interruptions including all events, SAIFI (2006-2010) 194Figure 3 Planned interruptions, SAIDI (2006-2010) 195Figure 4 Planned interruptions, SAIFI (2006-2010) 195Figure 5 Normalized ENS by energy supplied for transmission system 196Figure 6 Correlation between SAIDI and SAIFI and the rate of undergrounding in MV and LV
networks 198


Council of European Energy Regulators (CEER) Rue le Titien 28 1000 Brussels Belgium Tel: +32 2/ 788 73 30 Fax:+ 32 2/ 788 73 50
Website: www.energy-regulaotrs.eu E-mail: [email protected]