acer/ceer annual report on the results of … · acer/ceer annual report on the results of...
TRANSCRIPT
ACER/CEER
Annual Report on the Results of Monitoring the Internal Electricity and Gas Marketsin 2016Summary
October 2017

2
A C E R / C E E R A N N U A L R E P O R T O N T H E R E S U L T S O F M O N I T O R I N G T H E I N T E R N A L E L E C T R I C I T Y A N D N A T U R A L G A S M A R K E T S I N 2 0 1 6
The support of the Energy Community Secretariat in coordinating the collection and in analysing the information related to the Energy Community Contracting Parties is gratefully acknowledged.
CEER
Mr Andrew EbrillT +32 (0)2 788 73 35E [email protected]
ACER
Mr David MerinoT +386 (0)8 2053 417E [email protected]
Cours Saint-Michel 30a, box F1040 BrusselsBelgium
Trg republike 3 1000 Ljubljana Slovenia
If you have any queries relating to this report, please contact:
1. Introduction• Why market monitoring? The Third Energy Package
tasks the Agency for the Cooperation of Energy Regu-lators (ACER) with monitoring the internal markets for electricity and gas. Proper monitoring based on facts and analysis helps to understand the state of the Inter-nal Energy Market better and also allows policy makers to identify any remaining barriers to its completion so that appropriate measures can be adopted. In addition, energy market monitoring provides greater transparen-cy to the benefit of market participants and consumers.
• What is monitored? Since 2012 the Agency has been publishing annual Market Monitoring Reports (MMRs), prepared in cooperation with the Council of European En-ergy Regulators (CEER).The MMR presents the results of the Agency’s monitoring of retail prices, consumer rights and wholesale market functioning, including network ac-
cess. Such monitoring also includes an assessment of the market effects of the implementation of the electricity and gas Network Codes. Monitoring is still hampered by the difficulty of the Agency to collect the necessary data hence it should be given information gathering powers. The MMR consists of four volumes, respectively focusing on: the Gas Wholesale Market, the Electricity Wholesale Market, the Electricity and Gas Retail Markets, and Con-sumer Protection and Empowerment.
• Which markets are monitored? The Agency’s moni-toring activities, whose results are presented in the MMR, cover the EU MSs and the associated markets of Norway and Switzerland. For selected topics, the as-sessment is extended to the Contracting Parties of the Energy Community (EnC), thanks to the support of the Energy Community Secretariat.
3
A C E R / C E E R A N N U A L R E P O R T O N T H E R E S U L T S O F M O N I T O R I N G T H E I N T E R N A L E L E C T R I C I T Y A N D N A T U R A L G A S M A R K E T S I N 2 0 1 6
Most EU gas wholesale markets are advancing through better market functioning but market barriers persist. A few markets still do not meet the basic requirements.
• Better market functioning in 2016 was driven by in-creased supply-side competition, improved conver-gence of gas sourcing costs across MSs, enhanced use of recently deployed cross-border infrastructure and progress in the implementation of the Third Pack-age. As a result, hub prices continued to converge across the EU.
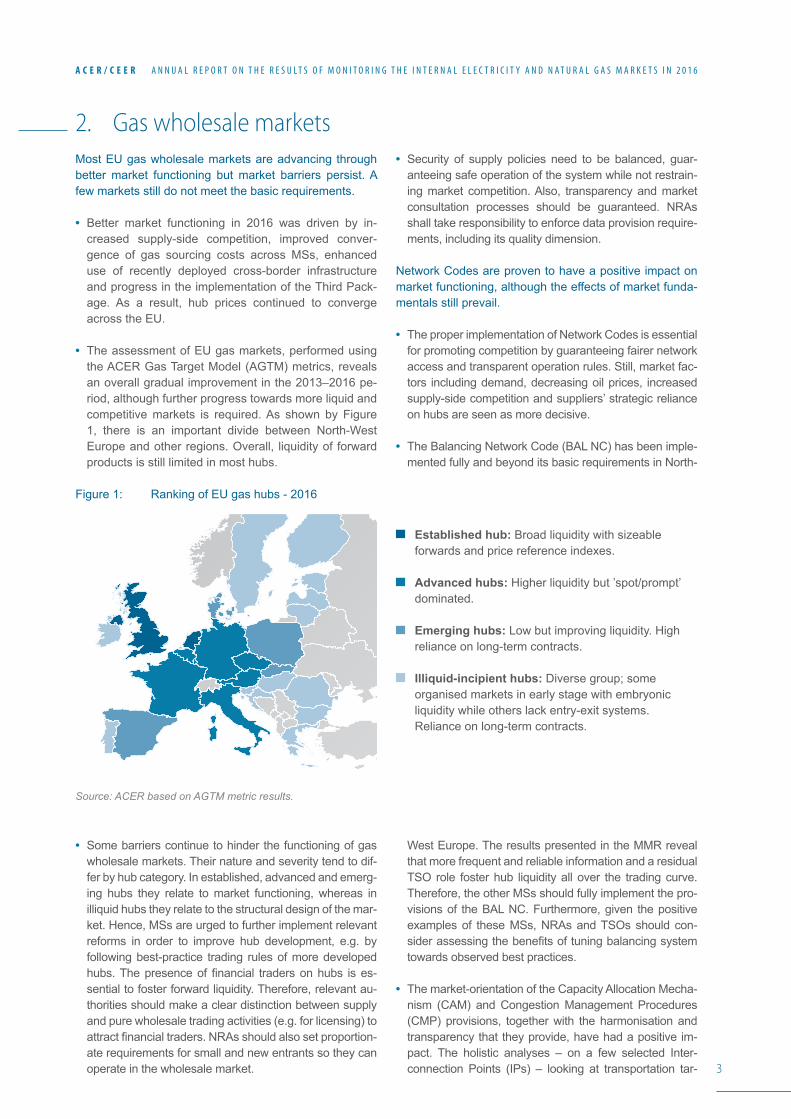
• The assessment of EU gas markets, performed using the ACER Gas Target Model (AGTM) metrics, reveals an overall gradual improvement in the 2013–2016 pe-riod, although further progress towards more liquid and competitive markets is required. As shown by Figure 1, there is an important divide between North-West Europe and other regions. Overall, liquidity of forward products is still limited in most hubs.
• Some barriers continue to hinder the functioning of gas wholesale markets. Their nature and severity tend to dif-fer by hub category. In established, advanced and emerg-ing hubs they relate to market functioning, whereas in illiquid hubs they relate to the structural design of the mar-ket. Hence, MSs are urged to further implement relevant reforms in order to improve hub development, e.g. by following best-practice trading rules of more developed hubs. The presence of financial traders on hubs is es-sential to foster forward liquidity. Therefore, relevant au-thorities should make a clear distinction between supply and pure wholesale trading activities (e.g. for licensing) to attract financial traders. NRAs should also set proportion-ate requirements for small and new entrants so they can operate in the wholesale market.
• Security of supply policies need to be balanced, guar-anteeing safe operation of the system while not restrain-ing market competition. Also, transparency and market consultation processes should be guaranteed. NRAs shall take responsibility to enforce data provision require-ments, including its quality dimension.
Network Codes are proven to have a positive impact on market functioning, although the effects of market funda-mentals still prevail.
• The proper implementation of Network Codes is essential for promoting competition by guaranteeing fairer network access and transparent operation rules. Still, market fac-tors including demand, decreasing oil prices, increased supply-side competition and suppliers’ strategic reliance on hubs are seen as more decisive.
• The Balancing Network Code (BAL NC) has been imple-mented fully and beyond its basic requirements in North-
West Europe. The results presented in the MMR reveal that more frequent and reliable information and a residual TSO role foster hub liquidity all over the trading curve. Therefore, the other MSs should fully implement the pro-visions of the BAL NC. Furthermore, given the positive examples of these MSs, NRAs and TSOs should con-sider assessing the benefits of tuning balancing system towards observed best practices.
• The market-orientation of the Capacity Allocation Mecha-nism (CAM) and Congestion Management Procedures (CMP) provisions, together with the harmonisation and transparency that they provide, have had a positive im-pact. The holistic analyses – on a few selected Inter-connection Points (IPs) – looking at transportation tar-
Figure 1: Ranking of EU gas hubs - 2016
Source: ACER based on AGTM metric results.
Established hub: Broad liquidity with sizeable forwards and price reference indexes.
Advanced hubs: Higher liquidity but ’spot/prompt’ dominated.
Emerging hubs: Low but improving liquidity. High reliance on long-term contracts.
Illiquid-incipient hubs: Diverse group; some organised markets in early stage with embryonic liquidity while others lack entry-exit systems. Reliance on long-term contracts.
2. Gas wholesale markets

4
A C E R / C E E R A N N U A L R E P O R T O N T H E R E S U L T S O F M O N I T O R I N G T H E I N T E R N A L E L E C T R I C I T Y A N D N A T U R A L G A S M A R K E T S I N 2 0 1 6
iffs, flows, capacity utilisation, auction results and hub spreads – reveal how CAM and CMP provisions are facil-itating more market driven operation at IPs. They facilitate capacity acquisition where arbitrage on hubs spreads is profitable and facilitate the release of capacity in case of contractual congestion.
• However, the effectiveness of CAM and CMP provi-sions is still limited. Changed market fundamentals, i.e. decrease of demand and larger availability of capacity, and persisting, long-term contracts are currently limiting the anticipated impacts. The sizeable shares of long-term booked capacity largely determine IP utilisation – e.g. the average booked capacity at EU IPs was around 60% in 2016, while average utilisation was around 50%. CMP measures were implemented only in seven MSs by the end of 2016, although in fact, only 13% of EU IPs are contractually congested at present.
• Moreover, there is very limited contracting of new bun-dled and short-term capacity because the price-spreads between hubs do not usually cover transportation costs.
As an example, in 2016, new booked bundled capacity was less than 1% of total offered capacity at EU IPs. Is-sues deriving from lack of harmonisation between adja-cent systems also played a part.
Cross-border capacity tariffs higher than hub-spreads are common in many EU liquid gas hubs
• The market situation where hub spreads are well below transportation tariffs is driven by suppliers’ sourcing costs being of similar levels across many market areas and to a certain degree by the lock-in effect of existing (histori-cal) long-term contracts .At present, these contracts con-stitute a sunk-cost for many over-contracted companies.
As a result, the prices of hub-placed orders tend to be determined by market players’ short-run marginal costs.
• Figure 2 further illustrates this. Hub spreads that are higher than transportation tariffs are witnessed only in the market areas with lower liquidity and/or possible IP capacity constraints. Moreover, the fact that daily tariffs are usually higher than yearly tariffs further limits spot arbitrage opportunities. The re-alignment of short-term multipliers to limits set in the Network Code on Harmo-nised Gas Transmission Tariff Structure swill lead to fur-ther integration among hubs.Given the above, new in-frastructure investment should not be a priority in most MSs, except for, inter alia, the bi-directional corridors of Greece-Bulgaria-Romania-Hungary and the Poland-Baltic interconnector that would enhance market inte-gration. New investments should be subject to a vali-dated cost-benefit analysis with a regional scope, so as to avoid stranded assets and undue tariff increases for end-consumers. Alternatively, the use of existing trans-portation infrastructures should be further optimised via enhanced operational cooperation.
• Finally, TSOs should complete the implementation of the gas NCs in all MSs timely and properly. A coordi-nated implementation at cross-border/regional level shall foster effectiveness. In particular, TSOs should set rules to facilitate the transfer of capacity between network users, resulting in more market-based CMP provisions. Data reporting and quality shortcomings observed with the ENTSOG Transparency Platform (TP) need to be urgently overcome: ENTSOG should take responsibility for its members data, as the current status of the TP hinders the feasibility of achieving a deeper understanding of the effects of NCs on market functioning.
Figure 2: Day-ahead price spreads compared to yearly transportation tariffs – 2016.
Source: ACER based on Platts and hub operators’ data for prices and ENTSOG TP for transportation tariffs.
2.50
3.00
2.75
0.25
0.75
0.50
1.00
1.25
1.50
1.75
2.00
2.25
0
Aver
age D
A hu
b sp
read
and
25th to
75th sp
read
per
cent
ile ra
nge
Yearly tariff in euros/MWh0 1.000.50 1.50 2.00 2.50 3.000.750.25 1.25 1.75 2.25 2.75
TTF>ZEETTF>ZEE
AVTP>OTCAVTP>OTC
NCG>VOBZEE>TTF
NCG>VOBZEE>TTF
NCG>AVTPNCG>AVTP
ZEE>PEGNZEE>PEGN
VOB>NCGVOB>NCGGPL>NCGGPL>NCG
NCG>GPLNCG>GPL
TTF>NCGTTF>NCG
TTF>PSVTTF>PSV
NCG>PSVNCG>PSV
TTF>NBPTTF>NBPZEE>NBPZEE>NBP
TRS>PVBTRS>PVB
AVTP>PSVAVTP>PSV
PEGN>TRSPEGN>TRS
GPN>GPLGPN>GPL
AVTP>MGPAVTP>MGP
PVB>TRSPVB>TRS
TTF>PEGNTTF>PEGN
GPL>VPGZGPL>VPGZ
VOB>OTCVOB>OTC
3.20 euros/MWh3.20 euros/MWh
spread
>tariff
spread
>tariff
spread
<tariff
spread
<tariff

5
A C E R / C E E R A N N U A L R E P O R T O N T H E R E S U L T S O F M O N I T O R I N G T H E I N T E R N A L E L E C T R I C I T Y A N D N A T U R A L G A S M A R K E T S I N 2 0 1 6
3. Electricity wholesale marketsThe use of the available cross-border capacity in the day-ahead timeframe is close to optimal. However, for the in-traday and balancing market timeframes it could be sig-nificantly improved.
• The level of efficient use of the available cross-zonal capacity (use in the economic direction when there is a price spread) in the day-ahead (DA) time frame reached 86% in 2016 (see Figure 3). An additional 203 million euros/year of social welfare gain is possible if DA market coupling is extended to the remaining cross-zonal borders.
• The level of efficient use of cross-zonal capacity in the intraday (ID) timeframe was 50% in 2016. The level was 100% on borders with implicit ID auctions, 49% on borders with implicit continuous trading, and 40% on borders with explicit capacity allocation methods. In re-cent years, ID liquidity has improved in markets where measures aligned with the Agency’s recommendations (such as ensuring full balancing responsibility for all technologies and cost-reflective balancing charges) were implemented.
• For the balancing timeframe, the level of efficiency in the use of cross-zonal capacity was 19% in 2016, almost twice the 2015 level. The improvement is the consequence of an increasing trend in the exchange of balancing services.
• Therefore, NRAs and TSOs should urgently implement DA market coupling on the remaining 16 European bor-ders, including the Swiss borders.
• When developing and approving a cross-zonal ID ca-pacity pricing methodology, TSOs and NRAs should take into account that ID auctions increase the level of efficient use of cross-zonal capacity.
• NRAs and TSOs should ensure full balancing respon-sibility for all technologies and cost-reflective balancing charges. TSOs should ensure an effective and rapid implementation of the Electricity Balancing Guideline,
with a focus on optimising the procurement of balanc-ing capacity and the exchange of balancing resources.
Cross-zonal exchanges are discriminated against inter-nal (intra-zonal) ones, limiting the cross-border capacity available for trade.
• As Figure 4 shows, only an average 50% of the bench-mark cross-zonal capacity, i.e. the capacity which could be made available while preserving operational secu-rity, is offered to the market on HVAC EU interconnec-tors. Approximately two thirds of the ‘gap’ between the commercial and the benchmark cross-zonal capacity is caused by the prioritisation of internal (intra-zonal) over cross-zonal exchanges.
• In the CWE region, the flow-based (FB) method al-lows monitoring capacity calculation more closely. In this region, cross-zonal trade is most frequently lim-ited, approximately 70% of the times, by internal lines. Moreover, only around 16% of the capacity of critical network elements (CNEs) is made available for cross-zonal trade, whereas the remainder is ‘consumed’ by
internal flows. Where NTC (Net Transfer Capacity) ap-plies, equivalent data is not available and the room for discrimination may be higher.
• TSOs often use cross-zonal capacity as an adjust-ment variable to address various internal market or network issues.
• The Agency recommends that the three high-level prin-ciples proposed in the Agency’s Recommendation No 02/2016 be followed by TSOs and NRAs when devel-oping, approving, implementing and monitoring capac-ity calculation methodologies.
• Where the use of remedial actions is not sufficient to ensure an appropriate level of cross-border capacities, the Agency recommends that a reconfiguration of bid-ding zones be applied.
Figure 3: Level of efficiency in the use of interconnectors in Europe (% use of available commercial capacity in the ‘right economic direction’) – 2016
Source: ACER based on ENTSO-E, NRAs, EMOS and Vulcanus.Note: *Intraday and Balancing values are based on a selection of EU borders.
Balancing*(incl. netting)
Day-ahead
Intraday*
40%
100700 10 60 90805020 30
86%
50%
19%

6
A C E R / C E E R A N N U A L R E P O R T O N T H E R E S U L T S O F M O N I T O R I N G T H E I N T E R N A L E L E C T R I C I T Y A N D N A T U R A L G A S M A R K E T S I N 2 0 1 6
• MSs could set a binding target for the availability of ex-isting and future cross-border capacity, e.g. by defin-ing a minimum share of physical cross-zonal capacity which should be made available for cross-zonal trade.
Insufficient TSOs’ coordination also reduces the cross-border capacity available for trade.
• Commercial capacity could be increased by approxi-mately 30% if the level of TSO-coordination were to be enhanced. On meshed networks, a higher level of co-ordination (e.g. with flow-based (FB) capacity calcula-tion) improves price convergence, social welfare and in general the efficient use of cross-border capacity.
• NRAs and TSOs should ensure the effective and rapid implementation of all legal provisions related to TSO coordination for the Regional Security Centres, as intro-duced by the System Operation Guideline, or potentially for Regional Operation Centres in the future. They should also ensure the effective and rapid implementation of FB capacity calculation, as required by the Capacity Alloca-tion and Congestion Management (CACM) Guideline.
Insufficient transparency in capacity calculation
• A more in-depth monitoring of the capacity calculation processes for the 2016 MMR was enabled by FB. How-ever, access to available data on capacity calculation remains an issue for the Agency.
• NRAs and/or the EC should request TSOs to publish all data generated for cross-zonal capacity calculation in a timely and user-friendly manner. This could be done on a voluntary basis or by amending the existing “Trans-parency Regulation”.
Fragmented national adequacy assessments underes-timates the contribution of interconnectors to security of supply.
• Efficient price formation in the wholesale energy market has the potential to contribute to the security of sup-ply. It allows generation and demand to see the benefits of responding to the adequacy needs. For example, in 2016, the re-emergence of price spikes (above mar-ginal costs) in the EU seems to be correlated to the presence of tighter adequacy margins.
• One third of the national adequacy assessments, where a decision was taken on whether to implement a capac-ity mechanism (CM), ignore the contribution of inter-connectors to adequacy. In most of the other countries, national adequacy assessments tend to underestimate this contribution.
• Hence, before implementing a CM, MSs should exhaust all possible no-regret measures, including the removal of price caps, ensuring the equal treatment of genera-tion technologies regarding balance responsibilities, increasing demand-side participation, removing undue limitations on cross-zonal trade and removing any other barrier to efficient price formation in the wholesale elec-tricity markets.
• MSs, the EC and NRAs should seek ways to strengthen the role of European adequacy assessments. In par-ticular, the estimated contribution of interconnectors when considering the implementation of a CM should be based on regional or pan-European assessments, as they have a clear potential to provide better results than fragmented national assessments.
Figure 4: Ratio between available cross-border capacity and the benchmark capacity of HVAC interconnectors per region – 2016 (%)
Source: ACER based on data provided by NRAs, ENTSO-E and Nordpool Spot.Note: Available cross-border capacity refers to average Net Transfer Capacity (NTC) values, except for the Core (CWE) region, where available capacity relates to the size of the actual FB domain and the benchmark capacity relates to the size of a benchmark domain.
%
100
20
60
40
8090
10
50
30
70
0
SWE
SEE
Core
(CW
E)
Core
(exc
l. CW
E)
Swiss
bord
ers
Italy
Nord
Hans
a
68% 59% 57% 53%
47% 40%
22% Benc
hmar
k cap
acity

7
A C E R / C E E R A N N U A L R E P O R T O N T H E R E S U L T S O F M O N I T O R I N G T H E I N T E R N A L E L E C T R I C I T Y A N D N A T U R A L G A S M A R K E T S I N 2 0 1 6
4. Retail energy markets, consumer protection and empowermentBoth gas and electricity retail prices for household and in-dustrial consumers declined in 2016. However, the share of the energy component in the final price for household consumers continued to decrease.
• In 2016, compared to 2015, both electricity and gas retail prices fell on average for both household and in-dustrial consumers throughout the EU, as shown in Fig-ure 5. For electricity industrial consumers, this decreas-ing trend (-7.1%) was observed for the third consecutive year, whereas electricity household consumers saw the
first price decrease (-2.1%) in the past eight years. Av-erage gas prices fell considerably for both household (-8.4%) and industrial consumers (-20.1%) for the sec-ond and fourth consecutive year, respectively.
• In the Energy Community Contracting Parties, electric-ity and gas prices paid by industrial consumers tend to be higher than household prices. In the 2013–2016
period, the price convergence between the two retail segments is mainly driven by developments in Ukraine.
• In 2016, the share of the contestable part (i.e. the energy component) of the final energy price paid by household consumers across EU capital cities was only 35% for electricity and 50% for gas, while the remainder consist-ed of non-contestable charges, i.e. the sum of network costs, taxes, levies and other charges (Figure 6). More-over, the energy component in the final price decreased gradually over the past five years, leaving less room for
competition among retail suppliers. In the 2012–2016 period, the energy component fell from 41% to 35% for electricity, while it fell from 56% to 50% for gas.
• In the Energy Community Contracting Parties, the aver-age share of the contestable charges paid by house-holds represented 43% for electricity and 73% for gas (Figure 6).
Figure 5: Trends in final electricity and gas prices for household and industrial consumers in the EU, Norway and the Energy Community – 2008–2016
Source: ACER based on Eurostat (14 June 2017) for consumption band DC, IE, D2 and I5, NRAs, EnC Secretariat.
25
20
0
15
10
5
8
6
4
2
0
7
5
3
1Elec
tricit
y pric
e (eu
ro ce
nts/k
Wh)
EU and Norway Energy Community
Gas price (euro cents/kWh)
Gas IND pricesGas HH pricesElectricity HH prices Electricity IND prices
2008 2009 2010 2011 2012 2013 2014 20162015 2013 2014 20162015
Figure 6: Electricity and gas breakdown of the incumbents’ standard offer for households in capitals of the EU, Norway and the Energy Community – 2016
Source: ACER and CEER databases, price comparison tools, incumbent suppliers’ websites, NRAs, EnC Secretariat.
80
40
100
60
20
0
%
Energy Network VAT Other taxes RES charges
EU+NO EnC EU+NO EnC
Electricity Gas
13% 13% 1% 1%
27% 27% 37% 37% 27% 27%
11% 11% 15% 15%
16% 16% 13% 13%
16% 16% 10% 10%
3% 3% 10% 10%
35% 35% 43% 43% 50% 50% 73% 73%

8
A C E R / C E E R A N N U A L R E P O R T O N T H E R E S U L T S O F M O N I T O R I N G T H E I N T E R N A L E L E C T R I C I T Y A N D N A T U R A L G A S M A R K E T S I N 2 0 1 6
Consumer protection & empowerment rights mostly transposed into national and regional law.
• Supplier of last resort (SoLR) mechanisms are gener-ally used to replace failing suppliers, but often perform other functions, including protecting inactive consum-ers or those with payment difficulties. SoLR mecha-nisms are widely in place across the EU. However, in some MSs, large shares of households are supplied by SoLRs, which raises questions about why so many households either remain inactive or need protection. Therefore, it is recommended that SoLR mechanisms be designed in ways that enable and promote consum-er engagement in the liberalised market.
• Information on energy bills should be clear and trans-parent. The current practice of presenting, on average, ten distinct information items may be too much for con-sumers to deal with. It is recommended that consum-ers are provided with only essential information on bills, such as price, energy consumption, payment options and the details of the single point of contact. Detailed consumer information could be provided through vari-ous other communications channels.
• From a European-wide perspective, approximately 25% of household consumers are equipped with elec-tricity smart meters, while, for gas, the use of smart
meters remains negligible. MSs are encouraged to en-sure that smart meters are equipped with functionali-ties which enable consumers easily to benefit from and participate in energy efficiency and demand response/flexibility schemes.
• Most MSs have at least one reliable comparison tool (CT) which consumers can use to make an informed supplier choice. The MSs lacking reliable CTs should make a reliable CT available to consumers without delay. NRAs are also strongly invited to assess the ef-fective functioning of CTs and, where necessary, work towards improving it.
• In order to exercise their switching right, consumers must experience a smooth process. In 2016, the av-erage switching time in the EU was, on average, 12 working days, lower than the EU three-week switching target. In the ACER-CEER Bridge paper, a 24-hour tar-get for technical supplier switching, to be achieved by 2025, was proposed. Given the massive roll-out of IT solutions, this target could be achieved by an earlier date (e.g. 2022).
• Around half of consumer complaints received by NRAs for both electricity and gas relate to invoicing, contracts and unfair commercial practices exhibiting improve-ment potential (Figure7).
Figure 7 Consumer complaints to NRAs from households by main categories for gas across the EU (%) – 2016
Source: CEER Database, National Indicators (2017).
60708090
5040302010
0
100
Invoicing and debtcollection
Contracts Unfaircommercialpractices
Gridconnection
and metering
Customerservices
Other TotalSwitching
%
27
34
100
11
10
86
4
© Agency for the Cooperation of Energy Regulators and the Council of European Energy Regulators, 2017Reproduction is authorised provided the source is acknowledged.
Legal noticeThe joint publication of the Agency for the Cooperation of Energy Regulators and the Council of European Energy Regulators is protected by copyright. The Agency for the Cooperation of Energy Regulators and the Council of European Energy Regu-lators accept no responsibility or liability for any consequences arising from the use of the data contained in this document.