cde improvement planning template for distri cts (v 2.1 ... · funds by using the uip. ... jane...
TRANSCRIPT
CDE Improvement Planning Template for Districts (V 2.1 -- Last updated: October 31, 2010) 1

CDE Improvement Planning Template for Districts (V 2.1 -- Last updated: October 31, 2010) 2

CDE Improvement Planning Template for Districts (V 2.1 -- Last updated: October 31, 2010) 3

CDE Improvement Planning Template for Districts (V 2.1 -- Last updated: October 31, 2010) 4
Organization Code: 0010 District Name Mapleton 1 Accountability Status and Requirements for Improvement Plan
Program Identification Process Identification for District Directions for completing improvement plan
State Accountability and Grant Programs
Recommended Plan Type for State Accreditation
Plan assigned based on district’s overall district performance framework score (achievement, growth, growth gaps, postsecondary and workforce readiness)
Improvement Plan
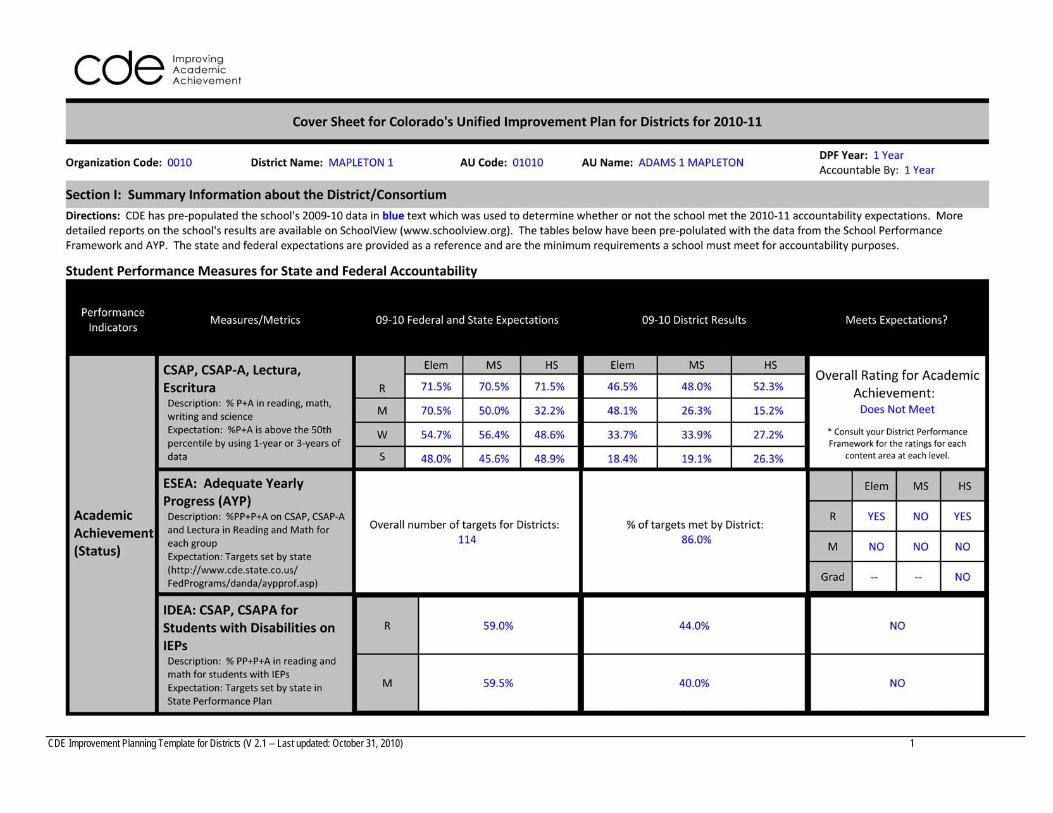
The district is approaching or has not met state expectations for attainment on the performance indicators and is required to adopt and implement an Improvement Plan. The plan must be submitted to CDE by April 15, 2011 to be uploaded on DistrictView.org. Refer to the SchoolView Learning Center for more detailed directions on plan submission, as well as the Quality Criteria and Checklist for State Requirements for District Improvement Plans to ensure that all required elements are captured in the district's plan.
Dropout/Re-engagement Designation to Increase Graduation Rates
District had a graduation rate (1) below 70% in 2007-8, and (2) below 59.5% in 2008-09 and (3) a dropout rate above 8%.
High Priority Graduation district.
The district has been identified as a High Priority Graduation District by the state and is required to complete a Student Graduation and Completion Plan in accordance with CRS 22‐14‐107. The district is expected to use the UIP to meet these requirements. Districts are expected to revise their plan and submit by January 17, 2011. Refer to the Quality Criteria for District Improvement Plans available on the SchoolView.org Learning Center to ensure that all required elements are met in the district’s plan.
ESEA Accountability
Program Improvement or Corrective Action (Title IA)
District missed AYP target(s) in the same content area and level for at least two consecutive years
Corrective Action – Year 5
The district is required to revise the corrective action plan for Title I so that it goes beyond the previous plan. The plan must be submitted to CDE by January 17, 2011 using the Unified Improvement Planning template. Refer to the Quality Criteria for District Improvement Plans available on the SchoolView.org Learning Center to ensure that all required elements are included in the district’s plan.
2141c (Title IIA) District did not make district AYP and did not meet HQ targets for three consecutive years
District has been identified under 2141c
District must enter into an agreement with CDE on the use of Title IIA funds by using the UIP. Incorporate strategies to strengthen staff capacity and improve professional development into your improvement plan. In addition, complete Section V of the template which details how your Title IIA Funds will be allocated. Refer to the Quality Criteria for District Improvement Plans available on the SchoolView. Org. Learning Center to ensure that all required elements are included in the district’s plan.
Program Improvement (Title III)
District/Consortium missed AMAOs for two consecutive years
Improvement- Year 3
Grantee must complete an Improvement plan for Title III using the UIP. At a minimum, make sure to address any missed targets in 08‐09 and 09‐10 in the plan. Refer to the Quality Criteria for District Improvement Plans available on the SchoolView.org Learning Center to ensure that all required elements are included in the plan. Pay special attention to the added requirements for Title III grantees that are identified as Program Improvement ‐ Year 3.4

CDE Improvement Planning Template for Districts (V 2.1 -- Last updated: October 31, 2010) 5
Section II: Improvement Plan Information
Directions: This section should be completed by the district/consortium lead. Additional Information about the District
Improvement Plan Information The district/consortium is submitting this improvement plan to satisfy requirements for (check all that apply):
XX State Accreditation X Dropout/Re-Engagement Designation XX Title IA XX Title IIA XX Title III CTAG Grant District Partnership Grant X District Improvement Grant Other: ________________________________________
Comprehensive Review and Selected Grant History
Related Grant Awards Is the district participating in any grants associated with district improvement (e.g., CTAG, District Improvement Grant)? Provide relevant details.
Retention and Recruitment Grant (pending) District Improvement Grant (pending) EARSS Grant Colorado Graduation Pathways: Drop-out
Prevention Counselor Corps Grant
CADI Has or will the district participated in a CADI review? If so, when? No
Self-Assessment Has the district recently participated in a comprehensive self- assessment for Title IA Corrective Action? If so, include the year and name of the tool used.
The district uses an ongoing School Support Team process to monitor its schools (See narrative for description).
Title I on-site will be conducted in February 2011
External Evaluator Has the district(s) partnered with an external evaluator to provide comprehensive evaluation? Indicate the year and the name of the provider/tool used.
Yes. Mapleton uses an internal monthly SST process to self monitor continuous improvement. Many external consultants have joined the SST process including: Dr. Larry Cuban (Stanford), Jane Hill (MCREL) and several coaches from the National Literacy Coalition.
District or Consortium Lead Contact Information (Additional contacts may be added, if needed)
Name and Title Jackie Kapushion, Assistant Superintendent Email [email protected]
Phone 303-853-1014
1
Mailing Address 591 E 80th Ave Denver, CO 80229
2 Name and Title

CDE Improvement Planning Template for Districts (V 2.1 -- Last updated: October 31, 2010) 6
Phone Mailing Address

CDE Improvement Planning Template for Districts (V 2.1 -- Last updated: October 31, 2010) 7
Section III: Narrative on Data Analysis and Root Cause Identification
This section corresponds with the “evaluate” portion of the continuous improvement cycle. Provide a narrative that examines the data for your district/consortium – especially in any areas where the district/consortium was identified for accountability purposes. To help you construct this narrative, this section has been broken down into four steps: (1) Gather and organize relevant data, (2) Analyze trends in the data and identify priority needs, (3) Determine the root causes of those identified needs, and (4) Create the narrative. Step One: Gather and Organize Relevant Data The planning team must gather data from a variety of sources to inform the planning process. For this process, districts/consortia are required to pull specific performance reports and are expected to supplement their analysis with local data to help explain the performance data. The team will need to include three years of data to conduct a trend analysis in step two.
• Required reports. At a minimum, the school is expected to reference key data sources including: (1) School Performance Framework Report, (2) Growth Summary Report, (3) AYP Summaries (including detailed reports in reading and math for each subpopulation of students), and (4) Post Secondary Readiness data. This information is available either on SchoolView (www.schoolview.org/SchoolPerformance/ index.asp) or through CDE reports shared with the district.
• Suggested data sources. Furthermore, it is assumed that more detailed data is available at the school/district level to provide additional context and deepen the analysis. Some recommended sources may include:
Student Learning Local Demographic Data District Processes Data Perception Data
• Local outcome and interim assessments
• Student work samples • Classroom
assessments (type and frequency)
• Student Early Warning System data (e.g., course failure in core courses, students on track/off track with credits to advance or graduate)
• District locale and size of student population
• Student characteristics, including poverty, language proficiency, IEP, migrant, race/ethnicity
• Student mobility rates • Staff characteristics (e.g., experience,
attendance, turnover, effectiveness measures, staff evaluation)
• List of schools and feeder patterns • Student attendance/absences • Safety and Discipline Incidence Data
(e.g., suspension, expulsions, discipline referrals)
• Comprehensive evaluations of the district (e.g., CADI) • Curriculum and instructional materials • Instruction (time and consistency among grade levels) • Academic interventions available to students • Schedules and class sizes • Family/community involvement policies/practices • Professional development structure (e.g., induction, coaching,
common planning time, data teams) • Services and/or programs (Title I, special ed, ESL/bilingual) • Extended day or summer programs • Dropout Prevention & Student Engagement Practices
Assessment
• Teaching and learning conditions surveys (e.g., TELL Colorado)
• Any perception survey data (e.g., parents, students, teachers, community, school leaders)
• Self-assessment tools (district and/or school level)
• School climate/prevalence of risk surveys (e.g., Healthy Kids Colorado)
Step Two: Analyze Trends in the Data and Identify Priority Needs

CDE Improvement Planning Template for Districts (V 2.1 -- Last updated: October 31, 2010) 8
Using at least three years of data, the team should begin by identifying positive and negative trends in each of the key performance indicators (i.e., academic achievement, academic growth, academic growth gaps, post secondary/workforce readiness). The summary provided in Part I of this template (pp. 1-4) will provide some clues on content areas, grade levels and disaggregated groups where the district/consortium needs to focus its attention. Local data (suggestions provided above) should also be included – especially in grade levels and subject areas not included in state testing. Next, the team should identify observations of its performance strengths on which it can build, and performance challenges or areas of need. Finally, those needs should be prioritized. At least one priority need must be identified for every performance indicator for which the district/consortium performance did not at least meet state and/or federal expectations. These efforts should be documented in the Data Narrative. Trends and priority needs should be listed in the Data Analysis Worksheet below. Step Three: Root Cause Analysis This step is focused on examining the underlying cause of the priority needs identified in step two. A cause is a “root cause” if: (1) the problem would not have occurred if the cause had not been present, (2) the problem will not reoccur if the cause is dissolved and (3) correction of the cause will not lead to the same or similar problems (Preuss, P. G. (2003). School Leader's Guide to Root Cause Analysis: Using Data to Dissolve Problems. Larchmont, NY: Eye on Education). Finally, the district/consortium should have control over the proposed solution – or the means to implement the solution. Remember to verify the root cause with multiple data sources. These efforts should be documented in the Data Narrative. Root causes should also be listed in the Data Analysis Worksheet. Data Analysis Worksheet Directions: This chart will help you record and organize your observations about your district/consortium level data for the required data analysis narrative. You are encouraged to conduct a more comprehensive analysis by examining all of the performance indicators. – at a minimum, you must address the performance indicators for the targets that were not met for accountability purposes. Ultimately, your analysis will guide the major improvement strategies you choose in section IV. You may add rows, as necessary.

CDE Improvement Planning Template for Districts (V 2.1 -- Last updated: October 31, 2010) 9
Performance Indicators Description of Significant Trends (3 years of past data) Priority Needs Root Causes
Academic Achievement (Status)
All academic areas are below the State averages. Reading 2008 - 41% P and A (less than state) 2009 - 44% P and A (less than state) 2010 – 47% P and A (less than state) Writing 2008 - 29% P and A (less than state) 2009 - 32% P and A (less than state) 2010 – 32% P and A (less than state) Math 2008 - 28% P and A (less than state) 2009 - 30% P and A (less than state) 2010 –33 % P and A (less than state)
Reading: While making consistent improvement at all grade levels over the past 3 years, less than 50% of students are P or A. Writing: Consistently less than 1/3 of Mapleton students are P or A in writing. Math: Less than 1/4th of Mapleton 6-12th grade students are P or A in math.
Reading: The District has not provided developmentally appropriate support to teachers in providing all students with consistent, systematic differentiated reading instruction in their zone of proximal development. Writing: Prior to 2010, Mapleton Public Schools did not have an articulated and differentiated PreK-12 core curricular writing framework or expectations of grade-level writing products. Math: Lack of PreK-12 curricular alignment in math that consistently and systematically builds and maintains mathematical thinking and develops the skills students need to articulate their thinking processes.
AYP
Reading 2008- No 2009- No 2010- Yes Math 2008- No 2009- No 2010- No
Reading: AYP performance targets were not met by middle school students in all subgroups except Asian and White. Math: AYP performance targets were not met by middle school students in all subgroups except Asian.
Same as above
CDE Improvement Planning Template for Districts (V 2.1 -- Last updated: October 31, 2010) 10
AYP
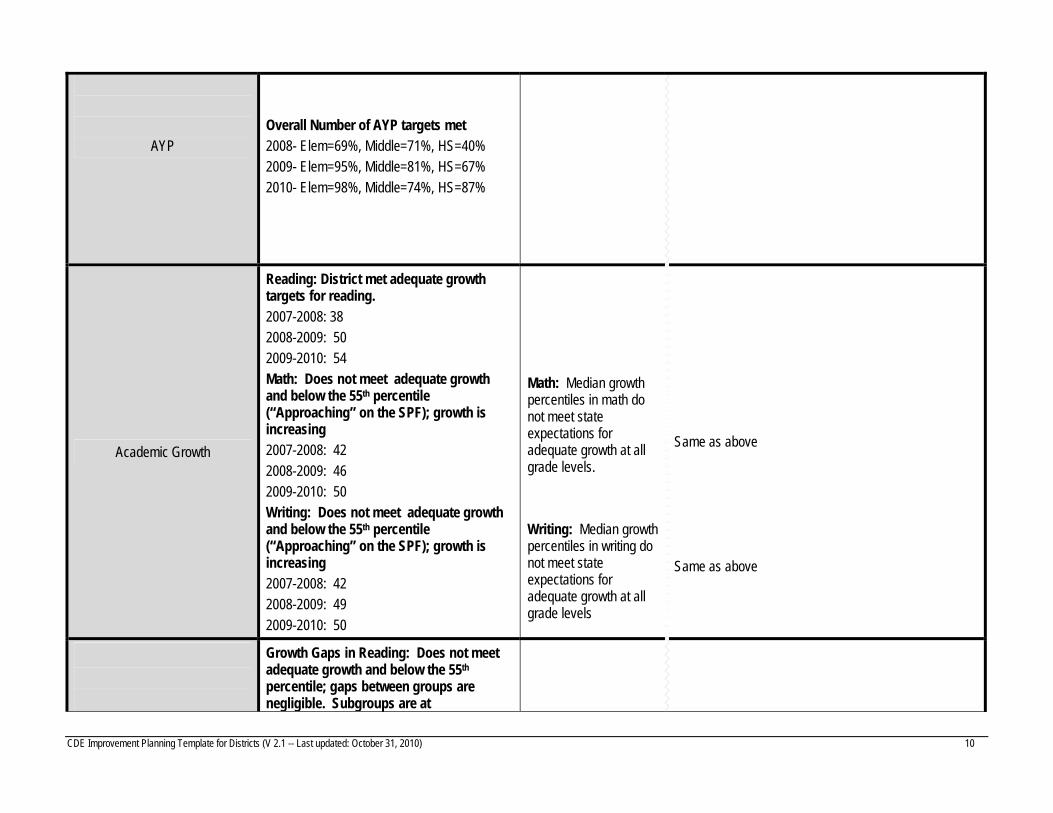
Overall Number of AYP targets met 2008- Elem=69%, Middle=71%, HS=40% 2009- Elem=95%, Middle=81%, HS=67% 2010- Elem=98%, Middle=74%, HS=87%
Academic Growth
Reading: District met adequate growth targets for reading. 2007-2008: 38 2008-2009: 50 2009-2010: 54 Math: Does not meet adequate growth and below the 55th percentile (“Approaching” on the SPF); growth is increasing 2007-2008: 42 2008-2009: 46 2009-2010: 50 Writing: Does not meet adequate growth and below the 55th percentile (“Approaching” on the SPF); growth is increasing 2007-2008: 42 2008-2009: 49 2009-2010: 50
Math: Median growth percentiles in math do not meet state expectations for adequate growth at all grade levels. Writing: Median growth percentiles in writing do not meet state expectations for adequate growth at all grade levels
Same as above Same as above
Growth Gaps in Reading: Does not meet adequate growth and below the 55th percentile; gaps between groups are negligible. Subgroups are at
CDE Improvement Planning Template for Districts (V 2.1 -- Last updated: October 31, 2010) 11
Academic Growth Gaps
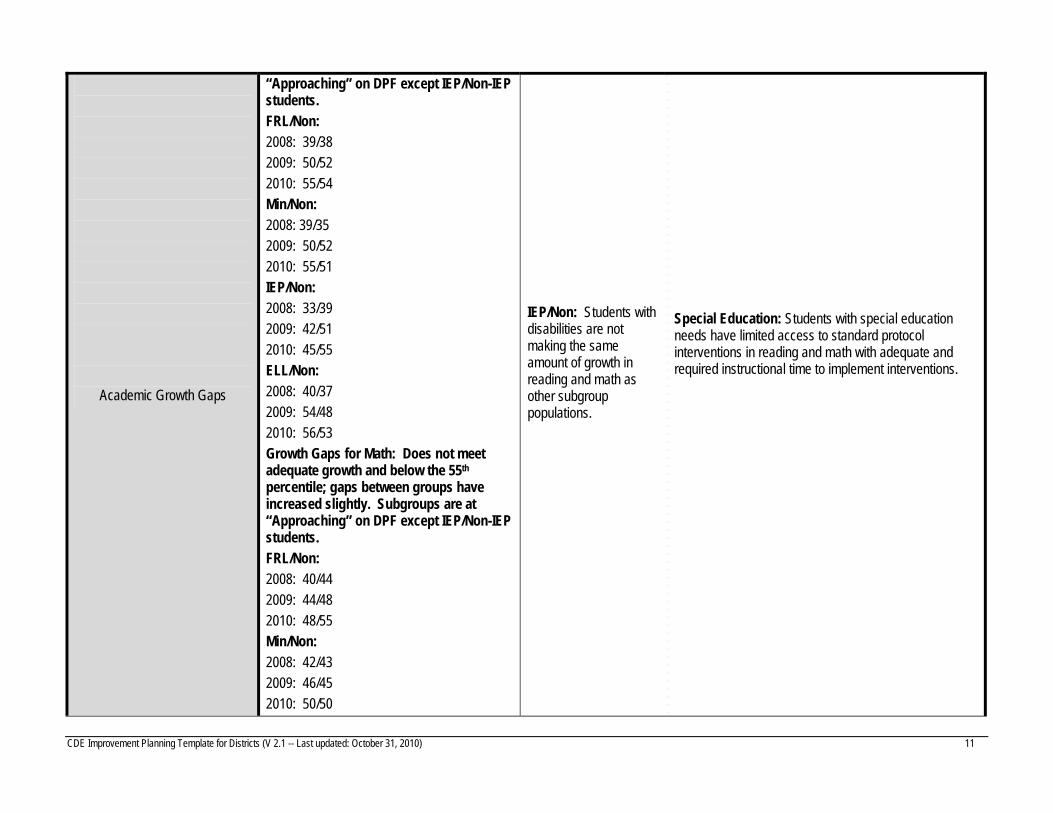
“Approaching” on DPF except IEP/Non-IEP students. FRL/Non: 2008: 39/38 2009: 50/52 2010: 55/54 Min/Non: 2008: 39/35 2009: 50/52 2010: 55/51 IEP/Non: 2008: 33/39 2009: 42/51 2010: 45/55 ELL/Non: 2008: 40/37 2009: 54/48 2010: 56/53 Growth Gaps for Math: Does not meet adequate growth and below the 55th percentile; gaps between groups have increased slightly. Subgroups are at “Approaching” on DPF except IEP/Non-IEP students. FRL/Non: 2008: 40/44 2009: 44/48 2010: 48/55 Min/Non: 2008: 42/43 2009: 46/45 2010: 50/50
IEP/Non: Students with disabilities are not making the same amount of growth in reading and math as other subgroup populations.
Special Education: Students with special education needs have limited access to standard protocol interventions in reading and math with adequate and required instructional time to implement interventions.

CDE Improvement Planning Template for Districts (V 2.1 -- Last updated: October 31, 2010) 12
IEP/Non: 2008: 40/42 2009: 41/46 2010: 44/50 ELL/Non: 2008: 43/42 2009: 48/44 2010: 51/49 Growth Gaps in Writing: Does not meet adequate growth and below the 55th percentile; gaps between groups are negligible. Subgroups are at “Approaching” on DPF except IEP/Non-IEP students. FRL/Non: 2008: 42/42 2009: 49/50 2010: 51/49 Min/Non: 2008: 42/41 2009: 50/46 2010: 51/48 IEP/Non: 2008: 36/42 2009: 36/50 2010: 48/50 ELL/Non: 2008: 42/41 2009: 55/45 2010: 54/49

CDE Improvement Planning Template for Districts (V 2.1 -- Last updated: October 31, 2010) 13
Data Analysis Worksheet (cont.)
Performance Indicators Description of Significant Trends (3 years of past data) Priority Needs Root Causes
Graduation rate: 2008: 60% 2009: 59% 2010: 42% Males: 41.6 Females: 47.1 IEP: 38.5 ELL: 43.4 Poverty: 44.9
Graduation rates have decreased for two years (2008 – 2010), overall. A higher percentage of girls than boys graduate. A lower percentage of students who are homeless, or who have learning disabilities, graduate. Students who experience major life events while in high school, or who change schools multiple times are less likely to graduate.
Graduation Rate: The District has not provided teachers with sufficient strategies to engage and re-engage at-risk youth.
Lack of support for at-risk secondary students, including: students exhibiting early warning signs of school disengagement; students experiencing major life events while in high school; and students who have already dropped out but who might return given adequate support. Insufficient support for students transitioning between levels of schooling (8th to 9th; secondary to post-secondary). Inadequate instructional supports to bolster academic skills of low-achieving secondary students.
Post Secondary/Workforce Readiness
ACT: Scores are below the state average and are increasing. “Approaching” on DPF. 2008:16.6 2009: 16.2 2010: 17.2
ACT scores have consistently improved over the past three years, though Mapleton students are still scoring below the state average.

CDE Improvement Planning Template for Districts (V 2.1 -- Last updated: October 31, 2010) 14
Drop-out rate is above the state average and is declining. “Approaching” on DPF. 2008: 5.5% 2009: 8.2% 2010: 5.5%
Dropout rates have fluctuated year to year, but have remained relatively stable over a three year period.
Drop-out Rate: The District has not provided teachers with sufficient strategies to engage and re-engage at-risk youth.
Lack of support for at-risk secondary students, including: students exhibiting early warning signs of school disengagement; students experiencing major life events while in high school; and students who have already dropped out but who might return given adequate support. Insufficient support for students transitioning between levels of schooling (8th to 9th; secondary to post-secondary). Inadequate instructional supports to bolster academic skills of low-achieving secondary students. Students who experience major life events while in high school, who change schools multiple times, or who begin high school with lower-than-grade level skills are more likely to drop out.
English Language Development and Attainment (AMAOs)
AMAO #1: Making Progress 2008: Yes 2009: No 2010: Yes AMAO #2 Attaining Proficiency in English 2008: Yes 2009: No 2010: Yes AMAO #3 Proficiency in Content Knowledge 2008: No 2009: No 2010: No
AMAO #3: For the past 3 years, Mapleton has not met AMAO Target #3. For 2010, this target was missed in reading and math for middle school ELL students.
ELL: Lack of professional development provided to give teachers the skills to modify, adjust and scaffold instruction to develop students’ academic language and concepts in content areas. Lack of scaffolded curriculum provided for LAU A and B students in grades 3-10.

CDE Improvement Planning Template for Districts (V 2.1 -- Last updated: October 31, 2010) 15
Prof/Adv CSAP Results for ELL Students Reading 2008 30.3 % Reading 2009 33.1 % Reading 2010 38.5 % Math 2008 23.6% Math 2009 26.6% Math 2010 27.9%
Teacher Qualifications (Highly Qualified Teachers)
Highly Qualified (% of classes taught by Highly Qualified Teachers): 2007-08: 98.6% 2008-09: 99.9% 2009-2010: 99.7%
In 2009-2010, one teacher had finger-printing processing issues and was deemed highly-qualified after the December HR Report was submitted.
Step 4: Create the Data Narrative Directions: Describe the work that you have done in the previous three steps: (1) Gather and organize relevant data, (2) Analyze trends in the data and identify priority needs, and (3) Determine the root causes of those identified needs. The narrative should not take more than five pages. Consider the questions below as you write your narrative. Data Narrative for District/Consortium Trend Analysis and Priority Needs: On which performance indicators is our district/consortium trending positively? On which performance indicators is our district/consortium trending negatively? Does this differ for any disaggregated student groups, (e.g., by grade level or gender)? What performance challenges are the highest priorities for our district/consortium?
Root Cause Analysis: Why do we think our district/consortium’s performance is what it is?
Verification of Root Cause: What evidence do we have for our conclusions?
Narrative: District Mission: The mission of Mapleton Public Schools, a community that embraces its children through high performing schools of choice, is to ensure that each student is empowered to achieve his or her dreams and contribute to his or her community and world through an education system distinguished by:
A resourceful community working together to ensure that no obstacles impede student success A tenacious pursuit of rigorous academics and personal development An effective, student-focused and compassionate staff Small family-like environments where relationships inspire achievement
Practices that honor the deeply-rooted history and diversity of our community

CDE Improvement Planning Template for Districts (V 2.1 -- Last updated: October 31, 2010) 16
District Demographic Data: Mapleton Public Schools is an urban district north of Denver with 7,600 students. We have a system of choice that includes the following school configurations: (1) preschool program, (3) K-6 schools, (4) K-8, (2) K-12, (1) 7-12, (2) 9-12, (1) school targeting dropout prevention and recovery for young adults aged 16 – 21, (1) charter school and (1) K-12 on-line school. The student population is characterized as 61% Hispanic, 32% White, 31%English Language Learners, 68% free/reduced and 38% mobility. Staff Demographic Data: Mapleton Public Schools employs approximately 720 people. Of this employee group approximately 325 employees (45%) are full-time teachers, 120 employees (16%) are full-time instructional paraprofessionals, and approximately 35 employees (4%) are building and district administrators. The average professional experience teachers have in Mapleton is 7 years, with approximately 117 teachers (36%) having fewer than 3 years of experience in the profession. With regard to level of education, approximately 160 teachers (49%) hold a masters or doctoral degree. In the fall of 2010, Mapleton hired approximately 60 teachers new to the district. This is a decrease, by about 20 teachers, from the previous year. A total of 92 teachers were hired during the 2009-2010 school year, and a total of 82 teachers were hired during the 2008-2009 school year. In Mapleton, teachers work an average of 186 days and an average of 7.8 hours each work day. During the 2009-2010 school year, 90 certified employees missed 10 or more days of work. In addition, 21 certified employees took advantage of the cumulative leave days “buyout” option. CSAP Achievement Trends: When CSAP achievement data from 2010 are considered from a three year perspective (e.g., compared to data from 2008), there is significant evidence that student achievement has improved. The percentage of Mapleton students (no exclusions) achieving a proficient or advanced score on CSAP increased at 20 of 27 CSAP grade/subject levels (74%). The percentage of proficient/advanced students stayed the same from 2008 to 2010 at 5 grade levels (19%), and decreased at 2 grade levels (7%).
CSAP AchievementReading
4541 43
46
4037 38
35
50
35
46 48
42 42 43
51
4541
5055
44 4449 51
0
10
20
30
40
50
60
70
80
3rd 4th 5th 6th 7th 8th 9th 10th
% p
rofic
ient
/adv
ance
d
08 09 10 08 09 10 08 09 10 08 09 10 08 09 10 08 09 10 08 09 10 08 09 10
Writing
30 28
3437
33
2521
17
34
28
36 38 38
3025
2934
28
36 3633 31
26 26
0
10
20
30
40
50
60
70
80
3rd 4th 5th 6th 7th 8th 9th 10th
% p
rofic
ient
/adv
ance
d
08 09 10 08 09 10 08 09 10 08 09 10 08 09 10 08 09 10 08 09 10 08 09 10

CDE Improvement Planning Template for Districts (V 2.1 -- Last updated: October 31, 2010) 17
Math
41 4339
35
1518
15
5
47 4944
32
21 22
12
6
52 50
4339
21 21
1511
0
10
20
30
40
50
60
70
80
3rd 4th 5th 6th 7th 8th 9th 10th
% p
rofic
ient
/adv
ance
d
08 09 10 08 09 10 08 09 10 08 09 10 08 09 10 08 09 10 08 09 10 08 09 10
Science
1217
211922
28
18 16
24
0
10
20
30
40
50
60
70
80
5th 8th 10th
% p
rofic
ient
/adv
ance
d
08 09 1008 09 10 08 09 10
CSAP Growth Trends: When CSAP growth data from 2010 are considered from a three year perspective (e.g., compared to growth data from 2008), there is significant evidence that student growth rates have improved. Mapleton’s median growth percentile increased from 38 to 54 in reading, from 42 to 50 in writing, and from 42 to 50 in math. Reading median growth percentiles from 2010 are higher at all grade levels measured (4th-10th) compared with 2008 data, with the average median percentile increasing 17 points. Writing median growth percentiles from 2010 are higher at all grade levels measured (4th-10th), with the average median percentile increasing 9 points. Math median growth percentiles from 2010 are higher at 6 of 7 grade levels measured (4th-10th), with the average median percentile increasing 8 points. The three-year Improvement trends in overall growth data described above also are present in data disaggregated by student subgroups. Compared to 2008, the district’s 2010 average median growth percentile for minority students increased from 39 to 55 in reading, 42 to 51 in writing, and 42 to 50 in math. The district’s average median growth percentile for FRL students increased from 39 to 55 in reading, 42 to 51 in writing, and 40 to 48 in math. The district’s average median growth percentile for ELL students increased from 40 to 56 in reading, 42 to 54 in writing, and 43 to 51 in math. (AMAO#3)
As a result of improved growth results, the percentage of students catching up and keeping up increased in 2010 compared to 2008. The percentage of students catching up increased from 21% to 35% in reading and from 8% to 9% in math (writing remained the same at 17%). The percentage of students keeping up went from 63% to 76% in reading, 54% to 61% in writing, and 39% to 52% in math.
CSAP Analysis of English Language Learners: The CSAP status and growth analysis for English Language Learners demonstrates a positive trend in reading, writing, and math over the past three years (see pages 13,14, and 16). Providing quality universal instruction in reading and math as well as language development curriculum for LAU A and B students supports this current and future trend. The two year district-wide focus and professional development on instructional strategies for ELL students based on McRel’s work has laid the foundation for an integrated approach to high yield instructional strategies for ELL and the district’s research based core curricula.

CDE Improvement Planning Template for Districts (V 2.1 -- Last updated: October 31, 2010) 18
CSAP Growth TrendsBased on CDE District Growth Summary Report
3842 42
50 4946
5450 50
0
10
20
30
40
50
60
Reading Writing Math
Ave
rage
Med
ian
Gro
wth
Per
cent
ile
08 09 10 08 09 10 08 09 10
CSAP Growth Trends by GroupsBased on CDE District Growth Summary Report
39 42 4250 50
46
5551 50
0
10
20
30
40
50
60
70
80
90
100
Reading Writing Math
Ave
rage
Med
ian
Gro
wth
Per
cent
ile
39 42 40
50 4944
5551 48
0
10
20
30
40
50
60
70
80
90
100
Reading Writing Math
40 42 43
54 5548
56 54 51
0
10
20
30
40
50
60
70
80
90
100
Reading Writing Math
Minority English Language LearnersFree and Reduce
08 09 1008 09 1008 09 10 08 09 10 08 09 10 08 09 10 08 09 1008 09 1008 09 10
CSAP Growth Trends by GroupsBased on CDE District Growth Summary Report
2117
8
32
22
12
35
179
0
10
20
30
40
50
60
70
80
90
100
Reading Writing Math
Ave
rage
Med
ian
Gro
wth
Per
cent
ile
63
54
39
73
64
50
76
61
52
0
10
20
30
40
50
60
70
80
90
100
Reading Writing MathCatch Up Keep Up
08 09 10 08 09 10 08 09 10 08 09 1008 09 1008 09 10

CDE Improvement Planning Template for Districts (V 2.1 -- Last updated: October 31, 2010) 19
District MAP Testing in Reading Language and Math MAP Spring 2008 to Fall 2010
Mean Percentile 2nd 3rd 4th 5th 6th 7th 8th 9th 10thGrade3-
10 Reading: 7 grades increased 2 grade decreased Spring 08 33 33 37 39 35 35 34 37 30 35 Spring 09 30 34 35 40 36 34 37 36 38 36
Fall 09 21 31 34 35 37 32 34 38 39 33 Spring 10 32 36 38 39 41 39 38 39 40 38
Fall 10 23 33 35 38 39 38 38 34 38 35 Language: 6 grades increased, 1 remaind the same 2 grade decreased
Spring 08 29 32 37 37 36 37 35 35 30 34 Spring 09 29 38 39 43 39 37 38 38 42 36
Fall 09 21 33 38 40 41 36 34 38 39 35 Spring 10 31 38 41 41 45 42 40 44 43 40
Fall 10 22 32 36 42 41 42 39 39 44 37
Math: 4 grades increased, 3 remained the same and 2 grades decreased Spring 08 33 35 37 39 32 31 31 30 23 32 Spring 09 37 39 39 41 36 32 33 35 38 37
Fall 09 32 37 39 39 40 35 30 33 35 36 Spring 10 25 40 38 43 40 43 39 34 37 37
Fall 10 32 37 37 43 38 38 38 33 36 37 Colors compare fall 2009 to fall 2110
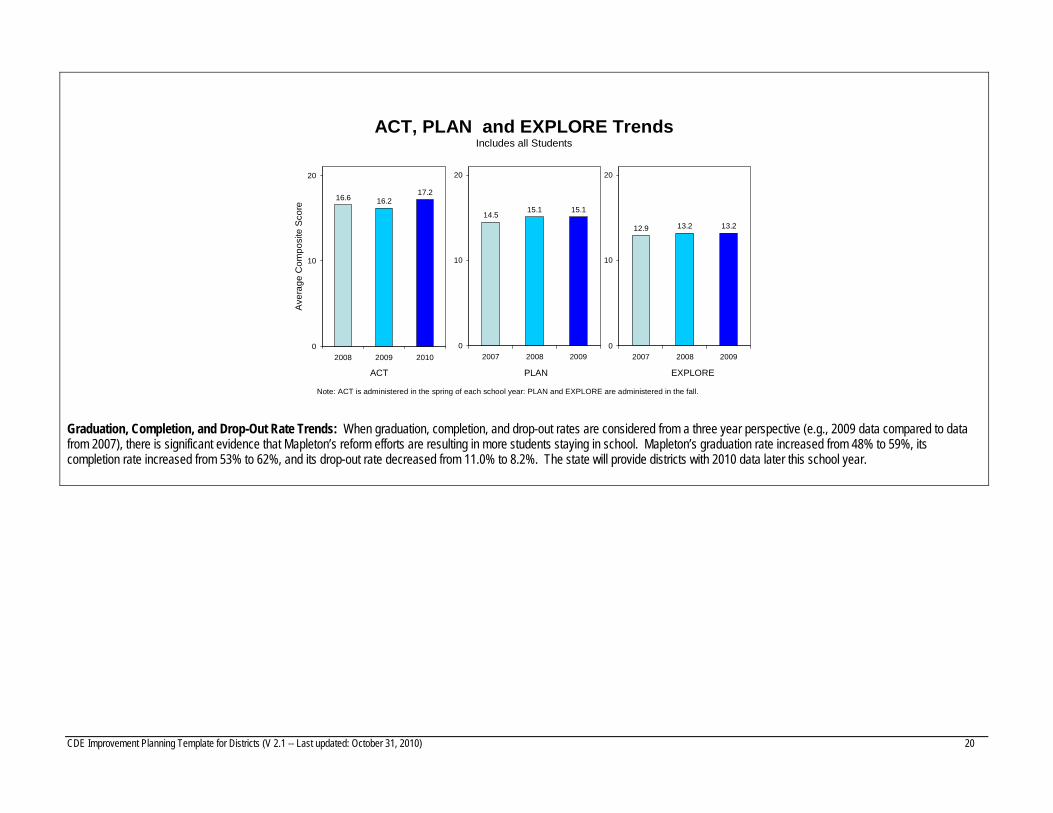
These achievement and growth data justify the continuation of Mapleton’s existing action plan in Reading. Math and Writing action plans were first implemented in Fall, 2010. Although CSAP data is not yet available, fall and winter MAP growth data also suggests continuation of existing improvement plan is correct. College Readiness (ACT, PLAN, EXPLORE Trends): All of Mapleton’s 3-year ACT results (Total, not just Tested) show a trend toward improvement. When 2010 ACT results are compared 2008 results, Mapleton’s Composite average increased from 16.6 to 17.2, its Reading average increased from 16.4 to 17.3, its English average increased from 15.6 to 16.5, its Math average increased from 16.5 to 17.0, and its Science average increased from 17.5 to 17.6. District data patterns from PLAN (10th grade) and EXPLORE (8th grade) are consistent with the ACT improvement trends described above. When results from the fall 2009 administration of PLAN are compared to results from fall 2007, Mapleton’s Composite average increased from 14.3 to 15.4. When results from the fall 2009 administration of EXPLORE are compared to results from fall 2007, Mapleton’s Composite average increased from 12.9 to 13.2. The three year range for PLAN and EXPLORE is 2007-2009 rather than 2008-2010 because these tests are administered in the fall of each school year, while ACT is administered in the spring of each school year.
CDE Improvement Planning Template for Districts (V 2.1 -- Last updated: October 31, 2010) 20
ACT, PLAN and EXPLORE TrendsIncludes all Students
16.6 16.217.2
0
10
20
2008 2009 2010
Ave
rage
Com
posi
te S
core
14.515.1 15.1
0
10
20
2007 2008 2009
12.9 13.2 13.2
0
10
20
2007 2008 2009
ACT EXPLOREPLAN
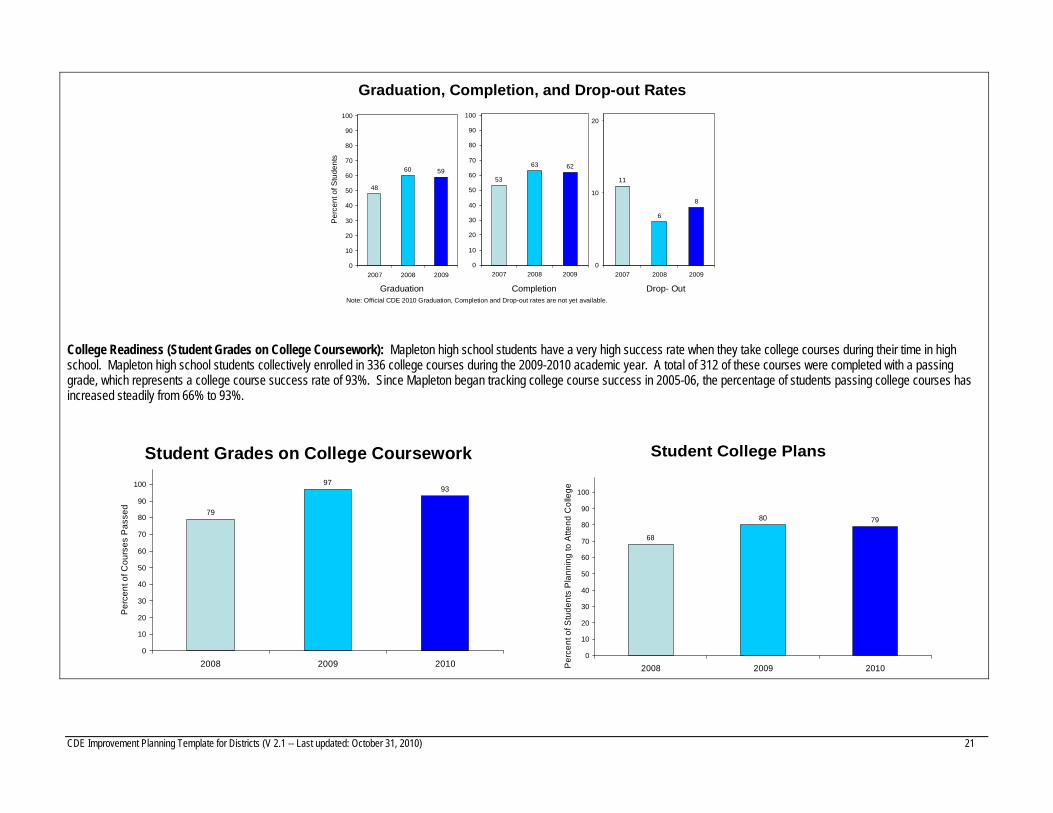
Note: ACT is administered in the spring of each school year: PLAN and EXPLORE are administered in the fall. Graduation, Completion, and Drop-Out Rate Trends: When graduation, completion, and drop-out rates are considered from a three year perspective (e.g., 2009 data compared to data from 2007), there is significant evidence that Mapleton’s reform efforts are resulting in more students staying in school. Mapleton’s graduation rate increased from 48% to 59%, its completion rate increased from 53% to 62%, and its drop-out rate decreased from 11.0% to 8.2%. The state will provide districts with 2010 data later this school year.
CDE Improvement Planning Template for Districts (V 2.1 -- Last updated: October 31, 2010) 21
Graduation, Completion, and Drop-out Rates
48
60 59
0
10
20
30
40
50
60
70
80
90
100
2007 2008 2009
Per
cent
of S
tude
nts
53
63 62
0
10
20
30
40
50
60
70
80
90
100
2007 2008 2009
11
6
8
0
10
20
2007 2008 2009
Graduation Drop- OutCompletionNote: Official CDE 2010 Graduation, Completion and Drop-out rates are not yet available.
College Readiness (Student Grades on College Coursework): Mapleton high school students have a very high success rate when they take college courses during their time in high school. Mapleton high school students collectively enrolled in 336 college courses during the 2009-2010 academic year. A total of 312 of these courses were completed with a passing grade, which represents a college course success rate of 93%. Since Mapleton began tracking college course success in 2005-06, the percentage of students passing college courses has increased steadily from 66% to 93%.
Student Grades on College Coursework
79
9793
0
10
20
30
40
50
60
70
80
90
100
2008 2009 2010
Per
cent
of C
ours
es P
asse
d
Student College Plans
68
80 79
0
10
20
30
40
50
60
70
80
90
100
2008 2009 2010Per
cent
of S
tude
nts
Pla
nnin
g to
Atte
nd C
olle
ge
CDE Improvement Planning Template for Districts (V 2.1 -- Last updated: October 31, 2010) 22
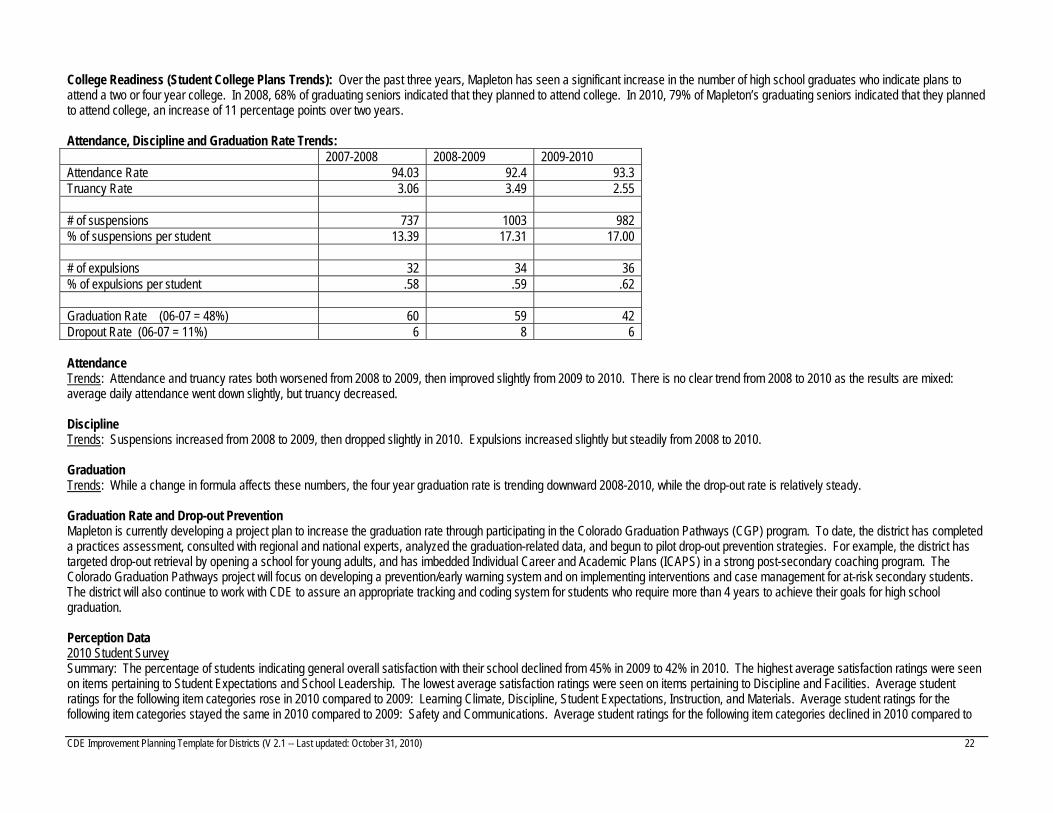
College Readiness (Student College Plans Trends): Over the past three years, Mapleton has seen a significant increase in the number of high school graduates who indicate plans to attend a two or four year college. In 2008, 68% of graduating seniors indicated that they planned to attend college. In 2010, 79% of Mapleton’s graduating seniors indicated that they planned to attend college, an increase of 11 percentage points over two years. Attendance, Discipline and Graduation Rate Trends: 2007-2008 2008-2009 2009-2010 Attendance Rate 94.03 92.4 93.3 Truancy Rate 3.06 3.49 2.55 # of suspensions 737 1003 982 % of suspensions per student 13.39 17.31 17.00 # of expulsions 32 34 36 % of expulsions per student .58 .59 .62 Graduation Rate (06-07 = 48%) 60 59 42 Dropout Rate (06-07 = 11%) 6 8 6 Attendance Trends: Attendance and truancy rates both worsened from 2008 to 2009, then improved slightly from 2009 to 2010. There is no clear trend from 2008 to 2010 as the results are mixed: average daily attendance went down slightly, but truancy decreased. Discipline Trends: Suspensions increased from 2008 to 2009, then dropped slightly in 2010. Expulsions increased slightly but steadily from 2008 to 2010. Graduation Trends: While a change in formula affects these numbers, the four year graduation rate is trending downward 2008-2010, while the drop-out rate is relatively steady. Graduation Rate and Drop-out Prevention Mapleton is currently developing a project plan to increase the graduation rate through participating in the Colorado Graduation Pathways (CGP) program. To date, the district has completed a practices assessment, consulted with regional and national experts, analyzed the graduation-related data, and begun to pilot drop-out prevention strategies. For example, the district has targeted drop-out retrieval by opening a school for young adults, and has imbedded Individual Career and Academic Plans (ICAPS) in a strong post-secondary coaching program. The Colorado Graduation Pathways project will focus on developing a prevention/early warning system and on implementing interventions and case management for at-risk secondary students. The district will also continue to work with CDE to assure an appropriate tracking and coding system for students who require more than 4 years to achieve their goals for high school graduation. Perception Data 2010 Student Survey Summary: The percentage of students indicating general overall satisfaction with their school declined from 45% in 2009 to 42% in 2010. The highest average satisfaction ratings were seen on items pertaining to Student Expectations and School Leadership. The lowest average satisfaction ratings were seen on items pertaining to Discipline and Facilities. Average student ratings for the following item categories rose in 2010 compared to 2009: Learning Climate, Discipline, Student Expectations, Instruction, and Materials. Average student ratings for the following item categories stayed the same in 2010 compared to 2009: Safety and Communications. Average student ratings for the following item categories declined in 2010 compared to
CDE Improvement Planning Template for Districts (V 2.1 -- Last updated: October 31, 2010) 23
2009: Facilities and School Leadership. Schools with the highest overall student satisfaction ratings were Highland (88%), Adventure (86%), and North Valley (79%). Schools with the lowest overall student satisfaction ratings were Meadow (14%), MESA (15%), and Global (17%). 2010 Parent Survey Summary: The percentage of parents indicating general overall satisfaction with their school declined from 85% in 2009 to 80% in 2010. The highest average satisfaction ratings were seen on items pertaining to Student Expectations. The lowest average satisfaction ratings were seen on items pertaining to Discipline. No parent item categories demonstrated higher ratings averages in 2010 compared to 2009. Average parent ratings for the following item categories stayed the same in 2010 compared to 2009: Learning Climate, Communications, Discipline, Student Expectations, Instruction, and Materials. Average parent ratings for the following item categories declined in 2010 compared to 2009: Safety, Facilities, and Leadership. Schools with the highest overall parent satisfaction ratings were Enrichment (98%) and MELC (96%). Schools with the lowest overall parent satisfaction ratings were MESA (49%), Monterey (70%), Meadow (72%), and Skyview Academy (74%). 2010 Staff Survey Summary: The percentage of staff indicating general overall satisfaction with schools declined from 51% in 2009 to 49% in 2010. The highest average satisfaction ratings were seen on items pertaining to Student Expectations and Safety. The lowest average satisfaction ratings were seen on items pertaining to Discipline and Materials. The only item category demonstrating higher staff rating averages in 2010 compared to 2009 was Facilities. Average staff ratings for the following item categories stayed the same in 2010 compared to 2009: Safety, Communications, Materials, and Teacher Support. Average staff ratings for the following item categories declined in 2010 compared to 2009: Learning Climate, Discipline, Student Expectations, Instruction, and Leadership. Schools with the highest overall staff satisfaction ratings were North Valley (100%), Explore (89%), Adventure (86%), MELC (83%), and York (83%). Schools with the lowest overall staff satisfaction ratings were Meadow (0%), MESA (25%), Global (30%), and Academy (38%). Curriculum and Instructional Materials: Mapleton Public Schools’ theory of action regarding curricular materials and instruction is based on the identified student achievement needs and the staff demographics described above. The reading, writing, math, and science reform materials that have been adopted include a solid scope and sequence, components that have built-in differentiation, systems for progress monitoring including formative assessments, is inquiry-based, and align with state and district standards. The adopted materials have been developed by established, research-based publishers and organizations including the National Literacy Coalition (Every Child a Writer and Every Child a Reader), McGraw Hill (University of Chicago Math and EveryDay Math), Lab Aids (SE-PUP) and It’s About Time (Active Chemistry, Earthcomm). Every Child a Reader or ECaR: a PreK-10 reading program that includes a tight scope and sequence of grade level skills in phonemic awareness, phonics, vocabulary, fluency and comprehension and gives teachers support in implementing differentiated instruction for all students. Initial, district-wide implementation of ECAR took place in Fall, 2008. Every Child a Writer or ECaW: a genre-based PreK-12 writing program that includes specific learning targets for planning, organization, vocabulary usage, sentence and paragraph structure and conventions, and mechanics. Initial, district-wide implementation of ECaW took place in Fall, 2010. EveryDay Math: The content strands in this PreK-6th grade math curriculum are Number and Numeration; Operations and Computation; Data and Chance; Measurement and Reference Frames; Geometry; and Patterns, Algebra, and Functions. The Everyday Math implementation is the foundation for the secondary implementation of the University of Chicago School Math program. Initial, district-wide implementation of EDM took place in Fall, 2007. University of Chicago School Math Program: a 7-12 grade math curriculum based on the four dimensions of understanding through the SPUR approach (Skills, Properties, Uses, and Representations). In addition, mathematical reading and a real-world orientation are embedded. Initial, district-wide implementation of University of Chicago Math took place in Fall, 2010. ELL Programming: Literacy based English as a Second Language (ESL) instruction is provided to all level A and B English Language Learners. Mapleton English Language Development Standards are the basis for this instruction. ESL methods include total physical response, sheltered English instruction, music, story telling, song, role-play, drama and games. These methods are used to develop literacy skills in English. Bilingual/ESL teachers supported by paraprofessionals provide ESL instruction.

CDE Improvement Planning Template for Districts (V 2.1 -- Last updated: October 31, 2010) 24
Literacy instruction varies depending on a student’s native language and their grade. At the following schools: Adventure Elementary, Achieve Academy, and Monterey Community School, a student in the primary grades may receive Spanish literacy instruction, literacy instruction to bridge reading skills in Spanish to English or English literacy instruction. Balanced Literacy is the approach utilized regardless of language. Literacy instruction at the intermediate and secondary level is provided in English using a variety of instructional techniques. All students are provided standards based grade level content instruction in English. This instruction is modified based on student needs by classroom teachers. Depending on the needs of the student, Spanish translation and support may be provided to clarify the English instruction. Reading and Writing: Explicit literacy learning targets upon which the instruction for differentiated groups is based are available to all teachers (i.e. writing transition stage: uses pronouns, present tense, modifiers; Operation Stage: uses varied sentence structure, edits language). These learning targets align with language objectives that are fundamental to the language, literacy, and content development for English Language Learners. Math: K-6: Math lessons have explicit guidance for teachers for key vocabulary, key concepts that support language objectives, specific ELL support, and HomeLinks. 7-12th supports the development of math concepts, key vocabulary, and fundamental schema for ELL. Each lesson has identified “big ideas”, vocabulary, guided examples, and individual practice. In addition, many lessons include specific ELL/Vocabulary notes that provide suggestions to teachers to support ELL students’ access to the math content. A language development program, Language for Learning (K), for Writing (1st Grade), and Thinking (2nd) is implemented in K-2 with LAU A and B students. This program has been implemented since 2009. There is no comparable program in grades 3-12. Special Education Programming: Students aged 3-21 who are identified under IDEIA rules and regulations as having a disability, are provided Special Education and Related Services. A continuum of services including: Early Childhood, specialized academic instruction, life skills, transition and social/behavioral, are individualized to meet the unique needs of each student. Related services are provided in the areas of occupational and physical therapy, audiology, and vision intervention. Paraprofessionals provide support to students as directed by certified staff. All certified staff are licensed in their appropriate discipline by the Colorado Department of Education. Professional Development Structures (e.g., Induction, Content Coaching, Common Planning Time, Data Teams): In Mapleton, the district believes that the teaching profession is a developmental process and therefore all professional learning must be developmentally aligned, consistent, job embedded, and needs-based. Therefore, the district provides a differentiated professional development structure that is relevant to individual responsibilities, level of experience, and district initiatives/priorities. Professional learning opportunities in Mapleton include but are not limited to: induction programs for new teachers and school directors, initial and ongoing curriculum implementation training, direct coaching support, and Professional Learning Communities (PLCs). Mapleton provides a two-year teacher induction program for teachers who are new to the profession. Supports offered include a three-day district orientation/welcome session at the beginning of the year, monthly workshops, weekly meetings with a mentor coach, the opportunity to conduct a year long case study in their second year of teaching, and training on all relevant district curriculum and initiatives. School Directors and Assistant Directors new to the career or the district are also provided with induction support through monthly meetings and assigned individual mentors. . Part of the professional development plan for effective writing instruction is individual and team coaching. This takes place throughout the course of the school year with the coach supporting teachers in reviewing assessment data, modeling of the program in their classroom with their students, observing and providing teachers with feedback, and being available for general questions and problem solving. This level of coaching support also takes place for newly hired teachers who teach reading and/or for those working with students who are learning English as their second language. Content specific trainings are offered to relevant teachers upon the adoption of the curriculum. In addition, the district seeks opportunities to provide school directors with content specific leadership training to assist them in supporting teachers. Teachers and school leaders are able to collaborate with colleagues from across the district through the format of PLCs. In Mapleton,

CDE Improvement Planning Template for Districts (V 2.1 -- Last updated: October 31, 2010) 25
PLCs are taking place in the areas of: Reading, Writing, Math, English Language Learners, Gifted and Talented Learners, Response to Intervention, Secondary Science, Spanish Literacy, Art Education, Music Education, Physical Education, and Independent Reading Centers. Academic Interventions Available to Students Mapleton uses a Problem Solving Team Process to ensure that students receive appropriate academic interventions. Each school employs one or more Problem Solving Teams that include parents, teachers, and administrators; the teams meet weekly to examine the progress of students at risk. Identified academic or behavior problems are matched with research based interventions. A Progress Monitoring tool and progress monitoring schedule are selected. The entire process is documented in an electronic Response to Intervention Plan. All schools have intervention support staff trained in Reading, Writing, Fluency and Target Reading Assessments and the Progress Monitoring tools for reading, writing and math. The focus is on strengthening core instruction; students who demonstrate intense needs have access to standard protocol interventions such as SpellRead, Read 180, Camelot Math Intervention, and Lindamood Bell through the Problem Solving Team process. Family Involvement Mapleton Public Schools engages parents through a variety of practices. A District Family Liaison has established a Parents in Action Group at each elementary school. The objectives of these groups are:
To integrate Hispanic families into the greater school community To identify and train parent leaders to sustain parent outreach in the community Encourage and train parents to volunteer in their child’s school To motivate and promote a culture of home reading and academic achievement To improve the partnership between home and school
The District Family Liaison position is funded from Title III and general fund. Mapleton Public Schools engages parents and families through many other opportunities: School Accountability Committees, District Accountability Committee, community dinners, The District Art Show, Science Fairs, Spelling Bees, Family Literacy and Math Nights, The Incredible Years BASIC Parent Training, Love and Logic classes and a growing number of Performing Arts experiences. Schools strive to integrate a variety of family literacy opportunities for parents throughout the year along with other events (conferences, assemblies, SAC). Title I Set Aside funds are allocated to each elementary School Wide for this specific purpose. Family math nights are also offered to provide families with the opportunity to learn math concepts together while learning about the EveryDay Math curriculum and the HomeLInks component that extends math practice into the home. District and school materials (newsletters, notices, report cards, etc) are routinely translated. In addition, translators support non-English speaking parents at conferences and school meetings. The written and verbal translations are provided by identified district staff or contracted services. These resources are paid through Title III funds. Self Assessment/Monitoring: School Support Team (SST) Process for Mapleton Public Schools Mapleton Public Schools monitors the implementation of DIP/SIP action plans through the School Support Team (SST) process. Four teams made up of central administrators, the school director/principal, the school’s instructional guide, a visiting school director/principal, two parents from the school community and a classroom teacher visit each district school each month for progress monitoring. During the monthly visits, each team visits every classroom in the school, and effectively the entire district, over a two-day period. The District Learning Services team determines the curricular focus area each month, visits the school and classrooms to look for evidence of implementation in the focus area and provides written feedback to the school staff regarding next steps for implementation and overall continuous growth. Additionally, each month during the visit, the School Support Team reviews school data provided by the school director/principal. The data is relevant to the curricular area being validated. For example, if the SST is reviewing implementation of differentiated reading practices, the team would also review individual Reading Response Journals for mastery of reading targets, PALS data, MAP reading data, reading CSAP data and reading program target mastery validation plans.

CDE Improvement Planning Template for Districts (V 2.1 -- Last updated: October 31, 2010) 26
In addition to the progress monitoring of curricular implementations and district initiatives, the School Support Teams collect feedback about needed professional development, support from Learning Services or other central departments. The data and feedback for each set of monthly SST visits is then summarized by Learning Services for the Superintendent’s Cabinet and Board of Education. The emphasis is on the trends and outliers within the system and next steps to be taken by Learning Services, school directors/principals, and/or other stakeholders. The summary is also provided to all school directors/principals at a bi-monthly Leadership Meeting. The SSTs also provide extensive feedback to schools while school teams are writing their School Improvement plans. Last spring, school teams shared their data analysis, root causes, and improvement strategies to SST teams. This fall, the 5 schools with Turnaround, Priority Improvement, or School Improvement designations followed a similar process while writing their School Improvement Plans. In summary, the Mapleton Public Schools engages in a continuous improvement cycle via a monthly system check on key instructional areas and district initiatives that provides feedback and input on action steps for school communities, central departments, and the Superintendent’s Cabinet. Root Cause Verification: Reading, Writing and Math: In the past 4 years, Mapleton Public Schools has worked to implement a guaranteed and viable curriculum to support rigorous, grade level aligned instruction for all students. New curriculum adoption has taken place in every core content area and the comprehensive implementation of each has been and continues to be an ongoing effort. While most teachers are indeed using some components of all board-adopted programs, deep implementation – including consistent pacing, use of formative assessments, differentiated grouping strategies, meaningful whole group strategies, effective independent student practice, and re-teaching components of the lessons continues to be a challenge for the teaching staff. Without the consistency and coherence of the core instructional programming within and between schools, the students will not reach their growth potential. Thus, root cause analysis of core content data yields a need to work toward consistent implementation of all components of the core curricula. Root causes have been verified using the following sources/processes:
Thorough data analysis of CSAP, Aimsweb, PALS, MAP, EDM (mid-year and end of year), Plan, Explore, ACT, Reading Assessments and Writing cold prompt compilations. Monthly SST visits of every school and classroom (See “Self Monitoring” for a description of the process). Survey data (Student, Parents and Teachers). Professional development implementation surveys and coaching reports, feedback during bi-monthly administrator meetings, monthly district PLCs (Math, Science, Reading and
Writing).

CDE Improvement Planning Template for Districts (V 2.1 -- Last updated: October 31, 2010) 27
Section IV: Action Plan(s)
This section focuses on the “plan” portion of the continuous improvement cycle. First you will identify your annual targets and the interim measures. This will be documented in the District/Consortium Goals Worksheet. Then you will move into the action plans, where you will use the action planning worksheet. District/Consortium Goals Worksheet Directions: Complete the worksheet for the priority needs identified in section III; although, all districts are encouraged to set targets for all performance indicators. Annual targets for AYP have already been determined by the state and may be viewed on the CDE website at: www.cde.state.co.us/FedPrograms/danda/aypprof.asp Safe Harbor and Matched Safe Harbor goals may be used instead of performance targets. For state accountability, districts are expected to set their own annual targets for academic achievement, academic growth, academic growth gaps and post secondary/ workforce readiness. For guidance on target setting on state accountability indicators, go to the Learning Center in SchoolView: www.schoolview.org/learningcenter.asp. Once annual targets are established, then the district/consortium must identify interim measures that will be used to monitor progress toward the annual targets at least twice during the school year. Make sure to include interim targets for disaggregated groups that were identified as needing additional attention in section III (data analysis and root cause analysis). Finally, list the major strategies that will enable the district/consortium to meet those targets. The major improvement strategies will be detailed in the action planning worksheet below. Example of an Annual Target at the Elementary Level
Measures/ Metrics 2010-11 Target 2011-12 Target
AYP R 94.23% of all students and of each disaggregated group will be PP and above OR will show a 10% reduction in percent of students scoring non-proficient.
94.23% of all students and by each disaggregated group will be PP and above OR will show a 10% reduction in percent of students scoring non-proficient.
2011-12 Mapleton Public Schools Unified Plan: Building Upon Previous Corrective Action Plans: While not meeting state expectations for academic achievement, the previous District Improvement Plans brought about increases in reading, writing, and math growth. The following Major Improvement Strategies and Action Steps build upon the previous corrective action plans. Previously, the major improvement strategies focused on the initial implementation of consistent, K-12 core curricula in reading, writing, and math. The implementations of K-6 EveryDay Math and recently the 7th-12th grade University of Chicago School Math Program complete the initial implementation across the district. Similarly, the implementation of two balanced literacy frameworks (Every Child a Reader and Every Child a Writer) completes the literacy adoption and initial implementation. While the initial implementation included training and coaching for all teachers who would teach the curricula, the 2010-2012 Unified Improvement Plan takes the initial work to a deeper level. The following Major Improvement Strategies and Action Steps outline a differentiated approach to the needed professional learning to ensure that all students are engaged in first, best instruction. In addition, this plan outlines action steps for teachers who work with students with disabilities to ensure that a menu of approved, research-based interventions is available. Lastly, detailed plans are described to address the graduation and drop-out rates throughout Mapleton School District.

CDE Improvement Planning Template for Districts (V 2.1 -- Last updated: October 31, 2010) 28
District/Consortium Goals Worksheet Annual Targets Performance
Indicators Measures/
Metrics 2010-11 2011-12 Interim Measures for
2010-11 Major Improvement
Strategies
R Mapleton Public Schools will increase the percent of students
Proficient or Advanced to 54% on the 2010-2011 CSAP Reading
Assessments. Currently 47% of students are Proficient or
Advanced.
Mapleton Public Schools will increase the percent of students
Proficient or Advanced to 60% on the 2011-12 CSAP Reading
Assessments.
NWEA MAPS Assessment
(administered 3 times during the school year: Sept., Jan. and May).
Provide differentiated professional
development (Direct, coaching, PLCs, lab
classrooms, web-based) to further develop
teachers’ and instructional leaders’ skills to deepen the
implementation of core reading instruction
(Every Child a Reader) to meet the needs of all subgroup populations.
Academic Achievement
(Status)
CSAP, CSAPA, Lectura, Escritura
M
Mapleton Public Schools will increase the percent of students Proficient or Advanced to 40 % on the 2010-2011 CSAP Math Assessments. Currently 32% of students are Proficient or Advanced.
Mapleton Public Schools will increase the percent of students Proficient or Advanced to 45 % on the 2011-12 CSAP Math Assessments.
NWEA MAPS Assessment (administered 3 times during the school year: Sept., Jan. and May). Everyday Math and Chicago Math Project curriculum-based assessments (mid-year and end-of-year assessments).
Provide differentiated professional development (Direct, coaching, PLCs, lab classrooms, web-based) to further develop teachers’ and instructional leaders’ skills to deepen the implementation of district-selected core elementary and secondary math programs to meet the needs of all subgroup populations.

CDE Improvement Planning Template for Districts (V 2.1 -- Last updated: October 31, 2010) 29
W
Mapleton Public Schools will increase the percent of students Proficient or Advanced to 40% on the 2010-11 CSAP Writing Assessments. Currently 33% of students are Proficient or Advanced.
Mapleton Public Schools will increase the percent of students Proficient or Advanced to 45% on the 2011-12 CSAP Writing Assessments.
NWEA MAPS Assessment (administered 3 times during the school year: Sept., Jan. and May). Every Child a Writer interim measures (ie cold prompts).
Provide differentiated professional development (Direct, coaching, PLCs, lab classrooms, web-based) to further develop teachers’ and instructional leaders’ skills to deepen the implementation of core writing instruction (Every Child a Writer) to meet the needs of all subgroup populations.
S NA NA NA NA

CDE Improvement Planning Template for Districts (V 2.1 -- Last updated: October 31, 2010) 30
District/Consortium Goals Worksheet (cont.)
Annual Targets Performance Indicators
Measures/ Metrics 2010-11 2011-12
Interim Measures for 2010-11
Major Improvement Strategies
R
Mapleton Public Schools will increase the number of AYP targets met to 90% on the 2010-11 CSAP Assessments. Currently 86% of the targets are met. Mapleton Public Schools will decrease the percent of sub-group unsatisfactory scores at the Middle School by 10% on the 2010-11 CSAP Assessments: Hispanic, Special Education, Free and Reduced Meals, and English Language Learners. (AMAO 3 Goal)
Mapleton Public Schools will increase the number of AYP targets met to 95% on the 2011-12 CSAP Assessments. Mapleton Public Schools will decrease the percent of sub-group unsatisfactory scores by 10% at the Middle School on the 2011-12 CSAP Assessments: Hispanic, Special Education, Free and Reduced Meals, and English Language Learners.
NWEA MAPS Assessment (administered 3 times during the school year: Sept., Jan. and May)
See reading strategy above
Academic Achievement
(Status)
AYP (Overall and for each disaggregated groups)
M
Mapleton Public Schools will increase the number of AYP targets met to 90% on the 2010-11 CSAP Assessments. Currently 86% of the targets are met. Mapleton Public Schools will decrease by 10% sub-group unsatisfactory scores at these levels: Elementary-Free and Reduced Meals Middle School- Hispanic, White, Free and Reduced Meals, ELL and Special Education High School - Special Education
Mapleton Public Schools will increase the number of AYP targets met to 95% on the 2011-12 CSAP Assessments. Mapleton Public Schools will decrease by 10% sub-group unsatisfactory scores at these levels: Elementary-Free and Reduced Meals Middle School- Hispanic, White, Free and Reduced Meals, ELL and Special Education High School - Special Education
NWEA MAPS Assessment (administered 3 times during the school year: Sept., Jan. and May) Everyday Math and Chicago Math Project curriculum-based assessments (mid-year and end-of-year assessments)
See math strategy above

CDE Improvement Planning Template for Districts (V 2.1 -- Last updated: October 31, 2010) 31
R NA
M
Mapleton Public Schools will be at or above the 53rd median growth percentile on the 2010-11 math CSAP assessments. Currently, elementary median growth is 49 and middle school median growth is 46.
Mapleton Public Schools will be at or above the 55th median growth percentile on the 2011-12 math CSAP assessments.
NWEA MAPS Assessment (administered 3 times during the school year: Sept., Jan. and May) Everyday Math and Chicago Math Project curriculum-based assessments (mid-year and end-of-year
See math strategy above
Academic Growth
Median Student Growth Percentile
W
Mapleton Public Schools will be at or above the 53rd median growth percentile on the 2010-11 math CSAP assessments. Currently, elementary median growth is 48 and middle school median growth is 47.
Mapleton Public Schools will be at or above the 55th median growth percentile on the 2011-12 math CSAP assessments.
NWEA MAPS Assessment (administered 3 times during the school year: Sept., Jan. and May) Every Child a Writer interim measures (i.e. cold prompts)
See writing strategy above
Academic Growth Gaps
Median Student Growth Percentile
R
Mapleton Public Schools will be at or above the 50th median growth percentile in reading for students with disabilities for the 2010-11 school year, as measured by CSAP. Currently, the median growth percentile for elementary students with disabilities is 45.
Mapleton Public Schools will be at or above the 55th median growth percentile in reading for students with disabilities for the 2011-12 school year, as measured by CSAP.
NWEA MAPS Assessment (administered 3 times during the school year: Sept., Jan. and May)
Implement a menu of Tier II and III standard protocol interventions to support students with identified disabilities.

CDE Improvement Planning Template for Districts (V 2.1 -- Last updated: October 31, 2010) 32
M
Mapleton Public Schools will be at or above the 50th median growth percentile in math for students with disabilities for the 2010-11 school year, as measured by CSAP. Currently, the median growth percentile for elementary students with disabilities is 44.
Mapleton Public Schools will be at or above the 55th median growth percentile in math for students with disabilities for the 2011-12 school year, as measured by CSAP.
NWEA MAPS Assessment (administered 3 times during the school year: Sept., Jan. and May) Everyday Math and Chicago Math Project curriculum-based assessments (mid-year and end-of-year assessments)
Implement a menu of Tier II and III standard protocol interventions to support students with identified disabilities.
W
Mapleton Public Schools will be at or above the 50th median growth percentile in writing for students with disabilities for the 2010-11 school year, as measured by CSAP. Currently, the median growth percentile for elementary students with disabilities is 48.
Mapleton Public Schools will be at or above the 55th median growth percentile in writing for students with disabilities for the 2011-12 school year, as measured by CSAP.
NWEA MAPS Assessment (administered 3 times during the school year: Sept., Jan. and May) Every Child a Writer interim measures (i.e. cold prompts)
See writing strategy above
Post Secondary/ Workforce Readiness
Graduation Rate
Mapleton Public Schools will post a 50% graduation rate for the 2010-2011 school year. Mapleton Public Schools will post a 52% completion rate for the 2010-2011 school year.
Mapleton Public Schools will post a 58% graduation rate for the 2011-2012 school year, and at least an 8% increase every year for five years, thereby meeting the state expectation of 80% within 5 years. Mapleton will also post an 8% increase in our completion rate, each year for five years.
Students’ accumulation of credits, as well as attendance, behavior and course grades will be analyzed at least monthly at each school. Out-of-school youth will be monitored for connections to other educational options.
Implement a comprehensive graduation pathways plan.

CDE Improvement Planning Template for Districts (V 2.1 -- Last updated: October 31, 2010) 33
Dropout Rate
Mapleton Public Schools will post a drop-out rate not greater than 5% for the 2010-2011 school year.
Mapleton Public Schools will post a drop-out rate not greater than 4.5% for the 2010-2011 school year, and at least a .5% decrease each year for five years, thereby achieving a drop-out rate of not more than 3% within five years.
Students’ accumulation of credits, as well as attendance, behavior and course grades will be analyzed at least monthly at each school.
Implement a comprehensive graduation pathways plan.
Mean ACT
Mapleton Public Schools will post a mean composite ACT score of at least 17.8 for the 2010-2011 school year.
Mapleton Public Schools will post a mean composite ACT score of at least 18.4 for the 2010-2011 school year, and at least a .6% increase each year for five years, thereby meeting the state expectation of 20 within 5 years.
PLAN and Explore data will be monitored for continual improvement.
Continue to refine implementation of curriculum and instruction – see academic plans above.
CELA (AMAO 1) NA English
Language Development & Attainment CELA (AMAO 2)
NA
CELA (AMAO 3)
Mapleton Public Schools will decrease by 10% the number of ELL students who score unsatisfactory in Reading and Math.
Mapleton Public Schools will decrease by 10% the number of ELL students who score unsatisfactory in Reading and Math.
See Reading and Math Interim Measures
See Reading and Math Strategies listed above.
Teacher Qualifications Highly Qualified
Teacher Data
100% of core content classes will be taught by teachers who meet NCLB HQ requirements.
100% of core content classes will be taught by teachers who meet NCLB HQ requirements.
ALIO System for tracking certification and HQ status.
Continue to monitor ALIO system for 100% HQ

CDE Improvement Planning Template for Districts (V 2.1 -- Last updated: October 31, 2010) 34
Action Planning Worksheet Directions: Based on your data analysis in section III, prioritize the root causes that you will address through your action plans and then match it to a major improvement strategy(s). For each major improvement strategy (e.g., implement new intervention in K-3 reading) identify the root cause(s) that the action will help to dissolve. Then indicate which accountability provision or grant opportunity it will address. In the chart, provide details on key action steps (e.g., re-evaluating supplemental reading materials, providing new professional development and coaching to school staff) necessary to implement the major improvement strategy. Details should include a description of the action steps, a general timeline, resources that will be used to implement the actions and implementation benchmarks. Implementation benchmarks provide the district/consortium with checkpoints to ensure that activities are being implemented as expected. If the district/consortium is identified for improvement/corrective action under Title I, action steps should include family/community engagement strategies and professional development (including mentoring) as they are specifically required by ESEA. Add rows in the chart, as needed. While space has been provided for three major improvement strategies, the district/consortium may add other major strategies, as needed. Major Improvement Strategy #1: Provide differentiated professional development (Direct, coaching, PLCs, lab classrooms, web-based) to further develop teachers’ and instructional leaders’ skills to deepen the implementation of core reading instruction to meet the needs of all subgroup populations. Root Cause(s) Addressed: The District has not provided developmentally appropriate support to teachers in providing all students with consistent, systematic differentiated reading instruction in their zone of proximal development. Accountability Provisions or Grant Opportunities Addressed by this Major Improvement Strategy (check all that apply):
XX State Accreditation XX Title IA Program Improvement/Corrective Action Plan XX Title IIA (2141c) XX Title III (AMAOs) Dropout Designation XX Grant: Title II Teacher Recruitment and Retention Grant (Pending) and Title I District Program Improvement Grant
(pending)
Description of Action Steps to Implement the Major Improvement Strategy Timeline Key Personnel
(optional) Resources
(Amount and Source: federal, state, and/or local)
Implementation Benchmarks
Provide a two-day day training in explicit differentiated reading instruction to all new teachers. Provide a one day training in demonstrated reading instruction to all new teachers. Include explicit ELL strategies in the reading training sessions. (Universal Strategy) Provide weekly District Mentor Coach support to ensure the appropriate implementation of reading instruction.
Summer – Fall 2011 Ongoing
National Literacy Coalition (NLC) trainers Ex. Dir. of Learning Services (LS) Dir. of Professional Development (PD) District Mentor Coaches
Title I: $14,500 Local: Director of Professional Development Salary to coordinate training sessions and supervise work of Mentor Coaches. Local: .5 Mentor Coach Salary Title II: Mentor Coach Salaries
Observation and embedded coaching support for all new teachers is ongoing throughout the year. Report generated by the coach(s) after each coaching cycle. Report will be described by school, level and program component.
Provide a one day training in administering ongoing reading assessments to1st year and other staff who have not been trained. (Universal Strategy)
Fall 2011 NLC trainers Director of Assessment Director of PD
Title I: $7,340 Initial data collection and data analysis will be completed and reviewed in Oct. 2011.

CDE Improvement Planning Template for Districts (V 2.1 -- Last updated: October 31, 2010) 35
Implement coaching support for all new teachers to ensure that teachers understand the components of effective reading instruction. (Universal Strategy)
Sept. 2011 and ongoing
NLC trainers Exec. Dir. LS Director of PD School Directors
Title I: $68,400 Local: Director of Professional Development Salary
Consultants provide an executive summary of coaching visits to the district leadership team. The district leadership team determines next steps for deeper implementation at each school.
Provide a three-day training to assure that teachers have the skills to systematically build academic language and concepts for ELL students. (Tier II Strategy)
Fall 2011 Language for Learning, Thinking and Writing Trainers New K-2 teachers ELL teachers
Local: $8,000 Coaching $20,000 Materials Title III: $10,000 PD
Embedded coaching with an ELL coach. Report generated by the coach after each cycle.
Identify and provide a secondary language development curriculum to support ELLs in grades 6-12. (Tier II Strategy).
Spring 2011 and ongoing
Program Trainers Exec. Dir. LS Dir. of PD
Local: TBD Title III: $42,000 Coaching
Use of a “Standards of Practice” document during a scheduled SST visit to 6-12 classrooms across the district.
Create podcasts of exemplary reading instruction by MPS teachers and post the podcast lesson plans that include the ELL strategies to the district intranet.
Spring 2011-ongoing
Learning Services Team
Title IA Improvement Grant (pending): $1,440
Electronic feedback form about the podcast’s influence on the viewer’s practices. Monitor hits on the website.
Purchase additional leveled text to support differentiated instruction with particular emphasis on non-fiction texts.
Ongoing throughout the year
School Directors Exec. Dir LS
State: TBD from Title I SW allocation Local: TBD from school and district general funds Grant: TBD
Continuing audits of resources available at each school through the ECAR database
Create and utilize lab classrooms to model effective reading instruction for new teachers, specifically identified or self-identified teachers (Tier II Strategy).
Spring 2011 and ongoing
School Directors Exec. Dir LS Dir. of PD District Mentor Coaches
Teacher Recruitment grant (Pending) Local: Director of Professional Development Salary Title II: $12,000 for New Teacher Lab Classroom Observations
Use of observation protocols and an implementation survey to determine impact on changes to observer’s instruction and to monitor effectiveness of the lab classroom strategy.

CDE Improvement Planning Template for Districts (V 2.1 -- Last updated: October 31, 2010) 36
Expand the professional learning communities through a summer reading institute with a focus on deeper implementation of reading, writing and second language strategies. Institute sessions will include:
- Independent Reading - Effective Center Activities - Demonstrated and Differentiated Reading - Effective use of reading assessments - Reading in the Core Contents
(Tier II Strategy).
Summer 2011 Exec. Dir LS Dir. of PD LS Team
Title IA Improvement Grant (pending): $43,590 Local: Director of Professional Development Salary Local: Stipend for PLC Lead Teachers
Evaluation of Institute sessions September SST collects evidence of refinements in instruction and structures. Participants complete an “Impact Survey”. Growth on MAPs throughout year.
Implement a 6-12 PLC specifically designed to give support to teachers in the implementation of effective secondary reading practices (Tier II Strategy).
Fall 2011 and ongoing
Exec. Dir LS Dir. of PD LS Team
TBD Local: Stipend for PLC Lead Teacher
Standards of Practice designed for secondary reading instruction and used to monitor the implementation of effective practices.
Monitor and support district expectations for implementation of differentiated reading instruction using a Standards of Practice document and MAP data.
Monthly District administrative team and School Directors (SST)
No Added Cost District School Support Teams (SST) visit every classroom every month to monitor and determine next steps and areas of focus necessary to improve student reading achievement. MAP data will be monitored 3 times per year by the SST as well.

CDE Improvement Planning Template for Districts (V 2.1 -- Last updated: October 31, 2010) 37
Major Improvement Strategy #2: Provide differentiated professional development (direct, coaching, PLCs, lab classrooms, web-based to further develop teachers’ and instructional leaders’ skills to deepen the implementation of district-selected core elementary and secondary math instruction to meet the needs of all student populations. Root Cause(s) Addressed: Lack of PreK-12 curricular alignment in math that consistently and systematically builds and maintains mathematical thinking and develops the skills students need to articulate their thinking processes. Accountability Provisions or Grant Opportunities Addressed by this Major Improvement Strategy (check all that apply):
XX State Accreditation XX Title IA Program Improvement/Corrective Action Plan XX Title IIA (2141c) XX Title III (AMAOs) Dropout Designation XX Grant: Title II Teacher Recruitment and Retention Grant (Pending) and Title I District Program Improvement Grant
(pending)
Description of Action Steps to Implement the Major Improvement Strategy Timeline Key Personnel
(optional) Resources
(Amount and Source: federal, state, and/or local)
Implementation Benchmarks
Elementary: Train new PreK-6 teachers to implement a consistent research based program at New Teacher Orientation. Provide weekly Mentor Coach support for each new teacher to ensure appropriate implementation of math resources. Link the strategies from Classroom Instruction That Works With ELLs to support academic language development in mathematics. (Universal Strategy) Provide coaching to new teachers. Provide consulting support for school instructional leaders.
August, 2011 Ongoing October, 2011 January, 2012 Ongoing
Ex. Dir. of Learning Services (LS) District Mentor Coaches Director of PD (PD) EDM certified trainers PreK-6 new teachers
Title I: $11,000 (PD) Title II: $20,000 for Teacher Stipends Title II: $187,000 for Mentor Coach Salaries Title I: $4,000 (Coaching) Local: Director of Professional Development Salary to coordinate training sessions and supervise work of Mentor Coaches. Title II: $550.00 to pay for EDM consultant
Monitor implementation with these tools: PreK-6 Standards of Practice Document District math pacing guide Student math journals will be monitored during School Support visits
Secondary: Provide a two-day training for new 7th-12th grade math teachers and administration in the effective use consistent math materials and assessment practices to inform differentiated instruction. Provide weekly Mentor Coach support for each new teacher to ensure appropriate implementation of math resources. Link the strategies from Classroom Instruction That
August, 2011 Ongoing
Ex. Director of LS Director of PD District Mentor Coaches
Local: $2,500 Local: Director of Professional Development Salary Local: Stipend for PLC Lead Teachers Title II: Mentor Coach Salaries
School administration and School Support Teams will observe 7th-12th grade math teachers implementing the UCSMP curriculum and ELL strategies and materials in their classrooms each month using the standards of practice document mentioned below.

CDE Improvement Planning Template for Districts (V 2.1 -- Last updated: October 31, 2010) 38
Works With ELLs to support academic language development in mathematics. (Universal Strategy)
Refine and implement the 7th -12th assessment plan across the district to formatively monitor teaching and learning throughout each school year. (Universal Strategy)
January, 2011 May, 2012
Ex Director of LS Director of Assessment 7th-12th grade teachers to give input.
No funds required The refined UCSMP math assessment framework will be implemented at all schools by 7th-12th grade math teachers. Analyze the results with Secondary Math PLC and School Directors
Create and utilize lab classrooms with a focus on math programs for new teachers, specifically identified and self-identified math teachers. (Tier II Strategy)
Spring 2011 and ongoing
School Directors Exec. Dir. of LS Dir. of PD District Mentor Coaches
Teacher Recruitment Grant (Pending) Title II: $12,000 for New Teacher Lab Classroom Observations
Use of observation protocols and an implementation survey to determine impact on changes to observers’ instruction, and to monitor effectiveness of the lab classroom strategy.
Expand the professional learning communities through a summer Math Institute with a focus on deeper implementation math program and emphasis on: • Embedding McRel ELL strategies • Use of applicable reading and writing strategies
with math text • Differentiation structures and strategies (Tier II Strategy)
Summer 2011 Exec. Dir. of LS Dir. of PD LS team
Title IA Improvement Grant (pending): $24,900
Evaluation of Institute sessions September SST collects evidence of refinements in instruction and structures. Participants complete an “Impact Survey”. Growth on MAPs throughout year.
Assemble a PreK-6 Math Professional Learning Community to analyze data, improve the implementation of the math program, and explore the interventions and extensions components included in this math program. (Tier II Strategy)
January, 2011- May, 2012
PreK-6 Lead Math teachers Executive Director of Learning Services
Title I Set Aside: $7,200
Communications between the PreK-6 and the 7-12 PLCs. Attendance Logs Meeting Agendas
Continue the Secondary Math PLC specifically designed to give support to secondary math teachers during the second year of the new mathematics program implementation. • Analyze spring 2011 and January 2012 mid year
Monthly from August, 2011- May, 2012
Local: TBD NSF Grant (pending)
Monitor the impact of the Secondary Math PLC through the changes in instruction via the SST and growth in MAP data.

CDE Improvement Planning Template for Districts (V 2.1 -- Last updated: October 31, 2010) 39
assessment results. • Embedded professional development to
differentiate math lessons to meet the needs of students who have math gaps in their learning.
(Tier II Strategy)
If feasible, create and implement a secondary math coaching model for secondary school/teacher support. (Tier II Strategy)
January-May 2011 August, 2011 – May 2012
TBD Math teacher-coaches will be designated. Existing coaching protocols will be adapted and utilized to monitor the change in math instruction.
Monitor and support district expectations for implementation of differentiated math instruction using a Standards of Practice document and MAP data. (Universal and Tier II Strategy)
Monthly District Administrative Team and School Directors
No funds needed District School Support Teams visit every classroom every month to monitor and determine next steps and areas of focus necessary to improve student math improvement. MAP data will be monitored 3 times per year by the SST as well.
Major Improvement Strategy #3: Provide differentiated professional development (Direct, coaching, PLCs, lab classrooms, web-based) to further develop teachers’ and instructional leaders’ skills to deepen the implementation of core writing instruction (Every Child a Writer) to meet the needs of all subgroup populations Root Cause(s) Addressed: Prior to 2010, Mapleton Public Schools did not have an articulated and differentiated PreK-12 core curricular writing framework or expectations of grade-level writing products. Accountability Provisions or Grant Opportunities Addressed by this Major Improvement Strategy (check all that apply):
XX State Accreditation XX Title IA Program Improvement/Corrective Action Plan Title IIA (2141c) XX Title III (AMAOs) Dropout Designation XX Grants: Title II Teacher Recruitment and Retention Grant (Pending) and Title I District Program Improvement Grant
(pending)

CDE Improvement Planning Template for Districts (V 2.1 -- Last updated: October 31, 2010) 40
Description of Action Steps to Implement the Major Improvement Strategy Timeline Key Personnel
(optional) Resources
(Amount and Source: federal, state, and/or local)
Implementation Benchmarks
When new teachers are developmentally ready, provide a two day training in explicit differentiated writing instruction Provide a one-day training in demonstrated writing instruction to all new teachers. Include explicit ELL strategies in the writing training sessions. (Universal Strategy) Provide weekly Mentor Coach support for each new teacher to ensure appropriate writing instruction.
Summer – Fall 2011 Ongoing
National Literacy Coalition (NLC) trainers Ex. Director of Learning Services (LS) Dir. of Professional Development (PD) District Mentor Coaches
Local: $15,000 Local: Director of Professional Development Salary Local: FTE Mentor Coach Salary Title II: Mentor Coach Salaries
Observation and embedded coaching support for all new teachers is ongoing throughout the year. Report generated by the coach(s) after each coaching cycle. Report will be described by school, level and program component.
Implement coaching support for all new teachers to ensure the effective writing instruction. (Universal Strategy)
Sept. 2011 and ongoing
NLC trainers Exec. Dir. LS Director of PD School Directors
Local: $70,000 Consultants provide an executive summary of coaching visits to the district leadership team. The district leadership team determines next steps for deeper implementation at each school.
Create and utilize lab classrooms to model effective writing strategies for new teachers, specifically identified or self-identified teachers (Tier II Strategy).
Spring 2011 and ongoing
School Directors Exec. Dir LS Dir. of PD District Mentor Coaches
Teacher Recruitment Grant (pending) Title II: $12,000 for New Teacher Lab Classroom Observations
Use of observation protocols and an implementation survey to determine impact on changes to observer’s instruction and to monitor effectiveness of the lab classroom strategy.
Expand the professional learning communities through a summer writing institute with a focus on deeper understanding and implementation of writing and ELL strategies:
- Independent Writing - Effective Center Activities - Demonstrated and Differentiated Writing - Effective use of writing materials and rubrics
Summer 2011 Exec. Dir LS Dir. of PD LS Team
Title IA Program Improvement Grant (pending): $24,900 Local: Director of Professional Development Salary Local: Stipend for PLC Lead Teachers
Evaluation of Institute sessions September SST collects evidence of refinements in instruction and structures. Participants complete an “Impact Survey”. Growth on MAPs throughout year.

CDE Improvement Planning Template for Districts (V 2.1 -- Last updated: October 31, 2010) 41
- Writing in the Core Contents (Tier II Strategy).
Implement a 6-12 PLC specifically designed to give support to teachers in the implementation of effective secondary writing practices (Tier II Strategy).
Fall 2011 and ongoing
Exec. Dir LS Dir. of PD LS Team
Local: $5,000 Standards of Practice designed for secondary writing instruction and used to monitor the implementation of effective practices.
Monitor and support district expectations for implementation of differentiated writing instruction using a Standards of Practice document and MAP data.
Monthly District administrative team and School Directors (SST)
NA District School Support Teams (SST) visit every classroom every month to monitor and determine next steps and areas of focus necessary to improve student reading achievement. MAP data will be monitored 3 times per year by the SST as well.

CDE Improvement Planning Template for Districts (V 2.1 -- Last updated: October 31, 2010) 42
Major Improvement Strategy #4: Implement a menu of Tier II and III standard protocol interventions in reading and math to support students with identified disabilities. Root Cause(s) Addressed: Students with special education needs have limited access to standard protocol interventions in reading and math. Accountability Provisions or Grant Opportunities Addressed by this Major Improvement Strategy (check all that apply):
XX State Accreditation XX Title IA Program Improvement/Corrective Action Plan Title IIA (2141c) XX Title III (AMAOs) Dropout Designation Grant: ___________________________________________________
Description of Action Steps to Implement the Major Improvement Strategy Timeline Key Personnel
(optional) Resources
(Amount and Source: federal, state, and/or local)
Implementation Benchmarks
Review the needs of students identified through the RTI process during 2010-11school year to determine a menu of appropriate Standard Protocol Interventions for reading and math.
Current - ongoing Director of Learning Services School Directors
Pending Develop a menu of Standard Protocol Interventions
Develop intervention implementation timeline to include:
• Professional development for selection of appropriate interventions for Special Education and intervention teachers
• Timeline of implementation • Professional development in selected
interventions
Spring 2011- ongoing
Learning Services Team Special Education Team
Pending Implementation timeline
Monitor fidelity of implementation of chosen interventions.
Ongoing, weekly School Directors Interventionists
Pending Implementation observation checklist specific to each intervention
Evaluate effectiveness of intervention based on student progress toward grade level benchmarks
Monthly RTI Intervention Team
Pending Aimsweb: weekly , biweekly, or monthly MAPs: 3 times per year CSAP: annually

CDE Improvement Planning Template for Districts (V 2.1 -- Last updated: October 31, 2010) 43
Major Improvement Strategy #5: Implement a comprehensive Graduation Pathways project plan Root Cause(s) Addressed: 1 - The District has not provided teachers with sufficient strategies to engage and re-engage at-risk youth. Accountability Provisions or Grant Opportunities Addressed by this Major Improvement Strategy (check all that apply):
XX State Accreditation Title IA Program Improvement/Corrective Action Plan Title IIA (2141c) Title III (AMAOs) Dropout Designation XX Grant: Colorado Graduation Pathways Program
Description of Action Steps to Implement the Major Improvement Strategy Timeline Key Personnel
(optional) Resources
(Amount and Source: federal, state, and/or local)
Implementation Benchmarks
Provide professional development to secondary teachers and administrators regarding causes and effective classroom practices to engage at-risk youth.
Spring 2011 – Spring 2012
Exec. Director of Student Support Services, School Directors
Federal grant administered by CDE.
Identify vendor Select priority schools Conduct staff training Plan for ongoing staff capacity-building Monitor staff use of engaging classroom practices.
Train teachers, Welcome Center staff and Post-secondary Options Coaches to better assist students and parents in choosing schools where they will be successful. Enhance process for comprehensive school choice for transitioning students and retrieval of out-of-school youth to ensure each student enrolls in the school best able to meet their educational needs.
Ongoing through Spring 2011
Exec. Director of Student Support Services, Welcome Center Specialist
Local resources. Revise school marketing materials Welcome Center staff visit each school to gain more complete understanding of how each school engages students Welcome Center Coordinator and School Directors meet with preschool and 8th grade teachers to disseminate information about school choices. Welcome Center staff, post-secondary coaches, and school administrators will host information sessions for parents and students regarding school choices, and will also actively seek out and counsel at-risk and out-of-school youth and their families regarding school choices.
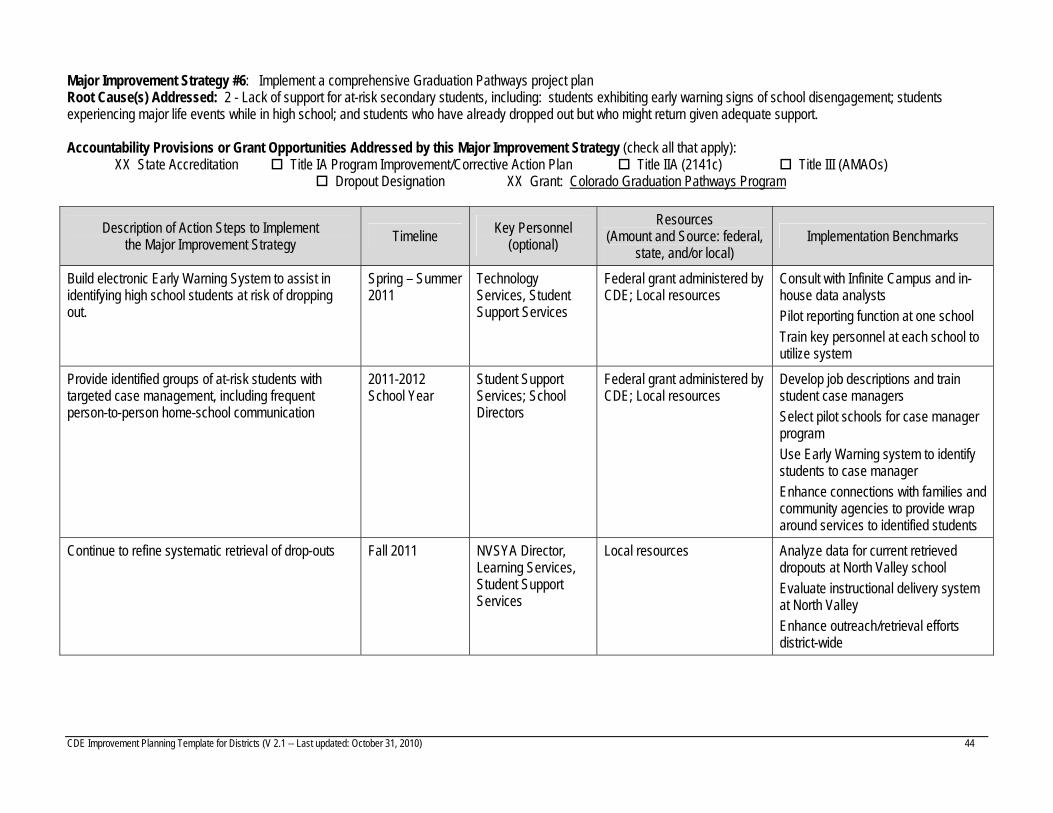
CDE Improvement Planning Template for Districts (V 2.1 -- Last updated: October 31, 2010) 44
Major Improvement Strategy #6: Implement a comprehensive Graduation Pathways project plan Root Cause(s) Addressed: 2 - Lack of support for at-risk secondary students, including: students exhibiting early warning signs of school disengagement; students experiencing major life events while in high school; and students who have already dropped out but who might return given adequate support. Accountability Provisions or Grant Opportunities Addressed by this Major Improvement Strategy (check all that apply):
XX State Accreditation Title IA Program Improvement/Corrective Action Plan Title IIA (2141c) Title III (AMAOs) Dropout Designation XX Grant: Colorado Graduation Pathways Program
Description of Action Steps to Implement the Major Improvement Strategy Timeline Key Personnel
(optional) Resources
(Amount and Source: federal, state, and/or local)
Implementation Benchmarks
Build electronic Early Warning System to assist in identifying high school students at risk of dropping out.
Spring – Summer 2011
Technology Services, Student Support Services
Federal grant administered by CDE; Local resources
Consult with Infinite Campus and in-house data analysts Pilot reporting function at one school Train key personnel at each school to utilize system
Provide identified groups of at-risk students with targeted case management, including frequent person-to-person home-school communication
2011-2012 School Year
Student Support Services; School Directors
Federal grant administered by CDE; Local resources
Develop job descriptions and train student case managers Select pilot schools for case manager program Use Early Warning system to identify students to case manager Enhance connections with families and community agencies to provide wrap around services to identified students
Continue to refine systematic retrieval of drop-outs Fall 2011 NVSYA Director, Learning Services, Student Support Services
Local resources Analyze data for current retrieved dropouts at North Valley school Evaluate instructional delivery system at North Valley Enhance outreach/retrieval efforts district-wide

CDE Improvement Planning Template for Districts (V 2.1 -- Last updated: October 31, 2010) 45
Major Improvement Strategy #7: Implement a comprehensive Graduation Pathways project plan Root Cause(s) Addressed: 3 - Insufficient support for students transitioning between levels of schooling (8th to 9th; secondary to post-secondary). Accountability Provisions or Grant Opportunities Addressed by this Major Improvement Strategy (check all that apply):
XX State Accreditation Title IA Program Improvement/Corrective Action Plan Title IIA (2141c) Title III (AMAOs) Dropout Designation XX Grant: Colorado Graduation Pathways Program
Description of Action Steps to Implement the Major Improvement Strategy Timeline Key Personnel
(optional) Resources
(Amount and Source: federal, state, and/or local)
Implementation Benchmarks
Pilot summer “bridge” and mentoring program for entering high school freshmen.
Spring – summer 2011
Director(s) of identified schools; Pathways grant coordinator
Federal grant administered by CDE; Local resources
Identify project coordinator Identify curricular program, dates, and location for bridge program Execute and evaluate program
Refine systems for sharing information regarding students transitioning levels of schooling.
Spring 2011 Student Support Services; District Records Department; School Directors
Local resources Identify key variables about which to document and share information; and a vehicle for information sharing Sending schools collect and organize relevant student information Receiving schools develop procedures to ensure student information is used by teachers and other staff
Maintain and enhance post-secondary coaching program when feasible.
Spring 2011- Spring 2012
Student Support Services
Local resources; yet-to-be-determined grant resources
Identify funding source to continue post-secondary coaching for all secondary students Ensure all secondary students have an ICAP constructed with parent involvement. Assist undocumented students with post secondary options such as ASCENT
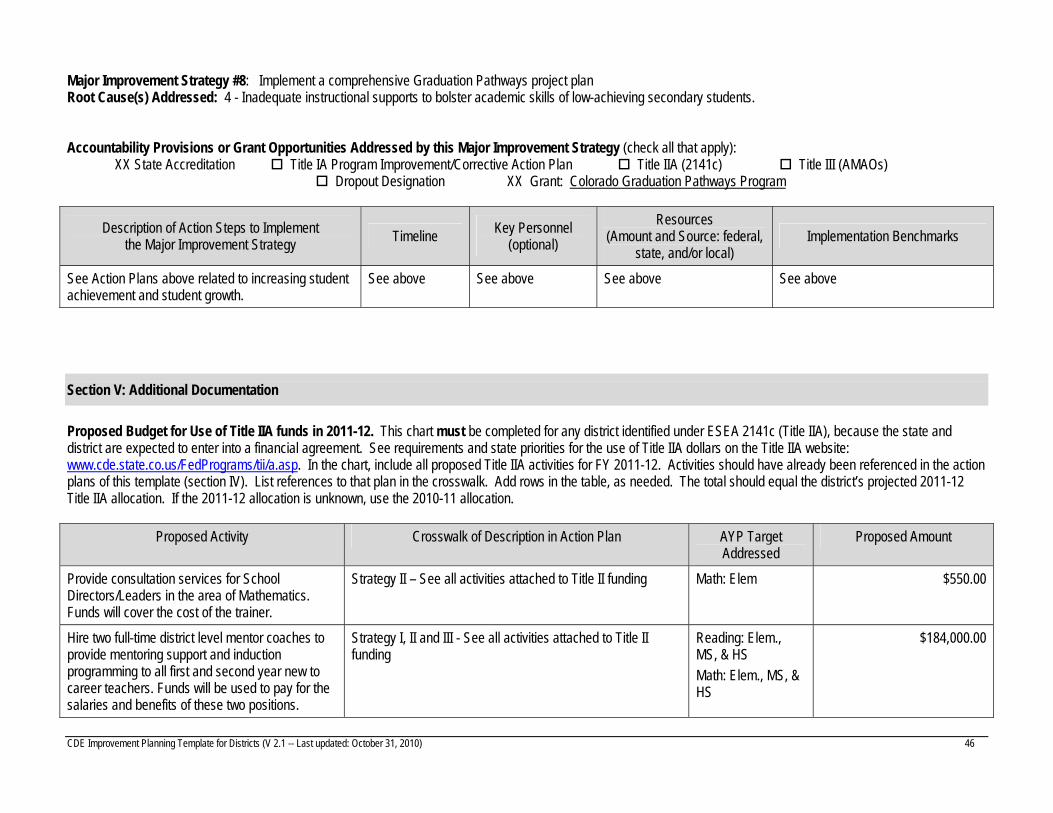
CDE Improvement Planning Template for Districts (V 2.1 -- Last updated: October 31, 2010) 46
Major Improvement Strategy #8: Implement a comprehensive Graduation Pathways project plan Root Cause(s) Addressed: 4 - Inadequate instructional supports to bolster academic skills of low-achieving secondary students. Accountability Provisions or Grant Opportunities Addressed by this Major Improvement Strategy (check all that apply):
XX State Accreditation Title IA Program Improvement/Corrective Action Plan Title IIA (2141c) Title III (AMAOs) Dropout Designation XX Grant: Colorado Graduation Pathways Program
Description of Action Steps to Implement the Major Improvement Strategy Timeline Key Personnel
(optional) Resources
(Amount and Source: federal, state, and/or local)
Implementation Benchmarks
See Action Plans above related to increasing student achievement and student growth.
See above See above See above See above
Section V: Additional Documentation
Proposed Budget for Use of Title IIA funds in 2011-12. This chart must be completed for any district identified under ESEA 2141c (Title IIA), because the state and district are expected to enter into a financial agreement. See requirements and state priorities for the use of Title IIA dollars on the Title IIA website: www.cde.state.co.us/FedPrograms/tii/a.asp. In the chart, include all proposed Title IIA activities for FY 2011-12. Activities should have already been referenced in the action plans of this template (section IV). List references to that plan in the crosswalk. Add rows in the table, as needed. The total should equal the district’s projected 2011-12 Title IIA allocation. If the 2011-12 allocation is unknown, use the 2010-11 allocation.
Proposed Activity Crosswalk of Description in Action Plan AYP Target Addressed
Proposed Amount
Provide consultation services for School Directors/Leaders in the area of Mathematics. Funds will cover the cost of the trainer.
Strategy II – See all activities attached to Title II funding Math: Elem $550.00
Hire two full-time district level mentor coaches to provide mentoring support and induction programming to all first and second year new to career teachers. Funds will be used to pay for the salaries and benefits of these two positions.
Strategy I, II and III - See all activities attached to Title II funding
Reading: Elem., MS, & HS Math: Elem., MS, & HS
$184,000.00

CDE Improvement Planning Template for Districts (V 2.1 -- Last updated: October 31, 2010) 47
Coordinate and implement mentoring support and induction programming for all newly hired school directors and assistant school directors. Funds will provide stipends to three veteran school directors to conduct this work.
Strategy II, and IV – See all activities attached to Title II funding
Math: Elem., MS, & HS
$ 10,000.00
Host a district level three-day new teacher orientation prior to the beginning of the teacher work year to welcome and acquaint all newly hired teachers to the district. Funds will provide stipends for teachers to attend.
Strategy II - See all activities attached to Title II funding Reading: Elem., MS, & HS
$ 20,000.00
Release first year teachers to observe in veteran teachers classrooms as part of the induction program. District Mentor Coaches will accompany teachers on these visits. Funds will be used to cover the costs (salary and benefits) of substitutes needed.
Strategy I, II and III - See all activities attached to Title II funding
Reading: Elem., MS, & HS Math: Elem., MS, & HS
$ 12,000.000
Purchase professional books and supplies to support the teacher and school director induction programs.
Not represented in UIP None $7,519.00
Conduct a review of the current teacher and administrator evaluation systems to determine needed changes and/or updates to recommend to the Superintendent. Stipends will be provided to the teachers and leaders who participate in this work.
Not represented in the UIP, but aligned with SB 191 None $8,600.00
Purchase needed supplies and materials for the work sessions held to review and update the teacher and administrator evaluation systems.
Not represented in UIP, but aligned with SB 191 None $2,000.00
Provide professional development opportunities to two private schools in the Mapleton community. These schools are Assumption Catholic School and A Child’s Touch.
Not represented in UIP None $1,050.00
Total (The total should equal the district’s project 2011-12 Title IIA allocation. If unknown, use the 2010-11 allocation.) $245,719.00

CDE Improvement Planning Template for Districts (V 2.1 -- Last updated: October 31, 2010)
Appendix A
CDE Improvement Planning Template for Districts (V 2.1 -- Last updated: October 31, 2010)

CDE Improvement Planning Template for Districts (V 2.1 -- Last updated: October 31, 2010)

CDE Improvement Planning Template for Districts (V 2.1 -- Last updated: October 31, 2010)

CDE Improvement Planning Template for Districts (V 2.1 -- Last updated: October 31, 2010)