cdc science ambassador workshop lesson plan was developed by teachers attending the science...
TRANSCRIPT
Masters of Disaster
Developed by
Mary Loveless West Carteret High School
Morehead City, NC
Jessica Bronson
Taylor Middle School Millbrae, CA
This lesson plan was developed by teachers attending the Science Ambassador Workshop. The Science Ambassador Workshop is a career workforce training for math and science teachers. The workshop is a Career Paths to Public Health activity in the Division of Scientific Education and Professional Development, Center for Surveillance, Epidemiology, and Laboratory Services, Office of Public Health Scientific Services, Centers for Disease Control and Prevention.
CDC Science Ambassador Workshop 2014 Lesson Plan
Acknowledgements This lesson plan was developed by teachers in consultation with subject matter experts from the Division of Emergency Operations, Office of Public Health Preparedness and Response, Centers for Disease Control and Prevention:
Jacqueline Burkholder, PhD
Lead Epidemiologist Anna Khan, MPH
Lieutenant, USPHS Public Health Scientist
Chelsea Williams, MPH Public Health Scientist
Scientific and editorial review was provided by Ralph Cordell, PhD, and Kelly Cordeira, MPH, from Career Paths to Public Health, Division of Scientific Education and Professional Development, Center for Surveillance, Epidemiology, and Laboratory Services, Office of Public Health Scientific Services, Centers for Disease Control and Prevention. Suggested citation Centers for Disease Control and Prevention (CDC). Science Ambassador Workshop— Masters of Disaster. Atlanta, GA: US Department of Health and Human Services, CDC; 2014. Available at: http://wwwdev.cdc.gov/scienceambassador/lesson-plans/index.html. Contact Information Please send questions and comments to [email protected].
Disclaimers This lesson plan is in the public domain and may be used without restriction.
Citation as to source, however, is appreciated.
Links to nonfederal organizations are provided solely as a service to our users. These links do not constitute an endorsement of these organizations nor their programs by the Centers for
Disease Control and Prevention (CDC) or the federal government, and none should be inferred. CDC is not responsible for the content contained at these sites. URL addresses listed
were current as of the date of publication.
Use of trade names and commercial sources is for identification only and does not imply endorsement by the Division of Scientific Education and Professional Development, Center for Surveillance, Epidemiology, and Laboratory Services, Centers for Disease Control and
Prevention, the Public Health Service, or the U.S. Department of Health and Human Services.
The findings and conclusions in this Science Ambassador Workshop lesson plan are those of the authors and do not necessarily represent the official position of the Centers for Disease
Control and Prevention (CDC).
Contents Summary ..................................................................................................................................................... 1 Learning Outcomes ..................................................................................................................................... 1 Total Duration ............................................................................................................................................. 1 Procedures ................................................................................................................................................... 2
Day 1: Case Study (45 minutes) .............................................................................................................. 2 Preparation ............................................................................................................................................ 2 Materials ............................................................................................................................................... 2 Online Resources .................................................................................................................................. 2 Activity ................................................................................................................................................. 2
Day 2: Disaster Response — Scenario (45 minutes) ............................................................................... 3 Preparation ............................................................................................................................................ 3 Materials ............................................................................................................................................... 3 Online Resources .................................................................................................................................. 3 Activity ................................................................................................................................................. 3
Extensions ................................................................................................................................................... 4 Extension 1: Shelter Outbreak (30 min) — Day 3 .................................................................................. 4
Preparation ............................................................................................................................................ 4 Materials ............................................................................................................................................... 4 Activity ................................................................................................................................................. 4
Conclusion .................................................................................................................................................. 5 Assessments ................................................................................................................................................ 5 Educational Standards ................................................................................................................................. 6 Appendices: Supplementary Documents .................................................................................................... 8
Appendix 1A: Case Study, Worksheet 1 ................................................................................................. 9 Appendix 1B: Case Study, Answer Key, Worksheet 1 ......................................................................... 12 Appendix 2A: Managing the Response, Class Set Information Cards .................................................. 15 Appendix 2B: Managing the Response, Worksheet 2 ........................................................................... 16 Appendix 2C: Managing the Response, Answer Key, Worksheet 2 ..................................................... 18 Appendix 3A: Assessment 1 .................................................................................................................. 20 Appendix 3B: Assessment 1, Rubric ..................................................................................................... 21 Appendix 4A: Extension 1, Shelter Outbreak Scenario ........................................................................ 22 Appendix 4B: Extension 1, Shelter Outbreak Laboratory Sample ........................................................ 25 Appendix 4C: Extension 1, Shelter Outbreak Pathogen Identification Chart ....................................... 26 Appendix 4D: Extension 1, Shelter Outbreak, Answer Key ................................................................. 30
1
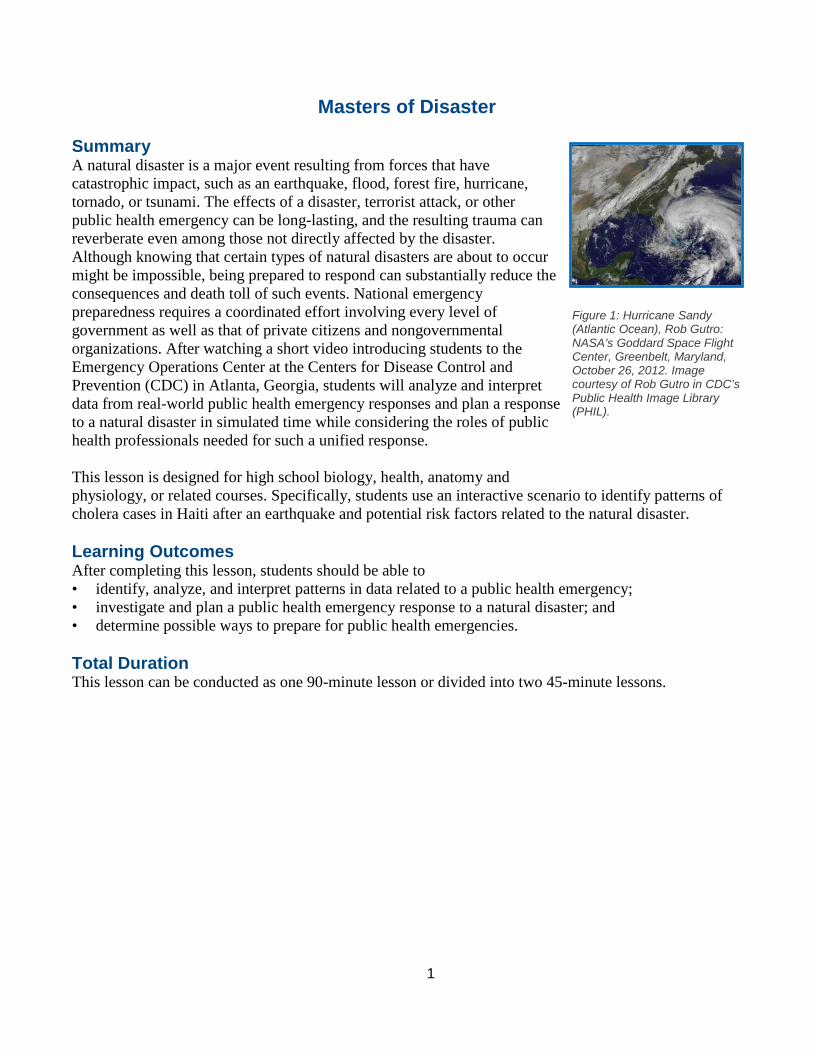
Figure 1: Hurricane Sandy (Atlantic Ocean), Rob Gutro: NASA’s Goddard Space Flight Center, Greenbelt, Maryland, October 26, 2012. Image courtesy of Rob Gutro in CDC’s Public Health Image Library (PHIL).
Masters of Disaster Summary A natural disaster is a major event resulting from forces that have catastrophic impact, such as an earthquake, flood, forest fire, hurricane, tornado, or tsunami. The effects of a disaster, terrorist attack, or other public health emergency can be long-lasting, and the resulting trauma can reverberate even among those not directly affected by the disaster. Although knowing that certain types of natural disasters are about to occur might be impossible, being prepared to respond can substantially reduce the consequences and death toll of such events. National emergency preparedness requires a coordinated effort involving every level of government as well as that of private citizens and nongovernmental organizations. After watching a short video introducing students to the Emergency Operations Center at the Centers for Disease Control and Prevention (CDC) in Atlanta, Georgia, students will analyze and interpret data from real-world public health emergency responses and plan a response to a natural disaster in simulated time while considering the roles of public health professionals needed for such a unified response. This lesson is designed for high school biology, health, anatomy and physiology, or related courses. Specifically, students use an interactive scenario to identify patterns of cholera cases in Haiti after an earthquake and potential risk factors related to the natural disaster. Learning Outcomes After completing this lesson, students should be able to • identify, analyze, and interpret patterns in data related to a public health emergency; • investigate and plan a public health emergency response to a natural disaster; and • determine possible ways to prepare for public health emergencies. Total Duration This lesson can be conducted as one 90-minute lesson or divided into two 45-minute lessons.
2
Procedures Day 1: Case Study (45 minutes) Preparation Before Day 1, • Preview Video 1: Behind the Scenes: Emergency Operations Materials • Worksheet 1: Case Study (Appendix 1) — 1 copy per student
Description: Students will work in pairs to analyze data and information provided online for the Haiti earthquake and cholera response.
• Computers and Internet Access — 1 per pair of students. (This activity can be completed with handouts of maps and data if Internet access is unavailable.)
Online Resources • Video 1: Behind the Scenes: Emergency Operations
URL: https://www.youtube.com/watch?v=1VEyeGoQacY Description: This video provides an overview of emergency operations at CDC and the types of emergencies to which the staff respond. The video was filmed during the 2009 H1N1 pandemic.
• Website 1: Cholera Information URL: http://www.cdc.gov/cholera/index.html Description: This website provides information about cholera, including descriptions, prevention, diagnosis, and current events.
• Website 2: Cholera Cases in Haiti Interactive Map URL: http://new.paho.org/hq/images/Atlas_IHR/CholeraHispaniola/atlas.html Description: This interactive map indicates cholera cases in Haiti across an extensive time line.
• Website 3: River Map of Haiti URL: http://www.mapsofworld.com/haiti/river-map.html Description: This map displays the major rivers throughout Haiti.
• Website 4: Earthquake Intensity Map URL: http://earthquake.usgs.gov/earthquakes/shakemap/global/shake/2010rja6/ or http://reliefweb.int/sites/reliefweb.int/files/resources/14B4F1787D609223C12576AB00284343-map.pdf Description: This map reveals the intensity of the 2010 Haiti earthquake by location.
Activity 1. Show Video 1: Behind the Scenes: Emergency Operations to your class. Follow the video with a
class discussion about what types of public health emergencies exist, what actions are needed during a public health emergency, and who might be involved.
2. Handout Worksheet 1: Case Study (Appendix 1). Students will visit different websites and answer questions pertaining to maps and data provided.
3
Day 2: Disaster Response — Scenario (45 minutes) Preparation Before Day 2, • Make a class set of information cards (Appendix 2A). • Make photocopies of Worksheet 2: Managing a Response (Appendix 2B). Materials • Class Set: Information Cards (Appendix 2A)
Description: Provide the class set of information cards to the students as they ask questions during the simulation.
• Worksheet 2: Managing a Response (Appendix 2B) Description: Students will work in small groups to plan an emergency response to a scenario.
Online Resources • Website 1: Emergency Preparedness and Response
Link: http://emergency.cdc.gov/ Description: This website provides additional information about public health preparedness and responses to emergencies.
Activity 1. Organize students into small groups. Each group or each student will receive a copy of Worksheet 2:
Managing a Response (Appendix 2B) to complete throughout the activity. Explain to students that they are part of a public health response to a natural disaster. Students will complete Part 1 of the worksheet on the basis of the initial information provided on the worksheet.
2. As groups decide on important items of information that they need to know, they will raise their hand and ask a question. Depending on the question, give students the information card that most closely addresses that concern. After each group has received a card, they will answer a question on the worksheet regarding preparedness for responses. Each group should ask 3 questions and receive an information card for each one.
3. Conclude the lesson with a class discussion regarding preparedness for natural disasters that occur in the area in which they live or discuss possible public health careers in which responding to natural disasters might be involved.
4. Have students turn in the completed worksheets and information cards.
4
Extensions Extension 1: Shelter Outbreak (30 min) — Day 3 Preparation • Use as a Day 3 activity. Note: Assessment 1 can be given before or after this extension. Materials • Worksheet 3: Managing a Response — Extension Activity (Appendix 4A) — 1 per student
Description: Students will work in small groups to respond to an illness outbreak in 2 emergency shelters.
• Handout: Laboratory Sample (Appendix 4B) — 1 per student team Description: Picture of the pathogen identified by a laboratory sample for students to use with Worksheet 3.
• Handout: Examples of Pathogens (Appendix 4C) — 1 per student team Description: Chart with information regarding multiple illnesses for students to use with Worksheet 3.
• Graph Paper (or access to Microsoft Excel®) Activity 1. Ask the students to read the scenario about a shelter outbreak and answer questions on Worksheet 3:
Managing a Response — Extension Activity (Appendix 4A). Students will create a data table and graph the information as a line chart.
5
Conclusion At the end of this lesson, students should have general awareness of how to coordinate a basic response to a public health disaster. Students use a scenario to learn strategies to identify, analyze, and interpret patterns in data related to a public health emergency event. Students learn how to apply and tailor these strategies to investigate and plan a public health emergency response to a natural disaster. Assessments • Assessment 1: (Appendix 3)
Learning Outcome(s) Assessed: • identify, analyze, and interpret patterns in data related to a public health emergency; • investigate and plan a public health emergency response to a natural disaster; and • determine possible ways to prepare for public health emergencies. Description: This open-ended question can be added to address the learning outcomes of students at the completion of the lesson or unit. The students are asked to justify their answers to demonstrate their ability to investigate and plan a response to a natural disaster from a public health standpoint through their ability to think critically about planning and preparedness, their planned response, and their data gathering activities.
6
Educational Standards In this lesson, the following CDC Epidemiology and Public Health Science (EPHS) Core Competencies for High School Students1, Next Generation Science Standards* (NGSS) Science & Engineering Practices2, and NGSS Cross-cutting Concepts3 are addressed: HS-EPHS2-3. Use models (e.g., mathematical models, figures) based on empirical evidence to identify patterns of health and disease in order to characterize a public health problem.
NGSS Key Science & Engineering Practice2
Analyzing and Interpreting Data Analyze data using tools, technologies, and/or models (e.g., computational, mathematical) in order to make valid and reliable scientific claims or determine an optimal design solution.
NGSS Key Crosscutting Concept3 Cause and Effect Empirical evidence is needed to identify patterns.
HS-EPHS2-4. Use patterns in empirical evidence to formulate hypotheses.
NGSS Key Science & Engineering Practice2
Asking Questions & Defining Problems Ask questions that arise from careful observation of phenomena, or unexpected results, to clarify and/or seek additional information, that arise from examining models or a theory, to clarify and/or seek additional information and relationships, to determine relationships, including quantitative relationships, between independent and dependent variables, and to clarify and refine a model, an explanation, or an engineering problem.
NGSS Key Crosscutting Concept3 Patterns Empirical evidence is needed to identify patterns.
HS-EPHS4-2. Use a targeted health promotion and communication approach (taking into consideration scientific knowledge, the organization of systems and their patterns of performance, prioritized criteria, and tradeoff considerations) to design intervention strategies.
NGSS Key Science & Engineering Practice2
Engaging in argument from evidence Evaluate competing design solutions to a real–world problem based on scientific ideas and principles, empirical evidence, and/or logical arguments regarding relevant factors (economic, societal, ethical considerations)
NGSS Key Crosscutting Concept3 Cause and Effect Cause and effect relationships can be suggested and predicted for complex natural and human designed systems by examining what is known about smaller scale mechanisms within the system
* NGSS is a registered trademark of Achieve. Neither Achieve nor the lead states and partners that developed the Next Generation Science Standards was involved in the production of, and does not endorse, this product.
7
1 Centers for Disease Control and Prevention (CDC). Science Ambassador Workshop—Epidemiology and Public Health Science: Core Competencies for high school students. Atlanta, GA: US Department of Health and Human Services, CDC; 2015. Not currently available for public use.
2 NGSS Lead States. Next Generation Science Standards: For States, By States (Appendix F–Science and Engineering Practices). Achieve, Inc. on behalf of the twenty-six states and partners that collaborated on the NGSS. 2013. Available at: http://www.nextgenscience.org/sites/ngss/files/Appendix%20F%20%20Science%20and%20Engineering%20Practices%20in%20the%20NGSS%20-%20FINAL%20060513.pdf
3NGSS Lead States. Next Generation Science Standards: For States, By States (Appendix G–Crosscutting Concepts). Achieve, Inc. on behalf of the twenty-six states and partners that collaborated on the NGSS. 2013. Available at: http://www.nextgenscience.org/sites/ngss/files/Appendix%20G%20-%20Crosscutting%20Concepts%20FINAL%20edited%204.10.13.pdf.

8
Appendices: Supplementary Documents
9
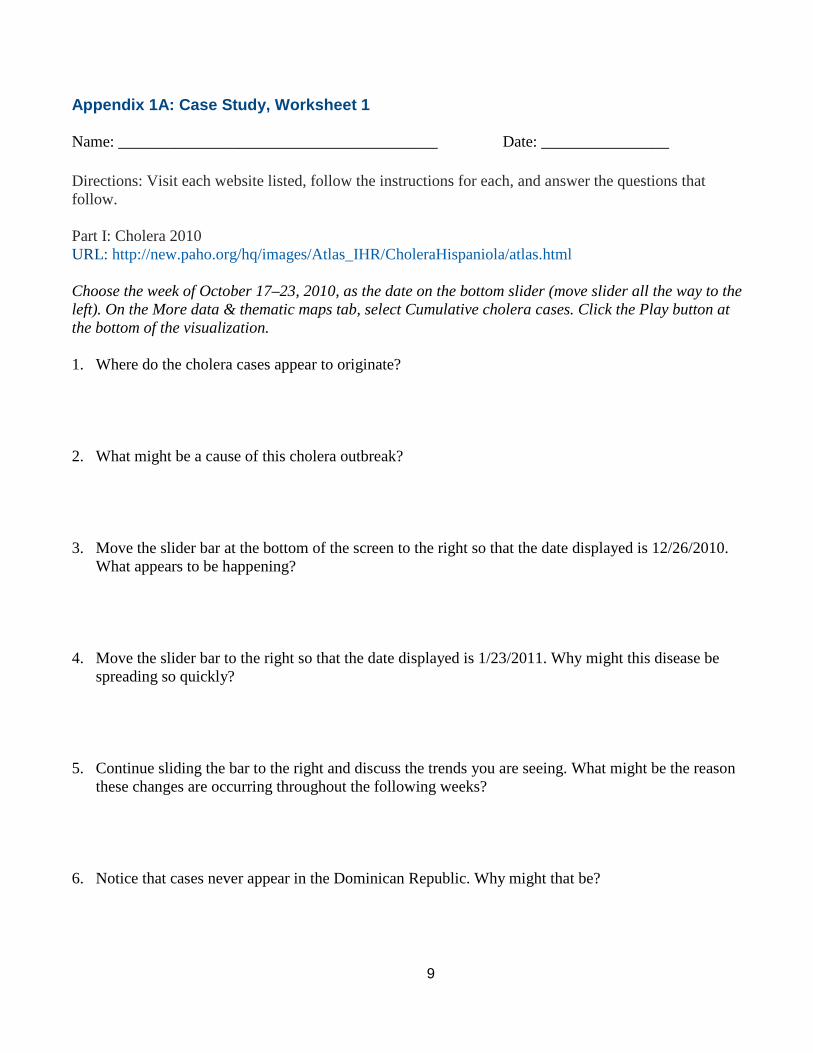
Appendix 1A: Case Study, Worksheet 1 Name: ________________________________________ Date: ________________ Directions: Visit each website listed, follow the instructions for each, and answer the questions that follow. Part I: Cholera 2010 URL: http://new.paho.org/hq/images/Atlas_IHR/CholeraHispaniola/atlas.html Choose the week of October 17–23, 2010, as the date on the bottom slider (move slider all the way to the left). On the More data & thematic maps tab, select Cumulative cholera cases. Click the Play button at the bottom of the visualization. 1. Where do the cholera cases appear to originate? 2. What might be a cause of this cholera outbreak? 3. Move the slider bar at the bottom of the screen to the right so that the date displayed is 12/26/2010.
What appears to be happening? 4. Move the slider bar to the right so that the date displayed is 1/23/2011. Why might this disease be
spreading so quickly? 5. Continue sliding the bar to the right and discuss the trends you are seeing. What might be the reason
these changes are occurring throughout the following weeks? 6. Notice that cases never appear in the Dominican Republic. Why might that be?
10
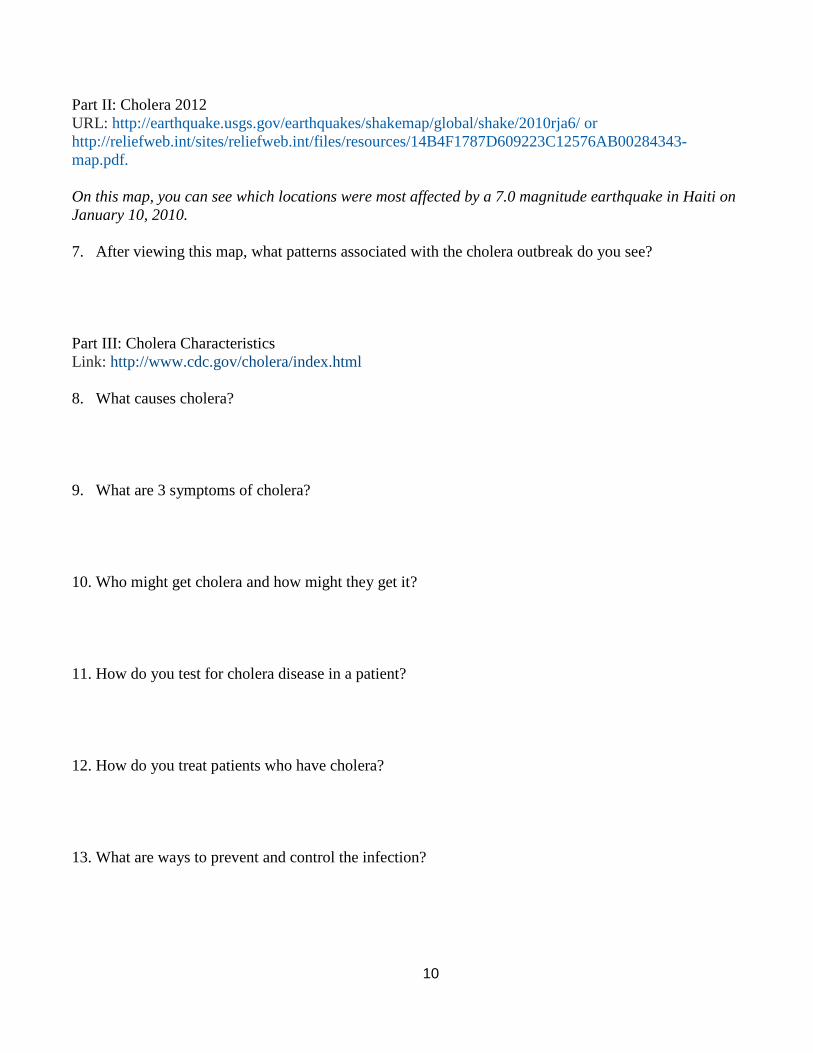
Part II: Cholera 2012 URL: http://earthquake.usgs.gov/earthquakes/shakemap/global/shake/2010rja6/ or http://reliefweb.int/sites/reliefweb.int/files/resources/14B4F1787D609223C12576AB00284343-map.pdf. On this map, you can see which locations were most affected by a 7.0 magnitude earthquake in Haiti on January 10, 2010. 7. After viewing this map, what patterns associated with the cholera outbreak do you see? Part III: Cholera Characteristics Link: http://www.cdc.gov/cholera/index.html 8. What causes cholera? 9. What are 3 symptoms of cholera? 10. Who might get cholera and how might they get it? 11. How do you test for cholera disease in a patient? 12. How do you treat patients who have cholera? 13. What are ways to prevent and control the infection?
11
Part IV: Haiti River Map Link: http://www.mapsofworld.com/haiti/river-map.html 14. Why might this map be important in identifying the source of the cholera infections? 15. This outbreak has not been completely contained. What are some recommendations that you might
have for the health ministry in Haiti to continue fighting this problem and for preventing future outbreaks?
12
Appendix 1B: Case Study, Answer Key, Worksheet 1 Name: Answer Key Date: ________________ Directions: Visit each website provided, follow the instructions, and answer the questions that follow. Part I: Cholera 2010 Link: http://www.bt.cdc.gov/situationawareness/haiticholera/Flash/bt/atlas.html Choose the week of October 17–23, 2010, as the date on the bottom slider (move slider all the way to the left). On the More data & thematic maps tab, select Cumulative cholera cases. Click the Play button at the bottom of the visualization. 1. Where do the cholera cases appear to originate? Answer: Artibonite Department of Haiti. 2. What might be a cause of this cholera outbreak? Answer: Answers will vary. During an epidemic, the source of cholera infection is usually the feces
of an infected person that contaminates water or food. The disease can spread rapidly in areas with inadequate treatment of sewage and drinking water.
3. Move the slider bar at the bottom of the screen to the right so that the date displayed is 12/26/2010.
What appears to be happening? Answer: Cholera is spreading throughout Haiti. 4. Move the slider bar to the right so that the date displayed is 1/23/2011. Why might this disease be
spreading so quickly? Answer: Answers will vary. The disease can spread rapidly in areas with inadequate treatment of
sewage and drinking water. 5. Continue sliding the bar to the right and discuss the trends that you are seeing. What might be the
reason these changes are occurring throughout the following weeks? Answer: The number of cases of cholera increased. The majority of cases were located near Port-au-
Prince and the Artibonite Department. 6. Notice that cases never appear in the Dominican Republic. Why might that be? Answer: Answers will vary, but might include geographic location, border protection, natural or
human-made disaster, or difference in living conditions.
13
Part II: Haiti Earthquake of 2012 URLs: http://earthquake.usgs.gov/earthquakes/shakemap/global/shake/2010rja6/ or http://reliefweb.int/sites/reliefweb.int/files/resources/14B4F1787D609223C12576AB00284343-map.pdf. On this map you can see which locations were most affected by a 7.0 magnitude earthquake in Haiti on January 10, 2010. 7. After viewing this map, what correlations with the cholera outbreak do you see?
Answer: The earthquake epicenter was near Port-au-Prince, where the majority of cholera cases were located. However, correlating the cholera incidence with the epicenter of the earthquake might be a stretch. The population was impoverished before the earthquake and used the river as their primary water source. The outbreak was caused by the importation of cholera from an infected responder from the United Nations, and logically, responders were more commonly located in the areas hardest hit by the earthquake.
Part III: Cholera Characteristics Link: http://www.cdc.gov/cholera/index.html 8. What causes cholera?
Answer: Cholera is caused by Vibrio cholerae bacteria. A person can contract cholera by drinking water or eating food contaminated with V. cholerae.
9. What are 3 symptoms of cholera?
Answer: Cholera is often mild or without symptoms, but it can be severe. Approximately 1 in 20 (5%) infected persons will have severe disease characterized by profuse watery diarrhea, vomiting, and leg cramps. Among these patients, rapid body fluid loss leads to dehydration and shock. Without treatment, death can occur within hours.
10. Who might get cholera and how might they get it?
Answer: Persons living in places with inadequate water treatment or sanitation and inadequate personal hygiene are at a greater risk for cholera. During an epidemic, the source of the contamination is usually the feces of an infected person that has contaminated the water or food of others.
11. How do you test for cholera disease in a patient?
Answer: To test for cholera, doctors must take a stool sample or a rectal swab and send it to a laboratory to test for V. cholerae.
12. How do you treat patients who have cholera?
Answer: Cholera can be simply and successfully treated by immediate replacement of the fluid and salts lost through diarrhea. Antibiotics shorten the course and diminish the severity of illness, but they are not as important as rehydration.
14
13. What are ways to prevent and control the infection? Answer: Drink only treated water, wash hands with soap and warm water, and prevent water and food contamination. Note: There is a Cholera vaccine already developed in India since 2009 and it is awaiting WHO approval for use in other countries. Shanchol has ~58% vaccine efficacy. This vaccine was not available for use outside of India at the time of the Haiti earthquake and it could have saved many lives. You may want to add the possibility of using a Cholera vaccine as a preventive measure.
Part IV: Haiti River Map Link: http://www.mapsofworld.com/haiti/river-map.html 17. Why might this map be important in identifying the source of the cholera infections?
Answer: This map indicates the flow of river water throughout Haiti, which serves as a primary drinking water source. Because an epidemic is likely caused by contaminated water, persons living in places with the river as their primary drinking source might be subject to inadequate water treatment and sanitation and inadequate personal hygiene and therefore are at a greater risk for cholera.
18. This outbreak has not been completely contained. What are some recommendations that you might
have for the health department in Haiti to continue fighting this problem and for preventing future outbreaks? Answer: Answers will vary. Answers might include clean water for drinking and providing education to local persons regarding cholera transmission and personal hygiene and sanitation techniques.
15
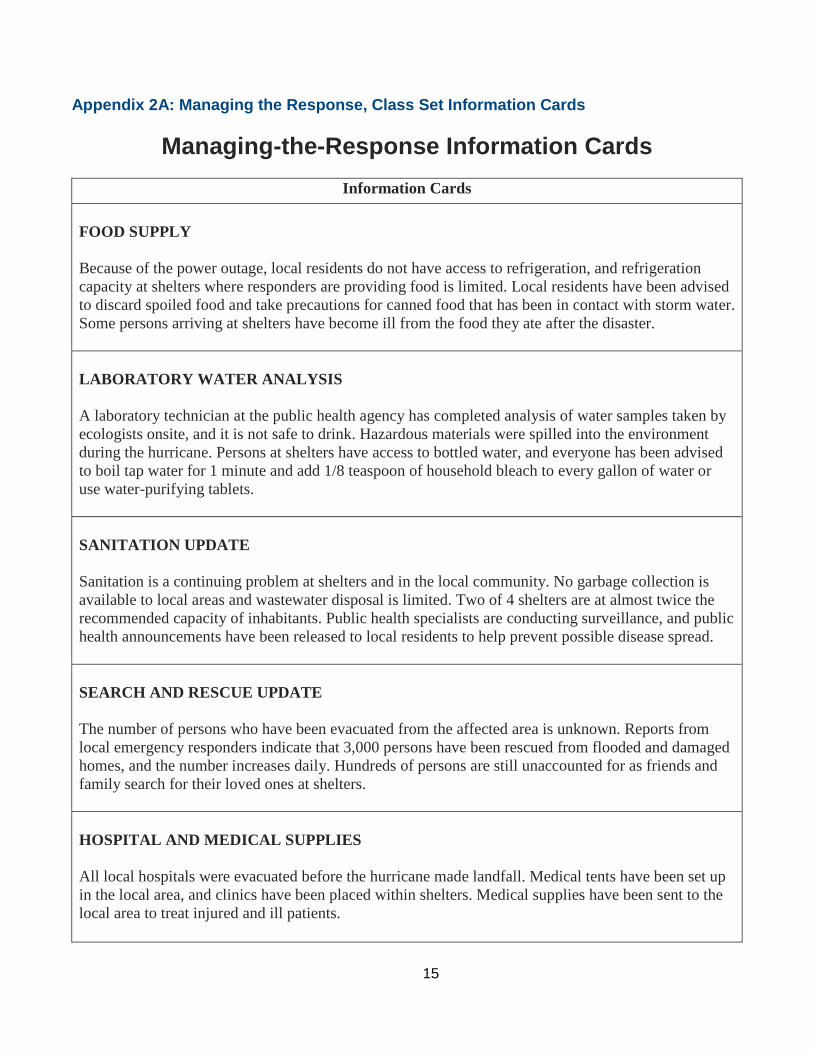
Appendix 2A: Managing the Response, Class Set Information Cards
Managing-the-Response Information Cards
Information Cards FOOD SUPPLY Because of the power outage, local residents do not have access to refrigeration, and refrigeration capacity at shelters where responders are providing food is limited. Local residents have been advised to discard spoiled food and take precautions for canned food that has been in contact with storm water. Some persons arriving at shelters have become ill from the food they ate after the disaster. LABORATORY WATER ANALYSIS A laboratory technician at the public health agency has completed analysis of water samples taken by ecologists onsite, and it is not safe to drink. Hazardous materials were spilled into the environment during the hurricane. Persons at shelters have access to bottled water, and everyone has been advised to boil tap water for 1 minute and add 1/8 teaspoon of household bleach to every gallon of water or use water-purifying tablets. SANITATION UPDATE Sanitation is a continuing problem at shelters and in the local community. No garbage collection is available to local areas and wastewater disposal is limited. Two of 4 shelters are at almost twice the recommended capacity of inhabitants. Public health specialists are conducting surveillance, and public health announcements have been released to local residents to help prevent possible disease spread. SEARCH AND RESCUE UPDATE The number of persons who have been evacuated from the affected area is unknown. Reports from local emergency responders indicate that 3,000 persons have been rescued from flooded and damaged homes, and the number increases daily. Hundreds of persons are still unaccounted for as friends and family search for their loved ones at shelters. HOSPITAL AND MEDICAL SUPPLIES All local hospitals were evacuated before the hurricane made landfall. Medical tents have been set up in the local area, and clinics have been placed within shelters. Medical supplies have been sent to the local area to treat injured and ill patients.
16
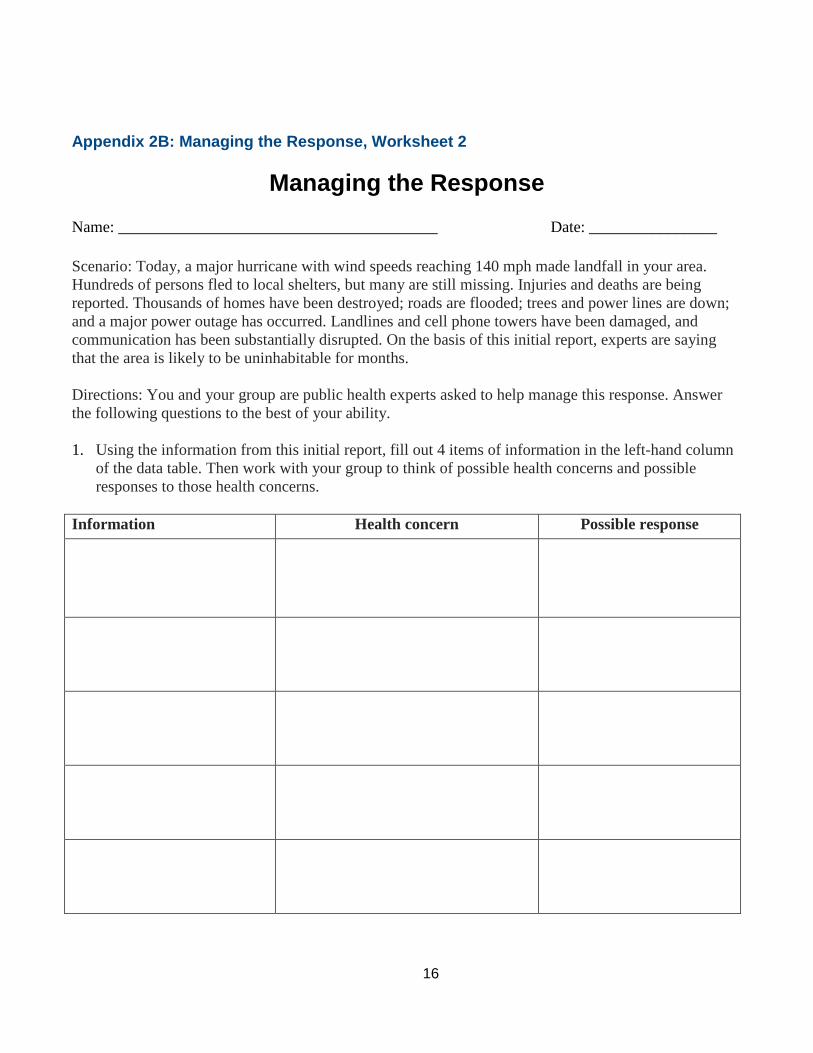
Appendix 2B: Managing the Response, Worksheet 2
Managing the Response Name: ________________________________________ Date: ________________ Scenario: Today, a major hurricane with wind speeds reaching 140 mph made landfall in your area. Hundreds of persons fled to local shelters, but many are still missing. Injuries and deaths are being reported. Thousands of homes have been destroyed; roads are flooded; trees and power lines are down; and a major power outage has occurred. Landlines and cell phone towers have been damaged, and communication has been substantially disrupted. On the basis of this initial report, experts are saying that the area is likely to be uninhabitable for months. Directions: You and your group are public health experts asked to help manage this response. Answer the following questions to the best of your ability. 1. Using the information from this initial report, fill out 4 items of information in the left-hand column
of the data table. Then work with your group to think of possible health concerns and possible responses to those health concerns.
Information Health concern Possible response
17
2. If you were a public health expert involved in this response, what would be your first steps? 3. Decide with your group upon one question that you believe is most important in helping you make
response decisions. Ask your teacher that question.
a. What did you find out? b. How does this information improve your ability to respond to this disaster?
4. Decide with your group upon a second question that you believe is also important in helping you make response decisions. Ask your teacher that question.
a. What did you find out? b. How does this information improve your ability to respond to this disaster?
5. Decide with your group upon a third question that you believe is also important in helping you make response decisions. Ask your teacher that question.
a. What did you find out? b. How does this information improve your ability to respond to this disaster?
6. What are three actions that you would recommend to help residents prepare for a natural disaster? Note: this is not limited to Haiti.
18
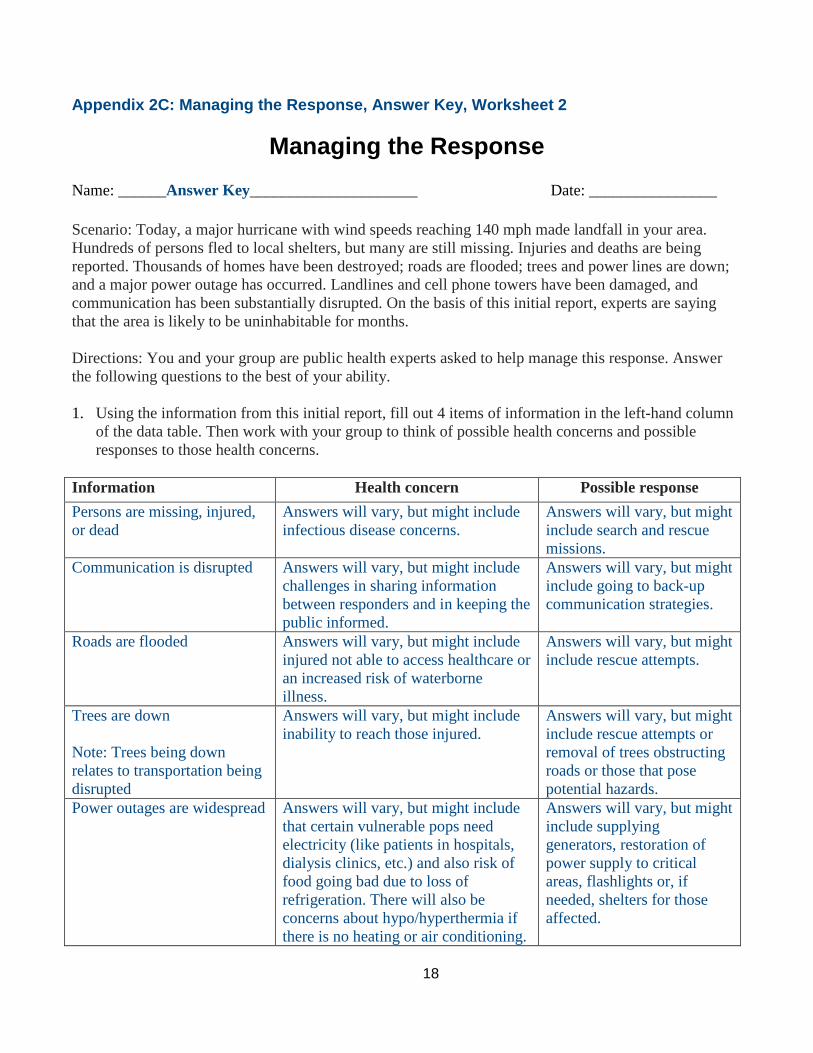
Appendix 2C: Managing the Response, Answer Key, Worksheet 2
Managing the Response Name: ______Answer Key_____________________ Date: ________________ Scenario: Today, a major hurricane with wind speeds reaching 140 mph made landfall in your area. Hundreds of persons fled to local shelters, but many are still missing. Injuries and deaths are being reported. Thousands of homes have been destroyed; roads are flooded; trees and power lines are down; and a major power outage has occurred. Landlines and cell phone towers have been damaged, and communication has been substantially disrupted. On the basis of this initial report, experts are saying that the area is likely to be uninhabitable for months. Directions: You and your group are public health experts asked to help manage this response. Answer the following questions to the best of your ability. 1. Using the information from this initial report, fill out 4 items of information in the left-hand column
of the data table. Then work with your group to think of possible health concerns and possible responses to those health concerns.
Information Health concern Possible response Persons are missing, injured, or dead
Answers will vary, but might include infectious disease concerns.
Answers will vary, but might include search and rescue missions.
Communication is disrupted
Answers will vary, but might include challenges in sharing information between responders and in keeping the public informed.
Answers will vary, but might include going to back-up communication strategies.
Roads are flooded
Answers will vary, but might include injured not able to access healthcare or an increased risk of waterborne illness.
Answers will vary, but might include rescue attempts.
Trees are down Note: Trees being down relates to transportation being disrupted
Answers will vary, but might include inability to reach those injured.
Answers will vary, but might include rescue attempts or removal of trees obstructing roads or those that pose potential hazards.
Power outages are widespread
Answers will vary, but might include that certain vulnerable pops need electricity (like patients in hospitals, dialysis clinics, etc.) and also risk of food going bad due to loss of refrigeration. There will also be concerns about hypo/hyperthermia if there is no heating or air conditioning.
Answers will vary, but might include supplying generators, restoration of power supply to critical areas, flashlights or, if needed, shelters for those affected.

19
2. If you were a public health expert involved in this response, what would be your first steps? Answer: Answers will vary. Answers might include gathering information, setting up and providing resources to shelters, providing health care for injured and sick evacuees, and analyzing environmental quality.
3. Decide with your group upon one question that you believe is most important in helping you make
response decisions. Ask your teacher that question.
a. What did you find out? Answer: Information from card — Food supply, laboratory water analysis, sanitation update, search and rescue update, and hospital and medical supplies. b. How does this information improve your ability to respond to this disaster? Answer: Answers will vary. Students will describe how the information has changed their response.
4. Decide with your group upon a second question that you believe is also important in helping you make response decisions. Ask your teacher that question.
a. What did you find out? Answer: Information from card — Food supply, laboratory water analysis, sanitation update, search and rescue update, and hospital and medical supplies. b. How does this information improve your ability to respond to this disaster? Answer: Answers will vary. Students will describe how the information has changed their response.
5. Decide with your group upon a third question that you believe is also important in helping you make response decisions. Ask your teacher that question.
a. What did you find out? Answer: Information from card — Food supply, laboratory water analysis, sanitation update, search and rescue update, and hospital and medical supplies. b. How does this information improve your ability to respond to this disaster? Answer: Answers will vary. Students will describe how the information has changed their response.
6. What are three actions that you would recommend to help residents prepare for a natural disaster? Note: this is not limited to Haiti. Answer: Answers will vary. Answers might include making an emergency supply kit, making a family disaster plan, keeping yourself informed, or evacuating when the authorities tell you to do so.
20
Appendix 3A: Assessment 1
Master-of-Disaster Assessment Name: _______________________________________ Date: ________________ Directions: Answer the question to the best of your ability in essay format. Scenario: A volcano erupted, causing a landslide into a major city. What is the most important piece of information that you need to know to determine how to respond to this disaster from a public health standpoint? Justify your answer. (Make sure to include public health concerns, public health responses, and possible preparedness for the future.)
21
Appendix 3B: Assessment 1, Rubric
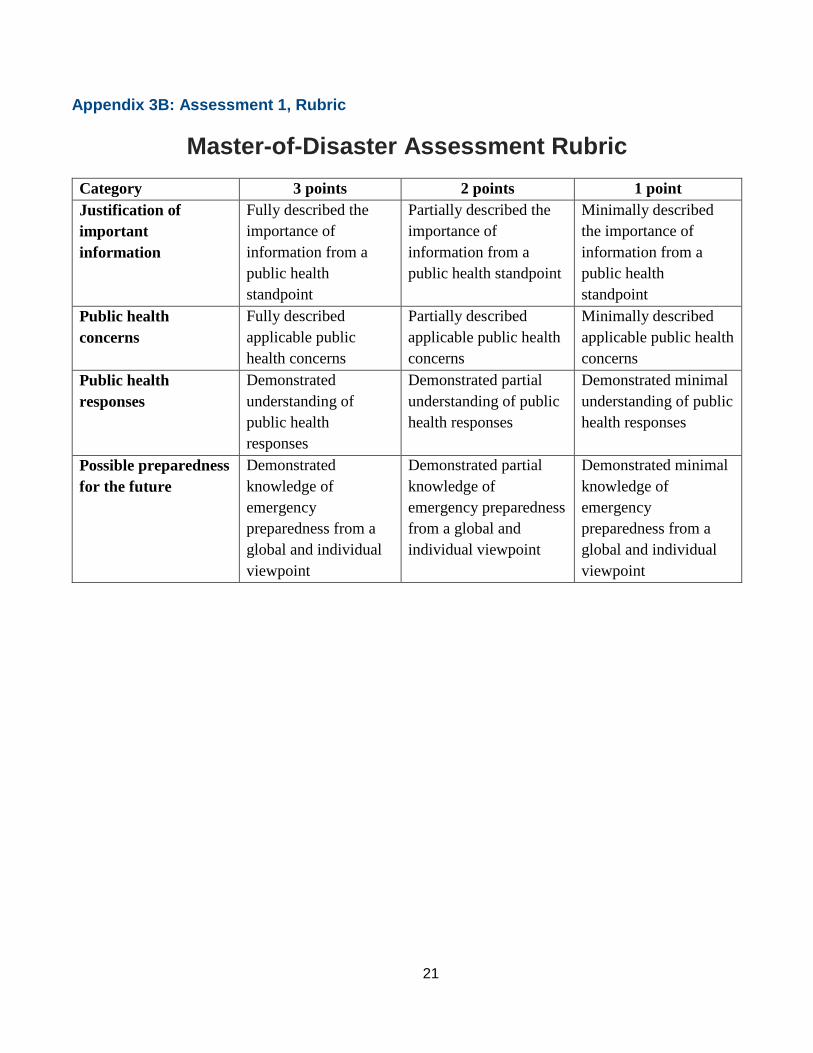
Master-of-Disaster Assessment Rubric Category 3 points 2 points 1 point Justification of important information
Fully described the importance of information from a public health standpoint
Partially described the importance of information from a public health standpoint
Minimally described the importance of information from a public health standpoint
Public health concerns
Fully described applicable public health concerns
Partially described applicable public health concerns
Minimally described applicable public health concerns
Public health responses
Demonstrated understanding of public health responses
Demonstrated partial understanding of public health responses
Demonstrated minimal understanding of public health responses
Possible preparedness for the future
Demonstrated knowledge of emergency preparedness from a global and individual viewpoint
Demonstrated partial knowledge of emergency preparedness from a global and individual viewpoint
Demonstrated minimal knowledge of emergency preparedness from a global and individual viewpoint
22
Appendix 4A: Extension 1, Shelter Outbreak Scenario
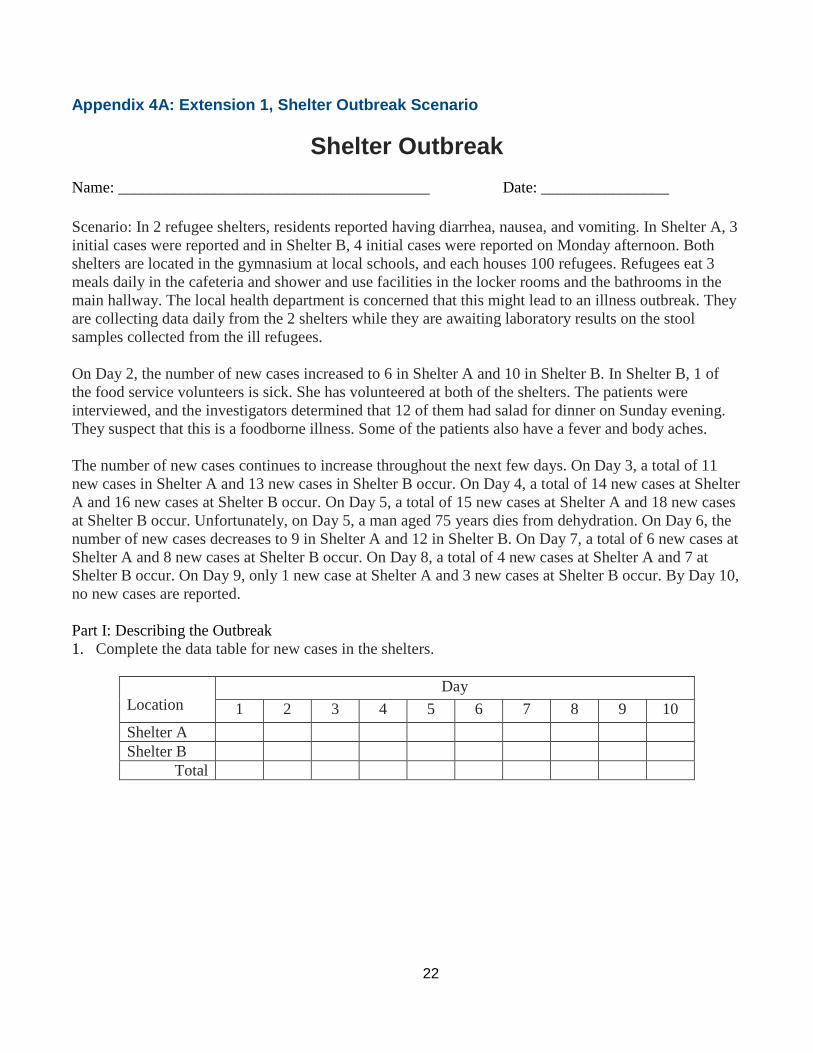
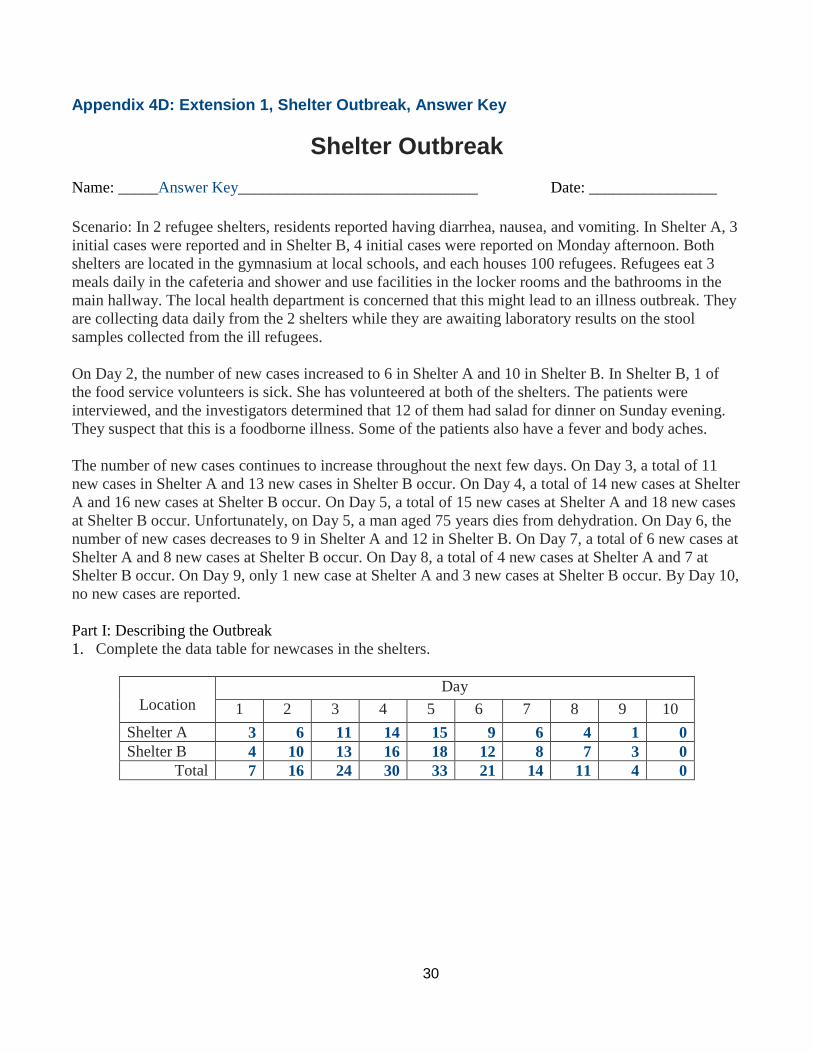
Shelter Outbreak Name: _______________________________________ Date: ________________ Scenario: In 2 refugee shelters, residents reported having diarrhea, nausea, and vomiting. In Shelter A, 3 initial cases were reported and in Shelter B, 4 initial cases were reported on Monday afternoon. Both shelters are located in the gymnasium at local schools, and each houses 100 refugees. Refugees eat 3 meals daily in the cafeteria and shower and use facilities in the locker rooms and the bathrooms in the main hallway. The local health department is concerned that this might lead to an illness outbreak. They are collecting data daily from the 2 shelters while they are awaiting laboratory results on the stool samples collected from the ill refugees. On Day 2, the number of new cases increased to 6 in Shelter A and 10 in Shelter B. In Shelter B, 1 of the food service volunteers is sick. She has volunteered at both of the shelters. The patients were interviewed, and the investigators determined that 12 of them had salad for dinner on Sunday evening. They suspect that this is a foodborne illness. Some of the patients also have a fever and body aches. The number of new cases continues to increase throughout the next few days. On Day 3, a total of 11 new cases in Shelter A and 13 new cases in Shelter B occur. On Day 4, a total of 14 new cases at Shelter A and 16 new cases at Shelter B occur. On Day 5, a total of 15 new cases at Shelter A and 18 new cases at Shelter B occur. Unfortunately, on Day 5, a man aged 75 years dies from dehydration. On Day 6, the number of new cases decreases to 9 in Shelter A and 12 in Shelter B. On Day 7, a total of 6 new cases at Shelter A and 8 new cases at Shelter B occur. On Day 8, a total of 4 new cases at Shelter A and 7 at Shelter B occur. On Day 9, only 1 new case at Shelter A and 3 new cases at Shelter B occur. By Day 10, no new cases are reported. Part I: Describing the Outbreak 1. Complete the data table for new cases in the shelters.
Location
Day 1 2 3 4 5 6 7 8 9 10
Shelter A Shelter B
Total
23
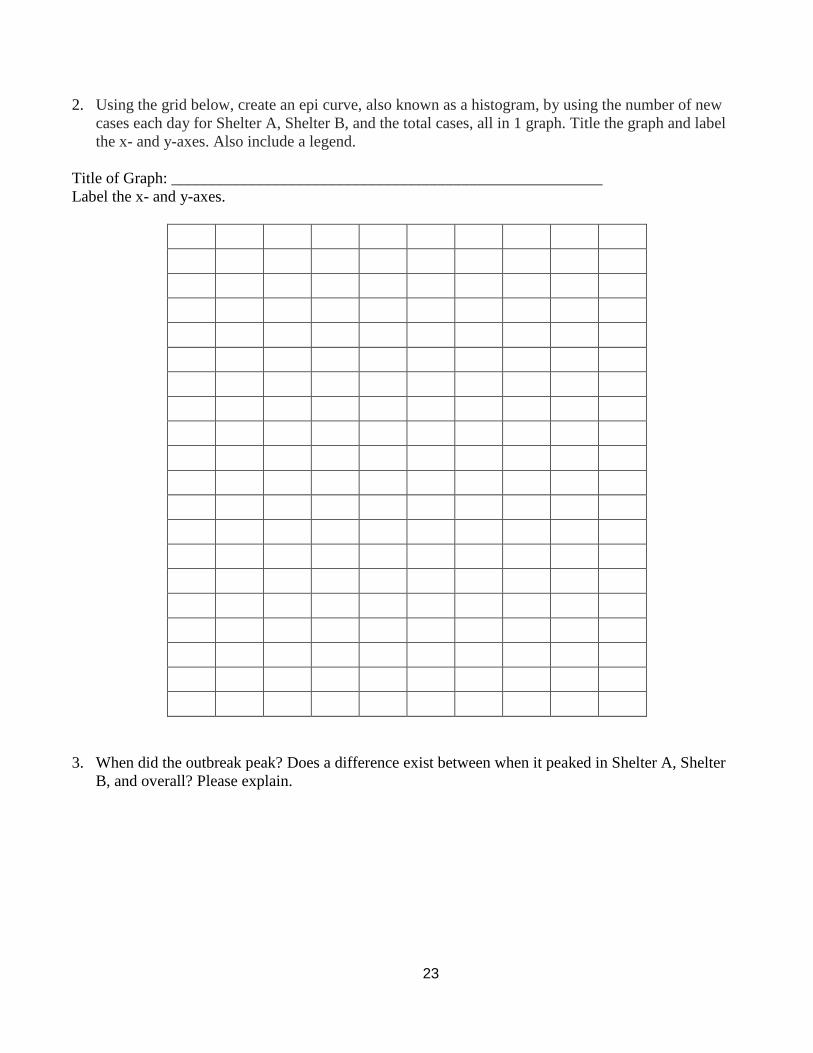
2. Using the grid below, create an epi curve, also known as a histogram, by using the number of new cases each day for Shelter A, Shelter B, and the total cases, all in 1 graph. Title the graph and label the x- and y-axes. Also include a legend.
Title of Graph: ______________________________________________________ Label the x- and y-axes.
3. When did the outbreak peak? Does a difference exist between when it peaked in Shelter A, Shelter
B, and overall? Please explain.
24
Ask your teacher for the photograph that was sent from the laboratory after stool samples were tested.
4. On the basis of the laboratory sample and pathogen information chart provided to you, what do you think caused the illness? Please explain your answer.
5. What was the transmission mode for this pathogen? 6. Hypothesize the origin of the outbreak for this scenario. 7. How was the illness being spread through the shelters? Part II: Controlling the Outbreak 8. What control measures would you have put in place? 9. When do you think emergency control measures were put in place during the event on which this
scenario is based? Please explain your answer.
25
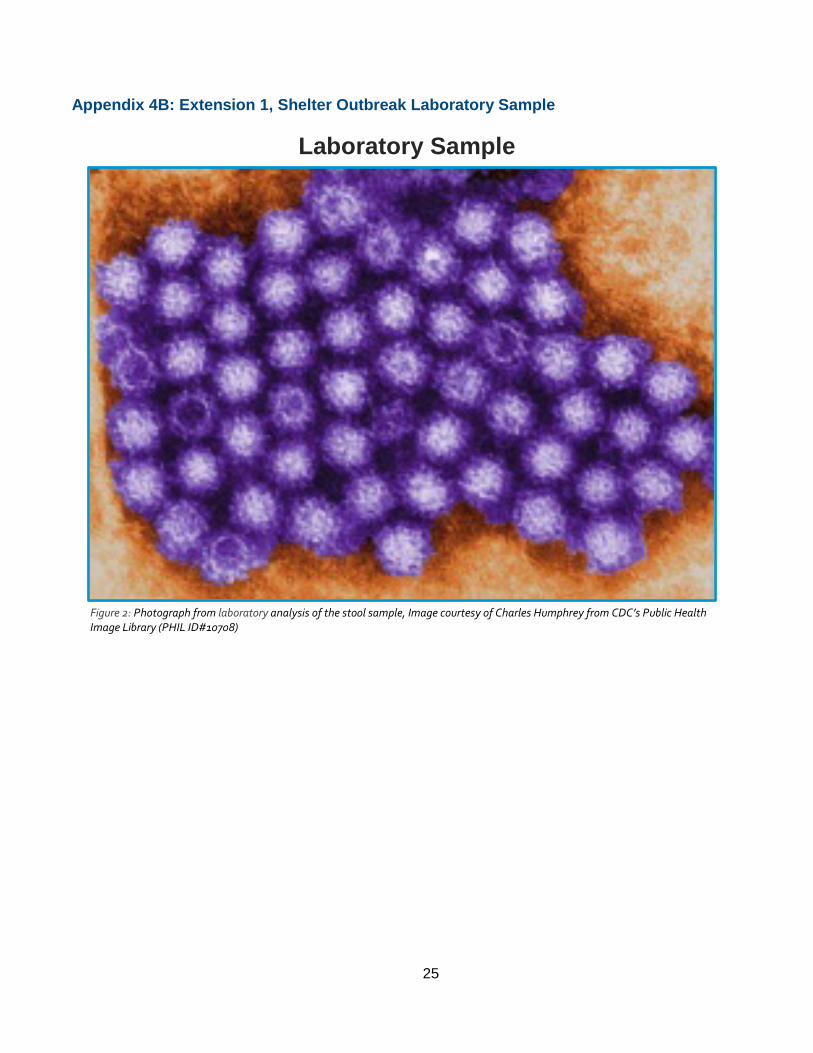
Appendix 4B: Extension 1, Shelter Outbreak Laboratory Sample
Laboratory Sample
Figure 2: Photograph from laboratory analysis of the stool sample, Image courtesy of Charles Humphrey from CDC’s Public Health Image Library (PHIL ID#10708)
26
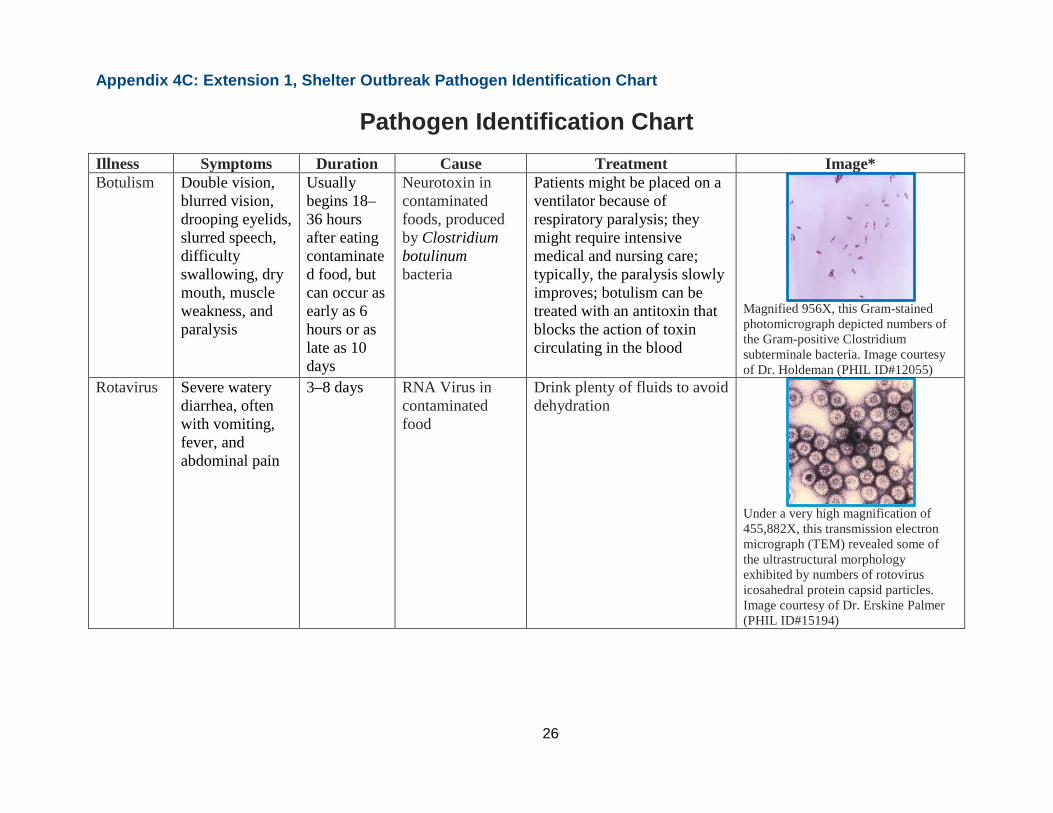
Appendix 4C: Extension 1, Shelter Outbreak Pathogen Identification Chart
Pathogen Identification Chart Illness Symptoms Duration Cause Treatment Image* Botulism Double vision,
blurred vision, drooping eyelids, slurred speech, difficulty swallowing, dry mouth, muscle weakness, and paralysis
Usually begins 18–36 hours after eating contaminated food, but can occur as early as 6 hours or as late as 10 days
Neurotoxin in contaminated foods, produced by Clostridium botulinum bacteria
Patients might be placed on a ventilator because of respiratory paralysis; they might require intensive medical and nursing care; typically, the paralysis slowly improves; botulism can be treated with an antitoxin that blocks the action of toxin circulating in the blood
Magnified 956X, this Gram-stained photomicrograph depicted numbers of the Gram-positive Clostridium subterminale bacteria. Image courtesy of Dr. Holdeman (PHIL ID#12055)
Rotavirus Severe watery diarrhea, often with vomiting, fever, and abdominal pain
3–8 days RNA Virus in contaminated food
Drink plenty of fluids to avoid dehydration
Under a very high magnification of 455,882X, this transmission electron micrograph (TEM) revealed some of the ultrastructural morphology exhibited by numbers of rotovirus icosahedral protein capsid particles. Image courtesy of Dr. Erskine Palmer (PHIL ID#15194)
27
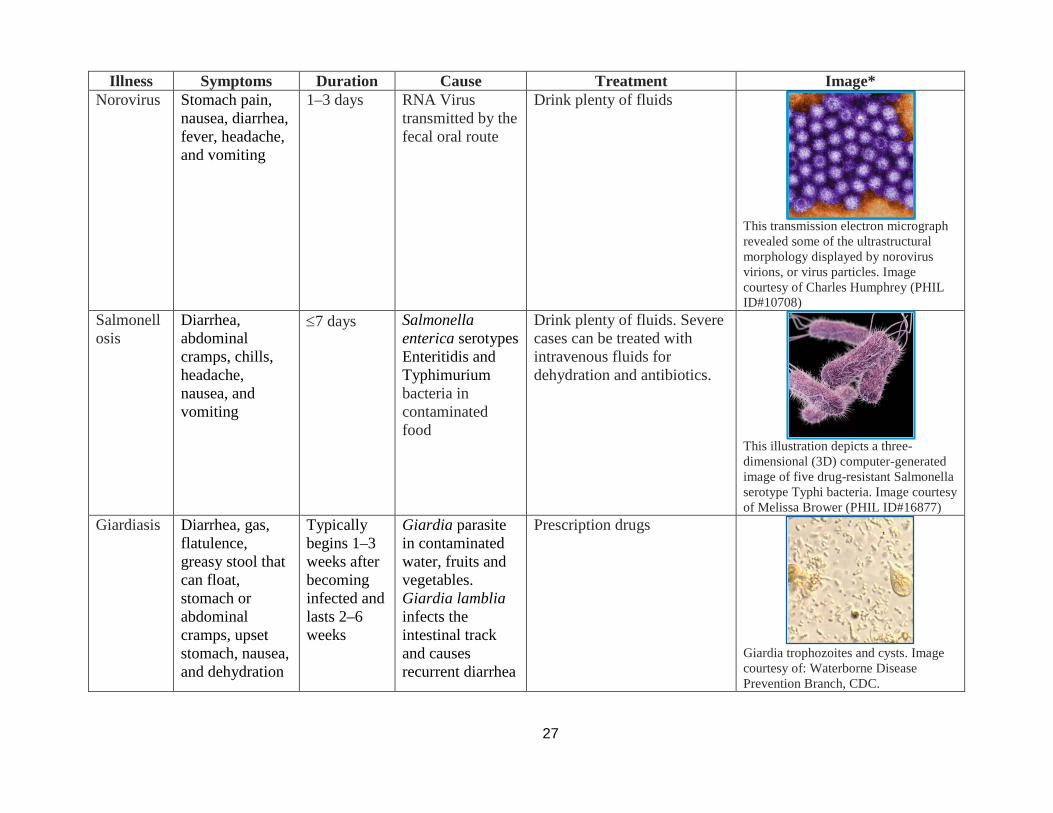
Illness Symptoms Duration Cause Treatment Image* Norovirus Stomach pain,
nausea, diarrhea, fever, headache, and vomiting
1–3 days RNA Virus transmitted by the fecal oral route
Drink plenty of fluids
This transmission electron micrograph revealed some of the ultrastructural morphology displayed by norovirus virions, or virus particles. Image courtesy of Charles Humphrey (PHIL ID#10708)
Salmonellosis
Diarrhea, abdominal cramps, chills, headache, nausea, and vomiting
≤7 days Salmonella enterica serotypes Enteritidis and Typhimurium bacteria in contaminated food
Drink plenty of fluids. Severe cases can be treated with intravenous fluids for dehydration and antibiotics.
This illustration depicts a three-dimensional (3D) computer-generated image of five drug-resistant Salmonella serotype Typhi bacteria. Image courtesy of Melissa Brower (PHIL ID#16877)
Giardiasis Diarrhea, gas, flatulence, greasy stool that can float, stomach or abdominal cramps, upset stomach, nausea, and dehydration
Typically begins 1–3 weeks after becoming infected and lasts 2–6 weeks
Giardia parasite in contaminated water, fruits and vegetables. Giardia lamblia infects the intestinal track and causes recurrent diarrhea
Prescription drugs
Giardia trophozoites and cysts. Image courtesy of: Waterborne Disease Prevention Branch, CDC.

28
Illness Symptoms Duration Cause Treatment Image* Cholera Diarrhea, nausea,
vomiting, dehydration
Begins within a 1-3 hours and lasts ≤5 days
Vibrio cholerae bacteria in contaminated water infect the intestinal track and produce Cholera toxin
Fluids, possible single dose of an antibiotic
Vibrio cholerae. Leifson flagella stain (digitally colorized). Image courtesy of William Clark (PHIL ID#1034)
Escherichia coli infection
Bloody diarrhea, dehydration, fever, and in the most severe cases, kidney failure
2–8 days E. coli bacteria in water or contaminated food that produce enterotoxins in the intestinal track
Supportive care
Under a magnification of 6836x, this colorized scanning electron micrograph depicted a number of Gram-negative Escherichia coli bacteria of the strain O157:H7, which is one of hundreds of strains of this bacterium. Image courtesy of Janice Haney Carr (PHIL ID# 10068)

29
Illness Symptoms Duration Cause Treatment Image* Staphylococcus aureus infection
Nausea, vomiting, stomach cramps, and diarrhea
Starts within 1–6 hours and lasts ≤3 days
S. aureus bacteria that have already produced enterotoxins in the food (dairy products. Eggs, and meat are common)
Rest and fluids
Under a magnification of 20,000X, this digitally-colorized scanning electron micrograph depicts a number of mustard-colored, spheroid-shaped Staphylococcus aureus bacteria that were in the process of escaping their destruction by blue-colored human white blood cells Image courtesy of National Institute of Allergy and Infectious Diseases (PHIL ID# 18140)
*All images were sourced from CDC’s Public Health Image Library (PHIL): http://phil.cdc.gov/phil/home.asp
30
Appendix 4D: Extension 1, Shelter Outbreak, Answer Key
Shelter Outbreak Name: _____Answer Key______________________________ Date: ________________ Scenario: In 2 refugee shelters, residents reported having diarrhea, nausea, and vomiting. In Shelter A, 3 initial cases were reported and in Shelter B, 4 initial cases were reported on Monday afternoon. Both shelters are located in the gymnasium at local schools, and each houses 100 refugees. Refugees eat 3 meals daily in the cafeteria and shower and use facilities in the locker rooms and the bathrooms in the main hallway. The local health department is concerned that this might lead to an illness outbreak. They are collecting data daily from the 2 shelters while they are awaiting laboratory results on the stool samples collected from the ill refugees. On Day 2, the number of new cases increased to 6 in Shelter A and 10 in Shelter B. In Shelter B, 1 of the food service volunteers is sick. She has volunteered at both of the shelters. The patients were interviewed, and the investigators determined that 12 of them had salad for dinner on Sunday evening. They suspect that this is a foodborne illness. Some of the patients also have a fever and body aches. The number of new cases continues to increase throughout the next few days. On Day 3, a total of 11 new cases in Shelter A and 13 new cases in Shelter B occur. On Day 4, a total of 14 new cases at Shelter A and 16 new cases at Shelter B occur. On Day 5, a total of 15 new cases at Shelter A and 18 new cases at Shelter B occur. Unfortunately, on Day 5, a man aged 75 years dies from dehydration. On Day 6, the number of new cases decreases to 9 in Shelter A and 12 in Shelter B. On Day 7, a total of 6 new cases at Shelter A and 8 new cases at Shelter B occur. On Day 8, a total of 4 new cases at Shelter A and 7 at Shelter B occur. On Day 9, only 1 new case at Shelter A and 3 new cases at Shelter B occur. By Day 10, no new cases are reported. Part I: Describing the Outbreak 1. Complete the data table for newcases in the shelters.
Location
Day 1 2 3 4 5 6 7 8 9 10
Shelter A 3 6 11 14 15 9 6 4 1 0 Shelter B 4 10 13 16 18 12 8 7 3 0
Total 7 16 24 30 33 21 14 11 4 0
31
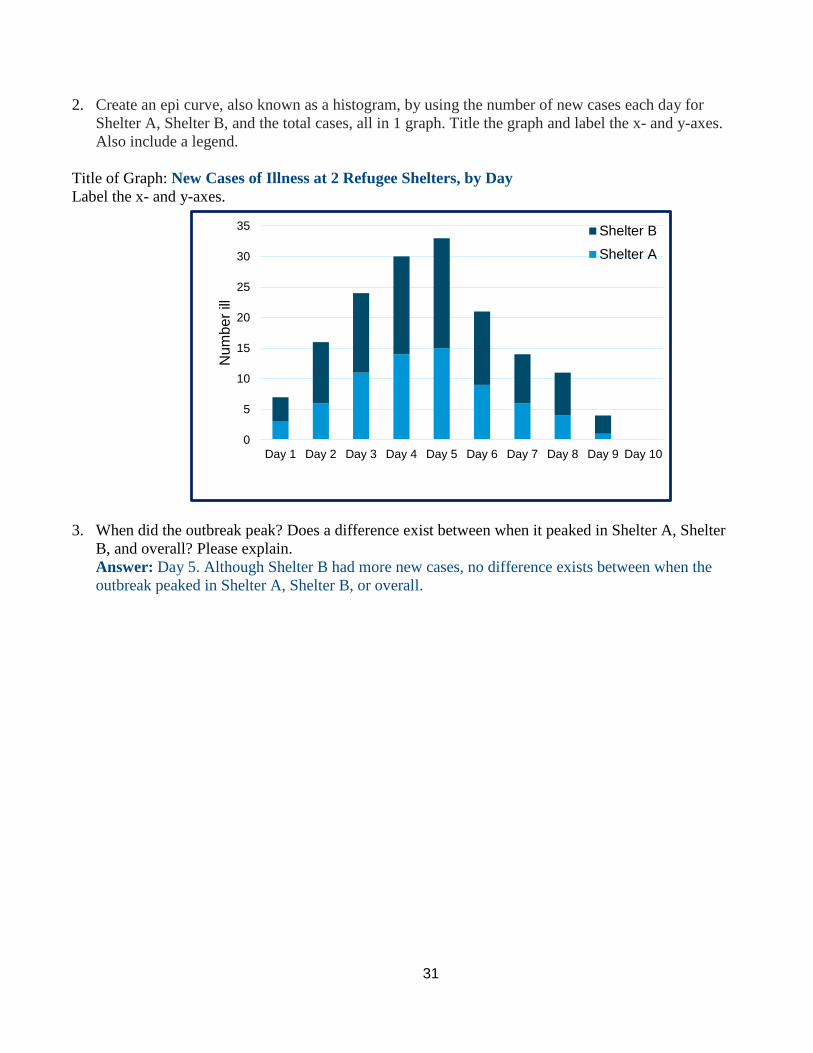
2. Create an epi curve, also known as a histogram, by using the number of new cases each day for Shelter A, Shelter B, and the total cases, all in 1 graph. Title the graph and label the x- and y-axes. Also include a legend.
Title of Graph: New Cases of Illness at 2 Refugee Shelters, by Day Label the x- and y-axes.
3. When did the outbreak peak? Does a difference exist between when it peaked in Shelter A, Shelter
B, and overall? Please explain. Answer: Day 5. Although Shelter B had more new cases, no difference exists between when the outbreak peaked in Shelter A, Shelter B, or overall.
0
5
10
15
20
25
30
35
Day 1 Day 2 Day 3 Day 4 Day 5 Day 6 Day 7 Day 8 Day 9 Day 10
Num
ber i
llShelter B
Shelter A
32
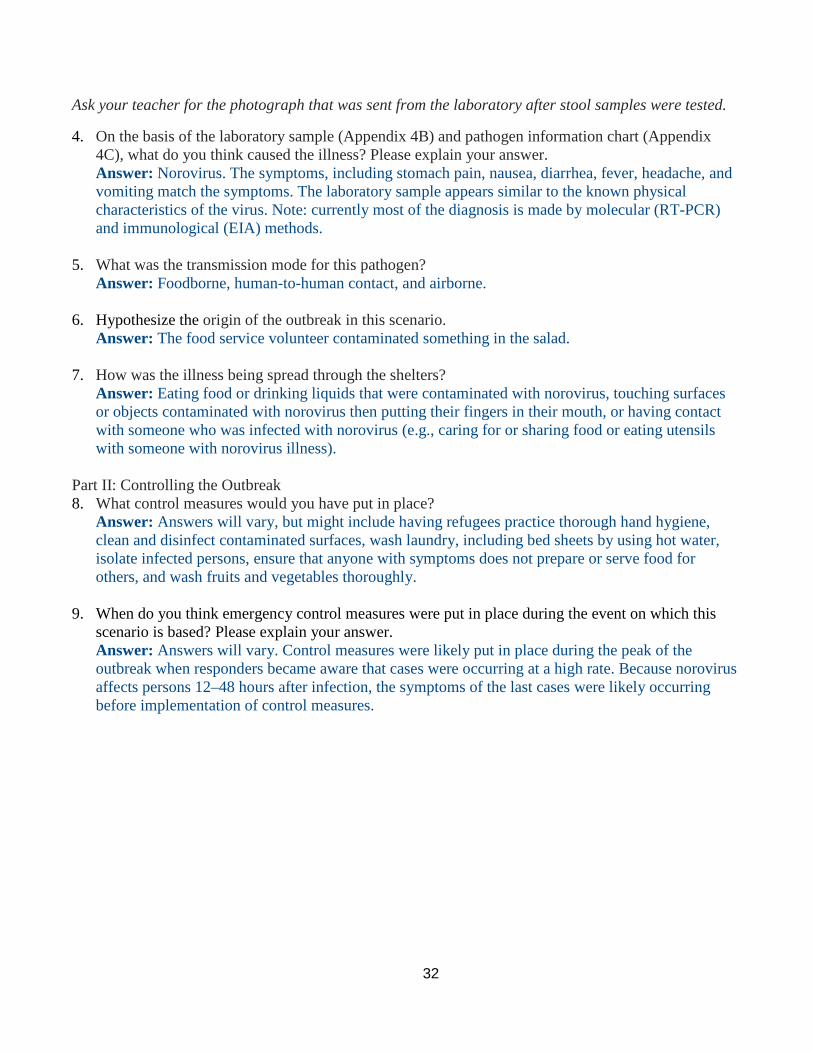
Ask your teacher for the photograph that was sent from the laboratory after stool samples were tested.
4. On the basis of the laboratory sample (Appendix 4B) and pathogen information chart (Appendix 4C), what do you think caused the illness? Please explain your answer. Answer: Norovirus. The symptoms, including stomach pain, nausea, diarrhea, fever, headache, and vomiting match the symptoms. The laboratory sample appears similar to the known physical characteristics of the virus. Note: currently most of the diagnosis is made by molecular (RT-PCR) and immunological (EIA) methods.
5. What was the transmission mode for this pathogen?
Answer: Foodborne, human-to-human contact, and airborne. 6. Hypothesize the origin of the outbreak in this scenario.
Answer: The food service volunteer contaminated something in the salad. 7. How was the illness being spread through the shelters?
Answer: Eating food or drinking liquids that were contaminated with norovirus, touching surfaces or objects contaminated with norovirus then putting their fingers in their mouth, or having contact with someone who was infected with norovirus (e.g., caring for or sharing food or eating utensils with someone with norovirus illness).
Part II: Controlling the Outbreak 8. What control measures would you have put in place?
Answer: Answers will vary, but might include having refugees practice thorough hand hygiene, clean and disinfect contaminated surfaces, wash laundry, including bed sheets by using hot water, isolate infected persons, ensure that anyone with symptoms does not prepare or serve food for others, and wash fruits and vegetables thoroughly.
9. When do you think emergency control measures were put in place during the event on which this
scenario is based? Please explain your answer. Answer: Answers will vary. Control measures were likely put in place during the peak of the outbreak when responders became aware that cases were occurring at a high rate. Because norovirus affects persons 12–48 hours after infection, the symptoms of the last cases were likely occurring before implementation of control measures.