ccap india report
TRANSCRIPT
INTERNATIO
NAL
DEVELOPING COUNTRY ANALYSIS AND DIALOGUE
Analysis of GHG Emissions for Major Sectors in India: Opportunities and Strategies for Mitigation
CENTER FOR CLEAN AIR POLICY
November 2009
Integrated Research and Action for Development (IRADe)
ICF International
Center for Clean Air Policy
Center for Clean Air Policy page 2
Acknowledgements This Report was prepared by a team from Integrated Research and Action for Development (IRADe) and ICF International. The IRADe team included Dr. Jyoti Parikh, C R Duttabiswas, Nirbhay Shrivastav, and Vineet Kumar. The major members of the ICF International team are Bishal Thapa, Brian Dean, Shanti Ojha, Ritika Goel, Vipul Mathur, Amit Khare and Natasha Bhan. The authors would like to thank Dr. Kirit Parikh of the Planning Commission for the information and support provided. The work also benefited from the discussions at the final project workshop in Delhi, India (March 2009). The authors also wish to express their gratitude to the Center for Clean Air Policy, the main sponsor of this report, and especially to Ned Helme, Matthew Ogonowski, Anmol Vanamali and Thomas Polzin. The authors would like to thank Jos Wheatley, Sarah Love and Aditi Maheshwari (formerly) of the UK Department for International Development (DFID) for their generous financial support for the project. For avoidance of any doubt and for the purpose of clarity, the authors would like to state that this report is based on an independent study, and the contents of the report reflect their views and not necessarily the views of the UK or Indian governments.
Center for Clean Air Policy page 3
India Sectoral Policy Implementation Analysis I. Introduction and summary ..................................................................................7
I.A Background.............................................................................................................................................7 I.A.1 Phase I – GHG Mitigation Option and Cost Analysis .....................................................................8 I.A.2 Phase II: Policy and Implementation strategy for India ..................................................................9
I.B Methodology..........................................................................................................................................10 I.C Mitigation and Policy Criteria..............................................................................................................11
I.C.1 Selection of Mitigation Options ....................................................................................................11 I.C.2 Selection of Policy Options...........................................................................................................11
I.D Aggregate Summary of Final Mitigation and Policy Options Analyzed................................................12 I.D.1 Electricity Supply..........................................................................................................................12 I.D.2 Electricity Demand........................................................................................................................12 I.D.3 Transportation ...............................................................................................................................12 I.D.4 Cement ..........................................................................................................................................12 I.D.5 Iron and Steel ................................................................................................................................12
I.E Executive Summary...............................................................................................................................13 I.E.1 Summary of results (timeline).......................................................................................................13 I.E.2 Highlights from results of Ph II study (excerpts from table below) ..............................................13 I.E.3 Summary of results........................................................................................................................15
II. Electricity Supply Sector....................................................................................18 II.A Electricity Supply Sector Background...................................................................................................18
II.A.1 Overview of Current Installed Capacity ...................................................................................18 II.A.2 Coal Sector in India – Overview...............................................................................................19 II.A.3 Key Stakeholders ......................................................................................................................22
II.B Assumptions and Uncertainties.............................................................................................................23 II.C Mitigation option: Coal-based IGCC....................................................................................................24
II.C.1 Sector Background....................................................................................................................24 II.C.2 Mitigation Option Methodology from Coal-based IGCC.........................................................30 II.C.3 Mitigation Option Results from Coal-based IGCC...................................................................32 II.C.4 Adoption Barriers for IGCC in India ........................................................................................35
II.D Policy Options: Coal-based IGCC........................................................................................................36 II.D.1 Government Programme for Encouraging IGCC .....................................................................37 II.D.2 Setting-up Central Body to Facilitate R&D in IGCC Technology............................................42 II.D.3 Amendments to National Electricity Act - 2003.......................................................................44 II.D.4 Fiscal Policies Including Tax Incentives for commercial projects............................................46 II.D.5 Other Possible Supplementary Policy Measures ......................................................................47 II.D.6 Policy Implementation Barriers in Coal-based IGCC...............................................................47
II.E Mitigation Option: Carbon Capture and Storage.................................................................................48 II.E.1 Sector Background....................................................................................................................48 II.E.2 Mitigation Option Methodology for CCS.................................................................................52 II.E.3 Mitigation Option Results for CCS ..........................................................................................52 II.E.4 Adoption Barriers for CCS in India..........................................................................................55
II.F Policy Options: CCS.............................................................................................................................57 II.F.1 Setting up of a R&D Test Centre with Central Government Funding...........................................59 II.F.2 Establishing Tax Incentives for CCS Demonstration and Commercial Projects...........................62 II.F.3 Other Supplementary Policies: Enhancing Efficiency of Power Plants ........................................63 II.F.4 Policy Implementation Barriers for CCS ......................................................................................63
II.G Electricity Supply Sector Conclusion....................................................................................................64 III. Electricity Demand Sector .................................................................................65
III.A Electricity Demand Sector Background................................................................................................65 III.A.1 India’s Energy Vision and Acts.................................................................................................68 III.A.2 Key Stakeholders in the Electricity Demand Sector.................................................................69
Center for Clean Air Policy page 4
III.B Assumptions and Uncertainties.............................................................................................................71 III.C Mitigation Option: Energy Efficient Products and Equipments............................................................73
III.C.1 Sector Background....................................................................................................................73 III.C.2 Mitigation Option Methodology for Products and Equipments................................................73 III.C.3 Mitigation Option Results from Products and Equipments ......................................................74 III.C.4 Adoption Barriers for Mitigation Options from Products and Equipments ..............................75
III.D Policy Options: Energy Efficient Products and Equipments.................................................................76 III.D.1 Products and Equipment Standards and Labelling ...................................................................77 III.D.2 Tax/ Duty Exemptions for Energy Efficient Products and Equipment .....................................81 III.D.3 Policy Implementation Barriers in Products and Equipments ..................................................84
III.E Mitigation Options: Energy Efficiency in Buildings.............................................................................85 III.E.1 Mitigation Option Methodology from Buildings Sector...........................................................90 III.E.2 Mitigation Option Results from Buildings Sector ....................................................................91 III.E.3 Adoption Barriers to Mitigation Options from Buildings Sector .............................................92
III.F Policy Options: Energy Efficient Buildings...........................................................................................92 III.F.1 Building Energy Codes.............................................................................................................93 III.F.2 Time Zones ...............................................................................................................................95 III.F.3 Tax Incentives...........................................................................................................................97 III.F.4 Above Code Building Labelling ...............................................................................................98 III.F.5 Policy Implementation Barriers in Buildings ...........................................................................99
III.G Electricity Demand Sector Conclusion...............................................................................................100 IV. Transportation Sector.......................................................................................101
IV.A Transportation Sector Background.....................................................................................................101 IV.A.1 Major Players in the Transportation Sector ............................................................................103 IV.A.2 Urban Transportation..............................................................................................................105 IV.A.3 Railways .................................................................................................................................110 IV.A.4 Aviation...................................................................................................................................114 IV.A.5 Inland Waterways....................................................................................................................115 IV.A.6 Roadways................................................................................................................................119
IV.B Assumptions and Uncertainties...........................................................................................................119 IV.C Existing Policy framework..................................................................................................................120 IV.D Mitigation Option: Expansion of Biofuel use in all forms of transportation......................................123
IV.D.1 Background.............................................................................................................................123 IV.D.2 Mitigation Option Methodology from biofuel use expansion ................................................125 IV.D.3 Mitigation Option Results from biofuel use expansion ..........................................................127 IV.D.4 Barriers to Adoption of Mitigation Option from Biofuel use Expansion................................131
IV.E Policy Options for Expansion of Biofuel use.......................................................................................133 IV.E.1 National Biofuel Policy ..........................................................................................................133 IV.E.2 Public awareness.....................................................................................................................135 IV.E.3 Collaborated decision making framework among the major players......................................136 IV.E.4 Collaboration with Integrated Wasteland Development Programme......................................136 IV.E.5 Collaboration with other public and private companies .........................................................137 IV.E.6 Quality control on fuel blending.............................................................................................138 IV.E.7 Labelling the feedstock plantation sites..................................................................................138 IV.E.8 Phasing out of subsidy on gasoline and diesel........................................................................139 IV.E.9 Developing financing mechanisms for plantation and extraction...........................................139 IV.E.10 Barriers to adoption of policy options in biofuels ..................................................................140
IV.F Mitigation Option: Integrating Electric Vehicles in Urban Transportation........................................141 IV.F.1 Electric Vehicles Background.................................................................................................141 IV.F.2 Mitigation Option Methodology for Electric Vehicles ...........................................................141 IV.F.3 Mitigation Option Results from Electric Vehicles ..................................................................143 IV.F.4 Adoption Barriers to Mitigation Options from Electric Vehicles ...........................................144
IV.G Policy Options: Electric Vehicles........................................................................................................145 IV.G.1 Analysis of Existing Schemes and Incentives ........................................................................145
Center for Clean Air Policy page 5
IV.G.2 Soft Loan ................................................................................................................................148 IV.G.3 Mandatory Type Approval and Conformity of Production .....................................................148 IV.G.4 Consortium of Major Players..................................................................................................148 IV.G.5 End-to-end service ..................................................................................................................149 IV.G.6 Research and Development ....................................................................................................149 IV.G.7 EV exclusive route..................................................................................................................150 IV.G.8 Fuel-switch at all levels of the value chain.............................................................................150 IV.G.9 Barriers to adoption of policy options ....................................................................................150
IV.H Transportation Sector Conclusion......................................................................................................152 V. Iron and Steel Sector.........................................................................................153
V.A Introduction.........................................................................................................................................153 V.A.1 Background.............................................................................................................................154 V.A.2 Key Stakeholders ....................................................................................................................160 V.A.3 Capacity by ownership ...........................................................................................................162 V.A.4 Steel Demand..........................................................................................................................164 V.A.5 Steel Prices..............................................................................................................................164 V.A.6 Imports and exports of Iron and steel .....................................................................................165 V.A.7 Iron and Steel making process ................................................................................................166 V.A.8 Domestic Raw Materials Status..............................................................................................170 V.A.9 Availability of Demand Projections........................................................................................171
V.B Assumptions and Uncertainties...........................................................................................................172 V.B.1 Assumptions ...........................................................................................................................172 V.B.2 Uncertainties...........................................................................................................................172 V.B.3 SWOT Analysis ......................................................................................................................172
V.C Mitigation Options for the Steel Industry............................................................................................175 V.C.1 Energy Utilization in Steel Industry and Mitigation options. .................................................176 V.C.2 Up-gradation of sponge iron plant and making the technology indigenous ...........................178 V.C.3 Other Environmental Parameters............................................................................................183 V.C.4 Barriers for Adopting Modern and Low carbon technology in Iron & Steel Sector ...............184
V.D Policy Options in Steel Sector.............................................................................................................185 V.D.1 Existing policy: National Steel Policy 2005 ...........................................................................185 V.D.2 Strategy to achieve policy objective .......................................................................................186 V.D.3 Domestic Policy Options for Steel Industry ...........................................................................188 V.D.4 Relation to current policies, processes and trends underway in the country ..........................188 V.D.5 Research and Development focusing on quality of steel ........................................................189 V.D.6 Strategic training to facilitate pending technical issues ..........................................................190 V.D.7 Developing adequate financing mechanisms..........................................................................190 V.D.8 Challenges & Concerns ..........................................................................................................192
V.E Policy Options: Mitigation..................................................................................................................194 V.F Co-impacts analysis............................................................................................................................197 V.G Steel Sector Conclusion.......................................................................................................................198
VI. Cement Sector ...................................................................................................201 VI.A Background.........................................................................................................................................201
VI.A.1 Industry Characteristics ..........................................................................................................202 VI.A.2 Production and Capacity.........................................................................................................202 VI.A.3 Regional Distribution..............................................................................................................203 VI.A.4 Government Sector Initiatives ................................................................................................204 VI.A.5 End User Profile .....................................................................................................................206 VI.A.6 Financial Aspects ....................................................................................................................206
VI.B Cement Manufacturing Technology.....................................................................................................206 VI.B.1 Present Status of Technology..................................................................................................207 VI.B.2 Types of Cement .....................................................................................................................209 VI.B.3 Upgrading of Low Technology Cement Plants.......................................................................210
Center for Clean Air Policy page 6
VI.B.4 Energy Inputs to Indian Cement Industry...............................................................................211 VI.B.5 Energy Consumption Patterns.................................................................................................211 VI.B.6 GHG Emissions by the Indian Cement Industry.....................................................................212
VI.C Mitigation Options..............................................................................................................................213 VI.C.1 Production of blended Cement with higher Ratio of Additives/Cement.................................214 VI.C.2 Switch to less Carbon Intensive Fuel in Kiln..........................................................................216 VI.C.3 Waste Heat Utilization for Power Generation/Co-Generation................................................218 VI.C.4 Implementing Energy Efficiency Improvement Measures .....................................................220 VI.C.5 Energy Management ...............................................................................................................223
VI.D Other Supporting Domestic Policy Options for the Cement Industry.................................................224 VI.D.1 Domestic Policy Options for Blended Cement with higher Ratio of Additives/Cement ........224 VI.D.2 Domestic Policy Options for Fuel Switch to Lesser Carbon intensive Fuel in Kiln...............225 VI.D.3 Domestic Policy Options for Waste Heat Recovery Utilization .............................................225 VI.D.4 Policy Options for Energy Efficiency Improvement Measures ..............................................226 VI.D.5 Domestic Policy Options for Energy Management Practices .................................................226 VI.D.6 Carbon market opportunities in Cement Sector in India.........................................................227 VI.D.7 Key Players to be involved .....................................................................................................228 VI.D.8 Other Policy Options ..............................................................................................................228
VI.E Conclusions.........................................................................................................................................231 VII. Cross Measure and Cross Sector Analysis......................................................233
VII.A Cross Measure and Cross Sector Background....................................................................................233 VII.B Tracking the GHG Emissions Inventory..............................................................................................233 VII.C Cross Measure and Cross Sector Analysis Results..............................................................................235 VII.D Cross Measure and Cross Sector Conclusion.....................................................................................237
VIII. Implications for International Negotiations and Policies.......................239 VIII.A Introduction.........................................................................................................................................239 VIII.B Existing International Policy on Climate Change...............................................................................239 VIII.C Possible International Frameworks and Their Implications...............................................................240
VIII.C.1 Framework I (Second Modified Phase of Kyoto)...................................................................240 VIII.C.2 Framework II (Back to Square one)........................................................................................241 VIII.C.3 Framework III (An ‘Equity’ Approach)..................................................................................241 VIII.C.4 Framework IV (Imposing a Uniform Tax on GHG Emissions)..............................................242 VIII.C.5 Framework V (No Formal Multilateral Agreement Reached) ................................................242
VIII.D Implications for International Negotiations Conclusion.....................................................................242 IX. Conclusions........................................................................................................243 Appendix A: Summary of final in-country workshop..........................................245
Center for Clean Air Policy page 7
I. Introduction and summary
I.A Background
In the wake of the global challenge posed by climate change, countries around the world are beginning formal discussions to negotiate the successor of the Kyoto Protocol, which expires in 2012. The role of emerging economies would be a key element in these discussions, particularly with respect to their developmental challenges, energy security, policy and environmental concerns.
The Centre for Clean Air Policy (CCAP) and leading partner organizations in four key emerging economies (Brazil, China, India, and Mexico) launched the ‘Assisting Developing Country Climate Negotiators through Analysis and Dialogue’ project in February 2005, with financial support from the United Kingdom’s Department for International Development (DFID), the Tinker Foundation, and the Hewlett Foundation. For this project, the teams worked together to develop a comprehensive analysis of greenhouse gas (GHG) projections and potential mitigation options, costs, co-benefits, and implementation policies in the four countries. The project is a useful input in the discussions on the post-2012 international response to climate change, as it includes a concrete in- depth analysis and results to help the internal deliberations in these four countries on possible strategies and options for GHG mitigation.
An additional important foundation of the project is that it links directly with international climate change negotiators through CCAP’s Dialogue on Future International Actions to Address Global Climate Change—the Future Actions Dialogue or FAD — the leading international dialogue on climate policy over the last five years. Preliminary results of this project have been presented at various FAD meetings and final results will be presented at future meetings of the group to help shape and inform these deliberations.
This project is divided into two phases – Phase I and Phase II. The descriptions of both these phases are described later in this section.
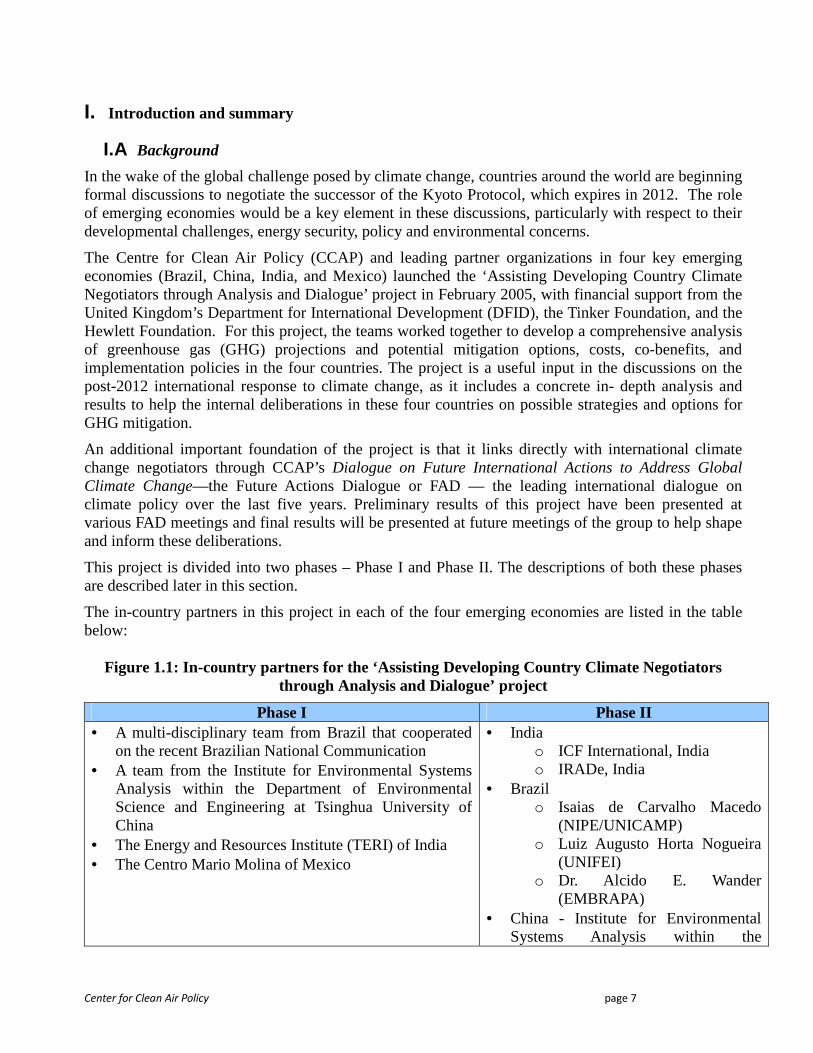
The in-country partners in this project in each of the four emerging economies are listed in the table below:
Figure 1.1: In-country partners for the ‘Assisting Developing Country Climate Negotiators
through Analysis and Dialogue’ project
Phase I Phase II • A multi-disciplinary team from Brazil that cooperated
on the recent Brazilian National Communication • A team from the Institute for Environmental Systems
Analysis within the Department of Environmental Science and Engineering at Tsinghua University of China
• The Energy and Resources Institute (TERI) of India • The Centro Mario Molina of Mexico
• India o ICF International, India o IRADe, India
• Brazil o Isaias de Carvalho Macedo
(NIPE/UNICAMP) o Luiz Augusto Horta Nogueira
(UNIFEI) o Dr. Alcido E. Wander
(EMBRAPA) • China - Institute for Environmental
Systems Analysis within the
Center for Clean Air Policy page 8
Department of Environmental Science and Engineering at Tsinghua University of China
The results of Phase I have already been presented in a series of reports. CCAP had prepared an integrated report, “Assisting Developing Country Climate Negotiators through Analysis and Dialogue Project: Final Phase I Report,” which compares and contrasts the results achieved across Brazil, India and China.
This report presents the results of Phase II (Policy and Implementation Strategy Analysis) of the project for India.
I.A.1 Phase I – GHG Mitigation Option and Cost Analysis
In Phase I of the project, the teams conducted individual GHG emission mitigation analyses for major economic sectors. The sectors analyzed were electricity; cement; iron and steel; pulp and paper; transportation; commercial; residential; agriculture; and forestry. Specifically, each country analysis included the following elements:
• Development of a current overview of each economic sector, including annual number of units and production capacity, production, fuel consumption, GHG emissions, energy intensity, and GHG emissions intensity.
• Development of long-term (through the year 2025 or 2030) individual GHG emission projections under several baseline scenarios for each economic sector. This includes annual scenarios of production, fuel consumption, GHG emissions, energy intensity, and GHG emissions intensity.
• Development of detailed marginal abatement cost curves for key technologies and mitigation approaches in each sector. This includes the total GHG emissions reduction potential and cost (per metric ton GHG reduced) for 2010, 2015 and 2020.
• Evaluation of the impact of implementation of select packages of GHG mitigation options. The results to be provided include the annual changes (through 2030) in energy consumption and intensity, GHG consumption and intensity, total costs and production costs, as well as co-benefits.
• Assessment of economy-wide cost and economic impacts of mitigation packages on parameters such as GDP, employment, consumer prices, structure of economy, and distribution, using macroeconomic models and optimization frameworks that incorporate the detailed cost and GHG emission reduction potential data for key technologies.
• Preliminary analysis of potential domestic policies for implementation of each mitigation option, including the domestic legal and regulatory framework, political/economic/technical/legal barriers to implementation, potential key actors and institutions involved, and potential funding approaches.
• Evaluation of potential international policy options and the implications of the results for each economic sector for specific international approaches.
The GHG mitigation analysis was conducted using country-specific scenarios for annual population and gross domestic product (GDP). The teams developed two alternative GHG reference case
Center for Clean Air Policy page 9
scenarios for each sector, partly based on the A2 and B2 scenarios in the Intergovernmental Panel on Climate Change (IPCC) Special Report on Emissions Scenarios (SRES). The A2 and B2 scenarios were chosen because the teams felt that these represented divergent scenarios that each had a reasonable probability of representing the future reality. The A2 scenario is characterized by relatively lower trade flows, slow capital stock turnover, and slower rates of technological change; the B2 world is characterized by comparatively greater concern for environmental and social sustainability. These two IPCC SRES scenarios were adapted specifically to India.
It was also desired to develop scenarios that would display the impact of policies and measures undertaken in the past five years; these may include national energy and other policies, as well as projects undertaken as part of the Clean Development Mechanism (CDM) of the Kyoto Protocol. Accordingly, each of the two baseline scenarios was further divided into a scenario assuming implementation of only those policies and projects announced prior to 2000—“Pre-2000 Policy” scenario—and another scenario with implementation of all policies announced before 2006—“Recent Policy” scenario. Both scenarios begin in 2000. A scenario was then developed that assume implementation of select packages of GHG mitigation options in years after 2005—called the “Advanced Options” scenario. Where appropriate, each country analysis conducted up to four variations of the Advanced Options scenario based on the potential cost effectiveness (measured in $/metric ton CO2e reduced) of the mitigation measures analyzed.
At the start of the technical analysis, workshops were held in each country (the Beijing workshop was held in July 2005, the Brasilia and Delhi workshops in August) to obtain feedback and guidance from government policymakers and other stakeholders. This information was incorporated into the analysis. In March 2006 in Beijing and Delhi and in April in Brasilia, another series of workshops were held where the results were presented to a large group of government officials and representatives from industry, universities, think tanks, and non-governmental organizations. The stakeholders also provided significant input and guidance regarding the mitigation options and policies to be analyzed for Phase II of the project.
I.A.2 Phase II: Policy and Implementation strategy for India
In Phase II of the project, CCAP and its in-country partners have built upon the work and policy connections developed during Phase I. CCAP and its partners have selected a number of the most promising options for GHG mitigation and conducted an in-depth and comprehensive analysis of issues associated with implementation. These options will be examined and developed further in consultation with in-country policymakers.
This includes an evaluation of the implications of specific international climate change policy options for GHG mitigation in each of the four countries; development of a suite of potential policies and approaches for implementation of each option; and comprehensive and in-depth analysis of the key actors, barriers and co-benefits associated with each policy option. Phase II also includes a series of workshops in each country to obtain the views of and share results with domestic policy makers and stakeholders. The plan includes two international workshops, one in Latin America and one in Asia, to disseminate the results of the project to a wider regional audience and expand its policy relevance by allowing other countries to gain from the experience of this project. The results of Phase II for each country are available in a set of individual reports.
This report includes detailed analysis of emission reduction potential, mitigation costs, and other issues associated with implementation of GHG emission policies in India for specific sectors. These sectors include electricity, cement, iron and steel, and transportation. A range of potential mitigation
Center for Clean Air Policy page 10
options have been identified for each of the included sectors. For each mitigation measure, the report discusses the assessment of the current state and profile of relevant background parameters (e.g., plant types and vintages, production technologies currently used, fuel consumption patterns, in place or anticipated energy and environmental policies, availability of technologies or capacity required for implementation of specific mitigation options, etc.). A comprehensive look has been provided at the roadmap for implementing each policy option including the identification of the key actors that would be involved, the key barriers to policy implementation, and major associated co-benefits. International policies that supplement the suggested domestic policy options have also been described, along with the implications for the structure of international climate policies. This analysis builds and expands upon the analysis that was conducted in Phase I of the report.
The policy and implementation analysis for Phase II of the India project focuses on opportunities in the electricity, cement, iron and steel and transportation sections.
I.B Methodology
For each sector that was analyzed the following set of steps were carried out:
• Technical and policy background assessment: The analysis included the assessment of general background of the sector with a detailed description of relevant proposed and existing policies. The assessment consisted of a brief overview of parameters consisting of but not limited to plant types and vintages, the production technologies used greenhouse gas (GHG) emissions from the sector and relevant existing or anticipated energy and environment policies.
• Description of assumptions and uncertainties: The assumptions and uncertainties that were involved in evaluating the emission reduction potential and mitigation costs are described for each sector. This included the assumptions, calculation methodology and default specific emission factors considered for emission reduction calculation estimates for each sector,
• Selecting relevant mitigation Options: The most suitable mitigation options were selected keeping economic, environmental, technical and infrastructural constraints in mind. The analysis included the description of the relevant mitigation options for each sector with a detailed analysis of maximum emission reduction potential through the implementation of the proposed policy option.
• Discussion of barriers to the proposed mitigation option: For each mitigation measure, the barriers to the adoption of the mitigation option in India are discussed in detail. These barriers include financial, technical, institutional, political, administrative, legal or other barriers relevant to the proposed mitigation option. Potential paths to overcome each barrier are also suggested.
• Formulation of policy options for implementation of mitigation measures: A suite of policy options have been formulated for the selected mitigation measures. A detailed description of the policy option and implementation road map is provided for each policy option. This includes policy description, assumptions, geographical coverage, timing, analysis of emission reduction potential and cost, key players involved in policy implementation, barriers to policy implementation, way to overcome specific barriers, co-impacts analysis, and estimation of the level of financing or specific technologies needed.
• Implications of domestic policy options for International negotiations and policies: For each policy option, international policies that would facilitate the implementation of the policy option
Center for Clean Air Policy page 11
and other international policies that could accommodate domestic policy options with some changes to the domestic policy options, have been identified and described.
I.C Mitigation and Policy Criteria
I.C.1 Selection of Mitigation Options
A range of factors including technical feasibility, cost effectiveness, infrastructural support in the host country and environmental parameters have to be taken into account in order to evaluate the best suited mitigation options which can be effectively implemented with the help of policy options. The following main considerations were taken into account while evaluating and short listing suitable mitigation options from a wide range of possible mitigation options:
a) Economic feasibility: For each mitigation option, economic feasibility is an important evaluation criterion in order to facilitate market penetration of a new technology or the wide spread and effective adoption of a mitigation measure. This holds true particularly in the case of a developing country like India, where the penetration of cost-effective technologies and measures is likely to be more successful than costly options.
b) Environmental benefits: Environmental benefit, particularly with regards to GHG emissions mitigation, is one of the main criteria for evaluating the suggested mitigation options. For instance - some mitigation options while cost effective may result in comparably smaller amount of GHG mitigation than comparable cost measures with higher future potential of GHG mitigation, and offer more environmental benefits with regard to other pollutants. Hence mitigation measures were weighed upon their ability to result in effective GHG mitigation.
c) Technical feasibility: Technology maturity is a relevant parameter to be able to fully evaluate a mitigation option. The issues to evaluate may differ across sectors, but mainly relate to the ability to be able to accommodate and facilitate a new technology, technology risks and manpower capacity development or trainings required.
d) Infrastructure support: For the implementation of a mitigation option, it is necessary to have a supportive regulatory and infrastructural environment. This issue takes on more relevance in emerging economies like India and hence careful evaluation of this criterion becomes necessary for each mitigation option.
I.C.2 Selection of Policy Options
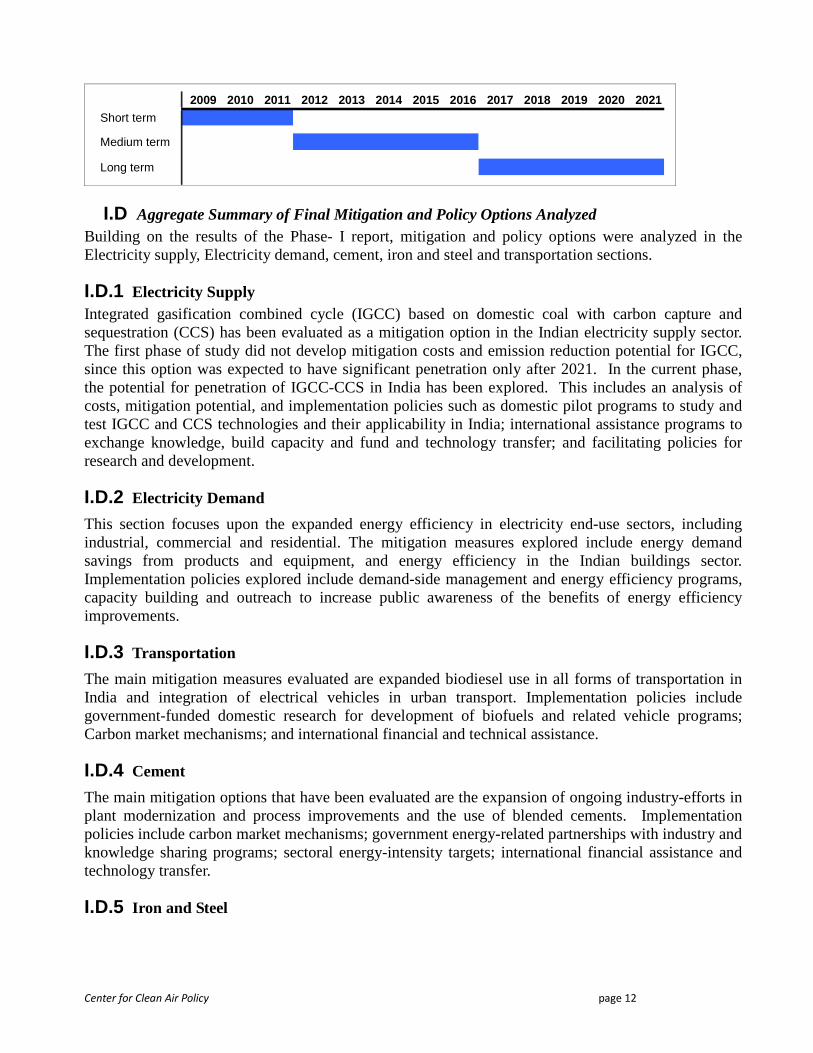
In order to formulate relevant policy options for each mitigation measure, many different factors have to be taken into account. Firstly, framing of a policy option for a mitigation measure has to correspond with the policy framework of the host country and should preferably lean on existing regulatory and financial structures for timely implementation. At the same time, a policy option must be evaluated against its potential to achieve realistic emission reductions, political feasibility and alignment with existing international environmental agreements or protocols. These considerations have been taken into account while formulating the policy options, according to sector specific parameters and barriers. Depending upon the complexity and achievability, the policy options for each sector have been classified as short, medium, long term and their intermediaries. The figure below gives the time line for the classification:
Figure 1.2: Classification of the time-line for policy options
Center for Clean Air Policy page 12
2009 2010 2011 2012 2013 2014 2015 2016 2017 2018 2019 2020 2021Short term
Medium term
Long term
I.D Aggregate Summary of Final Mitigation and Policy Options Analyzed Building on the results of the Phase- I report, mitigation and policy options were analyzed in the Electricity supply, Electricity demand, cement, iron and steel and transportation sections.
I.D.1 Electricity Supply Integrated gasification combined cycle (IGCC) based on domestic coal with carbon capture and sequestration (CCS) has been evaluated as a mitigation option in the Indian electricity supply sector. The first phase of study did not develop mitigation costs and emission reduction potential for IGCC, since this option was expected to have significant penetration only after 2021. In the current phase, the potential for penetration of IGCC-CCS in India has been explored. This includes an analysis of costs, mitigation potential, and implementation policies such as domestic pilot programs to study and test IGCC and CCS technologies and their applicability in India; international assistance programs to exchange knowledge, build capacity and fund and technology transfer; and facilitating policies for research and development.
I.D.2 Electricity Demand
This section focuses upon the expanded energy efficiency in electricity end-use sectors, including industrial, commercial and residential. The mitigation measures explored include energy demand savings from products and equipment, and energy efficiency in the Indian buildings sector. Implementation policies explored include demand-side management and energy efficiency programs, capacity building and outreach to increase public awareness of the benefits of energy efficiency improvements.
I.D.3 Transportation
The main mitigation measures evaluated are expanded biodiesel use in all forms of transportation in India and integration of electrical vehicles in urban transport. Implementation policies include government-funded domestic research for development of biofuels and related vehicle programs; Carbon market mechanisms; and international financial and technical assistance.
I.D.4 Cement
The main mitigation options that have been evaluated are the expansion of ongoing industry-efforts in plant modernization and process improvements and the use of blended cements. Implementation policies include carbon market mechanisms; government energy-related partnerships with industry and knowledge sharing programs; sectoral energy-intensity targets; international financial assistance and technology transfer.
I.D.5 Iron and Steel
Center for Clean Air Policy page 13
This section evaluates the introduction of advanced production technologies in the context of the Indian iron and steel industry. Implementation policies include carbon market mechanisms; government energy-related partnerships with industry and knowledge sharing programs; subsidies and financial incentives for research and development; sectoral energy-intensity targets; international financial assistance and technology transfer.
I.E Executive Summary
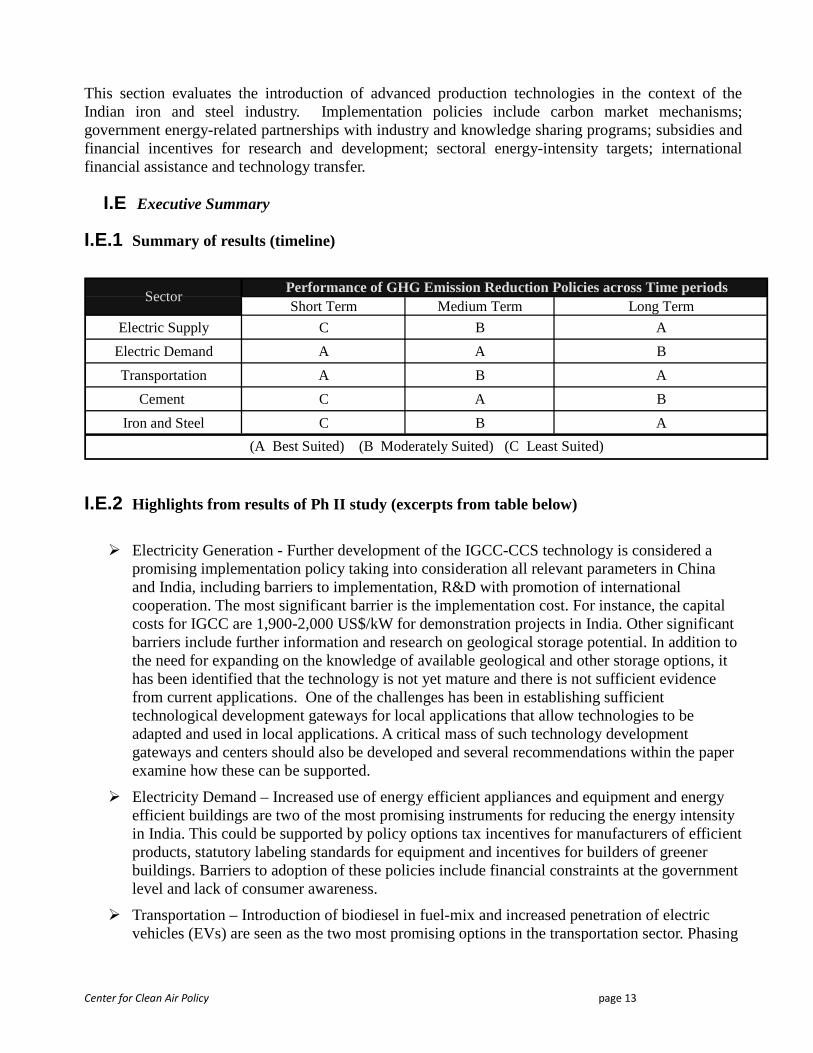
I.E.1 Summary of results (timeline)
Short Term Medium Term Long Term
Electric Supply C B A
Electric Demand A A B
Transportation A B A
Cement C A B
Iron and Steel C B A
Performance of GHG Emission Reduction Policies across Time periods
(A Best Suited) (B Moderately Suited) (C Least Suited)
Sector
I.E.2 Highlights from results of Ph II study (excerpts from table below)
� Electricity Generation - Further development of the IGCC-CCS technology is considered a promising implementation policy taking into consideration all relevant parameters in China and India, including barriers to implementation, R&D with promotion of international cooperation. The most significant barrier is the implementation cost. For instance, the capital costs for IGCC are 1,900-2,000 US$/kW for demonstration projects in India. Other significant barriers include further information and research on geological storage potential. In addition to the need for expanding on the knowledge of available geological and other storage options, it has been identified that the technology is not yet mature and there is not sufficient evidence from current applications. One of the challenges has been in establishing sufficient technological development gateways for local applications that allow technologies to be adapted and used in local applications. A critical mass of such technology development gateways and centers should also be developed and several recommendations within the paper examine how these can be supported.
� Electricity Demand – Increased use of energy efficient appliances and equipment and energy efficient buildings are two of the most promising instruments for reducing the energy intensity in India. This could be supported by policy options tax incentives for manufacturers of efficient products, statutory labeling standards for equipment and incentives for builders of greener buildings. Barriers to adoption of these policies include financial constraints at the government level and lack of consumer awareness.
� Transportation – Introduction of biodiesel in fuel-mix and increased penetration of electric vehicles (EVs) are seen as the two most promising options in the transportation sector. Phasing
Center for Clean Air Policy page 14
out subsidies for gasoline, introducing blending standards and establishing financial incentives are possible policy options. Barriers include lack of the required infrastructure, conflict of interest between regulatory and implementing agencies, lack of incentives to domestic financiers and insufficient incentives for the Government to take voluntary action. Regarding EVs, India has many big-medium size cities which are seeing explosive growth in vehicular traffic and usage. Most of the urban travel distances in medium size cities are short and can easily be covered by EVs. More so, the number of para transit and non-motorized vehicles is expected to grow. Hence, EVs are not only viable but can prove useful in creating a cleaner transportation mix in these urban areas. Further technological improvements and higher penetration in both EV technology and infrastructure will improve viability.
� Iron & Steel - The mitigation options considered for India focuses on the use of more energy efficient production technologies and the use of appropriate control processes for iron and steel. In order to overcome the high cost of new technologies (identified as a key barrier) several policies could be put in place including: R&D focusing on improving the quality of steel, training to facilitate resolution of pending technical issues, developing adequate financing mechanisms such as domestic cap-and-trade mechanisms etc.
� Cement – Production of blended cement with higher ratio of additives and waste heat recovery are two promising mitigation actions that have been identified. Some barriers to adoption of these options are lack of trained personnel for modern equipment, non-availability of indigenous technology, huge investment costs and negative consumer perception about blended cement. Recommended policy options to address these barriers are capital subsidies for plant and infrastructure modification, excise and tax concessions for related equipment and increase in consumer awareness.
Center for Clean Air Policy page 15
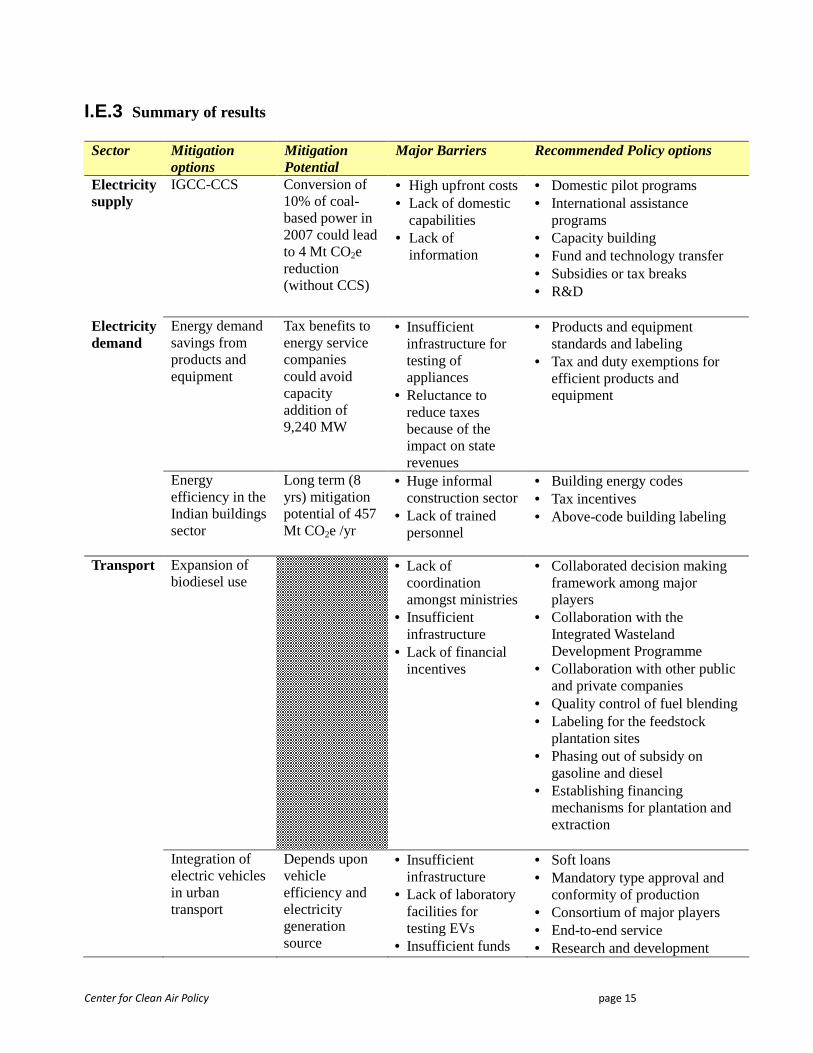
I.E.3 Summary of results Sector Mitigation
options Mitigation Potential
Major Barriers Recommended Policy options
Electricity supply
IGCC-CCS Conversion of 10% of coal-based power in 2007 could lead to 4 Mt CO2e reduction (without CCS)
• High upfront costs • Lack of domestic
capabilities • Lack of
information
• Domestic pilot programs • International assistance
programs • Capacity building • Fund and technology transfer • Subsidies or tax breaks • R&D
Electricity demand
Energy demand savings from products and equipment
Tax benefits to energy service companies could avoid capacity addition of 9,240 MW
• Insufficient infrastructure for testing of appliances
• Reluctance to reduce taxes because of the impact on state revenues
• Products and equipment standards and labeling
• Tax and duty exemptions for efficient products and equipment
Energy efficiency in the Indian buildings sector
Long term (8 yrs) mitigation potential of 457 Mt CO2e /yr
• Huge informal construction sector
• Lack of trained personnel
• Building energy codes • Tax incentives • Above-code building labeling
Transport Expansion of biodiesel use
• Lack of coordination amongst ministries
• Insufficient infrastructure
• Lack of financial incentives
• Collaborated decision making framework among major players
• Collaboration with the Integrated Wasteland Development Programme
• Collaboration with other public and private companies
• Quality control of fuel blending • Labeling for the feedstock
plantation sites • Phasing out of subsidy on
gasoline and diesel • Establishing financing
mechanisms for plantation and extraction
Integration of
electric vehicles in urban transport
Depends upon vehicle efficiency and electricity generation source
• Insufficient infrastructure
• Lack of laboratory facilities for testing EVs
• Insufficient funds
• Soft loans • Mandatory type approval and
conformity of production • Consortium of major players • End-to-end service • Research and development
Center for Clean Air Policy page 16
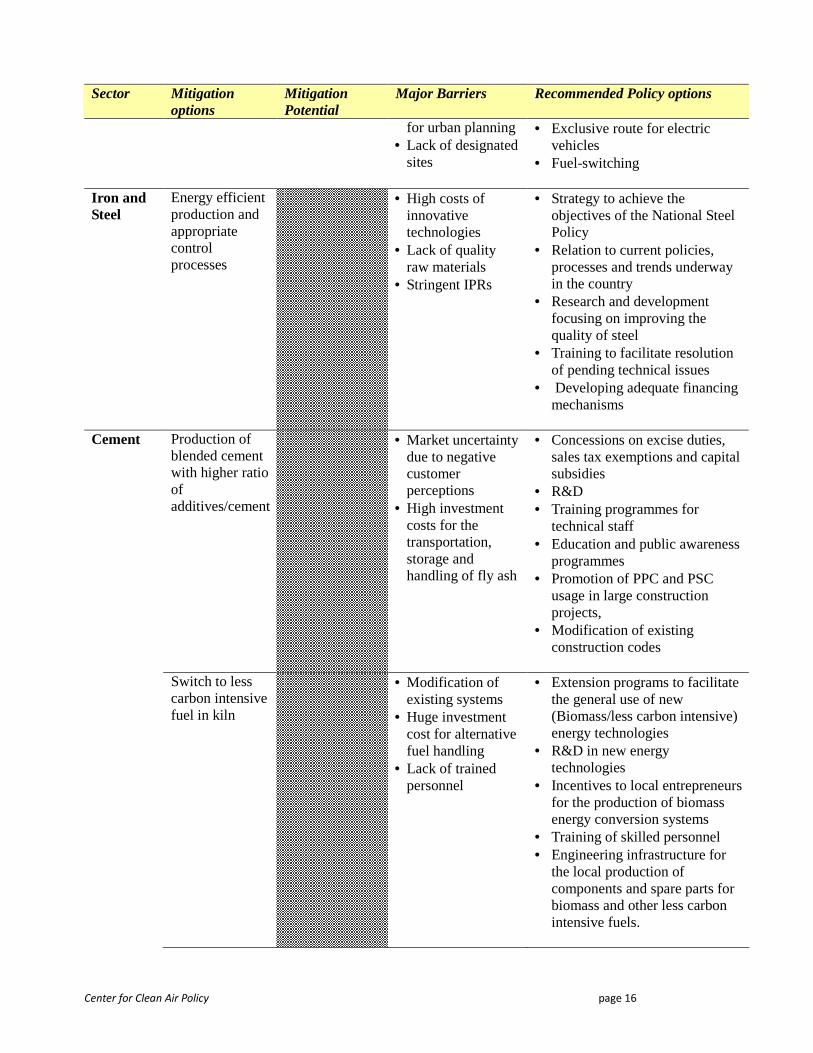
Sector Mitigation options
Mitigation Potential
Major Barriers Recommended Policy options
for urban planning • Lack of designated
sites
• Exclusive route for electric vehicles
• Fuel-switching
Iron and Steel
Energy efficient production and appropriate control processes
• High costs of innovative technologies
• Lack of quality raw materials
• Stringent IPRs
• Strategy to achieve the objectives of the National Steel Policy
• Relation to current policies, processes and trends underway in the country
• Research and development focusing on improving the quality of steel
• Training to facilitate resolution of pending technical issues
• Developing adequate financing mechanisms
Cement Production of
blended cement with higher ratio of additives/cement
• Market uncertainty due to negative customer perceptions
• High investment costs for the transportation, storage and handling of fly ash
• Concessions on excise duties, sales tax exemptions and capital subsidies
• R&D • Training programmes for
technical staff • Education and public awareness
programmes • Promotion of PPC and PSC
usage in large construction projects,
• Modification of existing construction codes
Switch to less
carbon intensive fuel in kiln
• Modification of existing systems
• Huge investment cost for alternative fuel handling
• Lack of trained personnel
• Extension programs to facilitate the general use of new (Biomass/less carbon intensive) energy technologies
• R&D in new energy technologies
• Incentives to local entrepreneurs for the production of biomass energy conversion systems
• Training of skilled personnel • Engineering infrastructure for
the local production of components and spare parts for biomass and other less carbon intensive fuels.
Center for Clean Air Policy page 17
Sector Mitigation options
Mitigation Potential
Major Barriers Recommended Policy options
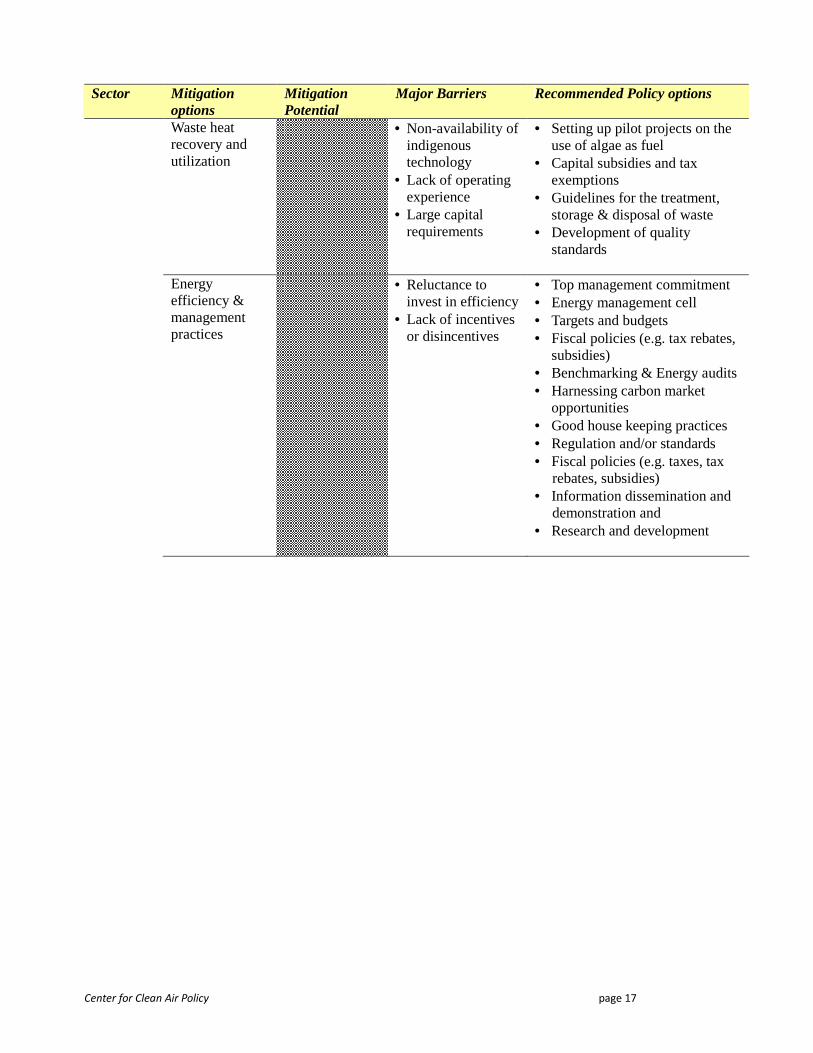
Waste heat recovery and utilization
• Non-availability of indigenous technology
• Lack of operating experience
• Large capital requirements
• Setting up pilot projects on the use of algae as fuel
• Capital subsidies and tax exemptions
• Guidelines for the treatment, storage & disposal of waste
• Development of quality standards
Energy
efficiency & management practices
• Reluctance to invest in efficiency
• Lack of incentives or disincentives
• Top management commitment • Energy management cell • Targets and budgets • Fiscal policies (e.g. tax rebates,
subsidies) • Benchmarking & Energy audits • Harnessing carbon market
opportunities • Good house keeping practices • Regulation and/or standards • Fiscal policies (e.g. taxes, tax
rebates, subsidies) • Information dissemination and
demonstration and • Research and development
Center for Clean Air Policy page 18
II. Electricity Supply Sector
II.A Electricity Supply Sector Background
The currently installed electricity generation capacity in India is approximately 143 GW, with coal being the primary fuel source. Thermal power plants produce more than three quarters of India’s electricity, as a direct consequence of India’s position as the third largest producer of coal in the world. Currently 100% of the installed coal capacity is sub-critical pulverized coal plants. The average efficiencies of coal powered power plants in India is approximately 25% to 34% (HHV).
Despite reforms introducing private participation in the early 1990s, India’s electricity sector has remained dominated by the state owned entities. The most significant reform package in the Indian electricity supply sector has been the introduction of the Electricity Act 2003. The act is a move towards creating a market-based regime in the Indian power sector and consolidates the laws relating to generation, transmission, distribution, trading and use of electricity. Under the act, measures conducive to development of electricity industry are generally taken, thereby promoting competition, protecting interests of consumers and supplying electricity to all areas. The act also takes care of rationalization of electricity tariff ensuring transparent policies including subsidies, promotion of efficient environmentally benign policies, constitution of a Central Electricity Authority and Regulatory Commissions, and establishment of Appellate Tribunals.
Earlier, the Indian power sector was regulated and controlled completely by the government. The initiation of reforms and the passage of Electricity Act 2003 enabled the establishment of independent regulatory agencies. Since the sector has been under government control for decades, the new agencies are slowly enforcing their powers provided under the Act to pass independent and transparent regulations to balance stakeholders’ interest and provide a level playing filed to new entrants.
To maintain the projected economic growth, India needs to add 100 GW of new capacity by 2012. The 2012 capacity target has created a need for approximately 100 billion USD of investments across different segment of the generation sector within just a few years. Advanced coal technologies are increasingly being planned for a portion of power generation in India. The first supercritical coal based electricity generation plant in India is under construction in Sipat, and uses South Korean Technology with planned capacity of 3 x 660 MW. Several ‘Ultra- mega’ projects are also planned with the use of 800 MW supercritical coal electricity generation units.
II.A.1 Overview of Current Installed Capacity
India ranks fifth in the world in terms of installed capacity and accounts for about 4% of the world's total annual electricity generation. The installed capacity has more than doubled from 63 GW during 1990 to 143 GW as on March 2008.
Coal dominates India’s electricity generation capacity mix. Although coal accounts for 53% of installed generation capacity, it contributes to 66% to the total actual electricity generation. India has vast and cheap coal reserves and has therefore coal has emerged as the preferred choice for electricity generation. Coal’s share in the installed capacity has been declining over the years with the thrust towards diversification of fuel resources, including gas, nuclear, hydro and renewable electricity generation.
Hydropower has 25% share in the capacity mix and 17% of the generation mix, due to seasonal and daily variation in water availability. India is endowed with rich hydro potential spread across six river
Center for Clean Air Policy page 19
basins, however, only 24% of the estimated 150 GW hydro potential has been tapped so far.
Nuclear power has maintained a 3% share in the total installed capacity over the years and constitutes 2% share of the total electricity generation. There has been significant drop in the generation since 2002 due to fuel shortages and shut down of plants for safety reasons.
Renewable capacity share in the capacity mix has been growing steadily since 1997 and currently accounts for approximately 8% of the capacity mix and 6% of the generation share. Electricity generation from renewable sources has been one of the fastest growing elements of the Indian energy sector, and includes solar, wind, biomass, and small hydro.
The electric generation market is dominated by state owned facilities with a market share of 52% of the total generated capacity, followed by central (34%) and private (14%) owned facilities. State owned generation units have been around the longest and, thus, account for the largest share. The centrally owned facilities started being developed in mid 1970s and privately owned facilities started being developed in the early 1990s. Private participation in generation has historically been low due to the poor condition of state-owned distribution utilities resulting in high payment default.
India’s fuel resources are unevenly distributed by region, with coal primarily in East and central India, gas in the South and West, and hydro in the North and Northeast. The southern region of India has the largest wind potential and currently the largest regional share of installed renewable capacity.
Over 50% of the installed electric generation capacity is more than 15 years old, with several facilities having completed over one hundred thousand hours of operation. In addition, poor maintenance has resulted in lower efficiency of plants and, as a result, many of these older plants operate at 10 - 20% reduction in efficiency than their designed efficiencies.
II.A.2 Coal Sector in India – Overview
Coal is the primary domestic energy source and accounts for almost 55% of the country’s energy needs. With 10% of the world’s coal reserves, India is third largest coal producer after China and the US. The abundant coal reserves, low prices and high share of coal in electricity generation are likely to further drive the growth of coal electric generation sector in India. However, the inferior quality of coal reserves and current low productivity are likely to remain the major technical challenges for the Indian coal industry.
Projections by the Planning Commission of the Government of India indicate that coal will fuel the power sector for at least the next 3 decades. India is expected to need about 1,350 million tones (MT) of coal by 2021, from increasing demand in several sectors, primarily the power sector which will require approximately 1,160 MT.
The lack of diversity in the type of coal available, in addition to the poor quality and demand supply gap, has forced India to rely on coal imports. Moving forward, the import component of the overall coal market will depend on the supply of domestic coal and on domestic coal policy. Uncertainty in policy could make for increased investment in facilities that require higher quality imported coal, which would continue to maintain a coal imports market, even if the domestic coal sector opens up with future policy and technology.
The power sector is one of the priority sectors for domestic coal allocation, which consumes about 78% of the total coal production. Steel and cement industries are the other big consumers of coal. Lignite reserves in India are also substantial and are largely consumed for power generation. Most of the reserves lie in the southern part of India in the state of Tamil Nadu. Average calorific value of
Center for Clean Air Policy page 20
Indian Lignite is around 2400 Kcal/kg.
• Domestic Coal
Per the Geological Survey of India (GSI) the total in-place coal reserves including “proven”, “inferred” and ”indicated” categories has increased to 257 billion tonnes over the last five years with an annualized growth rate of 10% over the period. Amongst these reserves 53% are considered to be extractable with the current technology available. Of the total proven reserves 83% is non-coking coal, which is most suitable for power sector as compared to any other industry in India suggesting adequate availability to fuel power sector for next few decades. However, the coal reserves may not be as large as estimated to be since reserves estimates includes almost 20 billion tonnes of coal that has already been extracted. Eastern and Central part of India encompasses most of the coal reserves for the country followed by Western and Southern region
Most of coal assets and production houses are central/state government owned and are not open for private participation. Coal India Limited (CIL) and other state owned companies account for 95% of the domestic coal production and are stretched in their current production capability.
Indian coal overall is rated as a poor quality coal. Most of the Indian coal reserves are of low calorific value and high ash + moisture content. As much as 92% of the non-coking coal reserves in Indian basins are of lower grades (C-D-E-F type). Indian coal has high ash content (35 – 45%), high ash fusion temperature, high reactivity and low sulphur content (0.5%). Reserves suitable for power sector are in abundance as other bulk industries cannot afford to compromise over the quality of coal. India’s reserves may be sufficient to support power sector requirements.
Coal beneficiation programmes by the government have not been very fruitful so far. The policies made to date have not been very effective and there is minimal penalty for breaking rules. For example, guidelines issued by Ministry of Environment and Forest (MoEF) in 2001 restricts usage of thermal coal having ash & moisture content greater than 34% for the power plants located 1000 km from the mine and in critically polluted areas. However, the average ash & moisture content of coal used is still well above 40%.
• Imported Coal
Despite an upward revision in domestic production plans, import of coal has grown substantially in the last five years to fill the supply shortfalls. The percentage of imported coal consumption as a part of total coal consumption has grown to 10% in 2006-07 as compared to 6 % in 2003-04. India imports its coal from Indonesia, Australia, South Africa and China. Import duty on coal has been reduced to 5% from as much as 30% duty five years ago.
Center for Clean Air Policy page 21
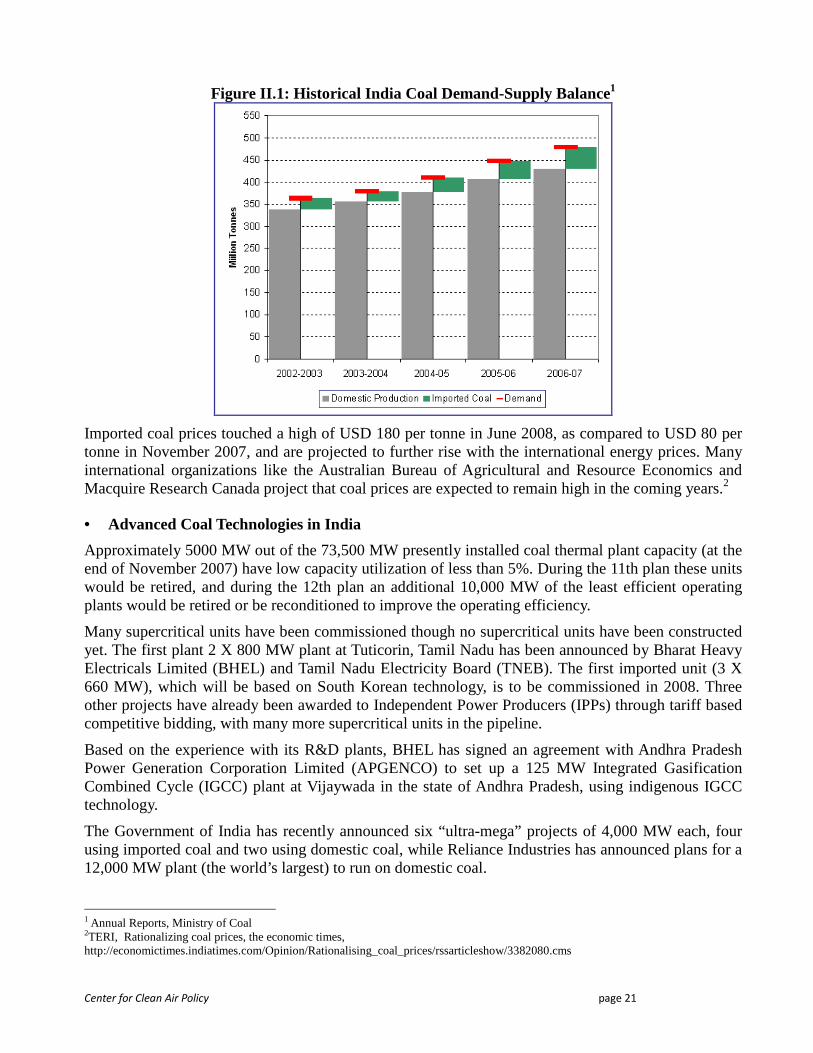
Figure II.1: Historical India Coal Demand-Supply Balance1
Imported coal prices touched a high of USD 180 per tonne in June 2008, as compared to USD 80 per tonne in November 2007, and are projected to further rise with the international energy prices. Many international organizations like the Australian Bureau of Agricultural and Resource Economics and Macquire Research Canada project that coal prices are expected to remain high in the coming years.2
• Advanced Coal Technologies in India
Approximately 5000 MW out of the 73,500 MW presently installed coal thermal plant capacity (at the end of November 2007) have low capacity utilization of less than 5%. During the 11th plan these units would be retired, and during the 12th plan an additional 10,000 MW of the least efficient operating plants would be retired or be reconditioned to improve the operating efficiency.
Many supercritical units have been commissioned though no supercritical units have been constructed yet. The first plant 2 X 800 MW plant at Tuticorin, Tamil Nadu has been announced by Bharat Heavy Electricals Limited (BHEL) and Tamil Nadu Electricity Board (TNEB). The first imported unit (3 X 660 MW), which will be based on South Korean technology, is to be commissioned in 2008. Three other projects have already been awarded to Independent Power Producers (IPPs) through tariff based competitive bidding, with many more supercritical units in the pipeline.
Based on the experience with its R&D plants, BHEL has signed an agreement with Andhra Pradesh Power Generation Corporation Limited (APGENCO) to set up a 125 MW Integrated Gasification Combined Cycle (IGCC) plant at Vijaywada in the state of Andhra Pradesh, using indigenous IGCC technology.
The Government of India has recently announced six “ultra-mega” projects of 4,000 MW each, four using imported coal and two using domestic coal, while Reliance Industries has announced plans for a 12,000 MW plant (the world’s largest) to run on domestic coal.
1 Annual Reports, Ministry of Coal 2TERI, Rationalizing coal prices, the economic times, http://economictimes.indiatimes.com/Opinion/Rationalising_coal_prices/rssarticleshow/3382080.cms
Center for Clean Air Policy page 22
II.A.3 Key Stakeholders
• The Ministry of Power (MoP): The Ministry of Power is the central government institution responsible for overseeing India’s electricity industry. Several authorities and agencies operate centrally under the Ministry of Power, among them the Central Electricity Authority (CEA), which assists the Ministry of Power in technical and economic matters.
• Planning Commission: Planning Commission concerns itself with the building of a long term strategic vision of the future and decide on priorities of nation. It works out sectoral targets and provides promotional stimulus to the economy to grow in the desired direction.
• Central Electricity Regulatory Commission (CERC): CERC is an independent statutory body with quasi-judicial powers. CERC has a mandate to regulate interstate tariff related matters, advise the central government on formulation of the national tariff policy and promote competition and efficiency in the electricity sector. Central sector utilities both in generation and transmission are regulated by CERC.
• State Electricity Regulatory Commissions (SERC): SERCs have jurisdiction over state utilities in generation, transmission and distribution. Independent Power Producers (IPPs) are covered by CERC / SERC depending on whether they sell power to one or more states.
• Central Electricity Authority (CEA): The CEA advises the MoP on all technical and economic matters.
• Central sector power companies: These utilities such as the National Thermal Power Corporation (NTPC) and Power Grid Corporation of India (PGCIL) are controlled by the central government.
• State Electricity Boards (SEBs): Approximately ninety-five percent of Indian consumers get their power supply from the state electricity boards, or the state government owned companies carved out from erstwhile State Electricity Boards. These utilities are owned, operated and regulated by state governments. Utilities are not in a good financial health.
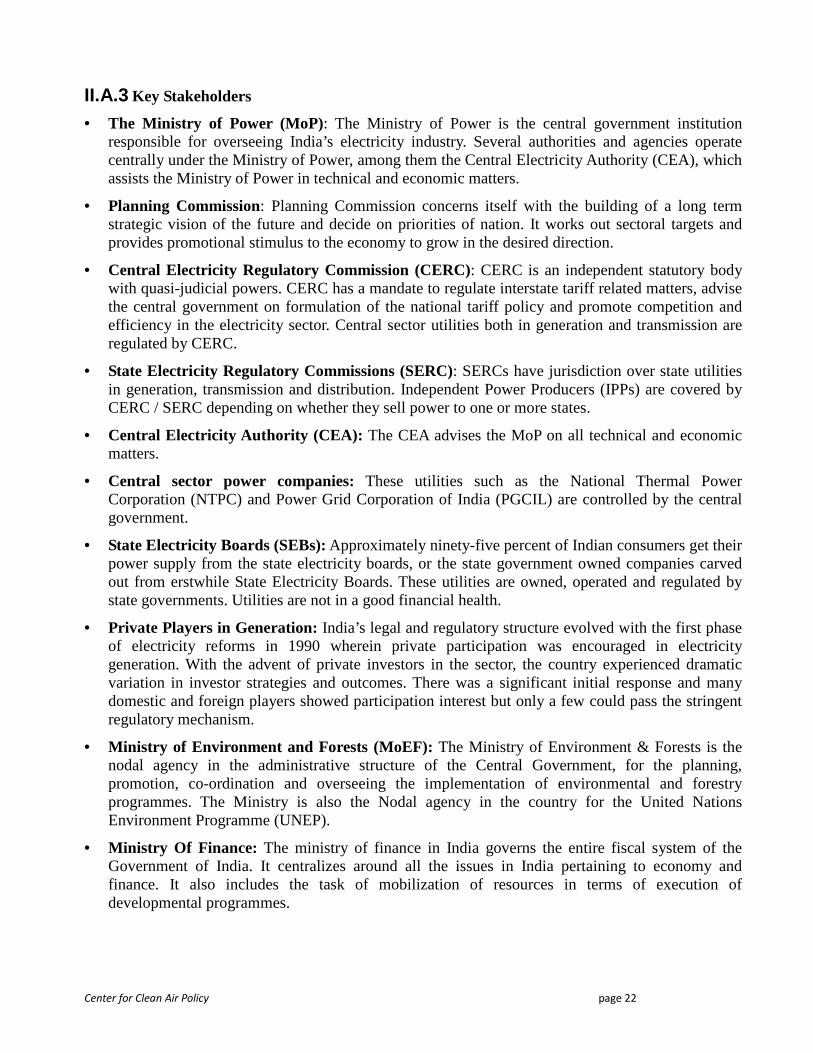
• Private Players in Generation: India’s legal and regulatory structure evolved with the first phase of electricity reforms in 1990 wherein private participation was encouraged in electricity generation. With the advent of private investors in the sector, the country experienced dramatic variation in investor strategies and outcomes. There was a significant initial response and many domestic and foreign players showed participation interest but only a few could pass the stringent regulatory mechanism.
• Ministry of Environment and Forests (MoEF): The Ministry of Environment & Forests is the nodal agency in the administrative structure of the Central Government, for the planning, promotion, co-ordination and overseeing the implementation of environmental and forestry programmes. The Ministry is also the Nodal agency in the country for the United Nations Environment Programme (UNEP).
• Ministry Of Finance: The ministry of finance in India governs the entire fiscal system of the Government of India. It centralizes around all the issues in India pertaining to economy and finance. It also includes the task of mobilization of resources in terms of execution of developmental programmes.
Center for Clean Air Policy page 23
• Department of Science and Technology: DST plays the role of a nodal department for organizing, coordinating and promoting Science & Technology activities in India.
• Centrally owned research organizations: These include the centrally owned organizations such as National Power Training Institute, and Central Power Research Institute that undertake R&D activities.
Figure II.2: Participation of private players in power generation in India
II.B Assumptions and Uncertainties
This study evaluates Integrated Gasification Combined Cycle (IGCC) power generation technology with carbon capture and sequestration (CCS) as a mitigation option in the Indian electricity supply sector. The following assumptions and uncertainties apply to this analysis:
• In the Indian context, imported coal would have to be used for using the commercially better proven entrained flow IGCC gasifiers, while domestic coal can be used with Fluidized bed gasifiers (FBG). Hence in this study, IGCC with imported coal refers to the use of entrained flow gasifiers, and IGCC with domestic coal refers to Fluidized Bed gasifiers.
• A plant running entirely on imported coal is likely to be worst effected by the high and fluctuating prices of imported coal. Typically, the cost of generation at a non-pit head thermal power station using 100% domestic coal is approximately INR 2.60/unit for non-pit head plants and for pithead plants, it is nearly INR 1.54 per unit. But using imported coal (with a price of USD 180 per tonne) the cost of a unit becomes as high as INR 3.65 per unit. IGCC is already a high cost technology, and it becomes costlier with CCS. Operating IGCC with CCS unit with highly priced imported coal in India, doesn’t seem to be a commercially and economically viable option, and IGCC with domestic coal has been considered as the mitigation option explored.
Center for Clean Air Policy page 24
• The efficiencies for IGCC plants and IGCC plants with CCS assumed in this study are expected to improve in the future with technological advances. Conservative estimates for efficiencies have been considered in formulating the emission reduction estimates.
• Since IGCC with FBG is not a commercial technology yet, it is difficult to assess the efficiencies and costs with certainty. A National Energy Technology Laboratory (NETL) study using FBG IGCC technology in 2000 had estimated the efficiencies to be 44 – 48% (HHV) with plant cost of $1100/ KW.
• IGCC and CCS technologies have unique barriers and research on both needs to be encouraged separately to ensure progress on both. Hence IGCC and CCS have been analysed as separate mitigation options and policies suggested to encourage both. The end objective is to be able to use IGCC with CCS technology in India in the long term.
II.C Mitigation option: Coal-based IGCC
II.C.1 Sector Background
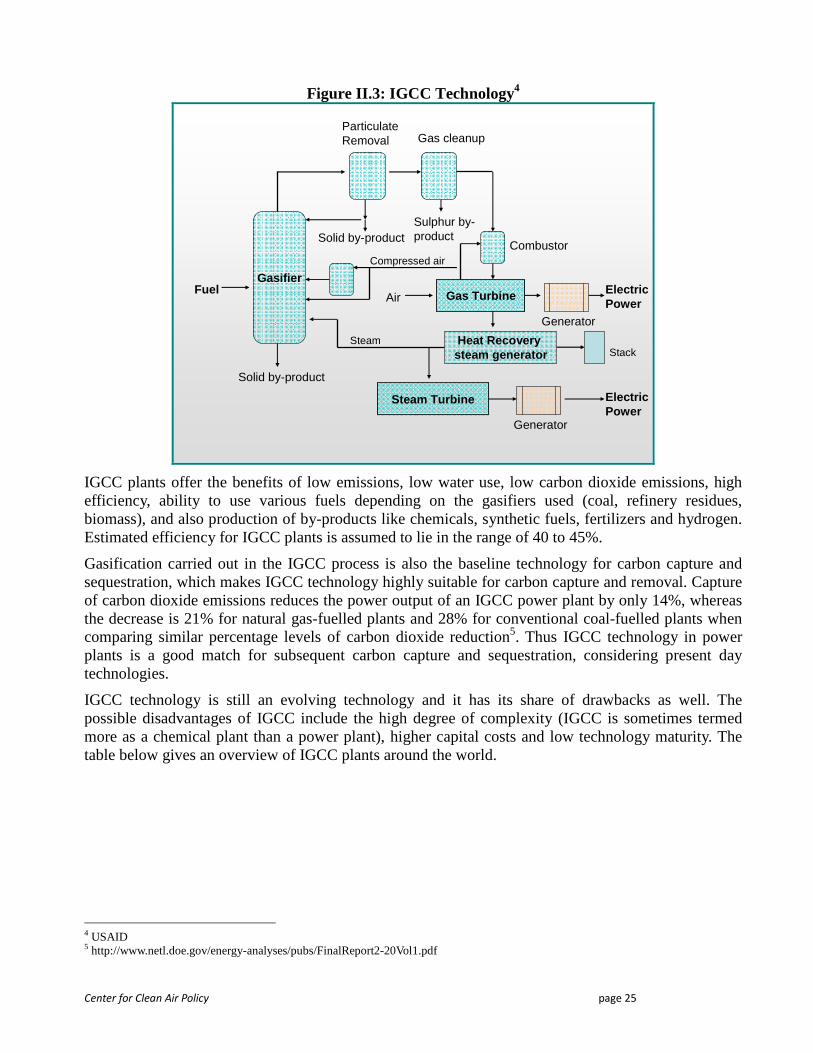
An IGCC plant is a combination of both combined cycle and gasification plant. The coal is gasified into synthetic gas (syngas), which is then used as fuel for electricity generation in a combined cycle operation. The operation of the IGCC plant can be summarized as:
1. The feedstock (coal in this case) is gasified in an air or oxygen blown gasifier at high temperature and pressure.
2. This gasification results in the production of synthetic gas (syngas) which is made up of carbon monoxide and hydrogen; this syngas is then combusted in a gas turbine.
3. The hot exhaust gases from the gas turbine are used to produce steam to drive a steam turbine.
Hence power is produced both from the gas and the steam turbines. In an IGCC installation, typically 60-70% of the power comes from the gas turbine.3
3 http://www.worldenergy.org/documents/scenariosgeneration.pdf
Center for Clean Air Policy page 25
Figure II.3: IGCC Technology4
Gasifier
Solid by-product
Fuel
Particulate Removal Gas cleanup
Solid by-productSulphur by-product
Gas TurbineAir
Heat Recovery steam generator
Steam
Steam Turbine Electric Power
Generator
Combustor
Electric Power
Generator
Compressed air
Stack
IGCC plants offer the benefits of low emissions, low water use, low carbon dioxide emissions, high efficiency, ability to use various fuels depending on the gasifiers used (coal, refinery residues, biomass), and also production of by-products like chemicals, synthetic fuels, fertilizers and hydrogen. Estimated efficiency for IGCC plants is assumed to lie in the range of 40 to 45%.
Gasification carried out in the IGCC process is also the baseline technology for carbon capture and sequestration, which makes IGCC technology highly suitable for carbon capture and removal. Capture of carbon dioxide emissions reduces the power output of an IGCC power plant by only 14%, whereas the decrease is 21% for natural gas-fuelled plants and 28% for conventional coal-fuelled plants when comparing similar percentage levels of carbon dioxide reduction5. Thus IGCC technology in power plants is a good match for subsequent carbon capture and sequestration, considering present day technologies.
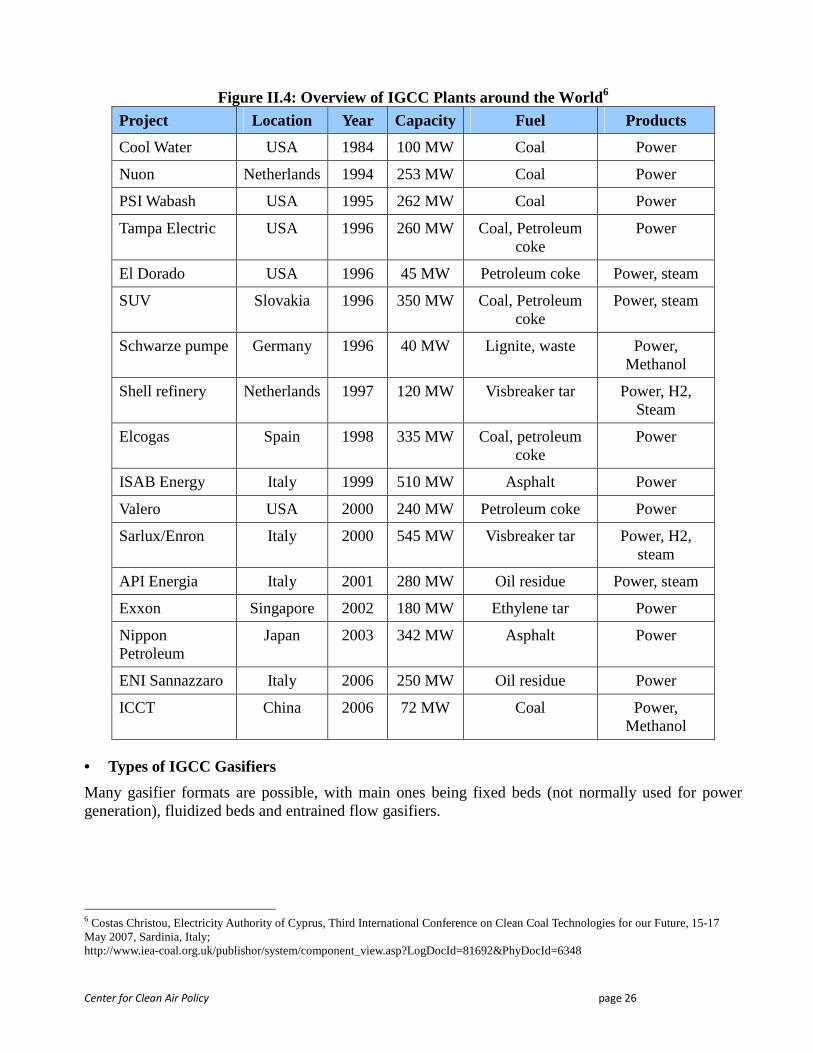
IGCC technology is still an evolving technology and it has its share of drawbacks as well. The possible disadvantages of IGCC include the high degree of complexity (IGCC is sometimes termed more as a chemical plant than a power plant), higher capital costs and low technology maturity. The table below gives an overview of IGCC plants around the world.
4 USAID 5 http://www.netl.doe.gov/energy-analyses/pubs/FinalReport2-20Vol1.pdf
Center for Clean Air Policy page 26
Figure II.4: Overview of IGCC Plants around the World6 Project Location Year Capacity Fuel Products
Cool Water USA 1984 100 MW Coal Power
Nuon Netherlands 1994 253 MW Coal Power
PSI Wabash USA 1995 262 MW Coal Power
Tampa Electric USA 1996 260 MW Coal, Petroleum coke
Power
El Dorado USA 1996 45 MW Petroleum coke Power, steam
SUV Slovakia 1996 350 MW Coal, Petroleum coke
Power, steam
Schwarze pumpe Germany 1996 40 MW Lignite, waste Power, Methanol
Shell refinery Netherlands 1997 120 MW Visbreaker tar Power, H2, Steam
Elcogas Spain 1998 335 MW Coal, petroleum coke
Power
ISAB Energy Italy 1999 510 MW Asphalt Power
Valero USA 2000 240 MW Petroleum coke Power
Sarlux/Enron Italy 2000 545 MW Visbreaker tar Power, H2, steam
API Energia Italy 2001 280 MW Oil residue Power, steam
Exxon Singapore 2002 180 MW Ethylene tar Power
Nippon Petroleum
Japan 2003 342 MW Asphalt Power
ENI Sannazzaro Italy 2006 250 MW Oil residue Power
ICCT China 2006 72 MW Coal Power, Methanol
• Types of IGCC Gasifiers
Many gasifier formats are possible, with main ones being fixed beds (not normally used for power generation), fluidized beds and entrained flow gasifiers.
6 Costas Christou, Electricity Authority of Cyprus, Third International Conference on Clean Coal Technologies for our Future, 15-17 May 2007, Sardinia, Italy; http://www.iea-coal.org.uk/publishor/system/component_view.asp?LogDocId=81692&PhyDocId=6348
Center for Clean Air Policy page 27
Entrained Flow Gasifiers: IGCC with imported coal technology, if implemented in India, would use entrained flow gasifier technology with imported coal as fuel. The demonstration units for IGCC operating in the US and Europe , with an average size of approximately 250 MWe,7 mainly use oxygen blown entrained flow gasifier technology, which is unsuited to high ash Indian coal. Hence the use this technology in India necessitates importing coal and using it for power generation. Entrained flow gasifiers also require a separate sulphur removal plant before the coal is gasified.
Major oil and chemical companies, such as Texaco, Dow, Shell, etc., have invested in developing entrained-flow gasification technology for both oil and coal-based feedstock in the United States and Europe. All the IGCC plants with entrained flow gasifiers have been reported to have been performing with efficiency in the range of 38-43% with Higher Heating Value (HHV) coal.
Fluidized Bed Gasifiers: The fluidized bed gasifier provides for a greater flexibility in fuel usage – high ash coals, biomass and waste can be used, provided the feedstock have a high ash fusion temperature. Hence domestic (Indian) coal can be used in the fluidized bed gasifiers. However, fluidized bed gasifiers can not be used for gasifying liquid fuels, hence it also restricts the use of low reactivity feedstock like petroleum coke.
Just like entrained gasifier IGCCs, fluidized bed gasifiers are also expected to have higher efficiencies in the future with technological improvements. Fluidized bed IGCCs don’t require a separate sulphur removal plant as is the case with entrained flow gasifiers. Typically, large quantities of solid waste is produced and disposing of it could become an issue. In some cased the solid waste produced could have enough carbon to classify it to be further combusted. 8Commercial suppliers of gasifiers for the fluidized bed IGCC technology include the High Temperature Winkler (HTW), Kellogg Rust Westinghouse (KRW) and Mitsui Babcok gasifier designs.9 Few of these systems are currently in operation.10 FBG based IGCC is still not a fully commercial technology.
• IGCC Technology in India
Entrained flow gasifiers have already been in use in India for making fertilizers using fuel oil as the feedstock. However, none of the coal and lignite based gasifiers were successful with high ash Indian coal and they have since been decommissioned. The chronology of events provided below shows the efforts regarding IGCC technology in India.
7 IEA clean coal centre 8 Chikkatur Anant, Ambuj Sagar, Towards a clean coal roadmap 9 BHEL, http://www.ciigbc.org/documents/Thermal%20.pdf 10 Financing IGCC – 3Party Covenant
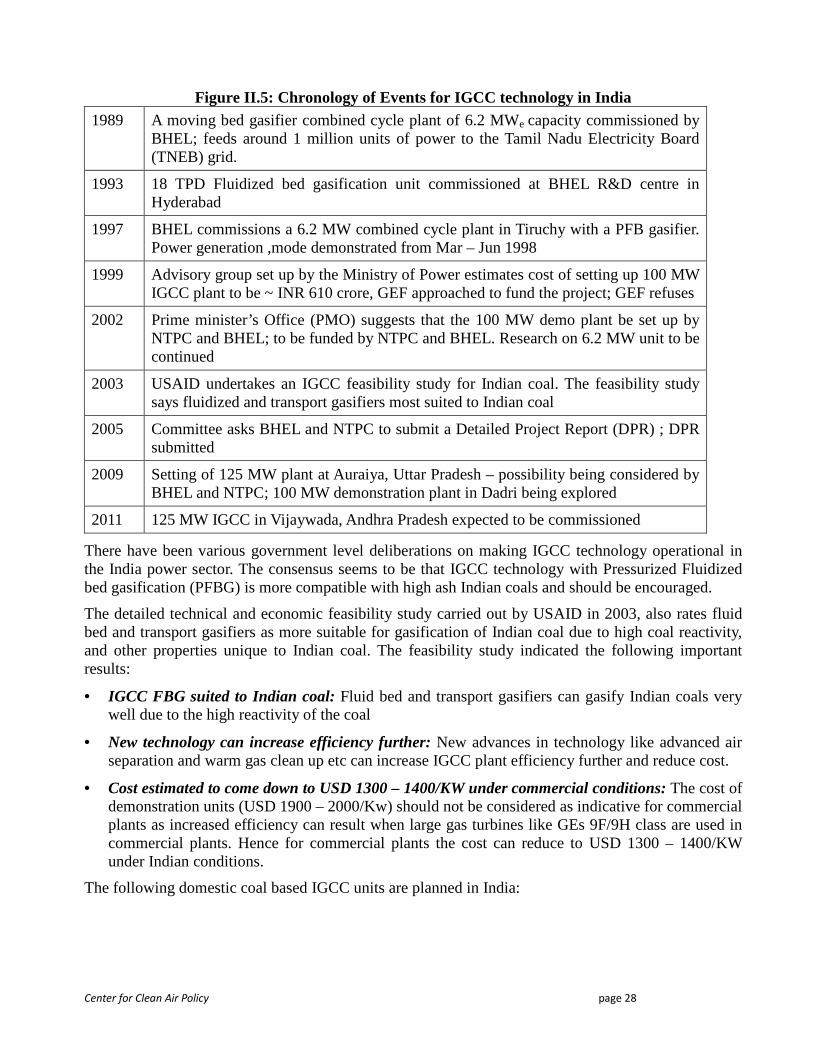
Center for Clean Air Policy page 28
Figure II.5: Chronology of Events for IGCC technology in India 1989 A moving bed gasifier combined cycle plant of 6.2 MWe capacity commissioned by
BHEL; feeds around 1 million units of power to the Tamil Nadu Electricity Board (TNEB) grid.
1993 18 TPD Fluidized bed gasification unit commissioned at BHEL R&D centre in Hyderabad
1997 BHEL commissions a 6.2 MW combined cycle plant in Tiruchy with a PFB gasifier. Power generation ,mode demonstrated from Mar – Jun 1998
1999 Advisory group set up by the Ministry of Power estimates cost of setting up 100 MW IGCC plant to be ~ INR 610 crore, GEF approached to fund the project; GEF refuses
2002 Prime minister’s Office (PMO) suggests that the 100 MW demo plant be set up by NTPC and BHEL; to be funded by NTPC and BHEL. Research on 6.2 MW unit to be continued
2003 USAID undertakes an IGCC feasibility study for Indian coal. The feasibility study says fluidized and transport gasifiers most suited to Indian coal
2005 Committee asks BHEL and NTPC to submit a Detailed Project Report (DPR) ; DPR submitted
2009 Setting of 125 MW plant at Auraiya, Uttar Pradesh – possibility being considered by BHEL and NTPC; 100 MW demonstration plant in Dadri being explored
2011 125 MW IGCC in Vijaywada, Andhra Pradesh expected to be commissioned
There have been various government level deliberations on making IGCC technology operational in the India power sector. The consensus seems to be that IGCC technology with Pressurized Fluidized bed gasification (PFBG) is more compatible with high ash Indian coals and should be encouraged.
The detailed technical and economic feasibility study carried out by USAID in 2003, also rates fluid bed and transport gasifiers as more suitable for gasification of Indian coal due to high coal reactivity, and other properties unique to Indian coal. The feasibility study indicated the following important results:
• IGCC FBG suited to Indian coal: Fluid bed and transport gasifiers can gasify Indian coals very well due to the high reactivity of the coal
• New technology can increase efficiency further: New advances in technology like advanced air separation and warm gas clean up etc can increase IGCC plant efficiency further and reduce cost.
• Cost estimated to come down to USD 1300 – 1400/KW under commercial conditions: The cost of demonstration units (USD 1900 – 2000/Kw) should not be considered as indicative for commercial plants as increased efficiency can result when large gas turbines like GEs 9F/9H class are used in commercial plants. Hence for commercial plants the cost can reduce to USD 1300 – 1400/KW under Indian conditions.
The following domestic coal based IGCC units are planned in India:
Center for Clean Air Policy page 29
• 100 MW demonstration IGCC at NTPC Dadri – To be located at NTPC’s Dadri power station This plant would be using U-gas gasifier and GE 6FA gas turbine, besides using Indian Run of mines (ROM) coal.
• 125 MW plant in Vijaywada, Andhra Pradesh, IGCC: BHEL and Andhra Pradesh Power Generation Corporation Limited (APGENCO) have signed an agreement to set up a 125 MW plant in Vijaywada, Andhra Pradesh, as a demonstration IGCC plant. It had been proposed by the working group in the 11th plan in 2006 that the balance amount of INR 3500 million be contributed by the Government of India, as grants-in-aid to the project. However, according to a recent agreement between BHEL and APGENCO, the plant will cost around INR 9500 million of which INR 4200 million will be contributed by BHEL and the remaining INR 5300 million would be APGENCO’s contribution. The project is scheduled for commissioning in mid 201111
Indigenously developed FBG technology is better suited for Indian coal in the context of IGCC. Entrained bed gasifiers that can only come into operation with imported coal do not seem viable for large scale implementation, when seen in the context of energy security, economics and the highly volatile prices of imported coal. However, the use of IGCC entrained flow gasifiers for using oil based feedstock, such as pet-coke, heavy oils, refinery residues etc may be a viable option, and needs techno-economic feasibility studies. IGCC plants can be built next to oil refineries to utilize refinery residue as feedstock in IGCC plants. There are some such projects being carried out in different parts of the world. Examples: Sarlux IGCC, ISAB energy, API Energia projects in Italy and Negishi project in Japan. Oil companies in India may want to consider this technology as an option; An added bonus in this approach (using refinery residues as feedstock in IGCC plants) is that the IGCC entrained flow gasifier would gain from the benefit of the experience that this technology is gaining in implementation in other countries like the US and Europe. Hence it is useful to formulate policy options in the context of encouraging IGCC with domestic coal and refinery residues as feedstock.
11 Business standard July 2008 http://www.business-standard.com/india/storypage.php?tp=on&autono=41257
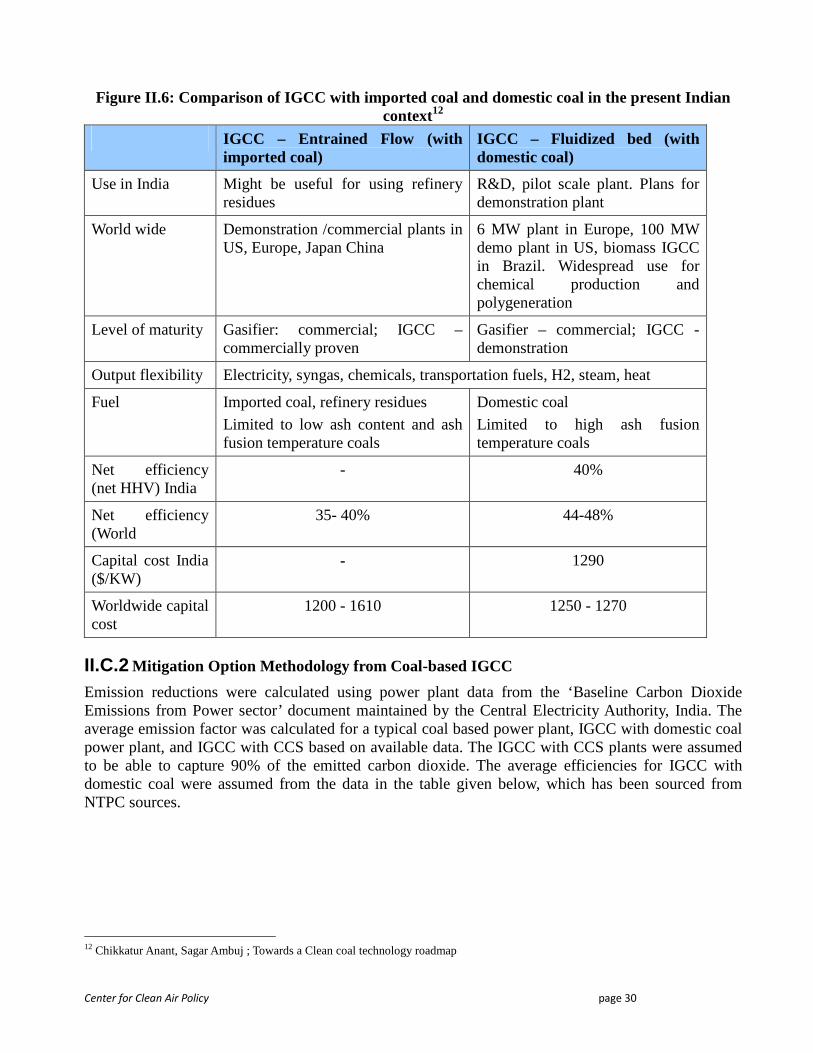
Center for Clean Air Policy page 30
Figure II.6: Comparison of IGCC with imported coal and domestic coal in the present Indian context12
IGCC – Entrained Flow (with imported coal)
IGCC – Fluidized bed (with domestic coal)
Use in India Might be useful for using refinery residues
R&D, pilot scale plant. Plans for demonstration plant
World wide Demonstration /commercial plants in US, Europe, Japan China
6 MW plant in Europe, 100 MW demo plant in US, biomass IGCC in Brazil. Widespread use for chemical production and polygeneration
Level of maturity Gasifier: commercial; IGCC – commercially proven
Gasifier – commercial; IGCC - demonstration
Output flexibility Electricity, syngas, chemicals, transportation fuels, H2, steam, heat
Fuel Imported coal, refinery residues
Limited to low ash content and ash fusion temperature coals
Domestic coal
Limited to high ash fusion temperature coals
Net efficiency (net HHV) India
- 40%
Net efficiency (World
35- 40% 44-48%
Capital cost India ($/KW)
- 1290
Worldwide capital cost
1200 - 1610 1250 - 1270
II.C.2 Mitigation Option Methodology from Coal-based IGCC
Emission reductions were calculated using power plant data from the ‘Baseline Carbon Dioxide Emissions from Power sector’ document maintained by the Central Electricity Authority, India. The average emission factor was calculated for a typical coal based power plant, IGCC with domestic coal power plant, and IGCC with CCS based on available data. The IGCC with CCS plants were assumed to be able to capture 90% of the emitted carbon dioxide. The average efficiencies for IGCC with domestic coal were assumed from the data in the table given below, which has been sourced from NTPC sources.
12 Chikkatur Anant, Sagar Ambuj ; Towards a Clean coal technology roadmap
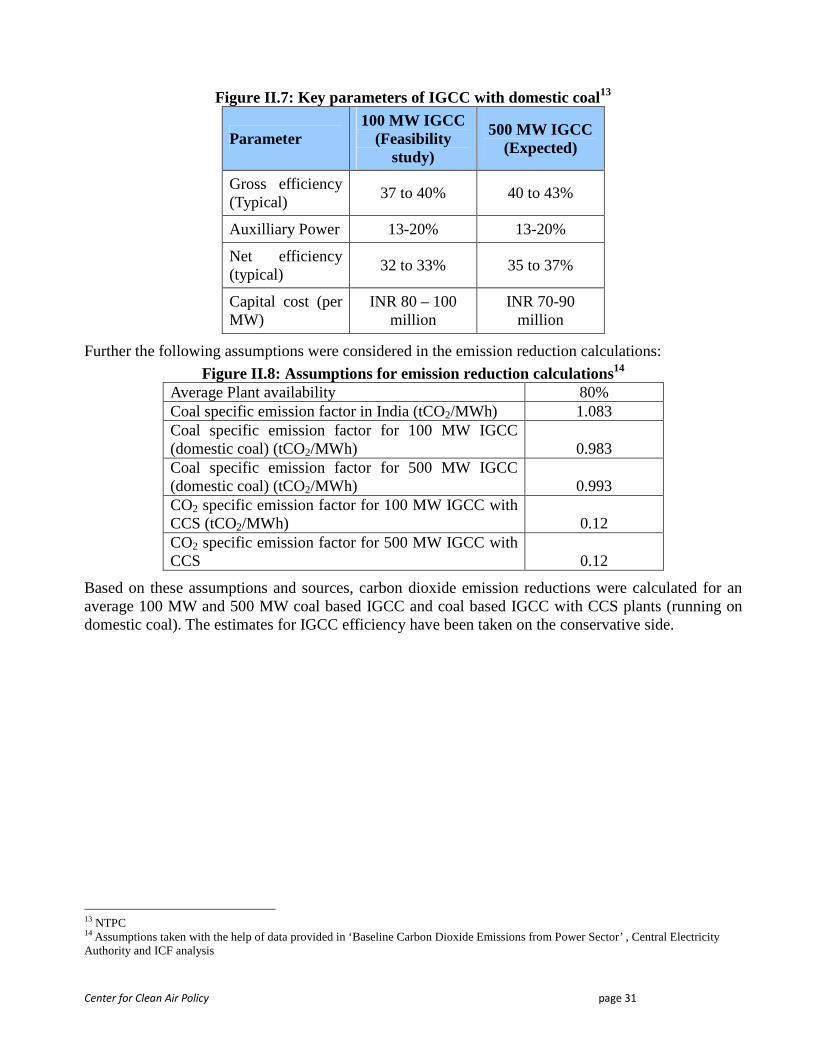
Center for Clean Air Policy page 31
Figure II.7: Key parameters of IGCC with domestic coal13
Parameter 100 MW IGCC
(Feasibility study)
500 MW IGCC (Expected)
Gross efficiency (Typical)
37 to 40% 40 to 43%
Auxilliary Power 13-20% 13-20%
Net efficiency (typical)
32 to 33% 35 to 37%
Capital cost (per MW)
INR 80 – 100 million
INR 70-90 million
Further the following assumptions were considered in the emission reduction calculations:
Figure II.8: Assumptions for emission reduction calculations14 Average Plant availability 80% Coal specific emission factor in India (tCO2/MWh) 1.083 Coal specific emission factor for 100 MW IGCC (domestic coal) (tCO2/MWh) 0.983 Coal specific emission factor for 500 MW IGCC (domestic coal) (tCO2/MWh) 0.993 CO2 specific emission factor for 100 MW IGCC with CCS (tCO2/MWh) 0.12 CO2 specific emission factor for 500 MW IGCC with CCS 0.12
Based on these assumptions and sources, carbon dioxide emission reductions were calculated for an average 100 MW and 500 MW coal based IGCC and coal based IGCC with CCS plants (running on domestic coal). The estimates for IGCC efficiency have been taken on the conservative side.
13 NTPC 14 Assumptions taken with the help of data provided in ‘Baseline Carbon Dioxide Emissions from Power Sector’ , Central Electricity Authority and ICF analysis
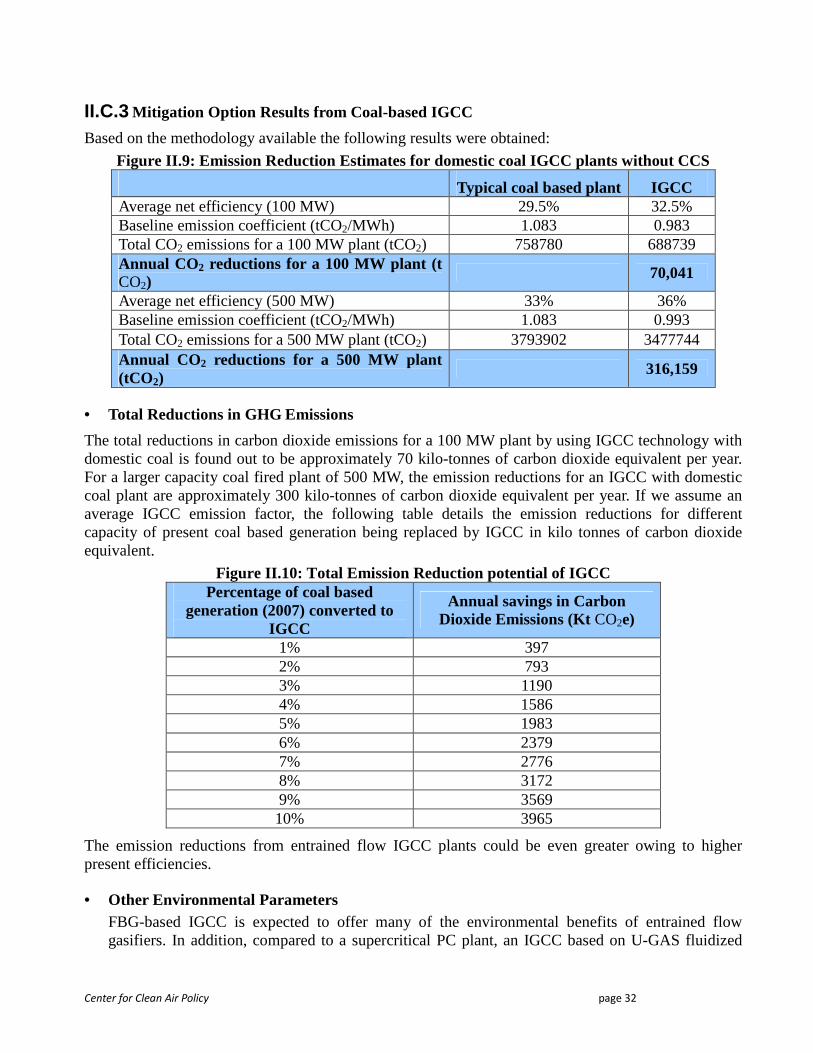
Center for Clean Air Policy page 32
II.C.3 Mitigation Option Results from Coal-based IGCC
Based on the methodology available the following results were obtained:
Figure II.9: Emission Reduction Estimates for domestic coal IGCC plants without CCS
Typical coal based plant IGCC Average net efficiency (100 MW) 29.5% 32.5% Baseline emission coefficient (tCO2/MWh) 1.083 0.983 Total CO2 emissions for a 100 MW plant (tCO2) 758780 688739 Annual CO2 reductions for a 100 MW plant (t CO2)
70,041
Average net efficiency (500 MW) 33% 36% Baseline emission coefficient (tCO2/MWh) 1.083 0.993 Total CO2 emissions for a 500 MW plant (tCO2) 3793902 3477744 Annual CO2 reductions for a 500 MW plant (tCO2)
316,159
• Total Reductions in GHG Emissions
The total reductions in carbon dioxide emissions for a 100 MW plant by using IGCC technology with domestic coal is found out to be approximately 70 kilo-tonnes of carbon dioxide equivalent per year. For a larger capacity coal fired plant of 500 MW, the emission reductions for an IGCC with domestic coal plant are approximately 300 kilo-tonnes of carbon dioxide equivalent per year. If we assume an average IGCC emission factor, the following table details the emission reductions for different capacity of present coal based generation being replaced by IGCC in kilo tonnes of carbon dioxide equivalent.
Figure II.10: Total Emission Reduction potential of IGCC Percentage of coal based
generation (2007) converted to IGCC
Annual savings in Carbon Dioxide Emissions (Kt CO2e)
1% 397 2% 793 3% 1190 4% 1586 5% 1983 6% 2379 7% 2776 8% 3172 9% 3569 10% 3965
The emission reductions from entrained flow IGCC plants could be even greater owing to higher present efficiencies.
• Other Environmental Parameters FBG-based IGCC is expected to offer many of the environmental benefits of entrained flow gasifiers. In addition, compared to a supercritical PC plant, an IGCC based on U-GAS fluidized
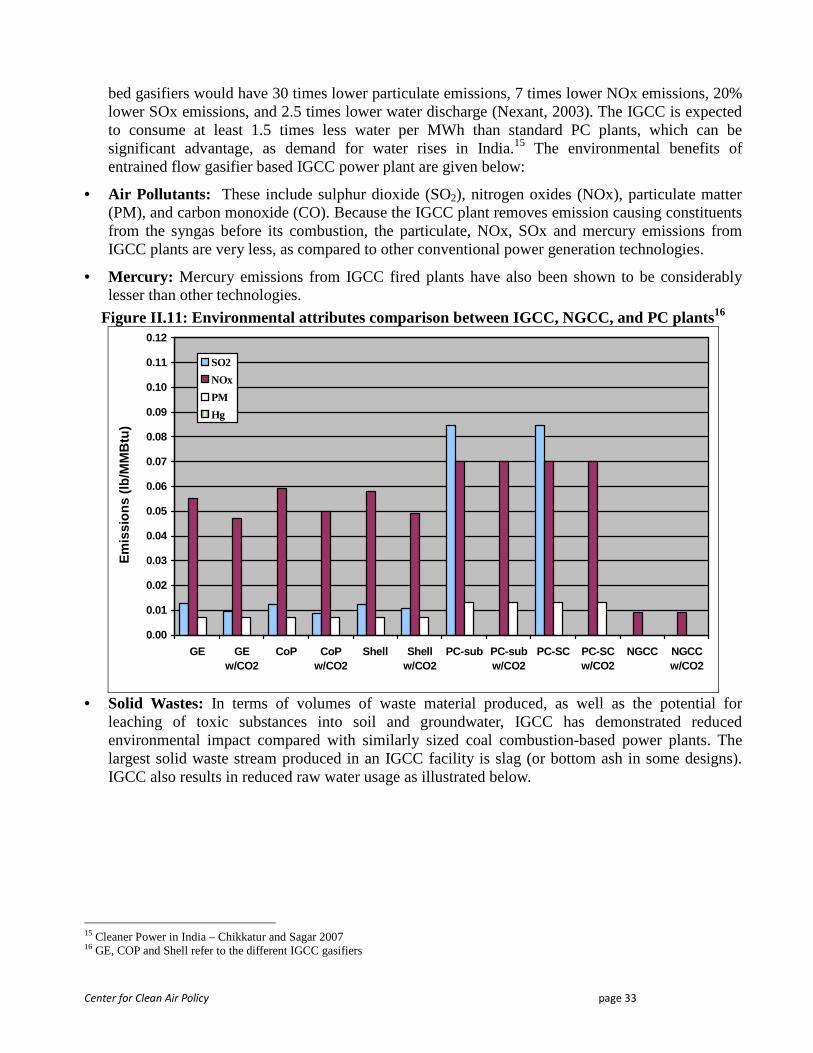
Center for Clean Air Policy page 33
bed gasifiers would have 30 times lower particulate emissions, 7 times lower NOx emissions, 20% lower SOx emissions, and 2.5 times lower water discharge (Nexant, 2003). The IGCC is expected to consume at least 1.5 times less water per MWh than standard PC plants, which can be significant advantage, as demand for water rises in India.15 The environmental benefits of entrained flow gasifier based IGCC power plant are given below:
• Air Pollutants: These include sulphur dioxide (SO2), nitrogen oxides (NOx), particulate matter (PM), and carbon monoxide (CO). Because the IGCC plant removes emission causing constituents from the syngas before its combustion, the particulate, NOx, SOx and mercury emissions from IGCC plants are very less, as compared to other conventional power generation technologies.
• Mercury: Mercury emissions from IGCC fired plants have also been shown to be considerably lesser than other technologies.
Figure II.11: Environmental attributes comparison between IGCC, NGCC, and PC plants16
0.00
0.01
0.02
0.03
0.04
0.05
0.06
0.07
0.08
0.09
0.10
0.11
0.12
GE GEw/CO2
CoP CoPw/CO2
Shell Shellw/CO2
PC-sub PC-subw/CO2
PC-SC PC-SCw/CO2
NGCC NGCCw/CO2
Em
issi
ons
(lb/M
MB
tu)
SO2
NOx
PM
Hg
• Solid Wastes: In terms of volumes of waste material produced, as well as the potential for
leaching of toxic substances into soil and groundwater, IGCC has demonstrated reduced environmental impact compared with similarly sized coal combustion-based power plants. The largest solid waste stream produced in an IGCC facility is slag (or bottom ash in some designs). IGCC also results in reduced raw water usage as illustrated below.
15 Cleaner Power in India – Chikkatur and Sagar 2007 16 GE, COP and Shell refer to the different IGCC gasifiers
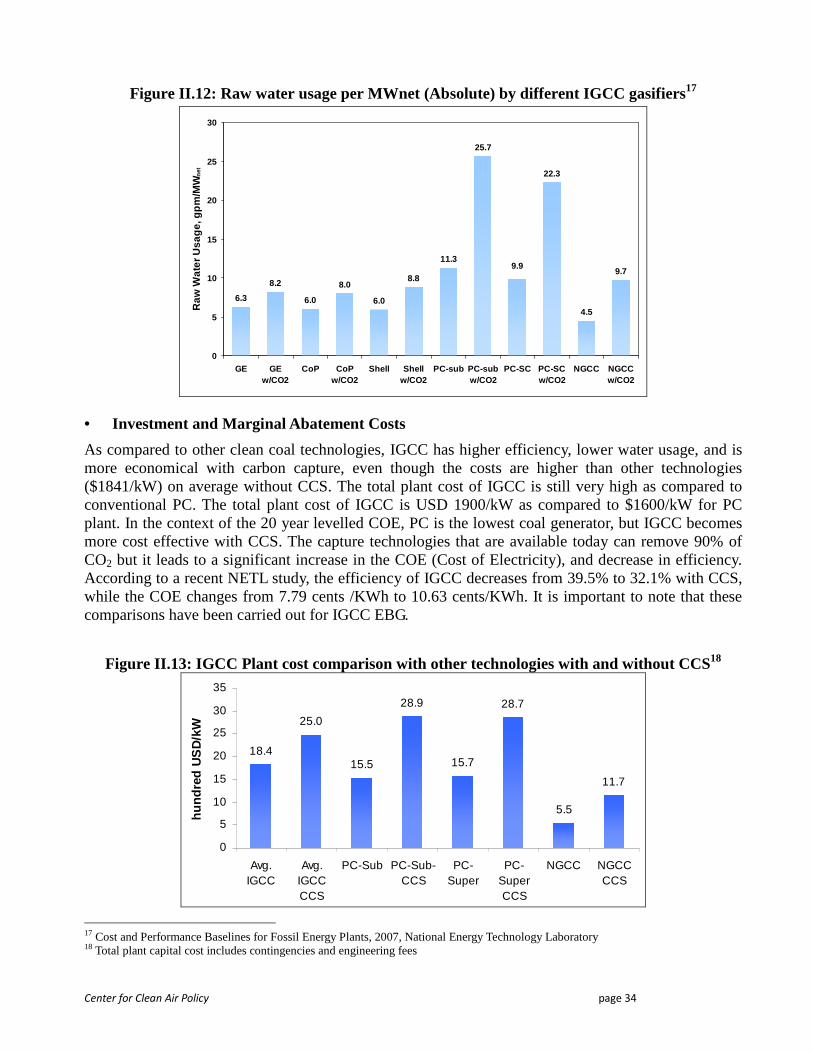
Center for Clean Air Policy page 34
Figure II.12: Raw water usage per MWnet (Absolute) by different IGCC gasifiers17
6.3
8.2
6.0
8.0
6.0
8.8
11.3
25.7
22.3
4.5
9.79.9
0
5
10
15
20
25
30
GE GEw/CO2
CoP CoPw/CO2
Shell Shellw/CO2
PC-sub PC-subw/CO2
PC-SC PC-SCw/CO2
NGCC NGCCw/CO2
Raw
Wat
er U
sage
, gpm
/MW
net
• Investment and Marginal Abatement Costs
As compared to other clean coal technologies, IGCC has higher efficiency, lower water usage, and is more economical with carbon capture, even though the costs are higher than other technologies ($1841/kW) on average without CCS. The total plant cost of IGCC is still very high as compared to conventional PC. The total plant cost of IGCC is USD 1900/kW as compared to $1600/kW for PC plant. In the context of the 20 year levelled COE, PC is the lowest coal generator, but IGCC becomes more cost effective with CCS. The capture technologies that are available today can remove 90% of CO2 but it leads to a significant increase in the COE (Cost of Electricity), and decrease in efficiency. According to a recent NETL study, the efficiency of IGCC decreases from 39.5% to 32.1% with CCS, while the COE changes from 7.79 cents /KWh to 10.63 cents/KWh. It is important to note that these comparisons have been carried out for IGCC EBG.
Figure II.13: IGCC Plant cost comparison with other technologies with and without CCS18
18.4
25.0
15.5
28.9
15.7
28.7
5.5
11.7
0
5
10
15
20
25
30
35
Avg.IGCC
Avg.IGCCCCS
PC-Sub PC-Sub-CCS
PC-Super
PC-SuperCCS
NGCC NGCCCCS
hund
red
US
D/k
W
17 Cost and Performance Baselines for Fossil Energy Plants, 2007, National Energy Technology Laboratory 18 Total plant capital cost includes contingencies and engineering fees
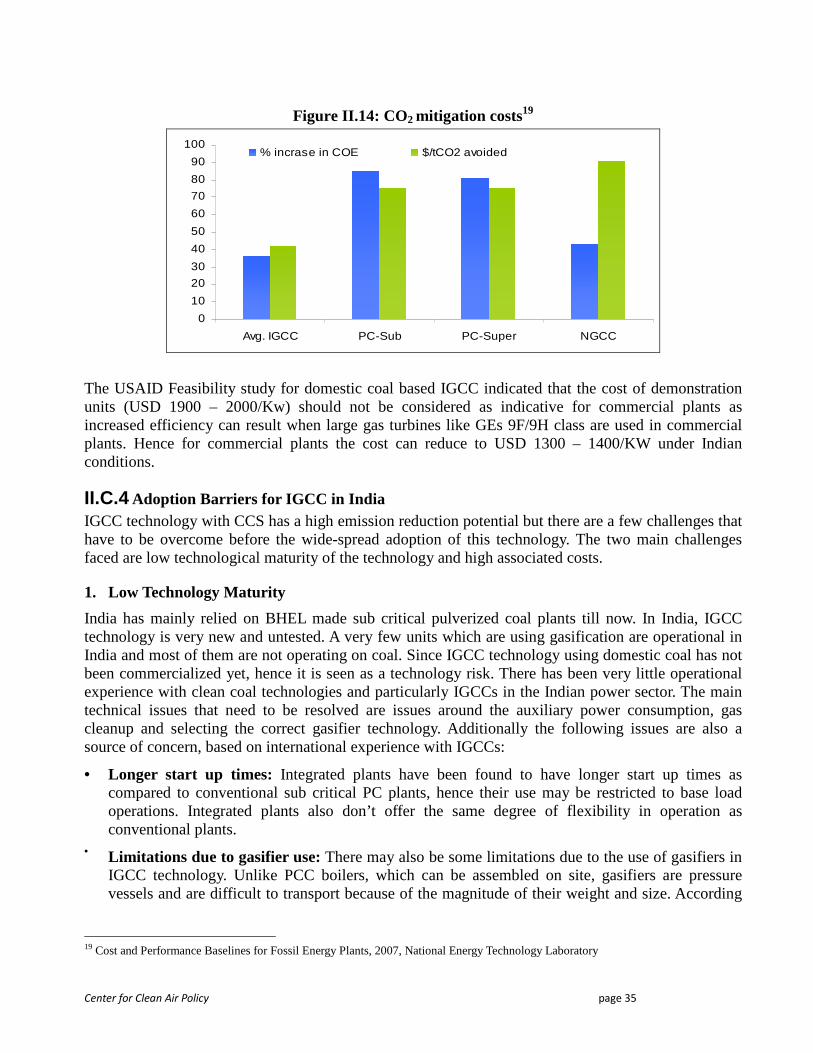
Center for Clean Air Policy page 35
Figure II.14: CO2 mitigation costs19
0
10
20
30
40
50
60
70
80
90
100
Avg. IGCC PC-Sub PC-Super NGCC
% incrase in COE $/tCO2 avoided
The USAID Feasibility study for domestic coal based IGCC indicated that the cost of demonstration units (USD 1900 – 2000/Kw) should not be considered as indicative for commercial plants as increased efficiency can result when large gas turbines like GEs 9F/9H class are used in commercial plants. Hence for commercial plants the cost can reduce to USD 1300 – 1400/KW under Indian conditions.
II.C.4 Adoption Barriers for IGCC in India IGCC technology with CCS has a high emission reduction potential but there are a few challenges that have to be overcome before the wide-spread adoption of this technology. The two main challenges faced are low technological maturity of the technology and high associated costs.
1. Low Technology Maturity
India has mainly relied on BHEL made sub critical pulverized coal plants till now. In India, IGCC technology is very new and untested. A very few units which are using gasification are operational in India and most of them are not operating on coal. Since IGCC technology using domestic coal has not been commercialized yet, hence it is seen as a technology risk. There has been very little operational experience with clean coal technologies and particularly IGCCs in the Indian power sector. The main technical issues that need to be resolved are issues around the auxiliary power consumption, gas cleanup and selecting the correct gasifier technology. Additionally the following issues are also a source of concern, based on international experience with IGCCs:
• Longer start up times: Integrated plants have been found to have longer start up times as compared to conventional sub critical PC plants, hence their use may be restricted to base load operations. Integrated plants also don’t offer the same degree of flexibility in operation as conventional plants.
• Limitations due to gasifier use: There may also be some limitations due to the use of gasifiers in IGCC technology. Unlike PCC boilers, which can be assembled on site, gasifiers are pressure vessels and are difficult to transport because of the magnitude of their weight and size. According
19 Cost and Performance Baselines for Fossil Energy Plants, 2007, National Energy Technology Laboratory
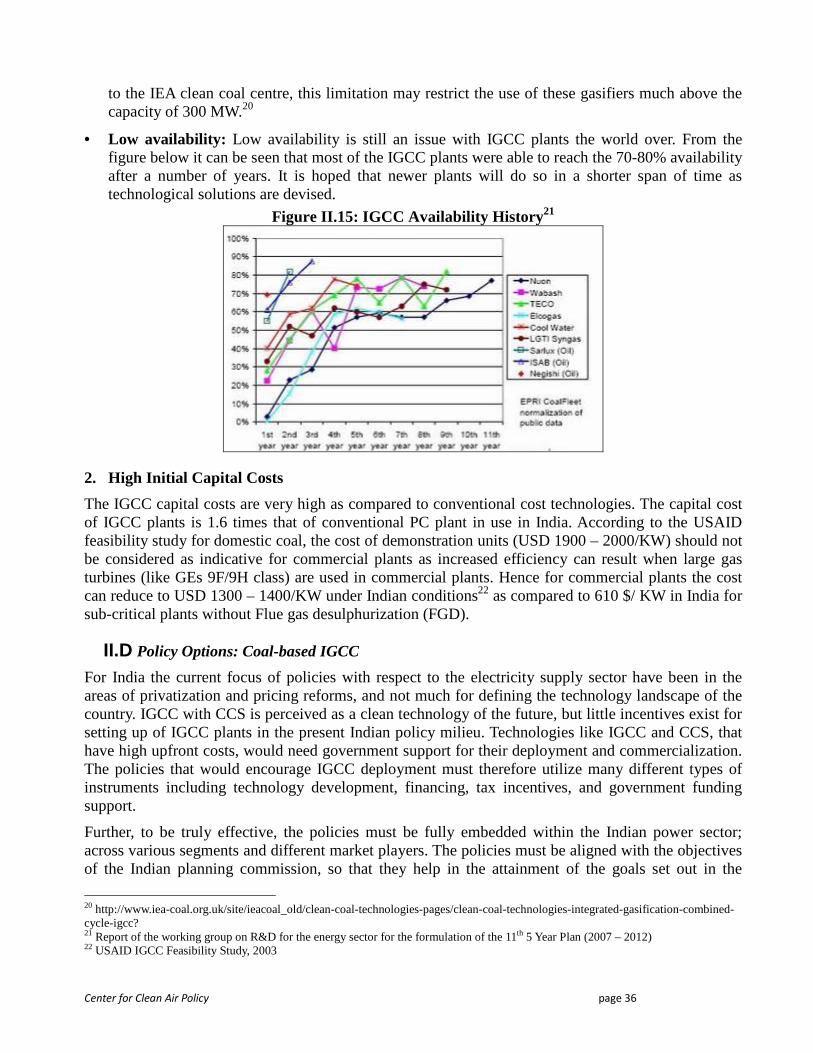
Center for Clean Air Policy page 36
to the IEA clean coal centre, this limitation may restrict the use of these gasifiers much above the capacity of 300 MW.20
• Low availability: Low availability is still an issue with IGCC plants the world over. From the figure below it can be seen that most of the IGCC plants were able to reach the 70-80% availability after a number of years. It is hoped that newer plants will do so in a shorter span of time as technological solutions are devised.
Figure II.15: IGCC Availability History 21
2. High Initial Capital Costs
The IGCC capital costs are very high as compared to conventional cost technologies. The capital cost of IGCC plants is 1.6 times that of conventional PC plant in use in India. According to the USAID feasibility study for domestic coal, the cost of demonstration units (USD 1900 – 2000/KW) should not be considered as indicative for commercial plants as increased efficiency can result when large gas turbines (like GEs 9F/9H class) are used in commercial plants. Hence for commercial plants the cost can reduce to USD 1300 – 1400/KW under Indian conditions22 as compared to 610 $/ KW in India for sub-critical plants without Flue gas desulphurization (FGD).
II.D Policy Options: Coal-based IGCC
For India the current focus of policies with respect to the electricity supply sector have been in the areas of privatization and pricing reforms, and not much for defining the technology landscape of the country. IGCC with CCS is perceived as a clean technology of the future, but little incentives exist for setting up of IGCC plants in the present Indian policy milieu. Technologies like IGCC and CCS, that have high upfront costs, would need government support for their deployment and commercialization. The policies that would encourage IGCC deployment must therefore utilize many different types of instruments including technology development, financing, tax incentives, and government funding support.
Further, to be truly effective, the policies must be fully embedded within the Indian power sector; across various segments and different market players. The policies must be aligned with the objectives of the Indian planning commission, so that they help in the attainment of the goals set out in the
20 http://www.iea-coal.org.uk/site/ieacoal_old/clean-coal-technologies-pages/clean-coal-technologies-integrated-gasification-combined-cycle-igcc? 21 Report of the working group on R&D for the energy sector for the formulation of the 11th 5 Year Plan (2007 – 2012) 22 USAID IGCC Feasibility Study, 2003
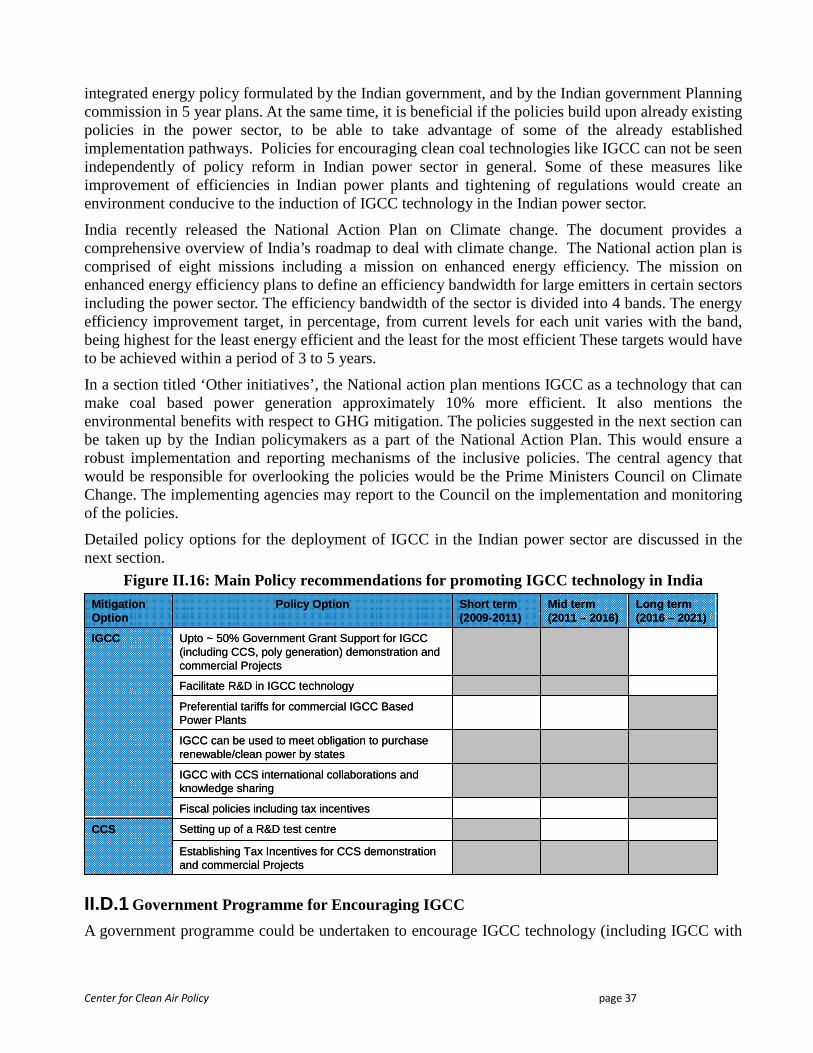
Center for Clean Air Policy page 37
integrated energy policy formulated by the Indian government, and by the Indian government Planning commission in 5 year plans. At the same time, it is beneficial if the policies build upon already existing policies in the power sector, to be able to take advantage of some of the already established implementation pathways. Policies for encouraging clean coal technologies like IGCC can not be seen independently of policy reform in Indian power sector in general. Some of these measures like improvement of efficiencies in Indian power plants and tightening of regulations would create an environment conducive to the induction of IGCC technology in the Indian power sector.
India recently released the National Action Plan on Climate change. The document provides a comprehensive overview of India’s roadmap to deal with climate change. The National action plan is comprised of eight missions including a mission on enhanced energy efficiency. The mission on enhanced energy efficiency plans to define an efficiency bandwidth for large emitters in certain sectors including the power sector. The efficiency bandwidth of the sector is divided into 4 bands. The energy efficiency improvement target, in percentage, from current levels for each unit varies with the band, being highest for the least energy efficient and the least for the most efficient These targets would have to be achieved within a period of 3 to 5 years.
In a section titled ‘Other initiatives’, the National action plan mentions IGCC as a technology that can make coal based power generation approximately 10% more efficient. It also mentions the environmental benefits with respect to GHG mitigation. The policies suggested in the next section can be taken up by the Indian policymakers as a part of the National Action Plan. This would ensure a robust implementation and reporting mechanisms of the inclusive policies. The central agency that would be responsible for overlooking the policies would be the Prime Ministers Council on Climate Change. The implementing agencies may report to the Council on the implementation and monitoring of the policies.
Detailed policy options for the deployment of IGCC in the Indian power sector are discussed in the next section.
Figure II.16: Main Policy recommendations for promoting IGCC technology in India
IGCC can be used to meet obligation to purchase renewable/clean power by states
Establishing Tax Incentives for CCS demonstration and commercial Projects
Setting up of a R&D test centreCCS
Fiscal policies including tax incentives
IGCC with CCS international collaborations and knowledge sharing
Preferential tariffs for commercial IGCC Based Power Plants
Facilitate R&D in IGCC technology
Upto ~ 50% Government Grant Support for IGCC (including CCS, poly generation) demonstration and commercial Projects
IGCC
Long term (2016 – 2021)
Mid term (2011 – 2016)
Short term (2009-2011)
Policy OptionMitigation Option
II.D.1 Government Programme for Encouraging IGCC
A government programme could be undertaken to encourage IGCC technology (including IGCC with
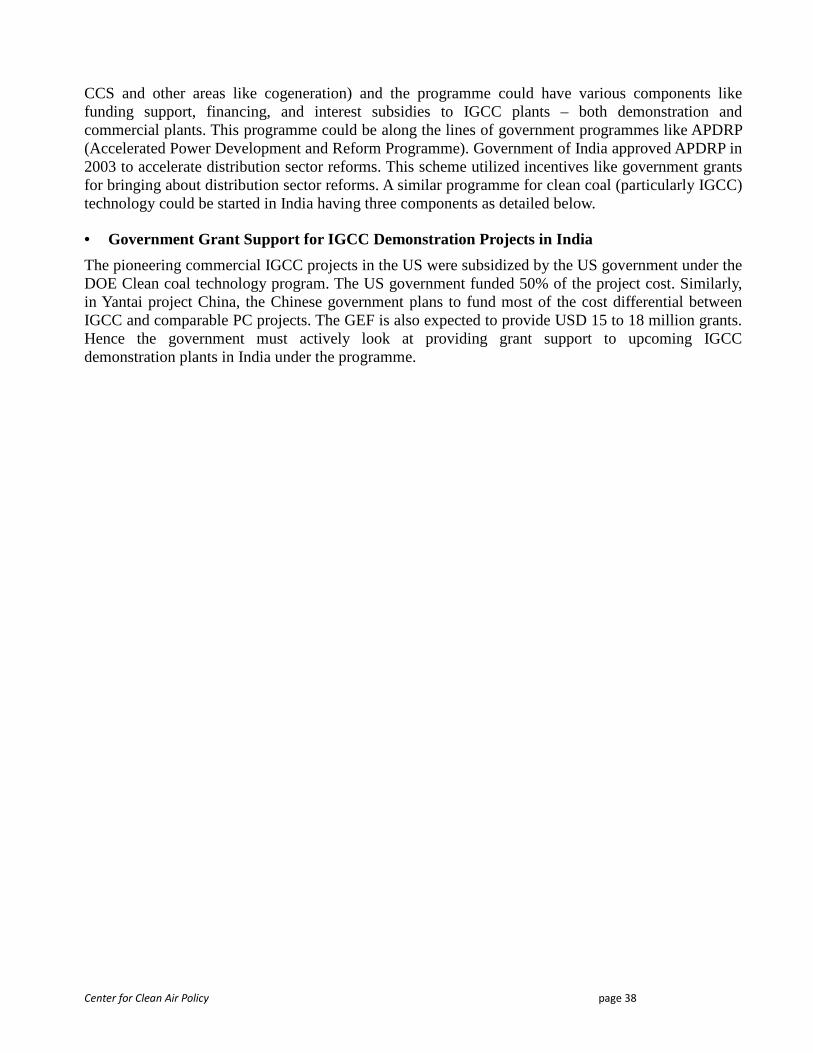
Center for Clean Air Policy page 38
CCS and other areas like cogeneration) and the programme could have various components like funding support, financing, and interest subsidies to IGCC plants – both demonstration and commercial plants. This programme could be along the lines of government programmes like APDRP (Accelerated Power Development and Reform Programme). Government of India approved APDRP in 2003 to accelerate distribution sector reforms. This scheme utilized incentives like government grants for bringing about distribution sector reforms. A similar programme for clean coal (particularly IGCC) technology could be started in India having three components as detailed below.
• Government Grant Support for IGCC Demonstration Projects in India
The pioneering commercial IGCC projects in the US were subsidized by the US government under the DOE Clean coal technology program. The US government funded 50% of the project cost. Similarly, in Yantai project China, the Chinese government plans to fund most of the cost differential between IGCC and comparable PC projects. The GEF is also expected to provide USD 15 to 18 million grants. Hence the government must actively look at providing grant support to upcoming IGCC demonstration plants in India under the programme.
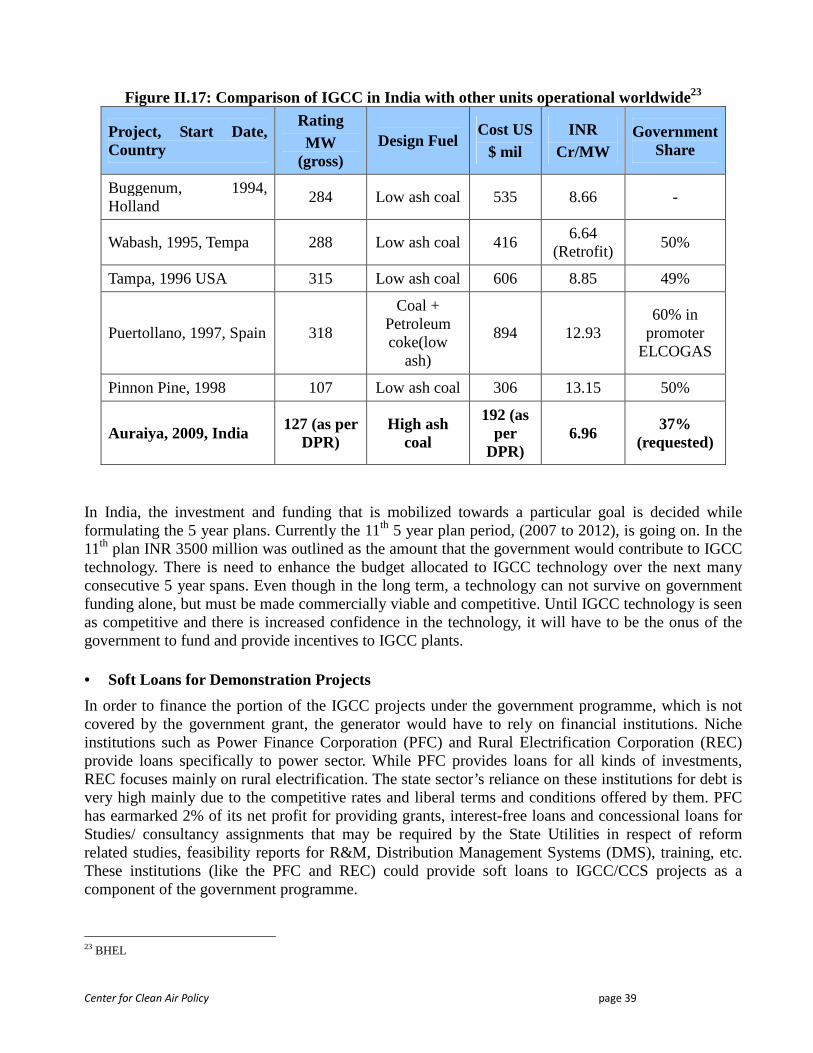
Center for Clean Air Policy page 39
Figure II.17: Comparison of IGCC in India with other units operational worldwide23
Project, Start Date, Country
Rating MW
(gross) Design Fuel
Cost US $ mil
INR Cr/MW
Government Share
Buggenum, 1994, Holland
284 Low ash coal 535 8.66 -
Wabash, 1995, Tempa 288 Low ash coal 416 6.64
(Retrofit) 50%
Tampa, 1996 USA 315 Low ash coal 606 8.85 49%
Puertollano, 1997, Spain 318
Coal + Petroleum coke(low
ash)
894 12.93 60% in
promoter ELCOGAS
Pinnon Pine, 1998 107 Low ash coal 306 13.15 50%
Auraiya, 2009, India 127 (as per
DPR) High ash
coal
192 (as per
DPR) 6.96
37% (requested)
In India, the investment and funding that is mobilized towards a particular goal is decided while formulating the 5 year plans. Currently the 11th 5 year plan period, (2007 to 2012), is going on. In the 11th plan INR 3500 million was outlined as the amount that the government would contribute to IGCC technology. There is need to enhance the budget allocated to IGCC technology over the next many consecutive 5 year spans. Even though in the long term, a technology can not survive on government funding alone, but must be made commercially viable and competitive. Until IGCC technology is seen as competitive and there is increased confidence in the technology, it will have to be the onus of the government to fund and provide incentives to IGCC plants.
• Soft Loans for Demonstration Projects
In order to finance the portion of the IGCC projects under the government programme, which is not covered by the government grant, the generator would have to rely on financial institutions. Niche institutions such as Power Finance Corporation (PFC) and Rural Electrification Corporation (REC) provide loans specifically to power sector. While PFC provides loans for all kinds of investments, REC focuses mainly on rural electrification. The state sector’s reliance on these institutions for debt is very high mainly due to the competitive rates and liberal terms and conditions offered by them. PFC has earmarked 2% of its net profit for providing grants, interest-free loans and concessional loans for Studies/ consultancy assignments that may be required by the State Utilities in respect of reform related studies, feasibility reports for R&M, Distribution Management Systems (DMS), training, etc. These institutions (like the PFC and REC) could provide soft loans to IGCC/CCS projects as a component of the government programme.
23 BHEL
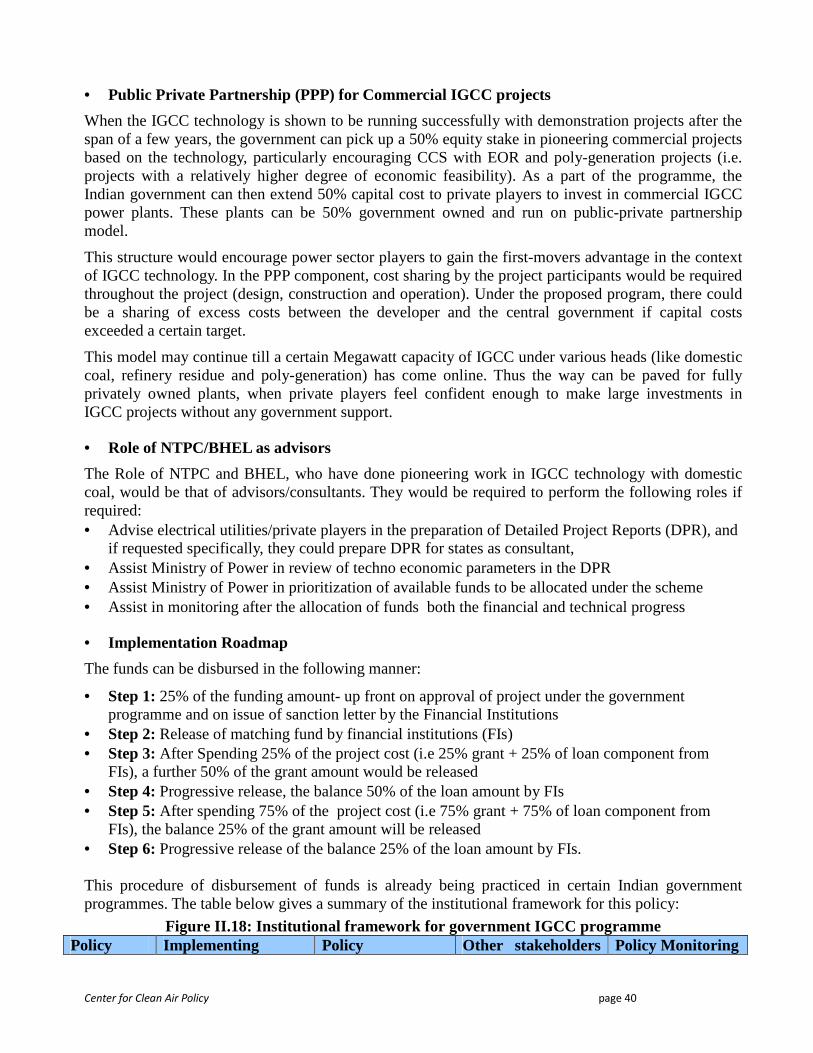
Center for Clean Air Policy page 40
• Public Private Partnership (PPP) for Commercial IGCC projects
When the IGCC technology is shown to be running successfully with demonstration projects after the span of a few years, the government can pick up a 50% equity stake in pioneering commercial projects based on the technology, particularly encouraging CCS with EOR and poly-generation projects (i.e. projects with a relatively higher degree of economic feasibility). As a part of the programme, the Indian government can then extend 50% capital cost to private players to invest in commercial IGCC power plants. These plants can be 50% government owned and run on public-private partnership model.
This structure would encourage power sector players to gain the first-movers advantage in the context of IGCC technology. In the PPP component, cost sharing by the project participants would be required throughout the project (design, construction and operation). Under the proposed program, there could be a sharing of excess costs between the developer and the central government if capital costs exceeded a certain target.
This model may continue till a certain Megawatt capacity of IGCC under various heads (like domestic coal, refinery residue and poly-generation) has come online. Thus the way can be paved for fully privately owned plants, when private players feel confident enough to make large investments in IGCC projects without any government support.
• Role of NTPC/BHEL as advisors
The Role of NTPC and BHEL, who have done pioneering work in IGCC technology with domestic coal, would be that of advisors/consultants. They would be required to perform the following roles if required: • Advise electrical utilities/private players in the preparation of Detailed Project Reports (DPR), and
if requested specifically, they could prepare DPR for states as consultant, • Assist Ministry of Power in review of techno economic parameters in the DPR • Assist Ministry of Power in prioritization of available funds to be allocated under the scheme • Assist in monitoring after the allocation of funds both the financial and technical progress
• Implementation Roadmap
The funds can be disbursed in the following manner:
• Step 1: 25% of the funding amount- up front on approval of project under the government programme and on issue of sanction letter by the Financial Institutions
• Step 2: Release of matching fund by financial institutions (FIs) • Step 3: After Spending 25% of the project cost (i.e 25% grant + 25% of loan component from
FIs), a further 50% of the grant amount would be released • Step 4: Progressive release, the balance 50% of the loan amount by FIs • Step 5: After spending 75% of the project cost (i.e 75% grant + 75% of loan component from
FIs), the balance 25% of the grant amount will be released • Step 6: Progressive release of the balance 25% of the loan amount by FIs. This procedure of disbursement of funds is already being practiced in certain Indian government programmes. The table below gives a summary of the institutional framework for this policy:
Figure II.18: Institutional framework for governmen t IGCC programme Policy Implementing Policy Other stakeholders Policy Monitoring
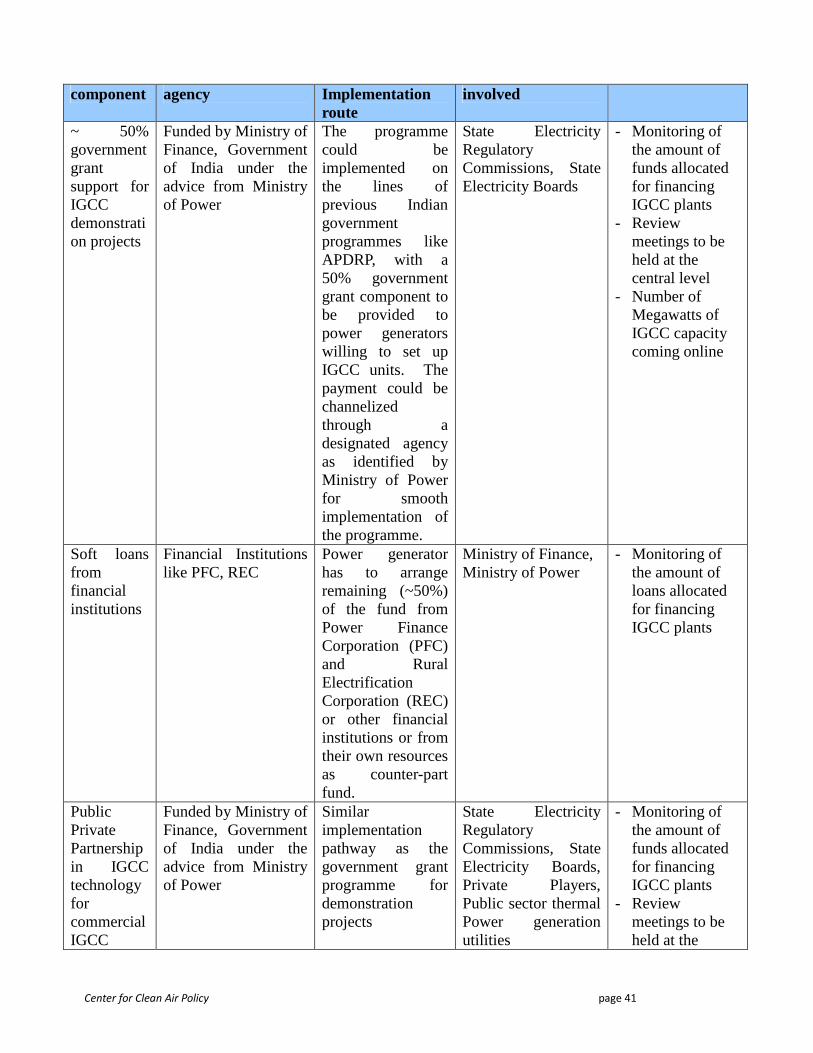
Center for Clean Air Policy page 41
component agency Implementation route
involved
~ 50% government grant support for IGCC demonstration projects
Funded by Ministry of Finance, Government of India under the advice from Ministry of Power
The programme could be implemented on the lines of previous Indian government programmes like APDRP, with a 50% government grant component to be provided to power generators willing to set up IGCC units. The payment could be channelized through a designated agency as identified by Ministry of Power for smooth implementation of the programme.
State Electricity Regulatory Commissions, State Electricity Boards
- Monitoring of the amount of funds allocated for financing IGCC plants
- Review meetings to be held at the central level
- Number of Megawatts of IGCC capacity coming online
Soft loans from financial institutions
Financial Institutions like PFC, REC
Power generator has to arrange remaining (~50%) of the fund from Power Finance Corporation (PFC) and Rural Electrification Corporation (REC) or other financial institutions or from their own resources as counter-part fund.
Ministry of Finance, Ministry of Power
- Monitoring of the amount of loans allocated for financing IGCC plants
Public Private Partnership in IGCC technology for commercial IGCC
Funded by Ministry of Finance, Government of India under the advice from Ministry of Power
Similar implementation pathway as the government grant programme for demonstration projects
State Electricity Regulatory Commissions, State Electricity Boards, Private Players, Public sector thermal Power generation utilities
- Monitoring of the amount of funds allocated for financing IGCC plants
- Review meetings to be held at the
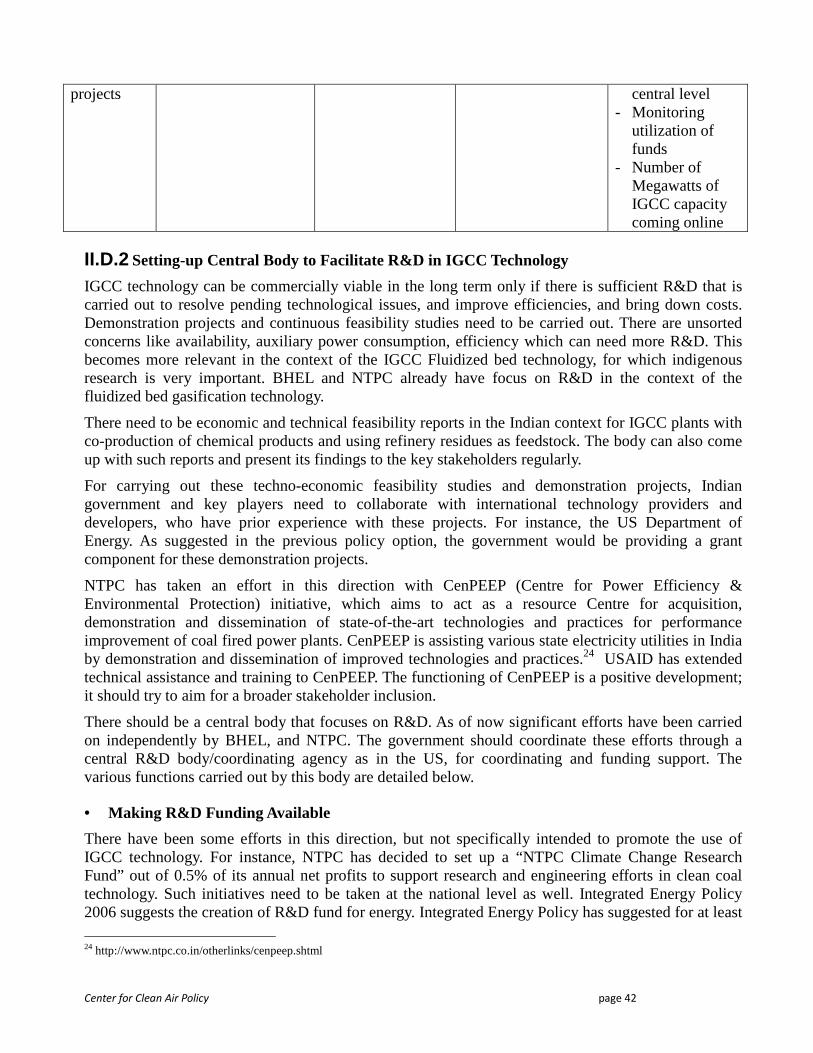
Center for Clean Air Policy page 42
projects central level - Monitoring
utilization of funds
- Number of Megawatts of IGCC capacity coming online
II.D.2 Setting-up Central Body to Facilitate R&D in IGCC Technology
IGCC technology can be commercially viable in the long term only if there is sufficient R&D that is carried out to resolve pending technological issues, and improve efficiencies, and bring down costs. Demonstration projects and continuous feasibility studies need to be carried out. There are unsorted concerns like availability, auxiliary power consumption, efficiency which can need more R&D. This becomes more relevant in the context of the IGCC Fluidized bed technology, for which indigenous research is very important. BHEL and NTPC already have focus on R&D in the context of the fluidized bed gasification technology.
There need to be economic and technical feasibility reports in the Indian context for IGCC plants with co-production of chemical products and using refinery residues as feedstock. The body can also come up with such reports and present its findings to the key stakeholders regularly.
For carrying out these techno-economic feasibility studies and demonstration projects, Indian government and key players need to collaborate with international technology providers and developers, who have prior experience with these projects. For instance, the US Department of Energy. As suggested in the previous policy option, the government would be providing a grant component for these demonstration projects.
NTPC has taken an effort in this direction with CenPEEP (Centre for Power Efficiency & Environmental Protection) initiative, which aims to act as a resource Centre for acquisition, demonstration and dissemination of state-of-the-art technologies and practices for performance improvement of coal fired power plants. CenPEEP is assisting various state electricity utilities in India by demonstration and dissemination of improved technologies and practices.24 USAID has extended technical assistance and training to CenPEEP. The functioning of CenPEEP is a positive development; it should try to aim for a broader stakeholder inclusion.
There should be a central body that focuses on R&D. As of now significant efforts have been carried on independently by BHEL, and NTPC. The government should coordinate these efforts through a central R&D body/coordinating agency as in the US, for coordinating and funding support. The various functions carried out by this body are detailed below.
• Making R&D Funding Available
There have been some efforts in this direction, but not specifically intended to promote the use of IGCC technology. For instance, NTPC has decided to set up a “NTPC Climate Change Research Fund” out of 0.5% of its annual net profits to support research and engineering efforts in clean coal technology. Such initiatives need to be taken at the national level as well. Integrated Energy Policy 2006 suggests the creation of R&D fund for energy. Integrated Energy Policy has suggested for at least
24 http://www.ntpc.co.in/otherlinks/cenpeep.shtml
Center for Clean Air Policy page 43
0.4% of the annual turnover of energy producing companies to be spent on R&D activities. The government should make more R&D funding available through the central agency.
Technology Development Board, Department of Science and Technology in India aims at accelerating the development and commercialization of indigenous technology or adapting imported technology to wider domestic application. The board provides financial assistance in the form of Equity, Soft loans, or Grants. TDB provides equity capital or loans to industrial concerns and financial assistance to research and development institutions. The loan carries a simple interest rate of 5% per annum. The loan from Technology development board can be used for R&D funding.
• R&D Collaboration and International Initiatives
In the context of the IGCC research, it is also important to continuously monitor and track technology developments in other parts of the world. For this purpose, India may set up a body that has stakeholders from BHEL, NTPC, electrical utilities, the private sector and the government. It is very important to include the private sector, specifically the big private players, in this exercise, and keep them updated about the results of the efforts. If private sector enters the field of research and development in IGCC technology in the context of cogeneration/using domestic coal/ using refinery residue as feedstock, then there should be R&D facility sharing between government and private companies, facilitated through the central research body. Central Power Research Institute can take over this responsibility. The IGCC feasibility report by USAID recommends local technology ownership, in which major power/chemical plant equipment suppliers, engineering/construction firms get involved and develop standardized plant design suited to Indian conditions. Indigenous R&D will make local technology ownership possible.
In order to learn from the international IGCC experience, India should engage in collaborative, cross-industry, international initiatives, like the US Electric Power Research Institute (EPRI)’s Coal Fleet study, or the UNFCCC’s TT: CLEAR. The Cleaner Fossil Fuels Taskforce of the Asia-Pacific Partnership on Clean Development and Climate could be another avenue for information sharing, though careful thought should be given to the potential usefulness of these given the particular characteristics of Indian coal.
• Implementation Roadmap The table below details the implementation route for the policy. The formation of the R&D body must be done in the short term future; as it will be instrumental in guiding R&D on clean technologies.
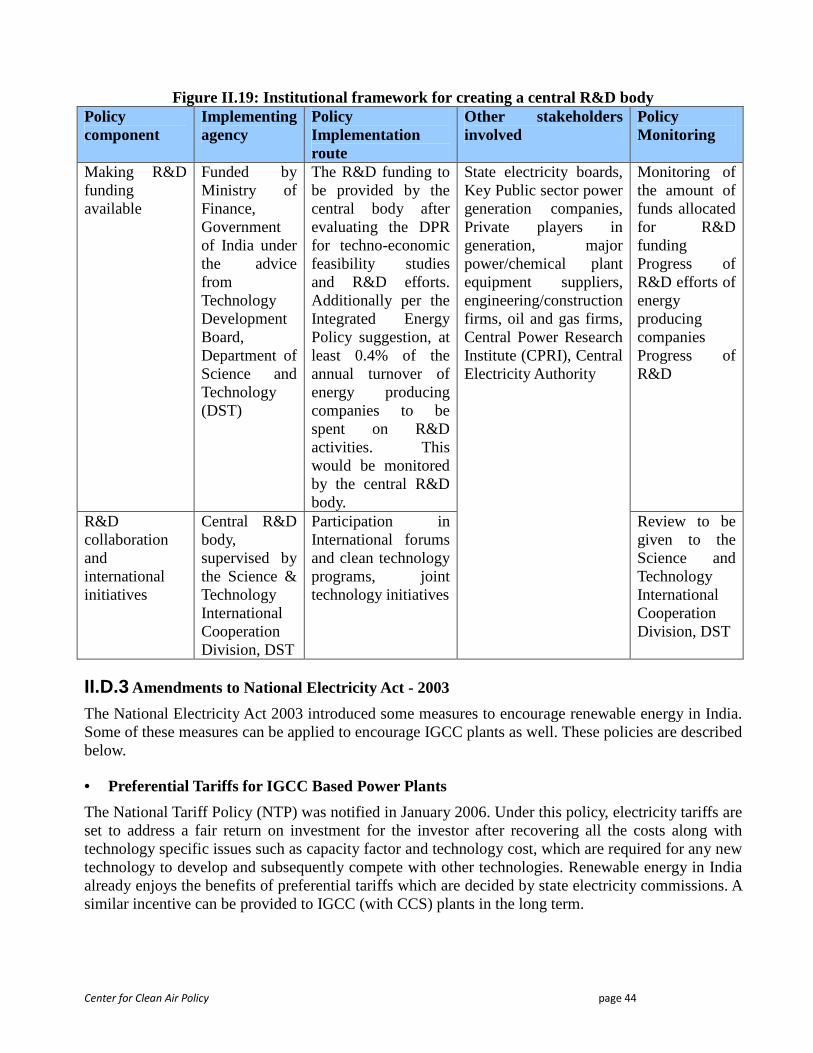
Center for Clean Air Policy page 44
Figure II.19: Institutional framework for creating a central R&D body Policy component
Implementing agency
Policy Implementation route
Other stakeholders involved
Policy Monitoring
Making R&D funding available
Funded by Ministry of Finance, Government of India under the advice from Technology Development Board, Department of Science and Technology (DST)
The R&D funding to be provided by the central body after evaluating the DPR for techno-economic feasibility studies and R&D efforts. Additionally per the Integrated Energy Policy suggestion, at least 0.4% of the annual turnover of energy producing companies to be spent on R&D activities. This would be monitored by the central R&D body.
Monitoring of the amount of funds allocated for R&D funding Progress of R&D efforts of energy producing companies Progress of R&D
R&D collaboration and international initiatives
Central R&D body, supervised by the Science & Technology International Cooperation Division, DST
Participation in International forums and clean technology programs, joint technology initiatives
State electricity boards, Key Public sector power generation companies, Private players in generation, major power/chemical plant equipment suppliers, engineering/construction firms, oil and gas firms, Central Power Research Institute (CPRI), Central Electricity Authority
Review to be given to the Science and Technology International Cooperation Division, DST
II.D.3 Amendments to National Electricity Act - 2003
The National Electricity Act 2003 introduced some measures to encourage renewable energy in India. Some of these measures can be applied to encourage IGCC plants as well. These policies are described below.
• Preferential Tariffs for IGCC Based Power Plants
The National Tariff Policy (NTP) was notified in January 2006. Under this policy, electricity tariffs are set to address a fair return on investment for the investor after recovering all the costs along with technology specific issues such as capacity factor and technology cost, which are required for any new technology to develop and subsequently compete with other technologies. Renewable energy in India already enjoys the benefits of preferential tariffs which are decided by state electricity commissions. A similar incentive can be provided to IGCC (with CCS) plants in the long term.
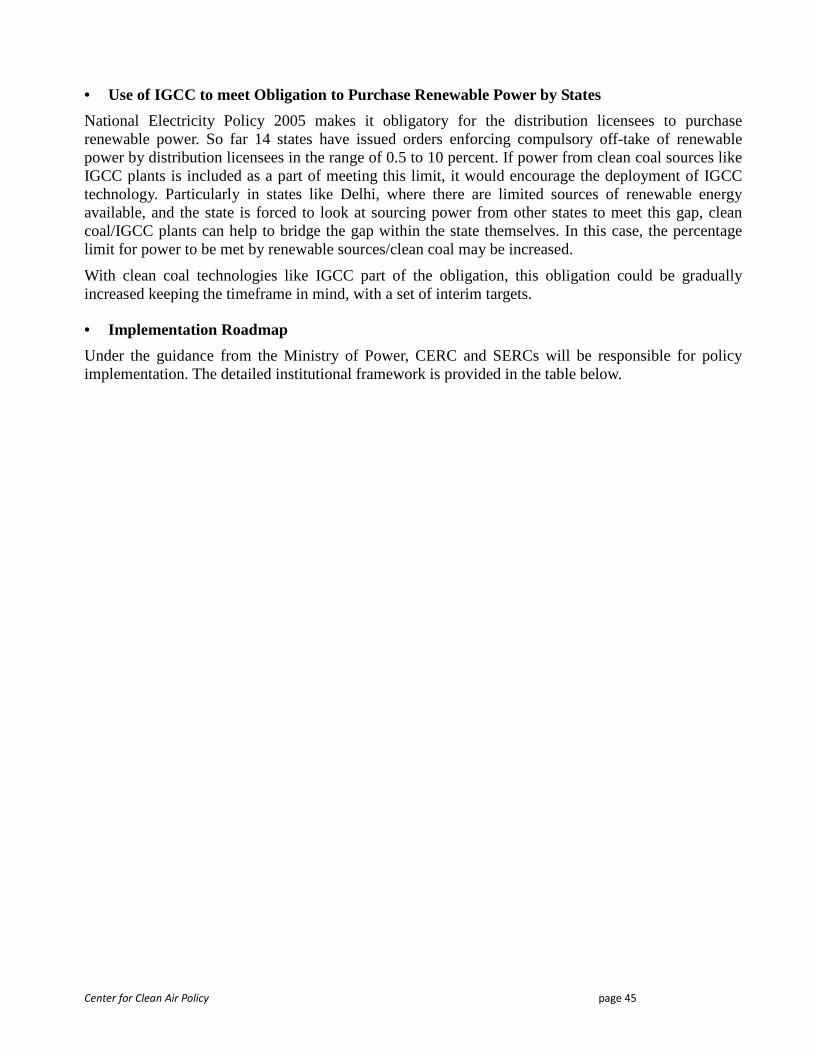
Center for Clean Air Policy page 45
• Use of IGCC to meet Obligation to Purchase Renewable Power by States
National Electricity Policy 2005 makes it obligatory for the distribution licensees to purchase renewable power. So far 14 states have issued orders enforcing compulsory off-take of renewable power by distribution licensees in the range of 0.5 to 10 percent. If power from clean coal sources like IGCC plants is included as a part of meeting this limit, it would encourage the deployment of IGCC technology. Particularly in states like Delhi, where there are limited sources of renewable energy available, and the state is forced to look at sourcing power from other states to meet this gap, clean coal/IGCC plants can help to bridge the gap within the state themselves. In this case, the percentage limit for power to be met by renewable sources/clean coal may be increased.
With clean coal technologies like IGCC part of the obligation, this obligation could be gradually increased keeping the timeframe in mind, with a set of interim targets.
• Implementation Roadmap
Under the guidance from the Ministry of Power, CERC and SERCs will be responsible for policy implementation. The detailed institutional framework is provided in the table below.
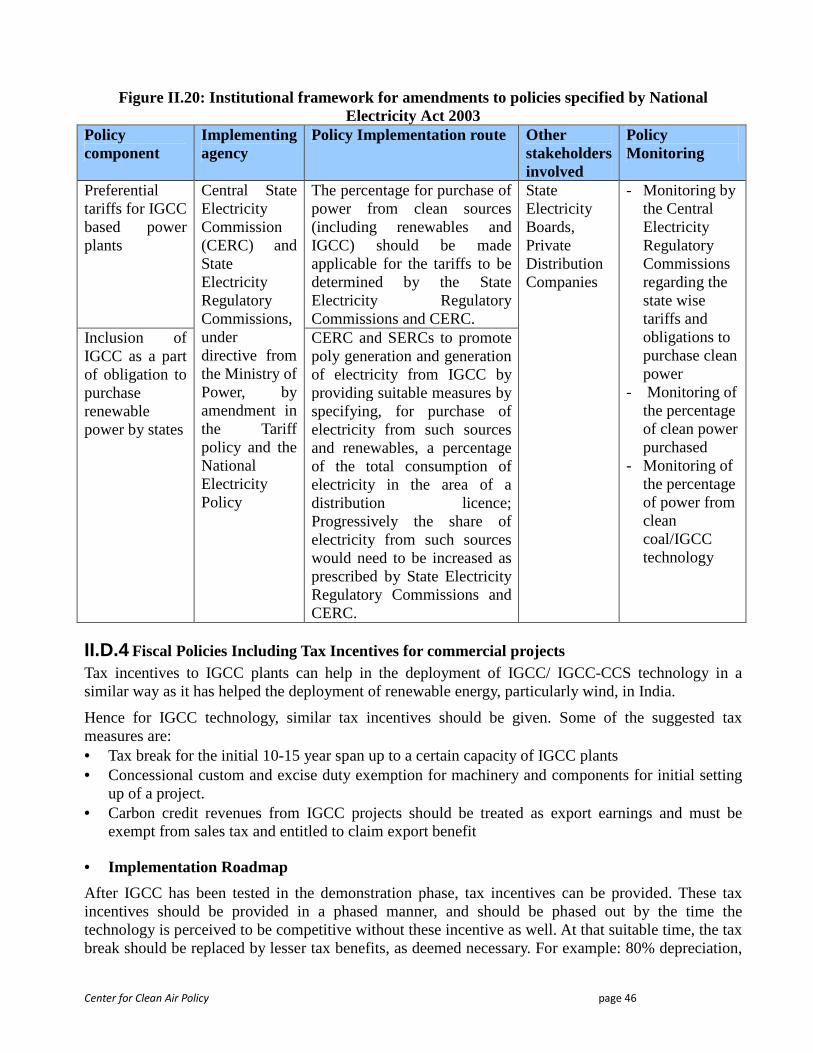
Center for Clean Air Policy page 46
Figure II.20: Institutional framework for amendment s to policies specified by National Electricity Act 2003
Policy component
Implementing agency
Policy Implementation route Other stakeholders involved
Policy Monitoring
Preferential tariffs for IGCC based power plants
The percentage for purchase of power from clean sources (including renewables and IGCC) should be made applicable for the tariffs to be determined by the State Electricity Regulatory Commissions and CERC.
Inclusion of IGCC as a part of obligation to purchase renewable power by states
Central State Electricity Commission (CERC) and State Electricity Regulatory Commissions, under directive from the Ministry of Power, by amendment in the Tariff policy and the National Electricity Policy
CERC and SERCs to promote poly generation and generation of electricity from IGCC by providing suitable measures by specifying, for purchase of electricity from such sources and renewables, a percentage of the total consumption of electricity in the area of a distribution licence; Progressively the share of electricity from such sources would need to be increased as prescribed by State Electricity Regulatory Commissions and CERC.
State Electricity Boards, Private Distribution Companies
- Monitoring by the Central Electricity Regulatory Commissions regarding the state wise tariffs and obligations to purchase clean power
- Monitoring of the percentage of clean power purchased
- Monitoring of the percentage of power from clean coal/IGCC technology
II.D.4 Fiscal Policies Including Tax Incentives for commercial projects Tax incentives to IGCC plants can help in the deployment of IGCC/ IGCC-CCS technology in a similar way as it has helped the deployment of renewable energy, particularly wind, in India.
Hence for IGCC technology, similar tax incentives should be given. Some of the suggested tax measures are: • Tax break for the initial 10-15 year span up to a certain capacity of IGCC plants • Concessional custom and excise duty exemption for machinery and components for initial setting
up of a project. • Carbon credit revenues from IGCC projects should be treated as export earnings and must be
exempt from sales tax and entitled to claim export benefit
• Implementation Roadmap
After IGCC has been tested in the demonstration phase, tax incentives can be provided. These tax incentives should be provided in a phased manner, and should be phased out by the time the technology is perceived to be competitive without these incentive as well. At that suitable time, the tax break should be replaced by lesser tax benefits, as deemed necessary. For example: 80% depreciation,
Center for Clean Air Policy page 47
excise duty exemption, sales tax exemption.
Figure II.21: Institutional framework for tax incen tives for IGCC Policy component
Implementing agency
Policy Implementation route
Other stakeholders involved
Policy Monitoring
Tax incentives
for IGCC based
power plants
Ministry of Finance advised by Ministry of Power
Similar exemptions are available for infrastructure sector (80-IA), renewable energy (80-JJA) etc.
Income tax department, Ministry of Finance; Department of Company Affairs, Institute of Chartered accountants of India
- Implementation date
II.D.5 Other Possible Supplementary Policy Measures
1. Rewarding energy efficiency through price mechanisms/Penalizing inefficiency below a certain minimum level
The National Action Plan on Climate Change is planning along these lines; As mentioned in the National Action Plan, the efficiency bandwidth of the sector is divided into 4 bands. The energy efficiency improvement target in percentage from current levels for each unit varies for its band, being highest for least energy efficient, and the least for most efficient. The targets would have to be achieved for a period of 3 to 5 years for each group.
2. Tightening of existing environmental regulations
Current environmental regulations in India are primarily focused on controlling particulate emissions. However, stack emissions of sulphur oxide and nitrogen oxide emissions are not regulated, and only ambient air concentrations are monitored and regulated for these pollutants.
II.D.6 Policy Implementation Barriers in Coal-based IGCC
There are some possible barriers to the implementation of the suggested policies. Some of these barriers are mentioned below:
1. Lack of government financing
The government of India may face financial constraints in financing a huge chunk of IGCC and CCS projects. The budget outlays for the sector may not be significant enough for compensating 50% capital cost share of all IGCC plants that may be considered under a possible government scheme.
2. Sector environment not ready to accept new technologies
Indian power plants have mainly been BHEL made sub-critical pulverized coal plants. The electricity supply sector is used to functioning with the older sub-critical technology and may find it difficult to accept and practice power plants based on an entirely new technology like IGCC. Introduction of the new technology may lead to constraints like lack of trained manpower and technology providers.
3. Lack of political will
Since IGCC technology is a relatively untested technology, there may be lack of political will to
Center for Clean Air Policy page 48
encourage the technology, so as not to own the responsibility for potential technology failure. Also due to the global financial crisis, a flow of funds to promote environment friendly technology may be restricted.
The policy barriers stated above can be resolved through careful planning and implementation support. Some suggestions to overcome these barriers for encouraging IGCC technology in India are given below:
1. Integration as a part of a mission in the National Action Plan
India’s National action plan on Climate change which has 8 missions was released in June, 2008. If these policies are integrated as a part of the missions, there would be much more certainty of implementing of policy as well as monitoring.
2. Stakeholder consultation
There needs to be stakeholder consultation involving key players from government and industry so that the benefits of IGCC technology are known and the knowledge is disseminated. The R&D bodies or organizations conducting demonstration projects can share their knowledge and experience with the technology as a part of this stakeholder consultation and at the same time, industry and government awareness would be enhanced.
II.E Mitigation Option: Carbon Capture and Storage
II.E.1 Sector Background
Carbon dioxide (CO2) capture and storage (CCS) consists of the separation of CO2 from industrial and energy-related sources, transport to a storage location and long-term isolation from the atmosphere. To facilitate carbon transportation and storage, CO2 is typically compressed to a high density when it is captured. To meet the ambitious emission reduction targets likely to be agreed upon at the next international climate change agreement, it would be necessary to develop CCS technologies for a portion of the generation of both developed and emerging economies.
The key benefits of CCS technology are:
1. CCS can be used in power plants, chemical plants, steel mills, oil refineries etc
2. When used with Enhanced oil recovery (EOR), or with coal bed methane, it leads to the maximum extraction of those resources as well.
There are three technologies available for CO2 capture:
1. Post Combustion systems: These systems capture the carbon dioxide released after the combustion of fossil fuels. An adsorption process is commonly used as it is cost effective as compared to other options.
2. Pre combustion systems: These systems capture the carbon dioxide before the combustion stage, i.e. when the primary fuel gets processed to syngas, which is separated into 2 streams, the CO2 for transportation/storage, and hydrogen as fuel for gas turbine, transport fuel or chemical plant. To use these systems with coal gasifiers, a shift reactor has to be added to them to produce a mix of hydrogen and CO2. The CO2 would then be separated and compressed, in order to be able to transport it.
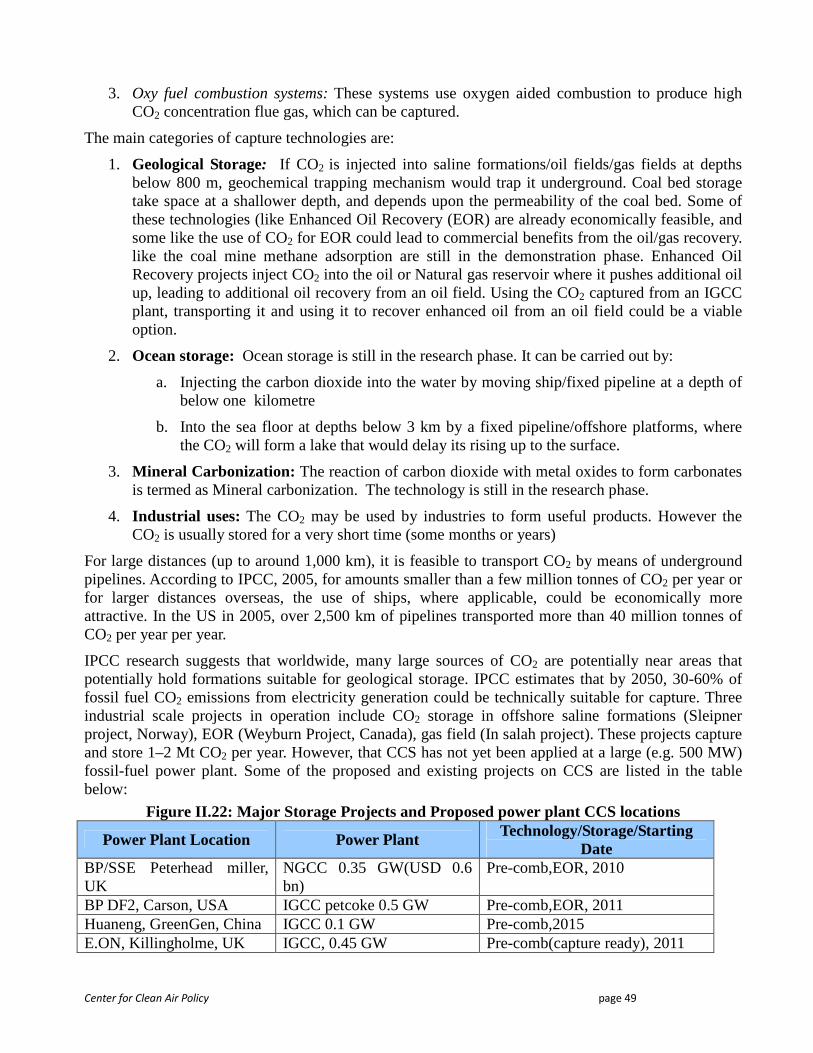
Center for Clean Air Policy page 49
3. Oxy fuel combustion systems: These systems use oxygen aided combustion to produce high CO2 concentration flue gas, which can be captured.
The main categories of capture technologies are:
1. Geological Storage: If CO2 is injected into saline formations/oil fields/gas fields at depths below 800 m, geochemical trapping mechanism would trap it underground. Coal bed storage take space at a shallower depth, and depends upon the permeability of the coal bed. Some of these technologies (like Enhanced Oil Recovery (EOR) are already economically feasible, and some like the use of CO2 for EOR could lead to commercial benefits from the oil/gas recovery. like the coal mine methane adsorption are still in the demonstration phase. Enhanced Oil Recovery projects inject CO2 into the oil or Natural gas reservoir where it pushes additional oil up, leading to additional oil recovery from an oil field. Using the CO2 captured from an IGCC plant, transporting it and using it to recover enhanced oil from an oil field could be a viable option.
2. Ocean storage: Ocean storage is still in the research phase. It can be carried out by:
a. Injecting the carbon dioxide into the water by moving ship/fixed pipeline at a depth of below one kilometre
b. Into the sea floor at depths below 3 km by a fixed pipeline/offshore platforms, where the CO2 will form a lake that would delay its rising up to the surface.
3. Mineral Carbonization: The reaction of carbon dioxide with metal oxides to form carbonates is termed as Mineral carbonization. The technology is still in the research phase.
4. Industrial uses: The CO2 may be used by industries to form useful products. However the CO2 is usually stored for a very short time (some months or years)
For large distances (up to around 1,000 km), it is feasible to transport CO2 by means of underground pipelines. According to IPCC, 2005, for amounts smaller than a few million tonnes of CO2 per year or for larger distances overseas, the use of ships, where applicable, could be economically more attractive. In the US in 2005, over 2,500 km of pipelines transported more than 40 million tonnes of CO2 per year per year.
IPCC research suggests that worldwide, many large sources of CO2 are potentially near areas that potentially hold formations suitable for geological storage. IPCC estimates that by 2050, 30-60% of fossil fuel CO2 emissions from electricity generation could be technically suitable for capture. Three industrial scale projects in operation include CO2 storage in offshore saline formations (Sleipner project, Norway), EOR (Weyburn Project, Canada), gas field (In salah project). These projects capture and store 1–2 Mt CO2 per year. However, that CCS has not yet been applied at a large (e.g. 500 MW) fossil-fuel power plant. Some of the proposed and existing projects on CCS are listed in the table below:
Figure II.22: Major Storage Projects and Proposed power plant CCS locations
Power Plant Location Power Plant Technology/Storage/Starting Date
BP/SSE Peterhead miller, UK
NGCC 0.35 GW(USD 0.6 bn)
Pre-comb,EOR, 2010
BP DF2, Carson, USA IGCC petcoke 0.5 GW Pre-comb,EOR, 2011 Huaneng, GreenGen, China IGCC 0.1 GW Pre-comb,2015 E.ON, Killingholme, UK IGCC, 0.45 GW Pre-comb(capture ready), 2011
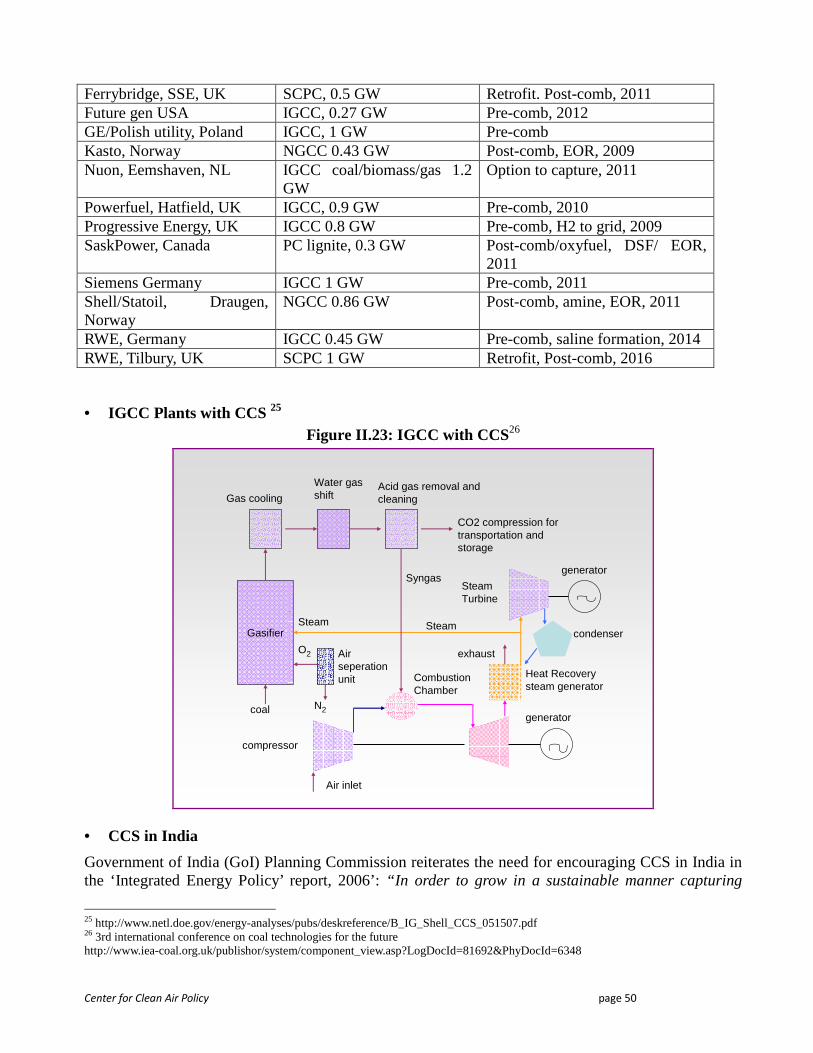
Center for Clean Air Policy page 50
Ferrybridge, SSE, UK SCPC, 0.5 GW Retrofit. Post-comb, 2011 Future gen USA IGCC, 0.27 GW Pre-comb, 2012 GE/Polish utility, Poland IGCC, 1 GW Pre-comb Kasto, Norway NGCC 0.43 GW Post-comb, EOR, 2009 Nuon, Eemshaven, NL IGCC coal/biomass/gas 1.2
GW Option to capture, 2011
Powerfuel, Hatfield, UK IGCC, 0.9 GW Pre-comb, 2010 Progressive Energy, UK IGCC 0.8 GW Pre-comb, H2 to grid, 2009 SaskPower, Canada PC lignite, 0.3 GW Post-comb/oxyfuel, DSF/ EOR,
2011 Siemens Germany IGCC 1 GW Pre-comb, 2011 Shell/Statoil, Draugen, Norway
NGCC 0.86 GW Post-comb, amine, EOR, 2011
RWE, Germany IGCC 0.45 GW Pre-comb, saline formation, 2014 RWE, Tilbury, UK SCPC 1 GW Retrofit, Post-comb, 2016
• IGCC Plants with CCS 25 Figure II.23: IGCC with CCS 26
Gas cooling
Water gas shift
Acid gas removal and cleaning
CO2 compression for transportation and storage
Gasifier
coal
Syngas
O2
N2
Steam
compressor
Air inlet
generator
Combustion Chamber
Heat Recovery steam generator
exhaust
generator
Steam Turbine
Steamcondenser
Air seperationunit
• CCS in India
Government of India (GoI) Planning Commission reiterates the need for encouraging CCS in India in the ‘Integrated Energy Policy’ report, 2006’: “In order to grow in a sustainable manner capturing
25 http://www.netl.doe.gov/energy-analyses/pubs/deskreference/B_IG_Shell_CCS_051507.pdf 26 3rd international conference on coal technologies for the future http://www.iea-coal.org.uk/publishor/system/component_view.asp?LogDocId=81692&PhyDocId=6348
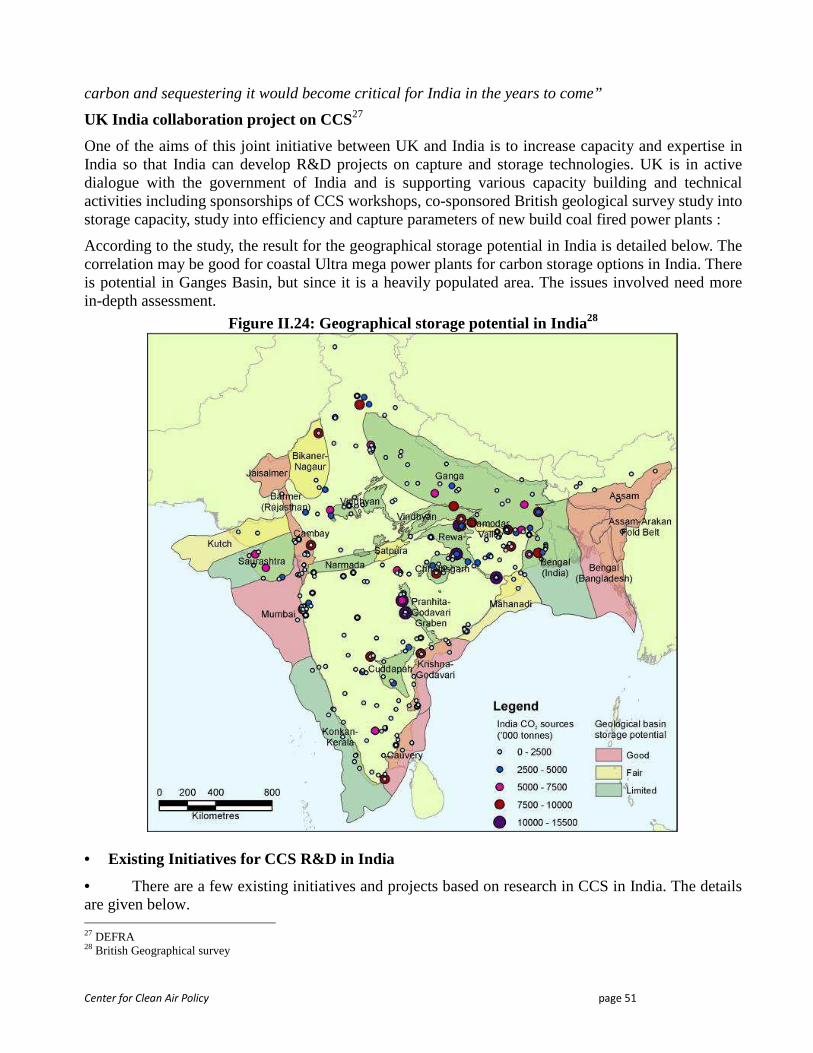
Center for Clean Air Policy page 51
carbon and sequestering it would become critical for India in the years to come”
UK India collaboration project on CCS27
One of the aims of this joint initiative between UK and India is to increase capacity and expertise in India so that India can develop R&D projects on capture and storage technologies. UK is in active dialogue with the government of India and is supporting various capacity building and technical activities including sponsorships of CCS workshops, co-sponsored British geological survey study into storage capacity, study into efficiency and capture parameters of new build coal fired power plants :
According to the study, the result for the geographical storage potential in India is detailed below. The correlation may be good for coastal Ultra mega power plants for carbon storage options in India. There is potential in Ganges Basin, but since it is a heavily populated area. The issues involved need more in-depth assessment.
Figure II.24: Geographical storage potential in India28
• Existing Initiatives for CCS R&D in India
• There are a few existing initiatives and projects based on research in CCS in India. The details are given below. 27 DEFRA 28 British Geographical survey
Center for Clean Air Policy page 52
1. National Program on Carbon Sequestration (NPCS) Research
• National Program on Carbon Sequestration Research was initiated from the perspective of pure/applied research and its industrial applications in sectors such as Power (especially power generation), Coal Mining & Utilization (Coal Bed Methane (CBM) Projects), and Carbon Capture & Storage Technologies.
Four thrust areas of research for this program were identified: 1) CO2 Sequestration through Micro algae Bio-fixation Techniques (2) Carbon Capture Process Development; (3) Policy development Studies; and (4) Network Terrestrial Agro-forestry Sequestration Modelling.
2. Large Scale CCS R&D in India
The details of large scale CCS research projects in India are given below:
• Geological sequestration pilot study in Basalt formations of western India: This study evaluates Basalt formations of India for environmentally safe and irreversible long time storage of CO2, by leveraging the study carried out in Columbia River Basalt group under US Department of Environment. Partner agencies are National Geophysical Research Institute(NGRI), Pacific North west National Laboratory (PNNL) (A US DOE research laboratory), NTPC, Department of Science and Technology (DST)
• The Department of Science & Technology, India has initiated studies aiming at identification of deep underground saline aquifers and their suitability for CO2 sequestration in Sedimentary basins of India namely Ganges, Rajasthan and Vindhya basins.
• Feasibility studies on CO2 injection proposed for EOR from Hazira gas: In India, the Oil & Natural Gas Corporation (ONGC) has proposed CO2-EOR for Ankleshwar Oil Field in western India. The CO2 is planned to be sourced from ONGC gas processing complex at Hazira. The experimental and modelling studies have indicated an incremental oil recovery of ~ 4 % over the project life of 35 years besides the potential to sequester 5 to 10 million tons of CO2
An amount of INR 1,250 million is projected as the requirement of funds for doing R&D in Carbon Capture and Storage (including climate change issues) in the eleventh five year plan.
India is already a member of Carbon Sequestration Leadership forum (CSLF) and the Asia pacific partnership on clean development and climate. India is also participating in one CSLF project. India along with South Korea was one of the two countries involved in the FutureGen project, contributing USD 10 million to the project. India was also one of the partner countries in the IGCC with CCS Workshop under the Asia Pacific Asia pacific partnership on clean development and climate. India needs to partner actively with such programs/bodies and implement feasibility studies/demonstration projects/facilitate R&D with their help. Participation in International forums would also enhance technology transfer.
II.E.2 Mitigation Option Methodology for CCS
The same methodology is used as detailed in the section on IGCC.
II.E.3 Mitigation Option Results for CCS
Based on the methodology available the following results were obtained for applying CCS on an IGCC based power plant running on domestic coal:
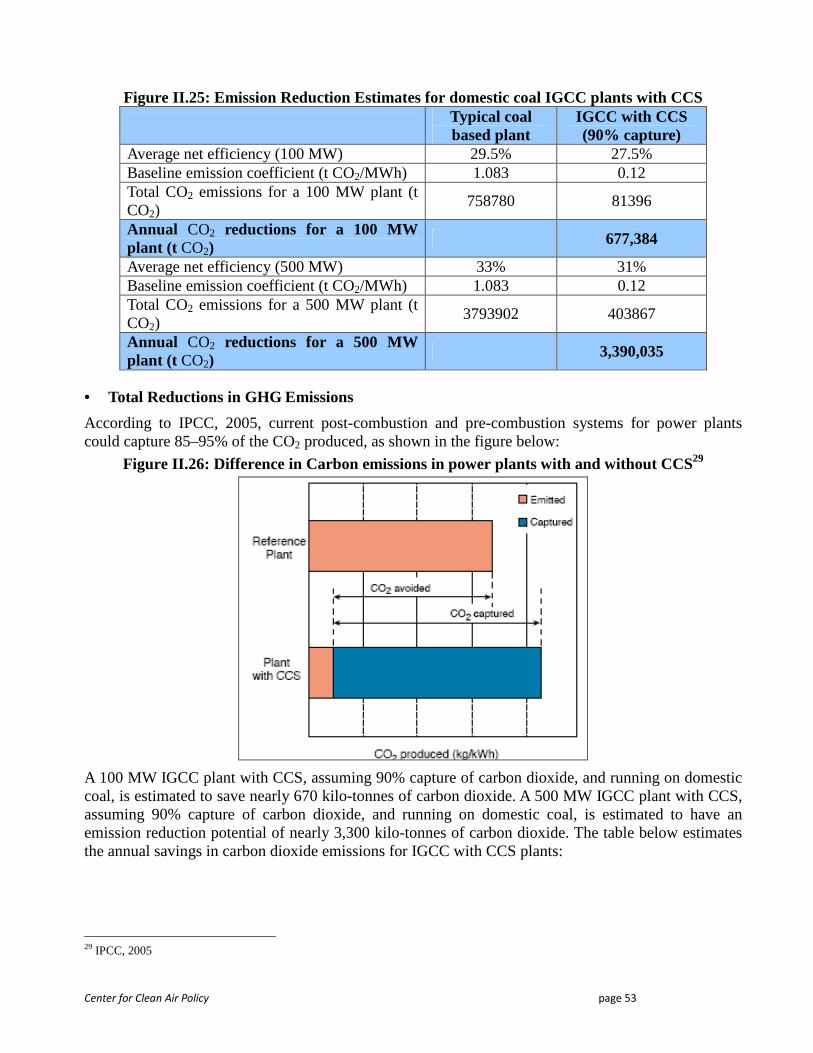
Center for Clean Air Policy page 53
Figure II.25: Emission Reduction Estimates for domestic coal IGCC plants with CCS
Typical coal based plant
IGCC with CCS (90% capture)
Average net efficiency (100 MW) 29.5% 27.5% Baseline emission coefficient (t CO2/MWh) 1.083 0.12 Total CO2 emissions for a 100 MW plant (t CO2)
758780 81396
Annual CO2 reductions for a 100 MW plant (t CO2)
677,384
Average net efficiency (500 MW) 33% 31% Baseline emission coefficient (t CO2/MWh) 1.083 0.12 Total CO2 emissions for a 500 MW plant (t CO2)
3793902 403867
Annual CO2 reductions for a 500 MW plant (t CO2)
3,390,035
• Total Reductions in GHG Emissions
According to IPCC, 2005, current post-combustion and pre-combustion systems for power plants could capture 85–95% of the CO2 produced, as shown in the figure below:
Figure II.26: Difference in Carbon emissions in power plants with and without CCS29
A 100 MW IGCC plant with CCS, assuming 90% capture of carbon dioxide, and running on domestic coal, is estimated to save nearly 670 kilo-tonnes of carbon dioxide. A 500 MW IGCC plant with CCS, assuming 90% capture of carbon dioxide, and running on domestic coal, is estimated to have an emission reduction potential of nearly 3,300 kilo-tonnes of carbon dioxide. The table below estimates the annual savings in carbon dioxide emissions for IGCC with CCS plants:
29 IPCC, 2005
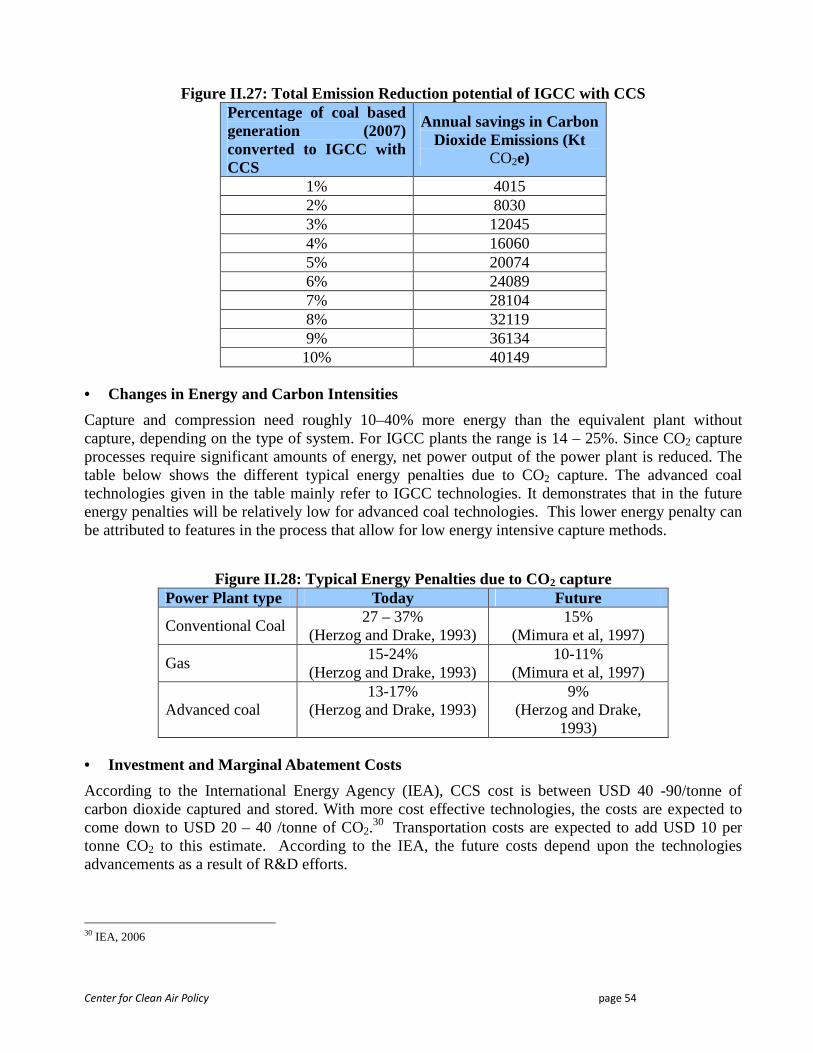
Center for Clean Air Policy page 54
Figure II.27: Total Emission Reduction potential of IGCC with CCS Percentage of coal based generation (2007) converted to IGCC with CCS
Annual savings in Carbon Dioxide Emissions (Kt
CO2e)
1% 4015 2% 8030 3% 12045 4% 16060 5% 20074 6% 24089 7% 28104 8% 32119 9% 36134 10% 40149
• Changes in Energy and Carbon Intensities
Capture and compression need roughly 10–40% more energy than the equivalent plant without capture, depending on the type of system. For IGCC plants the range is 14 – 25%. Since CO2 capture processes require significant amounts of energy, net power output of the power plant is reduced. The table below shows the different typical energy penalties due to CO2 capture. The advanced coal technologies given in the table mainly refer to IGCC technologies. It demonstrates that in the future energy penalties will be relatively low for advanced coal technologies. This lower energy penalty can be attributed to features in the process that allow for low energy intensive capture methods.
Figure II.28: Typical Energy Penalties due to CO2 capture Power Plant type Today Future
Conventional Coal 27 – 37%
(Herzog and Drake, 1993) 15%
(Mimura et al, 1997)
Gas 15-24%
(Herzog and Drake, 1993) 10-11%
(Mimura et al, 1997)
Advanced coal 13-17%
(Herzog and Drake, 1993) 9%
(Herzog and Drake, 1993)
• Investment and Marginal Abatement Costs
According to the International Energy Agency (IEA), CCS cost is between USD 40 -90/tonne of carbon dioxide captured and stored. With more cost effective technologies, the costs are expected to come down to USD 20 – 40 /tonne of CO2.
30 Transportation costs are expected to add USD 10 per tonne CO2 to this estimate. According to the IEA, the future costs depend upon the technologies advancements as a result of R&D efforts.
30 IEA, 2006
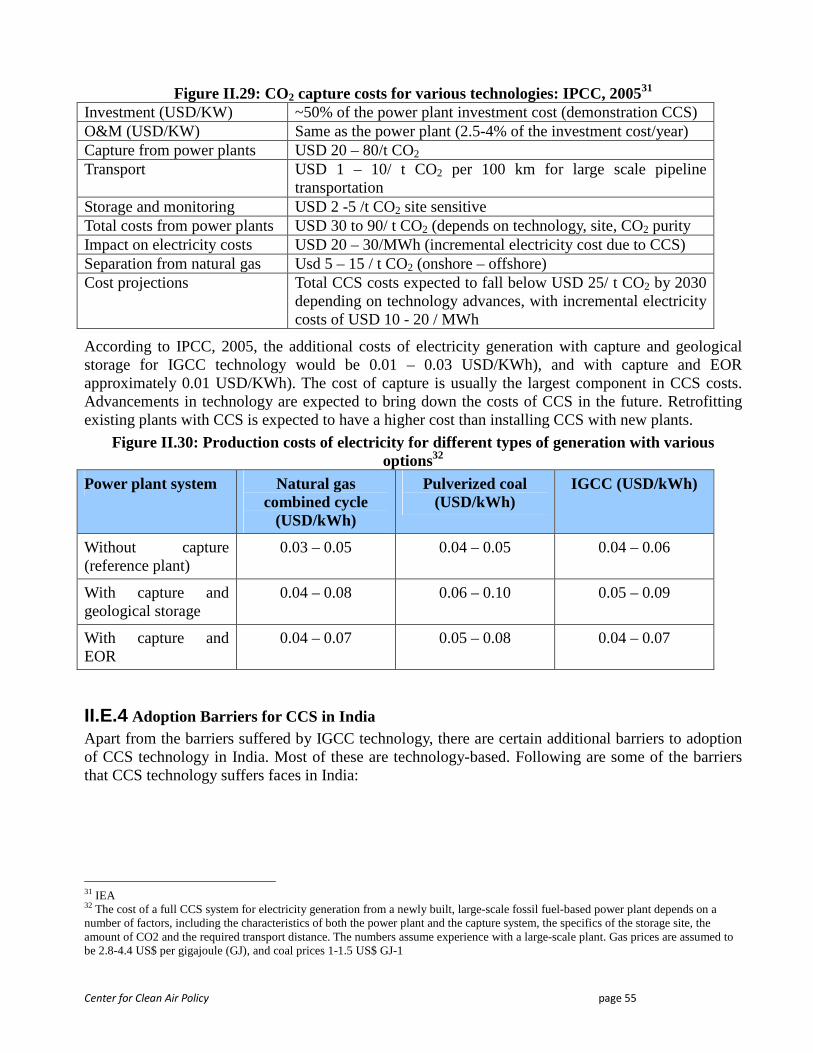
Center for Clean Air Policy page 55
Figure II.29: CO2 capture costs for various technologies: IPCC, 200531 Investment (USD/KW) ~50% of the power plant investment cost (demonstration CCS) O&M (USD/KW) Same as the power plant (2.5-4% of the investment cost/year) Capture from power plants USD 20 – 80/t CO2 Transport USD 1 – 10/ t CO2 per 100 km for large scale pipeline
transportation Storage and monitoring USD 2 -5 /t CO2 site sensitive Total costs from power plants USD 30 to 90/ t CO2 (depends on technology, site, CO2 purity Impact on electricity costs USD 20 – 30/MWh (incremental electricity cost due to CCS) Separation from natural gas Usd 5 – 15 / t CO2 (onshore – offshore) Cost projections Total CCS costs expected to fall below USD 25/ t CO2 by 2030
depending on technology advances, with incremental electricity costs of USD 10 - 20 / MWh
According to IPCC, 2005, the additional costs of electricity generation with capture and geological storage for IGCC technology would be 0.01 – 0.03 USD/KWh), and with capture and EOR approximately 0.01 USD/KWh). The cost of capture is usually the largest component in CCS costs. Advancements in technology are expected to bring down the costs of CCS in the future. Retrofitting existing plants with CCS is expected to have a higher cost than installing CCS with new plants.
Figure II.30: Production costs of electricity for different types of generation with various options32
Power plant system Natural gas combined cycle
(USD/kWh)
Pulverized coal (USD/kWh)
IGCC (USD/kWh)
Without capture (reference plant)
0.03 – 0.05 0.04 – 0.05 0.04 – 0.06
With capture and geological storage
0.04 – 0.08 0.06 – 0.10 0.05 – 0.09
With capture and EOR
0.04 – 0.07 0.05 – 0.08 0.04 – 0.07
II.E.4 Adoption Barriers for CCS in India Apart from the barriers suffered by IGCC technology, there are certain additional barriers to adoption of CCS technology in India. Most of these are technology-based. Following are some of the barriers that CCS technology suffers faces in India:
31 IEA 32 The cost of a full CCS system for electricity generation from a newly built, large-scale fossil fuel-based power plant depends on a number of factors, including the characteristics of both the power plant and the capture system, the specifics of the storage site, the amount of CO2 and the required transport distance. The numbers assume experience with a large-scale plant. Gas prices are assumed to be 2.8-4.4 US$ per gigajoule (GJ), and coal prices 1-1.5 US$ GJ-1
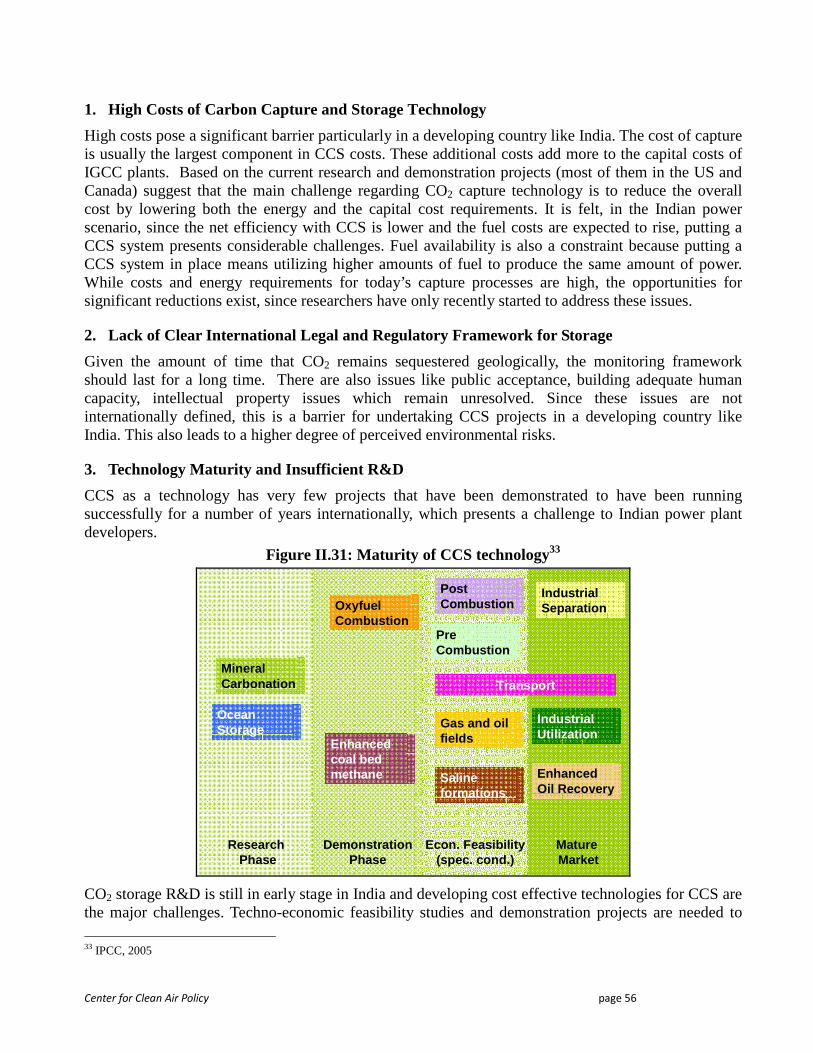
Center for Clean Air Policy page 56
1. High Costs of Carbon Capture and Storage Technology
High costs pose a significant barrier particularly in a developing country like India. The cost of capture is usually the largest component in CCS costs. These additional costs add more to the capital costs of IGCC plants. Based on the current research and demonstration projects (most of them in the US and Canada) suggest that the main challenge regarding CO2 capture technology is to reduce the overall cost by lowering both the energy and the capital cost requirements. It is felt, in the Indian power scenario, since the net efficiency with CCS is lower and the fuel costs are expected to rise, putting a CCS system presents considerable challenges. Fuel availability is also a constraint because putting a CCS system in place means utilizing higher amounts of fuel to produce the same amount of power. While costs and energy requirements for today’s capture processes are high, the opportunities for significant reductions exist, since researchers have only recently started to address these issues.
2. Lack of Clear International Legal and Regulatory Framework for Storage
Given the amount of time that CO2 remains sequestered geologically, the monitoring framework should last for a long time. There are also issues like public acceptance, building adequate human capacity, intellectual property issues which remain unresolved. Since these issues are not internationally defined, this is a barrier for undertaking CCS projects in a developing country like India. This also leads to a higher degree of perceived environmental risks.
3. Technology Maturity and Insufficient R&D
CCS as a technology has very few projects that have been demonstrated to have been running successfully for a number of years internationally, which presents a challenge to Indian power plant developers.
Figure II.31: Maturity of CCS technology33
ResearchPhase
DemonstrationPhase
Econ. Feasibility(spec. cond.)
Mature Market
Mineral Carbonation
Ocean Storage
OxyfuelCombustion
Enhanced coal bed methane
Post Combustion
Pre Combustion
Transport
Gas and oil fields
Saline formations
Industrial Separation
Industrial Utilization
Enhanced Oil Recovery
CO2 storage R&D is still in early stage in India and developing cost effective technologies for CCS are the major challenges. Techno-economic feasibility studies and demonstration projects are needed to
33 IPCC, 2005
Center for Clean Air Policy page 57
determine the storage capacity, geographical potential, various ways of storage, and cost parameters. There are many issues that need to be resolved through research and development and demonstration projects, so that carbon capture through power plants can be tested in the Indian context. The issues that need to be particularly addressed are:
• Understanding of the geological potential: This would include detailed geological assessments of prospective sites in India
• Understanding of storage mechanisms: This would involve improved understanding and forecasting of CO2 dispersion in geological media to determine permanence and security of storage
• Monitoring and verification of the subsurface CO2: This includes accelerated studies of the technologies that might be used for long-term measurement, monitoring and verification of CO2 storage sites
• Techno economic feasibility of using CCS with IGCC fluidized bed gasifiers in the Indian context
• Understanding of environmental impacts: There are risks and uncertainty associated with the transfer and storage of CO2. The risks associated with transporting carbon dioxide are similar as with other pipelines carrying hydrocarbons like natural gas. There is also uncertainty regarding retention in underground storage and the legal aspects of storage. Some of these impacts are detailed below:
o Human/animal health hazard: A sudden and large release of carbon dioxide can pose a risk to human health on exposure to volume wise concentrations more than 7-10%.
o Lethal effects on plants/subsoil animals: Impacts of elevated CO2 concentrations in the shallow subsurface could include lethal effects on plants and subsoil animals and the contamination of groundwater.
o Contamination of groundwater: Elevated CO2 concentrations in the shallow subsurface could lead to contamination of groundwater.
o Possibility of triggering small seismic events: According to IPCC, pressure build-up caused by CO2 injection could trigger small seismic events.
II.F Policy Options: CCS
In the context of CCS, policy options are needed both domestically and internationally. Due to CCS being a technologically young field, domestic policy options can not succeed unless backed by strong international measures. These international measures should attempt to develop a uniform monitoring, verification and legal framework for CCS, and setting demonstration project precedents for emerging economies to follow; since CCS technology currently is not without environmental and social concerns. The leadership on resolving such issues could be taken up by developed country governments and international forums such as the Carbon Sequestration leadership forum.
Policy makers in India tend to look at CCS as a very expensive alternative for emission reductions, when there are less costly immediate options (such as efficiency improvements) available. Making CCS mandatory, or adopting it immediately is not likely to achieve good results in the present Indian power sector scenario. CCS can only be cost effective with high efficiency plants. Hence there is a need to focus on increasing the efficiency of Indian power plants first, bringing in advanced coal technologies like IGCC and prepare the country (in terms of intellectual capacity and technological capacity) to be able to adopt CCS technology in the future. There is also the need to make power
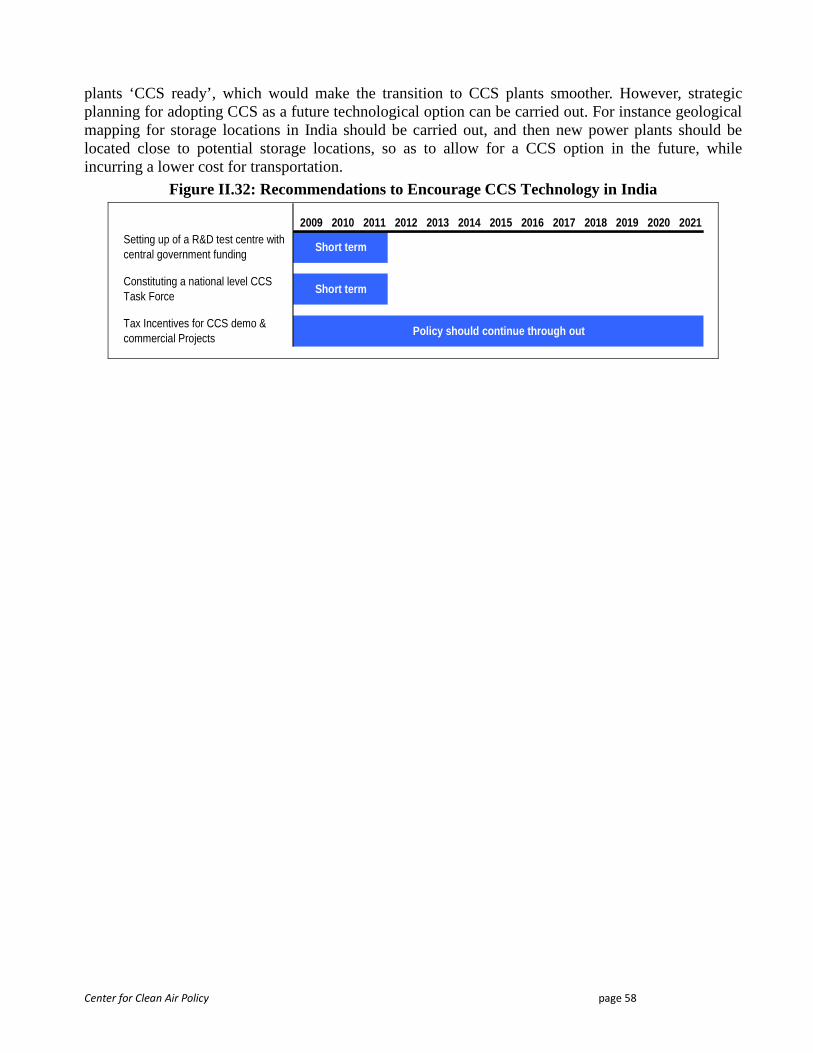
Center for Clean Air Policy page 58
plants ‘CCS ready’, which would make the transition to CCS plants smoother. However, strategic planning for adopting CCS as a future technological option can be carried out. For instance geological mapping for storage locations in India should be carried out, and then new power plants should be located close to potential storage locations, so as to allow for a CCS option in the future, while incurring a lower cost for transportation.
Figure II.32: Recommendations to Encourage CCS Technology in India
2009 2010 2011 2012 2013 2014 2015 2016 2017 2018 2019 2020 2021Setting up of a R&D test centre with central government funding
Constituting a national level CCS Task Force
Tax Incentives for CCS demo & commercial Projects
Policy should continue through out
Short term
Short term
Center for Clean Air Policy page 59
II.F.1 Setting up of a R&D Test Centre with Central Government Funding
In India, research and development is needed on CCS technology, with focus on analyzing the techno economic feasibility of using IGCC with Fluidized Bed gasifiers with domestic coal. This test centre can be set up in conjunction with the central R&D body on IGCC.
The need for R&D into carbon capture and storage has also been mentioned in the Report for the Working group on R&D for the energy sector for the formulation of the 11th 5-year plan (2007-2012) submitted by the Office of the scientific advisor to the Government of India to the Planning Commission. The report says: “India needs to carry-out basic R&D and technology development as it will help in facilitate in technology learning and adaptation to Indian conditions. It needs to establish a test center for carrying out research in CO2 capture technologies from various types of combustion sources on the lines done by the IEA.”
The Working group report suggests following a similar model for R&D in India, including research focusing on optimization and cost studies of poly-generation based CO2 capture. This is particularly significant from the context of IGCC with CCS. An amount of INR 1,250 million is projected as the requirement of funds for doing R&D in Carbon Capture and Storage (including climate change issues) in the eleventh five year plan. There need to be more budget outlays for CCS research and development in the Indian government 5 year plans.
The R&D centre can be built along the lines as suggested in the planning commission report with a dedicated centre to carry out research and development on carbon capture and sequestration technologies. The R&D centre could operate a pre commercial scale technology demonstration plant as suggested. 150% accelerated depreciation benefits should be provided on setting up of branches of this R&D centre across India.
Existing bodies that have been set up (National Program on Carbon Sequestration (NPCS) Research and Indian CO2 Sequestration Applied Research network could contribute as key coordinating agencies for this R&D centre. The R&D centre should operate in collaboration with private and public R&D facilities which may be operating in similar areas of research.
The research effort could include key stakeholders like Oil and gas companies, power plant developers, engineering and construction firms, and lead a focused research effort in collaboration with research institutions like the National geophysical Research institute in diverse areas of research.
• Identify Geological Storage Potential in India: CMM/CBM Reserve Estimation
The identification and assessment of storage sites would help decisions about locating future new power plants near the storage sites, so as to have a reduced cost of transportation of CO2. This information should be disseminated to the ministry of power to carry out the planning of future power projects. This effort needs to be undertaken in a planned manner by Geological Survey of India.
• Financing Carbon Capture Demonstration Projects
Undertaking CCS with EOR and coal mine methane makes the economics for CCS deployment more feasible. A report of the working group on R&D for the 11th 5 year plan also says that due to high costs, there is no immediate incentive to utilize CO2 emitted from power plants for capture; However if carbon credits for avoided CO2 emissions are taking into account, it reduces the cost and comes across as an attractive option.
Center for Clean Air Policy page 60
The financial assistance can be sourced from Technology Development Board (TDB). Financial assistance from the TDB is available in the form of loan or equity; in exceptional cases, it may be grant. The loan assistance is provided up to 50 percent of the approved project cost and carries 5% simple rate of interest per annum. Public sector companies like Oil and Natural Gas Corporation Limited (ONGC) should be encouraged to take up projects, with an approximately 50-60% component of government grants from the technology development fund.
Demonstration IGCC with CCS projects can take grants from the IGCC programme mentioned in the section on IGCC. Public private partnership model could also be adopted to aid the IGCC with CCS demonstration projects.
• Company Level R&D Programmes
Government owned enterprises (mainly coal, oil and gas) should be encouraged to start in house R&D programmes in the areas of CBM and CMM. There needs to be collaborative research amongst the R&D centres owned by private companies and the central R&D centre for CCS.
• Constituting a national level CCS task force
This policy option is already under consideration by the government of India. In the Report of the Working group on coal and lignite for the formulation of the eleventh five year plan (2007-2008), there is a recommendation to constitute a national Level Task Force comprising members of Planning Commission, concerned ministries like Ministry of Coal, Ministry of Power, Ministry of Environment & Forests, Geological Survey of India and concerned industries.
The task force could drive R&D in CCS in India, be authorized to sanction grant support to demonstration/R&D projects, collaborate with international bodies for technology transfer and knowledge sharing, and monitor international developments on CCS technology. This policy results in the creation of a monitoring body that overlooks and drives CCS research on both domestic and international fronts.
• Facilitating Technology transfer and International Funding
International assistance is likely to play a major role in encouraging the demonstration and commercialization of CCS technology in India. This assistance would be in the form of technology transfer and financial assistance through loans and grants. Carbon market revenues can bring down the high costs involved in CCS technology to some extent, if CCS is accepted as an applicable technology under the CDM or other carbon market mechanisms34. International agencies such as the World Bank could provide grants to CCS projects which demonstrate substantial environmental benefits in India. India’s involvement in CCS projects in countries like the US, Australia, Europe and even China can greatly aid technology transfer. Another way to aid technology transfer is to bring down costs involved in Intellectual Property Rights (IPRs). Specifically Enhanced Oil Recovery and Enhanced Coal Bed methane technologies which have better economics should be encouraged as CCS technologies for short-mid term adoption, which can pave the way for other CCS technologies. Hence India must use its presence at various international forums to solicit this financial and technological assistance.
34 CDM is a project-based mechanism under the Kyoto Protocol that allows developing countries to generate revenues for reducing emissions compared to a reference scenario. Henceforth any reference to “carbon market mechanisms” shall include CDM and other approaches such as reformed versions of the CDM and the proposed sectoral crediting mechanisms.
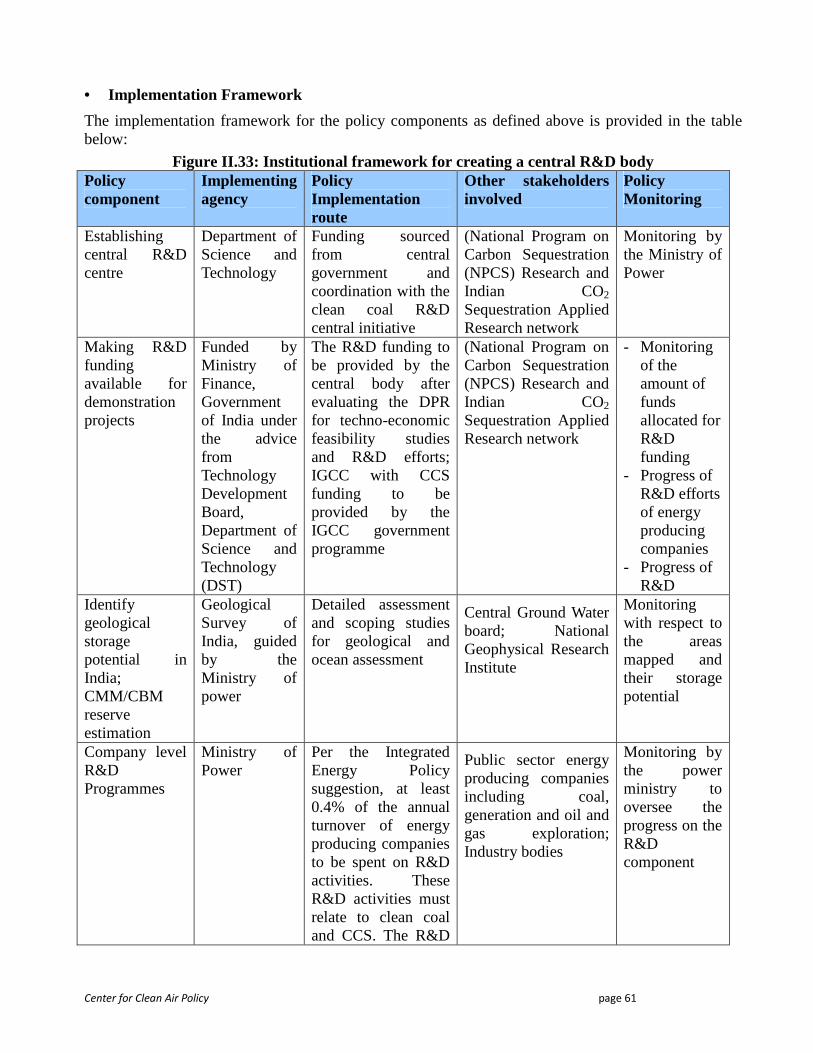
Center for Clean Air Policy page 61
• Implementation Framework
The implementation framework for the policy components as defined above is provided in the table below:
Figure II.33: Institutional framework for creating a central R&D body Policy component
Implementing agency
Policy Implementation route
Other stakeholders involved
Policy Monitoring
Establishing central R&D centre
Department of Science and Technology
Funding sourced from central government and coordination with the clean coal R&D central initiative
(National Program on Carbon Sequestration (NPCS) Research and Indian CO2 Sequestration Applied Research network
Monitoring by the Ministry of Power
Making R&D funding available for demonstration projects
Funded by Ministry of Finance, Government of India under the advice from Technology Development Board, Department of Science and Technology (DST)
The R&D funding to be provided by the central body after evaluating the DPR for techno-economic feasibility studies and R&D efforts; IGCC with CCS funding to be provided by the IGCC government programme
(National Program on Carbon Sequestration (NPCS) Research and Indian CO2 Sequestration Applied Research network
- Monitoring of the amount of funds allocated for R&D funding
- Progress of R&D efforts of energy producing companies
- Progress of R&D
Identify geological storage potential in India; CMM/CBM reserve estimation
Geological Survey of India, guided by the Ministry of power
Detailed assessment and scoping studies for geological and ocean assessment
Central Ground Water board; National Geophysical Research Institute
Monitoring with respect to the areas mapped and their storage potential
Company level R&D Programmes
Ministry of Power
Per the Integrated Energy Policy suggestion, at least 0.4% of the annual turnover of energy producing companies to be spent on R&D activities. These R&D activities must relate to clean coal and CCS. The R&D
Public sector energy producing companies including coal, generation and oil and gas exploration; Industry bodies
Monitoring by the power ministry to oversee the progress on the R&D component
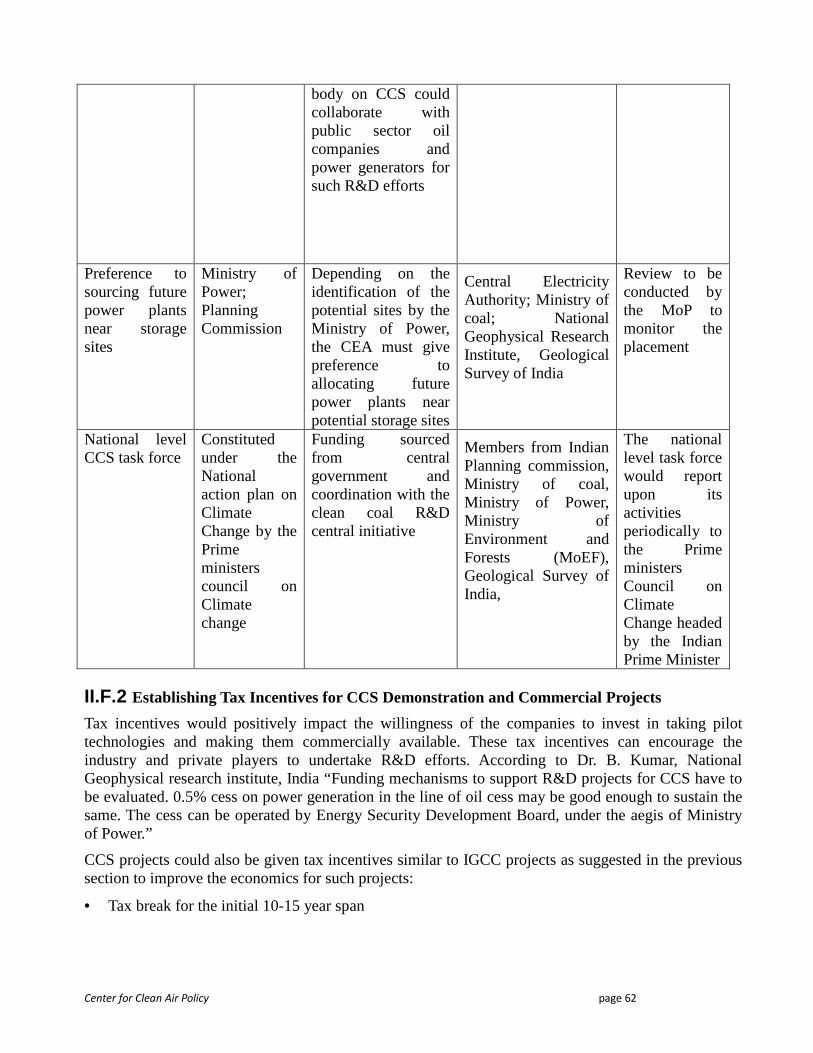
Center for Clean Air Policy page 62
body on CCS could collaborate with public sector oil companies and power generators for such R&D efforts
Preference to sourcing future power plants near storage sites
Ministry of Power; Planning Commission
Depending on the identification of the potential sites by the Ministry of Power, the CEA must give preference to allocating future power plants near potential storage sites
Central Electricity Authority; Ministry of coal; National Geophysical Research Institute, Geological Survey of India
Review to be conducted by the MoP to monitor the placement
National level CCS task force
Constituted under the National action plan on Climate Change by the Prime ministers council on Climate change
Funding sourced from central government and coordination with the clean coal R&D central initiative
Members from Indian Planning commission, Ministry of coal, Ministry of Power, Ministry of Environment and Forests (MoEF), Geological Survey of India,
The national level task force would report upon its activities periodically to the Prime ministers Council on Climate Change headed by the Indian Prime Minister
II.F.2 Establishing Tax Incentives for CCS Demonstration and Commercial Projects
Tax incentives would positively impact the willingness of the companies to invest in taking pilot technologies and making them commercially available. These tax incentives can encourage the industry and private players to undertake R&D efforts. According to Dr. B. Kumar, National Geophysical research institute, India “Funding mechanisms to support R&D projects for CCS have to be evaluated. 0.5% cess on power generation in the line of oil cess may be good enough to sustain the same. The cess can be operated by Energy Security Development Board, under the aegis of Ministry of Power.”
CCS projects could also be given tax incentives similar to IGCC projects as suggested in the previous section to improve the economics for such projects:
• Tax break for the initial 10-15 year span
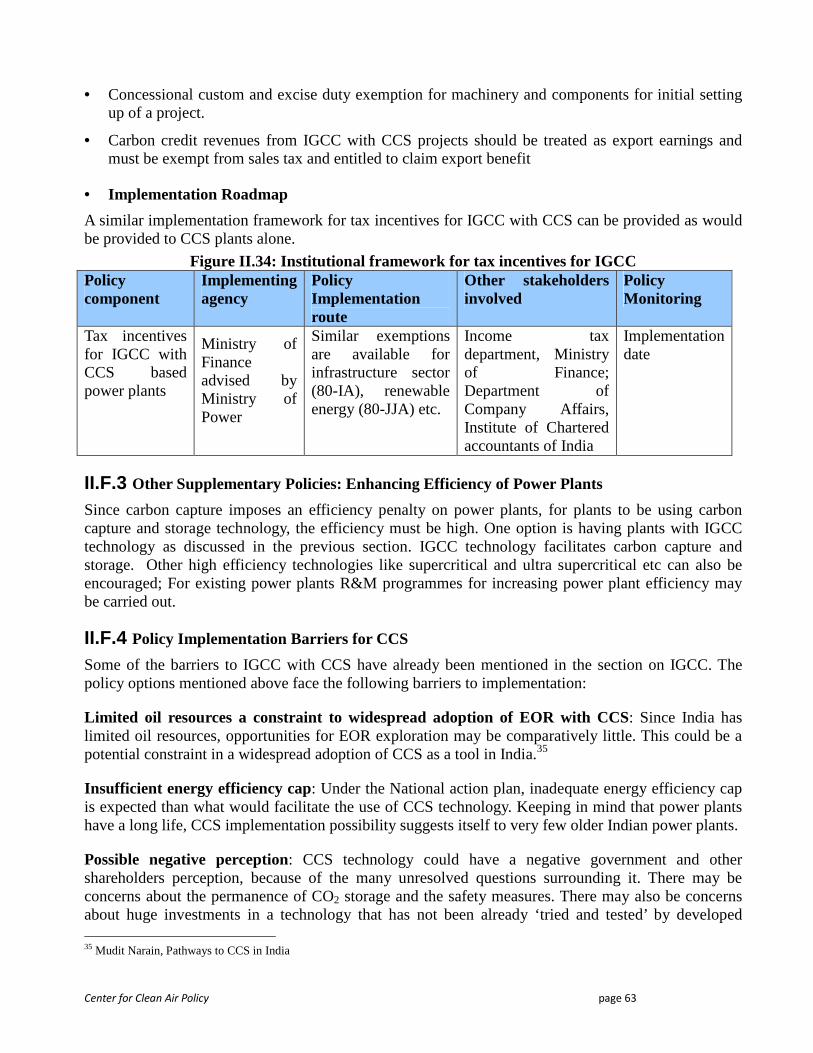
Center for Clean Air Policy page 63
• Concessional custom and excise duty exemption for machinery and components for initial setting up of a project.
• Carbon credit revenues from IGCC with CCS projects should be treated as export earnings and must be exempt from sales tax and entitled to claim export benefit
• Implementation Roadmap
A similar implementation framework for tax incentives for IGCC with CCS can be provided as would be provided to CCS plants alone.
Figure II.34: Institutional framework for tax incen tives for IGCC Policy component
Implementing agency
Policy Implementation route
Other stakeholders involved
Policy Monitoring
Tax incentives for IGCC with CCS based power plants
Ministry of Finance advised by Ministry of Power
Similar exemptions are available for infrastructure sector (80-IA), renewable energy (80-JJA) etc.
Income tax department, Ministry of Finance; Department of Company Affairs, Institute of Chartered accountants of India
Implementation date
II.F.3 Other Supplementary Policies: Enhancing Efficiency of Power Plants
Since carbon capture imposes an efficiency penalty on power plants, for plants to be using carbon capture and storage technology, the efficiency must be high. One option is having plants with IGCC technology as discussed in the previous section. IGCC technology facilitates carbon capture and storage. Other high efficiency technologies like supercritical and ultra supercritical etc can also be encouraged; For existing power plants R&M programmes for increasing power plant efficiency may be carried out.
II.F.4 Policy Implementation Barriers for CCS
Some of the barriers to IGCC with CCS have already been mentioned in the section on IGCC. The policy options mentioned above face the following barriers to implementation:
Limited oil resources a constraint to widespread adoption of EOR with CCS: Since India has limited oil resources, opportunities for EOR exploration may be comparatively little. This could be a potential constraint in a widespread adoption of CCS as a tool in India.35
Insufficient energy efficiency cap: Under the National action plan, inadequate energy efficiency cap is expected than what would facilitate the use of CCS technology. Keeping in mind that power plants have a long life, CCS implementation possibility suggests itself to very few older Indian power plants.
Possible negative perception: CCS technology could have a negative government and other shareholders perception, because of the many unresolved questions surrounding it. There may be concerns about the permanence of CO2 storage and the safety measures. There may also be concerns about huge investments in a technology that has not been already ‘tried and tested’ by developed 35 Mudit Narain, Pathways to CCS in India
Center for Clean Air Policy page 64
countries.
Intellectual Property rights : Unwillingness of technology providers who develop CCS technology in other countries to share the technology with participants in India may be a barrier to the adoption of internationally tested technology.
Most of these barriers can be overcome if adequate measures are taken on the policy side and are implemented efficiently. In order to resolve these barriers, following measures may be taken:
Component of carbon market mechanisms: If revenues from carbon market mechanisms are ensured, the economics of carrying out pre-commercial and later commercial projects would improve.
Research into environmental concerns: Addressing the environmental concerns and issues by the central research body and incorporating security aspects into programme/project design
Enhanced Power plant efficiency cap: The cap suggested in the National Action Plan should be progressively enhanced till power plant efficiencies reach a level suitable for CCS.
Stakeholder consultation: There is incomplete or partial knowledge about the issues and challenges associated with CCS technology and there is need to conduct stakeholder consultations with government and industry to rid them of negative perceptions about CCS. At the same time there is a need to communicate solutions to unresolved concerns, and share the progress that has been made internationally on CCS technology at regular intervals, for policy measures to be successful.
II.G Electricity Supply Sector Conclusion
The mitigation options suggested for the electricity generation sector, IGCC technology and CCS, are still in the research and development phase and have some time before they become commercially viable. Therefore, the thrust of the suggested policies is to provide financing and institutional support to encourage R&D and demonstration projects in both these technologies to resolve pending technical issues and bring costs down. After the technologies are demonstrated to be running successfully in the demonstration phase, some initial incentives by the government would be required to ensure success in the commercial phase, to make it possible to undertake IGCC with CCS projects in the long term. The international community would play an important role by providing financial assistance for funding incentives such as tax breaks, preferential tariffs etc. and by encouraging technology transfer and R&D for domestic technological know-how.
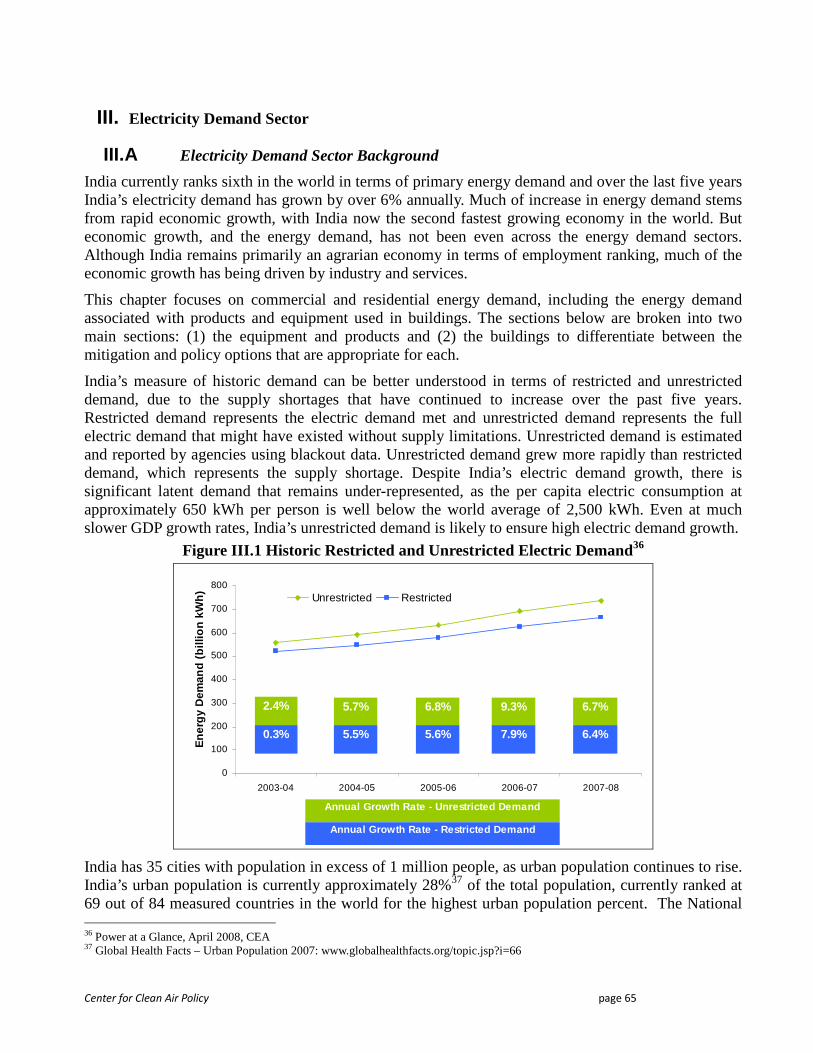
Center for Clean Air Policy page 65
III. Electricity Demand Sector
III.A Electricity Demand Sector Background
India currently ranks sixth in the world in terms of primary energy demand and over the last five years India’s electricity demand has grown by over 6% annually. Much of increase in energy demand stems from rapid economic growth, with India now the second fastest growing economy in the world. But economic growth, and the energy demand, has not been even across the energy demand sectors. Although India remains primarily an agrarian economy in terms of employment ranking, much of the economic growth has being driven by industry and services.
This chapter focuses on commercial and residential energy demand, including the energy demand associated with products and equipment used in buildings. The sections below are broken into two main sections: (1) the equipment and products and (2) the buildings to differentiate between the mitigation and policy options that are appropriate for each.
India’s measure of historic demand can be better understood in terms of restricted and unrestricted demand, due to the supply shortages that have continued to increase over the past five years. Restricted demand represents the electric demand met and unrestricted demand represents the full electric demand that might have existed without supply limitations. Unrestricted demand is estimated and reported by agencies using blackout data. Unrestricted demand grew more rapidly than restricted demand, which represents the supply shortage. Despite India’s electric demand growth, there is significant latent demand that remains under-represented, as the per capita electric consumption at approximately 650 kWh per person is well below the world average of 2,500 kWh. Even at much slower GDP growth rates, India’s unrestricted demand is likely to ensure high electric demand growth.
Figure III.1 Historic Restricted and Unrestricted Electric Demand36
0
100
200
300
400
500
600
700
800
2003-04 2004-05 2005-06 2006-07 2007-08
Ene
rgy
Dem
and
(bill
ion
kWh)
Unrestricted Restricted
6.7%9.3%
7.9%
6.8%
5.6%
5.7%
5.5%
2.4%
0.3% 6.4%
Annual Growth Rate - Unrestricted Demand
Annual Growth Rate - Restricted Demand
India has 35 cities with population in excess of 1 million people, as urban population continues to rise. India’s urban population is currently approximately 28%37 of the total population, currently ranked at 69 out of 84 measured countries in the world for the highest urban population percent. The National 36 Power at a Glance, April 2008, CEA 37 Global Health Facts – Urban Population 2007: www.globalhealthfacts.org/topic.jsp?i=66
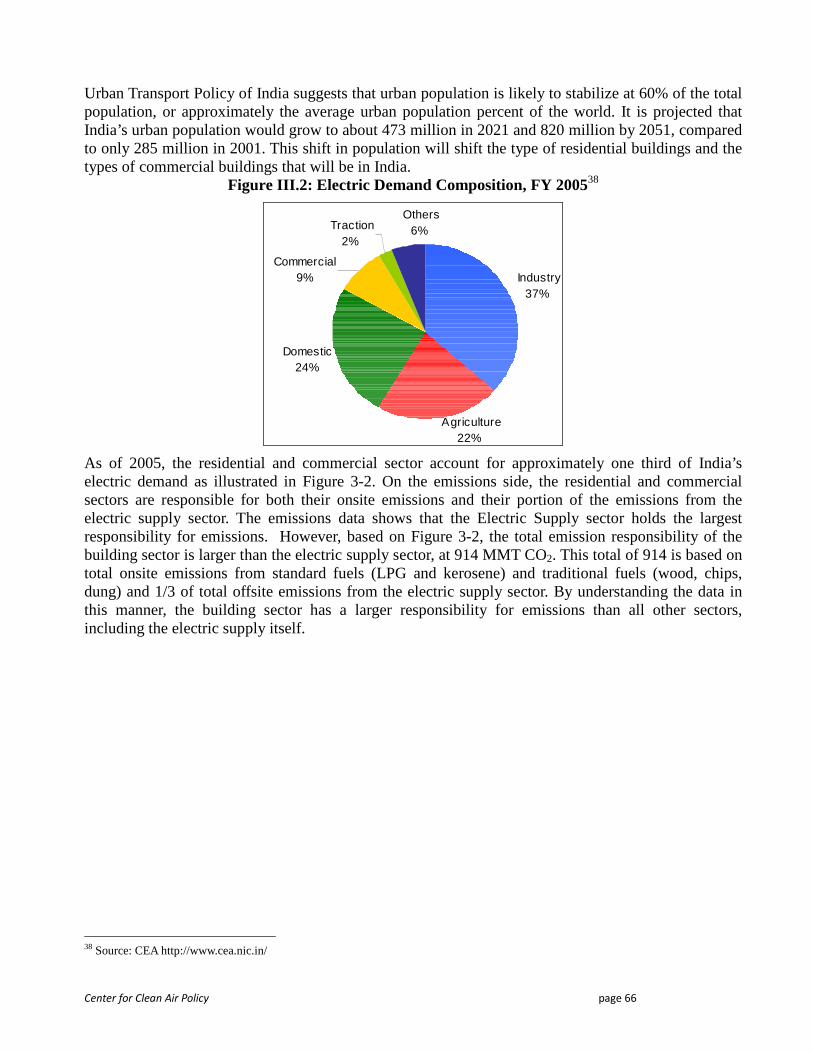
Center for Clean Air Policy page 66
Urban Transport Policy of India suggests that urban population is likely to stabilize at 60% of the total population, or approximately the average urban population percent of the world. It is projected that India’s urban population would grow to about 473 million in 2021 and 820 million by 2051, compared to only 285 million in 2001. This shift in population will shift the type of residential buildings and the types of commercial buildings that will be in India.
Figure III.2: Electric Demand Composition, FY 200538
Industry 37%
Domestic24%
Agriculture22%
Traction 2%
Others 6%
Commercial9%
As of 2005, the residential and commercial sector account for approximately one third of India’s electric demand as illustrated in Figure 3-2. On the emissions side, the residential and commercial sectors are responsible for both their onsite emissions and their portion of the emissions from the electric supply sector. The emissions data shows that the Electric Supply sector holds the largest responsibility for emissions. However, based on Figure 3-2, the total emission responsibility of the building sector is larger than the electric supply sector, at 914 MMT CO2. This total of 914 is based on total onsite emissions from standard fuels (LPG and kerosene) and traditional fuels (wood, chips, dung) and 1/3 of total offsite emissions from the electric supply sector. By understanding the data in this manner, the building sector has a larger responsibility for emissions than all other sectors, including the electric supply itself.
38 Source: CEA http://www.cea.nic.in/
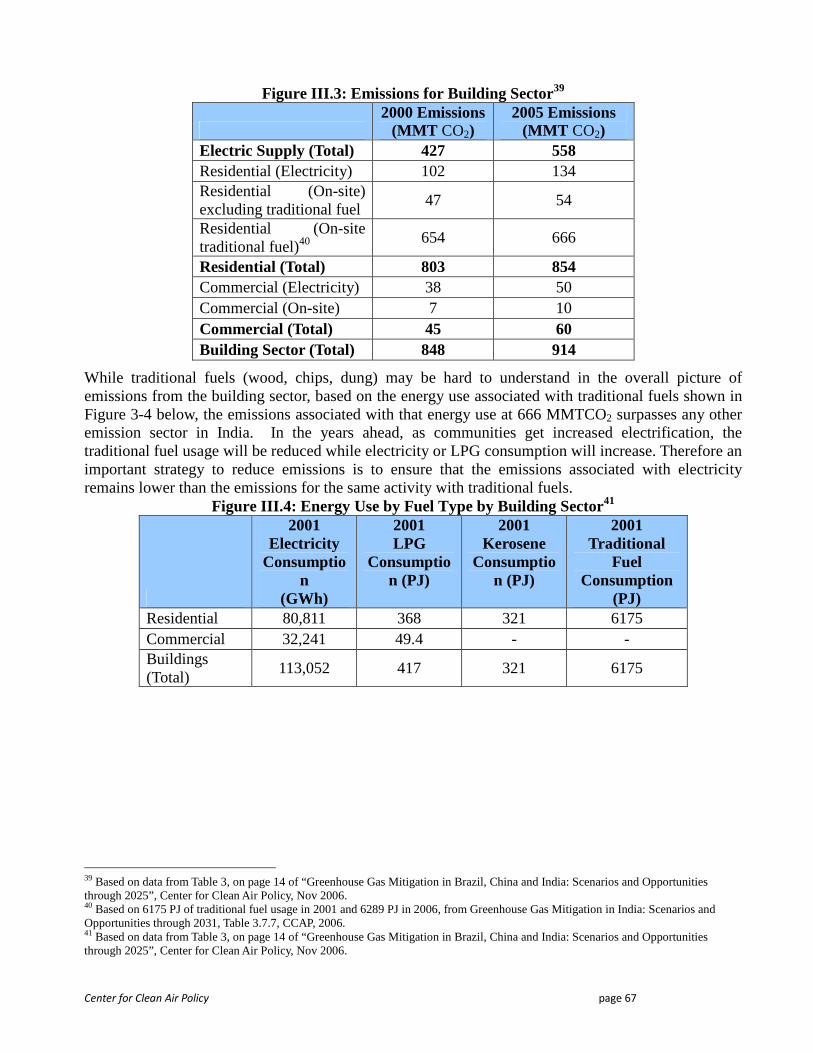
Center for Clean Air Policy page 67
Figure III.3: Emissions for Building Sector39
2000 Emissions
(MMT CO2) 2005 Emissions
(MMT CO2) Electric Supply (Total) 427 558 Residential (Electricity) 102 134 Residential (On-site) excluding traditional fuel
47 54
Residential (On-site traditional fuel)40
654 666
Residential (Total) 803 854 Commercial (Electricity) 38 50 Commercial (On-site) 7 10 Commercial (Total) 45 60 Building Sector (Total) 848 914
While traditional fuels (wood, chips, dung) may be hard to understand in the overall picture of emissions from the building sector, based on the energy use associated with traditional fuels shown in Figure 3-4 below, the emissions associated with that energy use at 666 MMTCO2 surpasses any other emission sector in India. In the years ahead, as communities get increased electrification, the traditional fuel usage will be reduced while electricity or LPG consumption will increase. Therefore an important strategy to reduce emissions is to ensure that the emissions associated with electricity remains lower than the emissions for the same activity with traditional fuels.
Figure III.4: Energy Use by Fuel Type by Building Sector41
2001 Electricity
Consumption
(GWh)
2001 LPG
Consumption (PJ)
2001 Kerosene
Consumption (PJ)
2001 Traditional
Fuel Consumption
(PJ) Residential 80,811 368 321 6175 Commercial 32,241 49.4 - - Buildings (Total)
113,052 417 321 6175
39 Based on data from Table 3, on page 14 of “Greenhouse Gas Mitigation in Brazil, China and India: Scenarios and Opportunities through 2025”, Center for Clean Air Policy, Nov 2006. 40 Based on 6175 PJ of traditional fuel usage in 2001 and 6289 PJ in 2006, from Greenhouse Gas Mitigation in India: Scenarios and Opportunities through 2031, Table 3.7.7, CCAP, 2006. 41 Based on data from Table 3, on page 14 of “Greenhouse Gas Mitigation in Brazil, China and India: Scenarios and Opportunities through 2025”, Center for Clean Air Policy, Nov 2006.
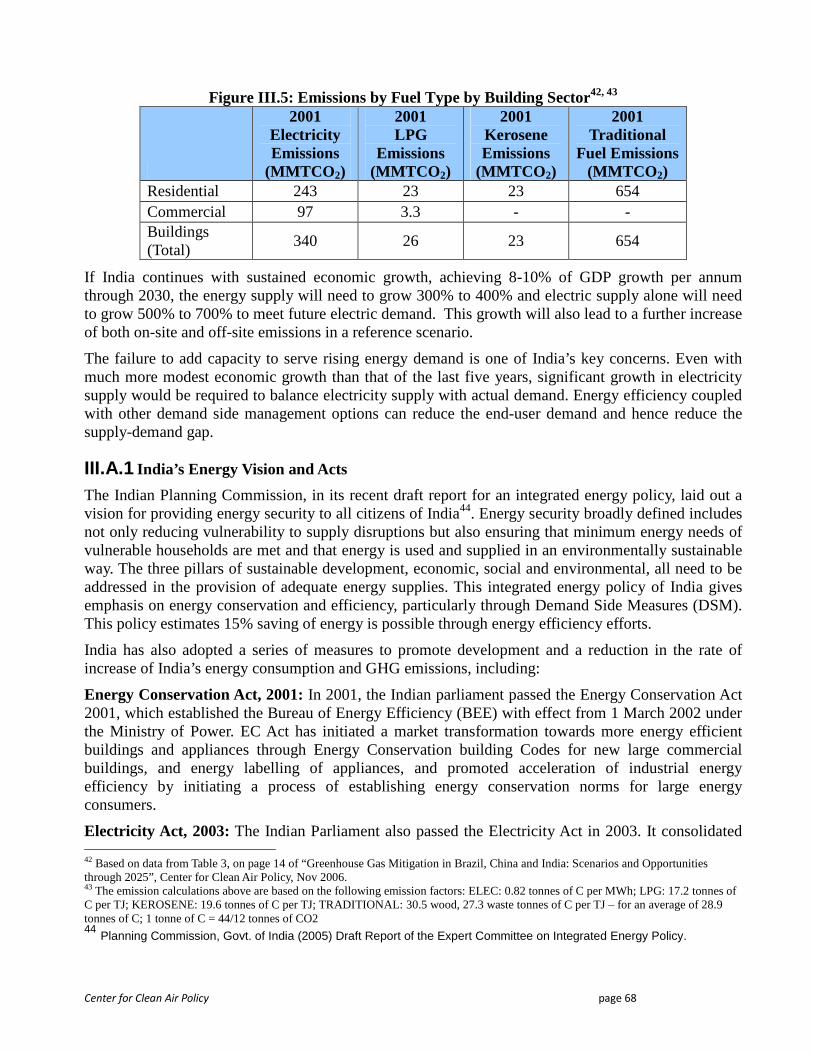
Center for Clean Air Policy page 68
Figure III.5: Emissions by Fuel Type by Building Sector42, 43
2001 Electricity Emissions
(MMTCO 2)
2001 LPG
Emissions (MMTCO 2)
2001 Kerosene Emissions
(MMTCO 2)
2001 Traditional
Fuel Emissions (MMTCO 2)
Residential 243 23 23 654 Commercial 97 3.3 - - Buildings (Total)
340 26 23 654
If India continues with sustained economic growth, achieving 8-10% of GDP growth per annum through 2030, the energy supply will need to grow 300% to 400% and electric supply alone will need to grow 500% to 700% to meet future electric demand. This growth will also lead to a further increase of both on-site and off-site emissions in a reference scenario.
The failure to add capacity to serve rising energy demand is one of India’s key concerns. Even with much more modest economic growth than that of the last five years, significant growth in electricity supply would be required to balance electricity supply with actual demand. Energy efficiency coupled with other demand side management options can reduce the end-user demand and hence reduce the supply-demand gap.
III.A.1 India’s Energy Vision and Acts
The Indian Planning Commission, in its recent draft report for an integrated energy policy, laid out a vision for providing energy security to all citizens of India44. Energy security broadly defined includes not only reducing vulnerability to supply disruptions but also ensuring that minimum energy needs of vulnerable households are met and that energy is used and supplied in an environmentally sustainable way. The three pillars of sustainable development, economic, social and environmental, all need to be addressed in the provision of adequate energy supplies. This integrated energy policy of India gives emphasis on energy conservation and efficiency, particularly through Demand Side Measures (DSM). This policy estimates 15% saving of energy is possible through energy efficiency efforts.
India has also adopted a series of measures to promote development and a reduction in the rate of increase of India’s energy consumption and GHG emissions, including:
Energy Conservation Act, 2001: In 2001, the Indian parliament passed the Energy Conservation Act 2001, which established the Bureau of Energy Efficiency (BEE) with effect from 1 March 2002 under the Ministry of Power. EC Act has initiated a market transformation towards more energy efficient buildings and appliances through Energy Conservation building Codes for new large commercial buildings, and energy labelling of appliances, and promoted acceleration of industrial energy efficiency by initiating a process of establishing energy conservation norms for large energy consumers.
Electricity Act, 2003: The Indian Parliament also passed the Electricity Act in 2003. It consolidated 42 Based on data from Table 3, on page 14 of “Greenhouse Gas Mitigation in Brazil, China and India: Scenarios and Opportunities through 2025”, Center for Clean Air Policy, Nov 2006. 43 The emission calculations above are based on the following emission factors: ELEC: 0.82 tonnes of C per MWh; LPG: 17.2 tonnes of C per TJ; KEROSENE: 19.6 tonnes of C per TJ; TRADITIONAL: 30.5 wood, 27.3 waste tonnes of C per TJ – for an average of 28.9 tonnes of C; 1 tonne of C = 44/12 tonnes of CO2 44 Planning Commission, Govt. of India (2005) Draft Report of the Expert Committee on Integrated Energy Policy.
Center for Clean Air Policy page 69
laws related to generation, transmission, distribution, trade and use of electricity. Among other things, it called for rationalization of electricity tariffs, creation of a competitive environment, and open access in transmission and distribution of electricity. The Act also mandated the creation of regulatory commissions at the central, regional and state levels. As a consequence, the electric utility system is being unbundled, tariffs are being rationalized, and regulatory commissions are playing an active role in enforcement of bill collection and the promotion of DSM programs in some of the larger states.
III.A.2 Key Stakeholders in the Electricity Demand Sector
The major players in electricity demand sector that play a vital role in formulation and implementation of potential policies and mitigation options are given below:
Bureau of Energy Efficiency (BEE): BEE began functioning in March 2002, implementing various program areas identified under the Energy Conservation Act of 2001. BEE’s mission is to develop programs and strategies on self-regulation and market principles with a primary objective to reduce the energy intensity of the Indian economy. Some key activities that BEE is pursuing include the development of energy performance labels for refrigerators, motors, air conditioners, and other mass produced equipment, certification of energy managers and auditors, assisting industry in the benchmarking of their energy use, and energy audits of prominent government buildings. BEE is also working closely with energy development agencies at the state level in order to deliver energy efficiency services including through public-private partnership. One of the priority areas for BEE is to institutionalize energy efficiency services, promote energy efficiency delivery mechanisms, and provide leadership to improvement of energy efficient to reduce energy intensity in the Indian economy. BEE works with various committees of experts and stakeholders (including representatives from industry, consumer organizations, industrial associations, etc.) to implement the programs.
State Designated Agencies (SDAs): The State Government in consultation with BEE can designate any agency as State Designated Agency (SDA) to coordinate, regulate and enforce provision of Energy Conservation Act within the state. The SDAs notified by the respective State Governments are responsible for assisting BEE to carry out their mandate in each individual state. The SDA can also appoint the inspecting officers to ensure the compliance with energy performance standard specified by BEE or ensure display of particulars on labels on equipment and appliances specified under EC Act. The SDA also have power under EC ACT to take steps to encourage preferential treatment for use of energy efficient products within state.
Electric Utilities: Electric utilities have a key stake in the ability to control growth of energy demand, as they continue to deal with capital expenditures for new facilities and income losses associated with power outages. Electric utilities currently play an important role in standards and labelling program by educating the end user towards the benefits of efficient appliances. Electric Utilities should play a large role in building energy efficiency and demand side management to reduce the peak energy usage and slow down the rapid increase in energy demand from the building sector.
International Energy Agency: The Ministry of Power had signed an MOU with the International Energy Agency (IEA) in April 1998, which envisaged close cooperation between India and IEA in various sectors of energy and one important sector agreed for cooperation is Energy Efficiency. IEA-India conference on “Coal and Electricity in India”, in September 2003 in New Delhi and “International Workshop on Standards and Labelling for Consumer Appliances in October, 2004 in Bangalore were held as a outcome of this MOU. Both events proved very popular with stakeholders consisting of manufacturers’ associations, central and state governments, industrial organizations,
Center for Clean Air Policy page 70
electricity regulatory commissions, and NGOs. IEA’s45 cooperation in India’s Energy Efficiency Program for Commercial Buildings is thus imperative and essential.
Apart from the above major players, there are certain additional key stakeholders who are associated with specific fields and aspects of energy efficiency. Following are the additional stakeholders for (1) Products and Energy Efficiency Equipment and (2) Residential and Commercial Buildings.
1. Additional Key Stakeholders for Products and Energy Efficient Equipment
Testing Laboratories: Both government and industry rely upon the technical expertise of leading laboratory personnel when formulating or modifying standards hence the test laboratories also play an important role in standards and labelling program. Both government & Industry needs to be confident that adequate infrastructure is in place to meet Industries’ testing needs.
Manufacturers’ Associations: Manufacturers’ associations viz CEAMA (Consumer Electronics Manufacturers’ Association), ISHARE, ELECOMA etc. These associations are expected to play a major role in policies concerned with appliances.
Retail Organizations: Retailers play a critical role in consumer transactions and appliance/equipment purchases. Sales persons at stores can influence the purchase decision of consumers towards efficient appliances. Hence strategies to influence retailer values are as important as technical considerations and when executed well, help determine the success of labelling initiatives. Sales training is also an important part of a strategy.
Consumer Advocacy Groups: Consumer organizations are an important stakeholder of any policy concerned to appliances since they represent the end user of appliances. These groups proactively defend the consumers’ interests and provide a lot of information about market data. Consumer organizations also disseminate information about energy efficient products among consumers through magazines, news papers and small awareness campaigns. They also ensure compliance of energy efficiency norms by independently checking the products available in the market and keep publishing the data in media.
2. Additional Key Stakeholders for Residential and Commercial Buildings
Energy Service Companies (ESCOs) and Energy Auditors: ESCOs and Energy Auditors are private entities that are contracted by building owners to undertake energy assessment/audit and/or implementation of energy efficiency programs.
City Government and Planners: Government bodies like States Public Works Departments and the Central Public Works Department work towards modernise methods and specifications of works towards ensuring the standardization and uniformity in execution of Construction jobs. For example Delhi Development Authority, (DDA) is the primary body which undertakes activities right from the approval of the architect’s plan to the monitoring of the lawful construction activities.
The Energy and Resources Institute: TERI was formally established in 1974 with the purpose of tackling and dealing with the immense and acute problems that mankind is likely to be faced with in the years ahead, and true to its word it has been fulfilling its mandate of sustainable development by advocating the concept of green buildings, which register minimal impact on the environment. In practicing what it preaches, TERI has constructed its buildings, in Gurgaon, Bangalore and Mukteshwar, along these lines. Resource and energy-efficient, these habitats are exemplary constructs
45 http://www.energymanagertraining.com/announcements/event/BackgroundIEA_4-5Oct2006.pdf
Center for Clean Air Policy page 71
demonstrating the sustainable implementation of green practices. TERI has also introduced GRIHA, a rating system to adjudge the 'greenness' of buildings, in order to popularize this initiative.
The Confederation of Indian Industry: CII works to create and sustain an environment conducive to the growth of industry in India, partnering industry and government alike through advisory and consultative processes CII catalyses change by working closely with government on policy issues, enhancing efficiency, competitiveness and expanding business opportunities for industry through a range of specialised services and global linkages and it might therefore, be useful in bringing the collaboration from Indian Industry sector in demand side efficiency.
Indian Green Building Council: IGBC, based on the US Green Building Council, is actively involved in promoting the green building concept in India. The council is represented by stakeholders of construction industry including corporate, government, nodal agencies, architects, product manufacturers, institutions, etc. The council operates on a consensus based approach and is member-driven and the vision of the council is to usher in a green building revolution and facilitate India emerging as one of the world leaders in green buildings by 2010. The Leadership in Energy and Environmental Design (LEED-INDIA) Green Building Rating System is a nationally and internationally accepted benchmark for design, construction and operation of high performance green buildings that has been designed by IGBC.
Builders' Association of India: BAI is a group comprising of builders, construction contractors, architects, decorators, manufacturers, consultants & suppliers etc. Primary activities of it is to ensure that contractors adopt methods which are environmental friendly like use of pre-engineered and pre-manufactured products, seeking inter-alia tax concessions on the same from the Government and also to support and establish training institutions to train workers and technicians. It might be a very useful link in implementing the programs which require trained workers in energy efficiency.
Confederation of Real Estate Developer's Associations of India: Confederation of Real Estate Developer's Associations of India or CREDAI is the main authority for the development of organized real estate industry in India. Confederation of Real Estate Developer's Associations of India is an autonomous body representing real estate developers across India. The Confederation of Real Estate Developer's Associations of India has more than 3,500 individual real estate developers and builders as members. These members of the association represent more than 60% of the total organized real estate builders operating in the country. The members of Confederation of Real Estate Developer's Associations of India are from 19 state or city level real estate associations. Thus with such a nation wide reach, CREDAI can really be the key participator.
Residential and Commercial Developers/Designers:: There are a number of developers and designers, this would include companies such as DLF Limited (DLF), Unitech Limited, Omaxe Limited, Parsvnath Developers Limited, Housing Development and Infrastructure Limited (HDIL), Sobha Developers Limited, Consolidated Construction Consortium Limited (CCCL), Ramky Infrastructure Limited, Ansal Properties and Infrastructure Ltd (API), Puravankara Projects Limited. Organizations that have more of a commercial building focus includes: Larsen & Toubro Limited (L&T), Punj Lloyd Limited, IVCRL Infrastructure & Projects Limited (IVRCL), Nagarjuna Construction Company Limited (NCC), Hindustan Construction Company Limited (HCC), Simplex Infrastructures Limited, Gammon India Limited, Essar Construction Limited, Navayuga Engineering Company Limited (NECL), National Buildings Construction Corporation Limited (NBCC).
III.B Assumptions and Uncertainties

Center for Clean Air Policy page 72
The mitigation options which are discussed in the next section undertake certain assumptions including:
Macro Economic: The growth of primary energy demand is a consequence of internal economic and social factors such as GDP growth rates, growth of the energy efficiency, losses of the fuels and energy, household structure, per capita income of the people. Since there is a direct correlation between the demand and GDP growth, the growth in energy demand acquires the uncertain character of growth.
Socio Economic: The underlying assumption is that the present trends in consumer consumption behaviour are expected to change over time in sync with the economy. India as a developing economy has witnessed quite rapid growth, which implies that the appliance sector and building sector will witness their share of growth. There is additional uncertainty of regional variations, rural-urban divide, and infrastructure variations.
International Policies: The international environment for energy efficiency is currently sensitive and full of uncertainties because of the various conflicts of interest among nations with regard to financial benefit for emission reductions. CDM is still not recognized as the best answer to emissions reduction worldwide and has been met with much scepticism. International climate change obligations like the Kyoto Protocol does have an impact on domestic energy efficiency policies over time, and thus this analysis has an implicit assumption of a ‘reference’ scenario in near term future and that the upcoming international climate change policy developments will have a positive impact on the domestic energy efficiency policies in reducing the CO2 emissions.
Center for Clean Air Policy page 73
III.C Mitigation Option: Energy Efficient Products and Equipments
III.C.1 Sector Background
The evaluation of greenhouse gas mitigation options in the energy demand sector is challenging. It requires methodologies that allow the comparison of economic-energy and environmental scenarios for alternative fuels and energy technologies and at the same time make the scenarios compatible with current national development goals.
Two ways of increasing the efficiency of electricity usage include: (1) using energy efficient technologies to permanently reduce peak demand; and (2) creating mechanisms that allow electricity customers to occasionally reduce electricity usage for short time periods in response to signals from system operators either for economic purposes or grid safety purposes. The time lag between program implementation and realized electricity savings varies depending on the technologies targeted by a program. End-uses that have a short turnover period, such as lighting, will yield savings sooner than those with longer development periods. Short turnover technologies should be the primary approach for implementation with the current gap between energy demand and supply.
III.C.2 Mitigation Option Methodology for Products and Equipments
In order to establish a methodology for identifying the mitigation options for products and equipments it is very necessary to understand the India market. A major part of Indian population live in serious poverty but growing middle class forms a large base for products and equipments. However levels of deposable income for consumers in this class may still be low relative to those expected in fully developed economies. This means greater price sensitivity in the Indian market.
The Indian market is currently going through changes with regard to Energy Efficiency. Not so long back, there was no apparent concern over the energy efficient products and demand side management. It is only recently that Indian government and the key stakeholders of energy efficiency programs have started taking serious steps towards it. It becomes obvious that the coming years will witness quite a few changes and the market transformation will be optimistically unpredictable. Energy savings by using efficient products and equipments depends on the response of the market as a whole. There is a significant unorganized and small scale manufacturing sector that exists in India for most of the product categories. This sector of overall industry is still less matured compare to the market players of organized sectors. Also in the absence of a robust market monitoring mechanism it is not possible to predict the behavior of the market catered by this unorganized sector.
Moreover, the Indian market is unlike any other develop country’s market so a direct correlation of effects and efforts would not be observable in India. Therefore, in it is best for one to analyze the market in quanta of growth and transformation. Mitigation Options are therefore addressed as Short Term, Medium Term and Long Term. A Short Term Mitigation option is meant for the next three years; a Medium Term Mitigation option would be more appropriate between the 3rd and 7th Year and a long term would be from 7th year onwards. It should however be noted that these Mitigation Options do start at the first year itself – but there effects would be best visible over their respective time frames. These Mitigation options, though different, can be complementary and overlapping with each other. Following is the description of the Mitigation Options:
Short Term Mitigation Option: All the high energy consuming appliances like refrigerator, TV, air conditioners, etc. which are of very old technologies and inefficient, should be immediately replaced
Center for Clean Air Policy page 74
by new- energy efficient appliances in the market. It is estimated that majority of rural population and significant part of town population still uses the appliances which are way more than 10 years old. These appliances not only consume more energy but also consume it in an inefficient manner. Significant reduction in energy consumption can be achieved if these appliances are replaced by newer-technology based appliances. Such savings, on a mass scale, would imperatively lead to significant energy savings.
For example refrigerator consumes maximum energy in a household and it also runs throughout the year. Significant savings in the household electricity bill can be achieved by replacing the old and inefficient refrigerators with the new efficient one.
Medium Term Mitigation Option: Presently the majority of appliances’ manufacturers are using conventional technologies and processes that have been rendered obsolete in developed countries. These technologies should be upgraded to the latest ones so that in the coming years a parallel shift in manufacturing technologies is also realized and be at par with the developed countries in the mid term future.
For example, the majority of refrigerator manufacturers use R600a as a refrigerant which is having a very low global warming potential (approx. 11) as compared to the R134a (global warming potential 1300) which is being used by almost all Indian refrigerant manufacturers. If the Indian manufacturers also shift from this conventional refrigerant to the more efficient one, then they will not only achieve the higher efficiency in energy consumption of refrigerator but will also reduce the GHG emissions in the environment.
Further the government should plan for procurement of energy efficient technologies with greater priority in the medium term.
Long Term Mitigation Option: In order to create a greater demand for efficient appliances it is required to initiate a large scale promotion and special benefits to the manufacturers. It has to be done gradually but effectively by targeting all consumer groups. Creating awareness among the consumers and encouraging them to buy energy efficient products will substantially bring down energy consumption and thus GHGs emissions.
III.C.3 Mitigation Option Results from Products and Equipments
Use of energy efficient appliances and equipment has proven to be one of the most promising instruments for reducing the energy intensity of a country. Many countries have used these mitigation options and delivered tangible results. One such example of successful voluntary energy labelling program is ENERGY STAR in the United States where the savings are largely the result of reduced demand for electricity that totalled an impressive 170 billion kWh—almost 5% of total U.S. electricity demand—and 35 gigawatts (GW) of peak power, equivalent to the capacity of 70 power plants of US in 2006.
A significant savings can be achieved by replacing the old and efficient appliances by new and efficient ones since most of these appliances have a life around 8 -10 years. Owing to slow transformation of Indian market it is expected that India can also achieve energy savings amounting to 5% of the total electricity demand in India. However these savings are expected to occur over a period of three to five years. But as soon as the market matures and there is enough volume and demand for efficient appliances the savings may be increased significantly.
Center for Clean Air Policy page 75
III.C.4 Adoption Barriers for Mitigation Options from Produ cts and Equipments
The market penetration of energy-efficient technologies is often hampered by barriers that are influenced by prices, financing, international trade, market structure, complex institutional mechanism and the provision of information and social, cultural and behavioural factors.
There can be several barriers to the above discussed mitigation options. Primarily some of the important barriers and the ways to overcome are being discussed in this section
1. Often consumers are not aware of the variations occurs in the efficiency of the domestic appliances. This is because of the lack of information about the technical details of the products. Many a times even the sales persons on the shops are not aware of these efficiency variations among same category of products and hence consumers end up buying inefficient products.
2. The enhanced use of energy efficient appliances and technologies is often constrained by the higher costs as compared to the less efficient products. Being a price sensitive market in India the high first cost of the product often drives the consumer away from more efficient products.
3. It requires a significant investment and resources for manufacturers to put while transferring themselves from conventional technologies and processes to efficient and environmental friendly processes to make more efficient products. The cost of the new products goes up while doing so and being a cost sensitive market there is always a fear among manufacturers of not getting the positive market response. Carbon market mechanisms can be one of the major financial tools to promote transfer of technology for sustainable growth. An estimated flow of $100 billion annually is expected in emerging economies by the mid of this century through sale of carbon credits by emerging economies like India. At present India accounts for emission reduction transactions representing more than 111.6 Mt CO2e with an approximate value of $800 million, leveraging climate friendly investment of $2.25 billion. The relative demand for emission reductions from the industrialized countries will depend upon the nature of post 2012 agreements.
4. The continued uncertainty of any post 2012 regime means that there will be an increased emphasis on projects with short lead times, such as demand energy efficiency projects and the projects that are already under sound financial footing. This means that carbon finance has limited influence in investment decisions for large scale infrastructure project with long gestation periods that have the potential to deliver a large quantity of emissions reductions until uncertainty is significantly reduced. Also if CDM is to realize its entire potential in the country then the methodologies have to be applicable to all the energy intensive sectors rather than their current limited application on a project by project basis. While PCDM is an attractive proposition, need is to facilitate the broadening of the methodologies and specific component to the sector level.
5. The Government of India has considered financing for energy efficiency projects as a market based mechanisms and not interfered through any targets programs or funds to promote any specific programs. There is a lack of incentives for the manufacturing sector to undertake energy efficiency improvement projects. The reluctance of the commercial Indian banks in lending funds for energy efficiency measures has been a major barrier in development of CDM projects in the country. The Government of India is expected to respond through the development and implementation of national strategy on energy efficiency finance to further advance the market mechanism. Also a coordinated approach to promote cleaner technologies in various sectors by leveraging carbon market mechanisms is needed.
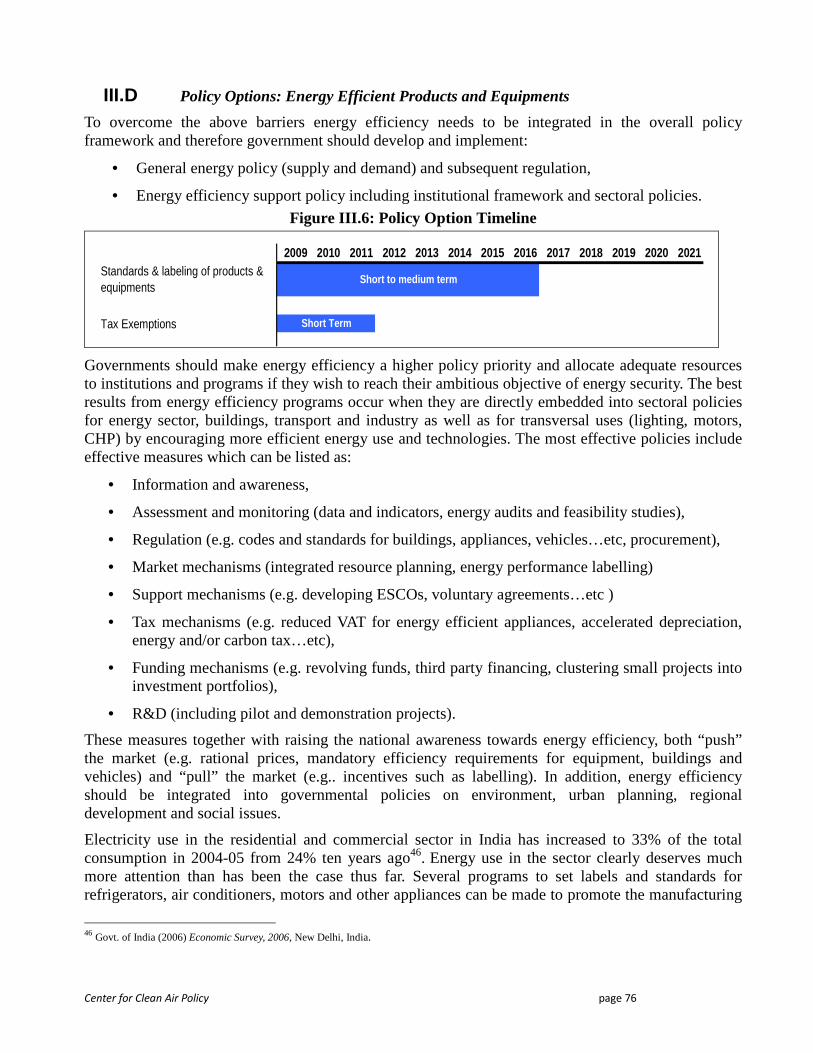
Center for Clean Air Policy page 76
III.D Policy Options: Energy Efficient Products and Equipments
To overcome the above barriers energy efficiency needs to be integrated in the overall policy framework and therefore government should develop and implement:
• General energy policy (supply and demand) and subsequent regulation,
• Energy efficiency support policy including institutional framework and sectoral policies.
Figure III.6: Policy Option Timeline
2009 2010 2011 2012 2013 2014 2015 2016 2017 2018 2019 2020 2021Standards & labeling of products & equipments
Tax Exemptions
Short to medium term
Short Term
Governments should make energy efficiency a higher policy priority and allocate adequate resources to institutions and programs if they wish to reach their ambitious objective of energy security. The best results from energy efficiency programs occur when they are directly embedded into sectoral policies for energy sector, buildings, transport and industry as well as for transversal uses (lighting, motors, CHP) by encouraging more efficient energy use and technologies. The most effective policies include effective measures which can be listed as:
• Information and awareness,
• Assessment and monitoring (data and indicators, energy audits and feasibility studies),
• Regulation (e.g. codes and standards for buildings, appliances, vehicles…etc, procurement),
• Market mechanisms (integrated resource planning, energy performance labelling)
• Support mechanisms (e.g. developing ESCOs, voluntary agreements…etc )
• Tax mechanisms (e.g. reduced VAT for energy efficient appliances, accelerated depreciation, energy and/or carbon tax…etc),
• Funding mechanisms (e.g. revolving funds, third party financing, clustering small projects into investment portfolios),
• R&D (including pilot and demonstration projects).
These measures together with raising the national awareness towards energy efficiency, both “push” the market (e.g. rational prices, mandatory efficiency requirements for equipment, buildings and vehicles) and “pull” the market (e.g.. incentives such as labelling). In addition, energy efficiency should be integrated into governmental policies on environment, urban planning, regional development and social issues.
Electricity use in the residential and commercial sector in India has increased to 33% of the total consumption in 2004-05 from 24% ten years ago46. Energy use in the sector clearly deserves much more attention than has been the case thus far. Several programs to set labels and standards for refrigerators, air conditioners, motors and other appliances can be made to promote the manufacturing
46 Govt. of India (2006) Economic Survey, 2006, New Delhi, India.
Center for Clean Air Policy page 77
and sale of energy efficient appliances. The government can formulate a strategy basis on following key points:
• Formulate minimum efficiency standards: The government should formulate and implement minimum efficiency standards for notified equipment, appliances and buildings. Such efficiency standards should essentially cover building codes, appliance & equipment standards, and requirements for utilities to use energy efficiently.
• Introduce policies for public education: Policies and guidelines to increase public education will include consumer education and awareness building campaigns, mandatory labelling to enable consumers to make informed choice, and utility DSM programs build. Such programmes will help in building market demand.
• Tax incentives to manufacturers: To promote efficiency standards, government should provide tax incentives, rebates, loan guarantees and other benefits to manufacturers for manufacturing of more efficient appliances
• Research and Development with industry: The government should look to collaborate with the industry to continue advances in R&D on energy efficiency products.
Based on the above discussed mitigation options and their subsequent barriers, the policy options are discussed in the following sections and broadly classified as:
• Products and Equipment Standards and Labelling, and
• Tax/ Duty Exemptions for Energy Efficient Products and Equipment
III.D.1 Products and Equipment Standards and Labelling
The products and equipments Standards and Labelling can be an important policy option for Bureau of Energy Efficiency (BEE) in India. The energy-efficiency labelling and standards-setting policy is intended to reduce the energy consumption of all household equipment and appliances without diminishing the services they provide to consumers. A successfully implemented standards and labelling policy can reduce the required investments in power plants and reduce fuel consumption for their operation with powerful economic gains (e.g., freeing up capital for investments in non-energy social infrastructure like schools, roads or hospitals) and environmental benefits (e.g., avoiding carbon emissions).
Energy efficiency labels are informative labels which are used to describe the energy performance of the products usually in the form of energy use, efficiency, or energy cost. These labels are affixed with the appliances and give necessary information to the consumers about the energy efficiency of the products. Hence with the help of energy efficiency labels consumer can make informed purchases. Energy-efficiency standards are procedures and regulations that prescribe the energy performance of products. Mandatory labelling program or MEPS (Minimum Energy Performance Standards) can also prohibit the sale of products that are less efficient than a minimum level.
BEE which has already initiated a standards & labelling program for refrigerators and air conditioners should now start working to introduce endorsement label for other equipments like consumer electronics and office automation products. BEE should start working with various committees of experts and stakeholders (representatives from industry, consumer organizations, industrial associations, etc.) to design the standards and labelling program for implementation in India on a product-by-product basis.
Center for Clean Air Policy page 78
The provisions in the Energy Conservation Act 2001 for Standards and Labelling provide for the following mandate to Bureau of Energy Efficiency (BEE)47:
• Notifying specified equipment and appliances for the purposes of the Act.
• Directing mandatory display of label on notified equipment and appliances.
• Specifying energy consumption standards for notified equipment and appliances not conforming to standards.
• Prohibiting manufacture, sale, purchase and import of notified equipment and appliances.
• Developing testing and certification procedures and promote testing facilities for certification and testing of energy consumption of equipment and appliances
Approach for Equipment Standards and Labelling
All energy-consuming products in households are candidates for the products standards and labelling policy. However setting up energy efficiency regulations and designing a comprehensive labelling program requires considerable financial and managerial resources. Because of this it is not practically possible to develop labels and standards for all household products at the same time. Therefore it is necessary to have screening criteria to establish priorities among the products within the labels and standards option based on which regulations are likely to have the most impact and are easiest and most practical to design and implement from a market perspective.
BEE should start identifying the consumer electronics appliances and equipments for energy labelling based on the following screening criteria:
• They are commonly used,
• The energy intensity of the equipment and appliances are high,
• They have significant impact on total energy demand in that category,
• They contribute to the peak demand because of high market penetration,
• They have the potential for energy efficiency improvement
To start a program for labelling and standards setting for consumer electronics products BEE may select following appliances considering the above mentioned screening criteria.
• Color Televisions (All categories including CRT, LCD and Plasma type)
• Digital Set Top Boxes (Both Free To Air and Pay TV Type STBs)
• Stationary storage type electric water heaters
• Computer and Computer monitors
• Office equipment products including FAX, Scanners, Printers and Multi Function Devices (MFDs)
After implementation of an initial voluntary labelling program for these products BEE should assess
47 BEE’s standard & labeling program (http://www.bee- india.nic.in/Implementation/Standards%20&%20Labellings.html
Center for Clean Air Policy page 79
the market transformation and than formulate the mandatory minimum energy performance standards (MEPS).
The BEE launched the first voluntary comparative energy label for refrigerators in May 2006. The other labelled products till date are air-conditioners, distribution transformers and tubular florescent lamps. BEE should start a process to introduce endorsement label for consumer electronics and office automation products. The endorsement label indicates that the product is among the most energy-efficient models available on the market. The purpose of endorsement labelling is to indicate clearly to the consumer that the labelled product saves energy compared to others on the market. Endorsement labels are a seal of approval indicating that a product meets certain specified criteria. These labels are generally based on a “yes-no” cut-off (i.e., they indicate that a product uses more or less energy than a specified threshold), and they offer little additional information. Typically, endorsement labels are applied to the top tier (e.g., the top 15 to 25%) of energy-efficient products in a market
Implementation Mechanism for Equipment Standards and Labelling
Bureau of Energy Efficiency (BEE) should follow a participatory approach for implementing standards and labelling policy. BEE should interacted with manufacturers and industry associations of the respective equipment and appliances and helped the manufacturers to develop and decide on their own regarding program design, processes and procedures, implementation and enforcement mechanisms.
BEE should constitute a steering committee and technical Committee for each selected equipment and appliance. Steering and technical committee shall comprise of professionals from Government Organizations, manufacturers, their associations, research & testing institutions, technical experts and consumer organizations. Steering committee should advise BEE on the subject area for the establishment of labelling program in their respective areas keeping in view the needs and priority. This committee should review the progress of the program in relation to assigned equipment and make recommendations to matters on which the decisions of the BEE is required. Technical committee should do all the ground work required for setting up standards and labels for assigned equipment and recommend to steering committee for its consideration. They should identify the technical parameters, collect data from market, review the international approaches for the assigned product and develop star rating plans etc.
In beginning of the program BEE should emphasize on the voluntary compliance and self-regulation with minimum check testing and provision for challenge testing of the manufacturer’s declared values by any manufacturer, consumer association or consumer. After the introduction of voluntary program BEE should start the assessment of the market and the penetration of labelled appliances in households. BEE should do an impact assessment study and basis on the market penetration of efficient appliances BEE may ask the steering committee to revise the energy performance standards for appliance labelling. If the market trends are positive for the standards and labelling policy, then BEE can formulate Minimum Energy Performance Standard (MEPS) for specific appliance or equipment. BEE in consultation with State Designated Agency (SDAs) can recommend Ministry of Power (MoP) for the enforcement of MEPS for notified products. The Central Government, by notification, in consultation with BEE, may prohibit manufacture or sale or purchase or import of equipment or appliance specified unless such equipment or appliances conforms to the minimum energy performance standards (clause c of section 14, EC Act 2001).
The successful implementation of a standards and labelling program to achieve the maximum energy
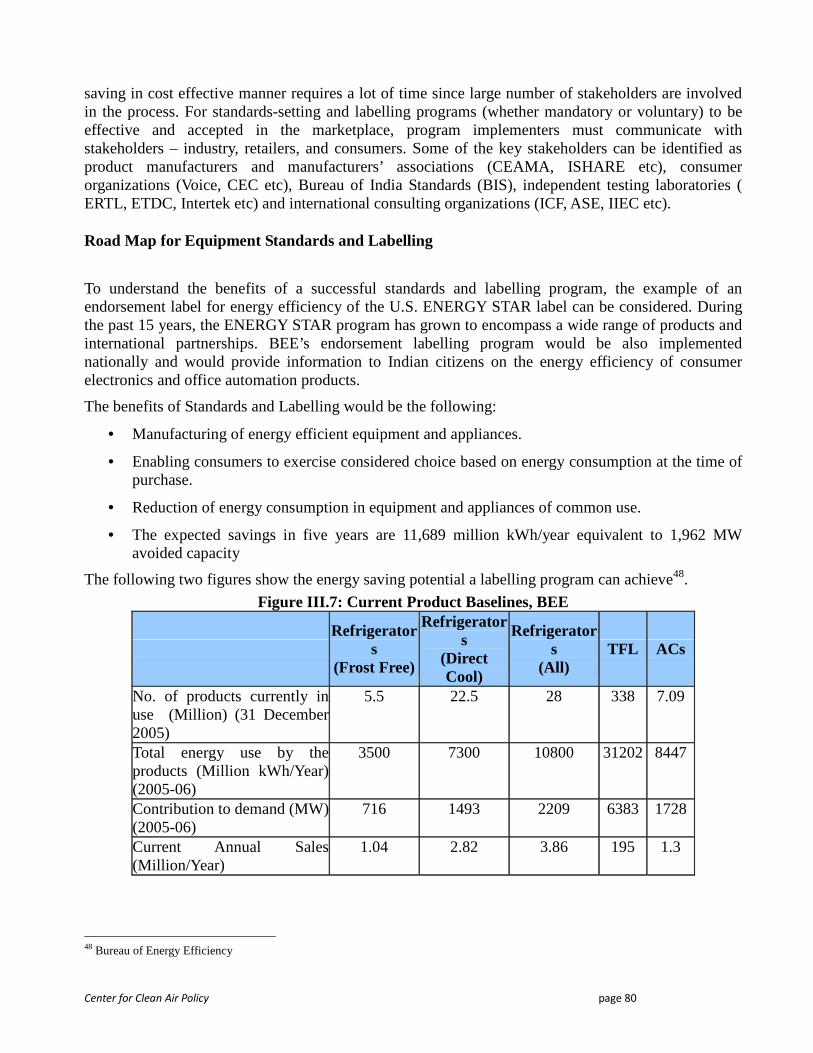
Center for Clean Air Policy page 80
saving in cost effective manner requires a lot of time since large number of stakeholders are involved in the process. For standards-setting and labelling programs (whether mandatory or voluntary) to be effective and accepted in the marketplace, program implementers must communicate with stakeholders – industry, retailers, and consumers. Some of the key stakeholders can be identified as product manufacturers and manufacturers’ associations (CEAMA, ISHARE etc), consumer organizations (Voice, CEC etc), Bureau of India Standards (BIS), independent testing laboratories ( ERTL, ETDC, Intertek etc) and international consulting organizations (ICF, ASE, IIEC etc).
Road Map for Equipment Standards and Labelling
To understand the benefits of a successful standards and labelling program, the example of an endorsement label for energy efficiency of the U.S. ENERGY STAR label can be considered. During the past 15 years, the ENERGY STAR program has grown to encompass a wide range of products and international partnerships. BEE’s endorsement labelling program would be also implemented nationally and would provide information to Indian citizens on the energy efficiency of consumer electronics and office automation products.
The benefits of Standards and Labelling would be the following:
• Manufacturing of energy efficient equipment and appliances.
• Enabling consumers to exercise considered choice based on energy consumption at the time of purchase.
• Reduction of energy consumption in equipment and appliances of common use.
• The expected savings in five years are 11,689 million kWh/year equivalent to 1,962 MW avoided capacity
The following two figures show the energy saving potential a labelling program can achieve48.
Figure III.7: Current Product Baselines, BEE
Refrigerator
s (Frost Free)
Refrigerators
(Direct Cool)
Refrigerators
(All) TFL ACs
No. of products currently in use (Million) (31 December 2005)
5.5 22.5 28 338 7.09
Total energy use by the products (Million kWh/Year) (2005-06)
3500 7300 10800 31202 8447
Contribution to demand (MW) (2005-06)
716 1493 2209 6383 1728
Current Annual Sales (Million/Year)
1.04 2.82 3.86 195 1.3
48 Bureau of Energy Efficiency
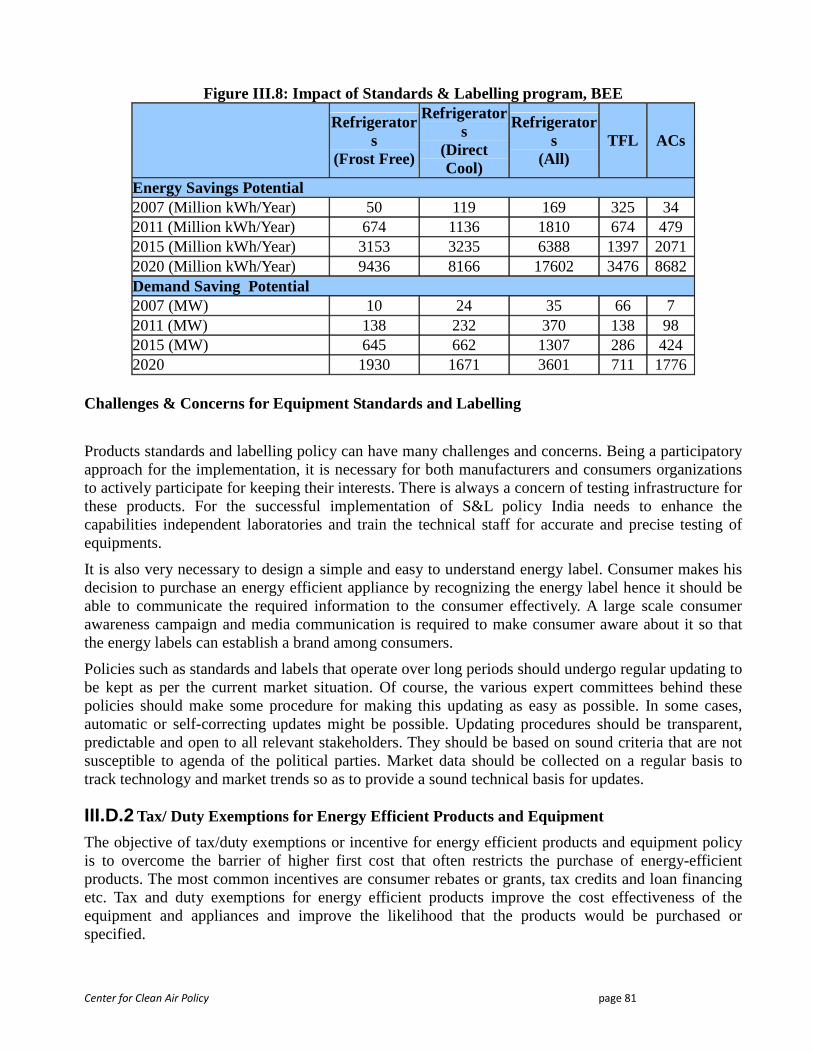
Center for Clean Air Policy page 81
Figure III.8: Impact of Standards & Labelling progr am, BEE
Refrigerator
s (Frost Free)
Refrigerators
(Direct Cool)
Refrigerators
(All) TFL ACs
Energy Savings Potential 2007 (Million kWh/Year) 50 119 169 325 34 2011 (Million kWh/Year) 674 1136 1810 674 479 2015 (Million kWh/Year) 3153 3235 6388 1397 2071 2020 (Million kWh/Year) 9436 8166 17602 3476 8682 Demand Saving Potential 2007 (MW) 10 24 35 66 7 2011 (MW) 138 232 370 138 98 2015 (MW) 645 662 1307 286 424 2020 1930 1671 3601 711 1776
Challenges & Concerns for Equipment Standards and Labelling
Products standards and labelling policy can have many challenges and concerns. Being a participatory approach for the implementation, it is necessary for both manufacturers and consumers organizations to actively participate for keeping their interests. There is always a concern of testing infrastructure for these products. For the successful implementation of S&L policy India needs to enhance the capabilities independent laboratories and train the technical staff for accurate and precise testing of equipments.
It is also very necessary to design a simple and easy to understand energy label. Consumer makes his decision to purchase an energy efficient appliance by recognizing the energy label hence it should be able to communicate the required information to the consumer effectively. A large scale consumer awareness campaign and media communication is required to make consumer aware about it so that the energy labels can establish a brand among consumers.
Policies such as standards and labels that operate over long periods should undergo regular updating to be kept as per the current market situation. Of course, the various expert committees behind these policies should make some procedure for making this updating as easy as possible. In some cases, automatic or self-correcting updates might be possible. Updating procedures should be transparent, predictable and open to all relevant stakeholders. They should be based on sound criteria that are not susceptible to agenda of the political parties. Market data should be collected on a regular basis to track technology and market trends so as to provide a sound technical basis for updates.
III.D.2 Tax/ Duty Exemptions for Energy Efficient Products and Equipment
The objective of tax/duty exemptions or incentive for energy efficient products and equipment policy is to overcome the barrier of higher first cost that often restricts the purchase of energy-efficient products. The most common incentives are consumer rebates or grants, tax credits and loan financing etc. Tax and duty exemptions for energy efficient products improve the cost effectiveness of the equipment and appliances and improve the likelihood that the products would be purchased or specified.
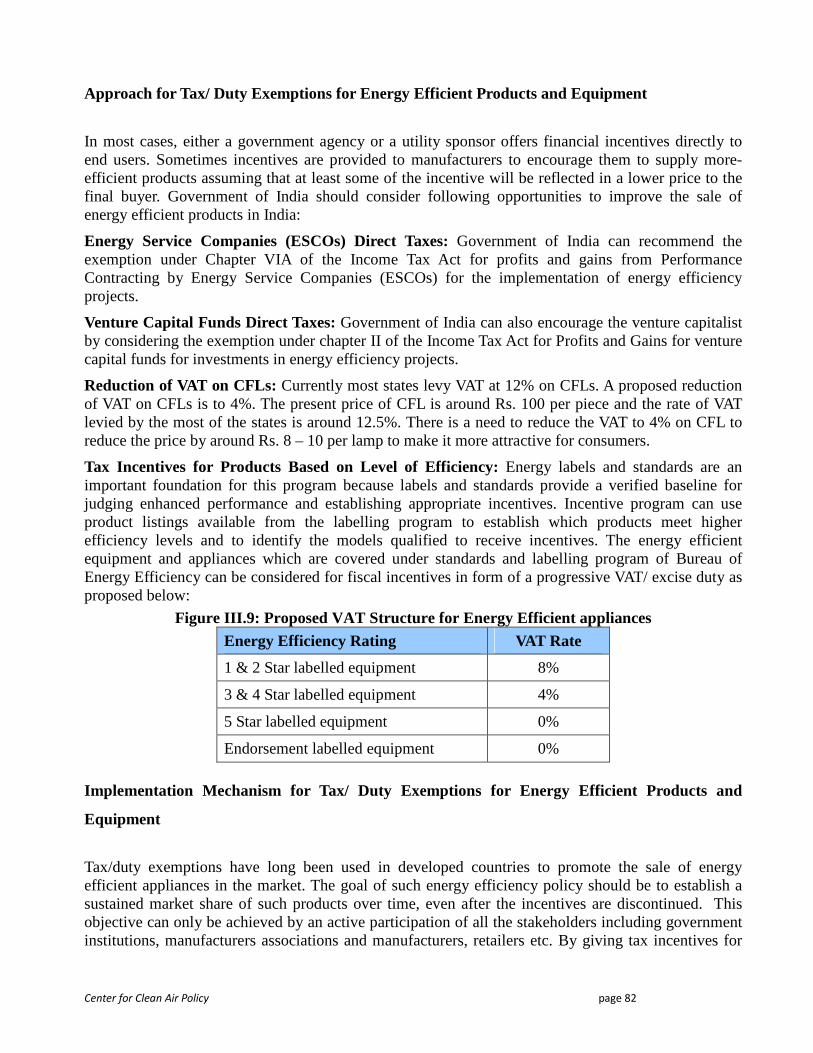
Center for Clean Air Policy page 82
Approach for Tax/ Duty Exemptions for Energy Efficient Products and Equipment
In most cases, either a government agency or a utility sponsor offers financial incentives directly to end users. Sometimes incentives are provided to manufacturers to encourage them to supply more-efficient products assuming that at least some of the incentive will be reflected in a lower price to the final buyer. Government of India should consider following opportunities to improve the sale of energy efficient products in India:
Energy Service Companies (ESCOs) Direct Taxes: Government of India can recommend the exemption under Chapter VIA of the Income Tax Act for profits and gains from Performance Contracting by Energy Service Companies (ESCOs) for the implementation of energy efficiency projects.
Venture Capital Funds Direct Taxes: Government of India can also encourage the venture capitalist by considering the exemption under chapter II of the Income Tax Act for Profits and Gains for venture capital funds for investments in energy efficiency projects.
Reduction of VAT on CFLs: Currently most states levy VAT at 12% on CFLs. A proposed reduction of VAT on CFLs is to 4%. The present price of CFL is around Rs. 100 per piece and the rate of VAT levied by the most of the states is around 12.5%. There is a need to reduce the VAT to 4% on CFL to reduce the price by around Rs. 8 – 10 per lamp to make it more attractive for consumers.
Tax Incentives for Products Based on Level of Efficiency: Energy labels and standards are an important foundation for this program because labels and standards provide a verified baseline for judging enhanced performance and establishing appropriate incentives. Incentive program can use product listings available from the labelling program to establish which products meet higher efficiency levels and to identify the models qualified to receive incentives. The energy efficient equipment and appliances which are covered under standards and labelling program of Bureau of Energy Efficiency can be considered for fiscal incentives in form of a progressive VAT/ excise duty as proposed below:
Figure III.9: Proposed VAT Structure for Energy Eff icient appliances Energy Efficiency Rating VAT Rate
1 & 2 Star labelled equipment 8%
3 & 4 Star labelled equipment 4%
5 Star labelled equipment 0%
Endorsement labelled equipment 0%
Implementation Mechanism for Tax/ Duty Exemptions for Energy Efficient Products and
Equipment
Tax/duty exemptions have long been used in developed countries to promote the sale of energy efficient appliances in the market. The goal of such energy efficiency policy should be to establish a sustained market share of such products over time, even after the incentives are discontinued. This objective can only be achieved by an active participation of all the stakeholders including government institutions, manufacturers associations and manufacturers, retailers etc. By giving tax incentives for
Center for Clean Air Policy page 83
the purchase of efficient appliances both manufacturers and retailers can be encourage to produce and sell more of these appliances. Tax subsidies decrease the risk to manufacturers to introduce energy efficient appliances and hence encourage them to innovate with energy efficiency. Prices subsidies increase the sale of efficient appliances and hence counter the risk of retailers in choosing to stock and display energy efficient products.
At present there is no such provision exist in India to give direct tax benefit to companies for profit and gains they get by serving the industry to implement energy efficiency measures. However, similar exemptions are available for infrastructure sector (80-IA), renewable energy (80-JJA) etc. The number of ESCOs in India are limited and therefore the present business of performance contracting is also limited. This along with other policy measures is expected to provide a favourable environment for investments in energy efficiency.
Also the section-10 (23FB) as amended w.e.f. 1.4.2008 exempts the entire income of venture capital fund from investments made in the areas like nanotechnology, biofuels, IT, hotels, infrastructure etc. The interest in this activity for venture capital firm is limited at this stage. By giving the direct income tax benefit to venture capitalist for the investments in energy efficiency will encourage them to invest venture capital funds in energy efficiency measures that will be in the larger interest of the nation. The likely impact on revenue will be marginal.
Presently in India the cost difference between ordinary lamp and CFL lamp is a multiple of around 10-11 and the reduction of VAT from 12% to 4% will bring it down to 8-9 which is closer to the international multiple of around 7-8. All states can be notified by the central government asking them to reduce the VAT to 4%. The states revenue is expected to remain same since by the reduced price of CFL the sale of will also increase significantly and the state electricity boards will also gain in terms of energy savings.
Roadmap for Tax/Duty Exemptions for Energy Efficient Products and Equipment
As per ADB study in 2004, of performance contracting based energy efficiency improvements in various sectors, it is estimated that direct tax benefit to energy service companies could yield a yearly savings of 54.4 billion units and an avoided capacity addition of 9240 MW. Also the reduction of VAT from 12% to 4% all across can make a huge impact in sale of CFLs. Industry figures shows the fact that around 100 million CFLs are being sold in 2007 alone in India presently, which will further go up by the reduction of VAT on it since price of it will come down. There will be a loss of revenue for states as far as VAT collection is concerned if the numbers of CFL’s sold do not significantly increase. With 400 million light points still on incandescent bulbs, the potential is assessed at a minimum level of saving equivalent to 10,000 MW additional capacity addition for Rs 40,00049 crores (approximately $9-10 billion USD) of investment.
There is no graded taxation based on energy consumption of equipment exist in India. The proposed graded taxation system would encourage the manufacturers for the sale of efficient appliances at lower cost and hence the consumers will also prefer to buy more efficient products. The estimated energy savings annually could be as high as 18 billion units by use of energy efficient equipments and appliances from the year 201250. The likely loss in revenue will be largely offset by the energy consumption reduction as well as the volumes of energy efficient products that would become
49 Bureau of Energy Efficiency 50 Bureau of Energy Efficiency
Center for Clean Air Policy page 84
available in the market.
Challenges & Concerns for Tax/ Duty Exemptions for Energy Efficient Products and Equipment
Sales/excise taxes, VAT etc are an important source of revenue for a state and for nation as well, some of the states may not be agree to reduce the taxes because of the impact on their revenue. States can also consider a “revenue-neutral” tax incentive for efficient products. The idea is to keep the total amount of tax revenue about the same but to vary the tax rate so that the tax is lower on an efficient product and higher on a less-efficient one.
Policy effectiveness is not a matter of one-time energy savings. Government policies should result in “persistent”, or lasting, improvements in energy efficiency. In the case of financial incentive programs, this means that the new more energy-efficient buying patterns and habits remain after the incentives are discontinued. Policies should not discourage stakeholders for undertaking energy efficiency improvements after initial goals are met. Also the tax incentive policy should also be routinely monitored, evaluated and revised to keep it tuned to changing consumer demands, technologies and other parameters, and to increase its effectiveness.
III.D.3 Policy Implementation Barriers in Products and Equipments
Market Structure: The market structure barrier refers to product supply decisions made by equipment manufacturers. This barrier suggests that certain powerful firms may be able to inhibit the introduction by competitors of energy-efficient, cost-effective products.
Financing: The financing barrier refers to significant restrictions on capital availability for potential borrowers. The lack of access to capital inhibits investments in energy efficiency by the classes of consumers. The capital that may be available through, for example, credit card debt (for those who can obtain them), does not distinguish between purchases or investments and is generally very costly compared to other forms of credit. If a consumer wishes to purchase an energy-efficient piece of equipment, its efficiency should reduce the risk to the lender (by improving the borrower’s net cash flow, one component of credit-worthiness) and should, but does not, reduce the interest rate, according to the proponents of the theory of market barriers.
Regulation: The regulation barrier referred to mis-pricing energy forms (such as electricity and natural gas) whose price was set administratively by regulatory bodies. These procedures and the cost structure of the industries typically result in different prices depending on whether they are set based on average costs (the regulated price) or marginal costs (the market price). Historically, the price of electricity as set by regulators was frequently below the marginal cost to produce the electricity. This mis-pricing was claimed to create an incentive to over consume electricity relative to conservation or efficiency.
Inseparability of Features: Buyers may sometimes, be forced to purchase unnecessary/undesirable features in order to acquire energy efficiency or to settle for less efficient equipment. Inseparability of features refers specifically to cases where availability is inhibited by technological limitations. There may be direct tradeoffs between energy efficiency and other desirable features of a product; as an example, it is frequently argued that energy efficiency and safety in automobiles must be traded off against each other because it is not possible with current technology to maintain or increase one while simultaneously increasing the other.
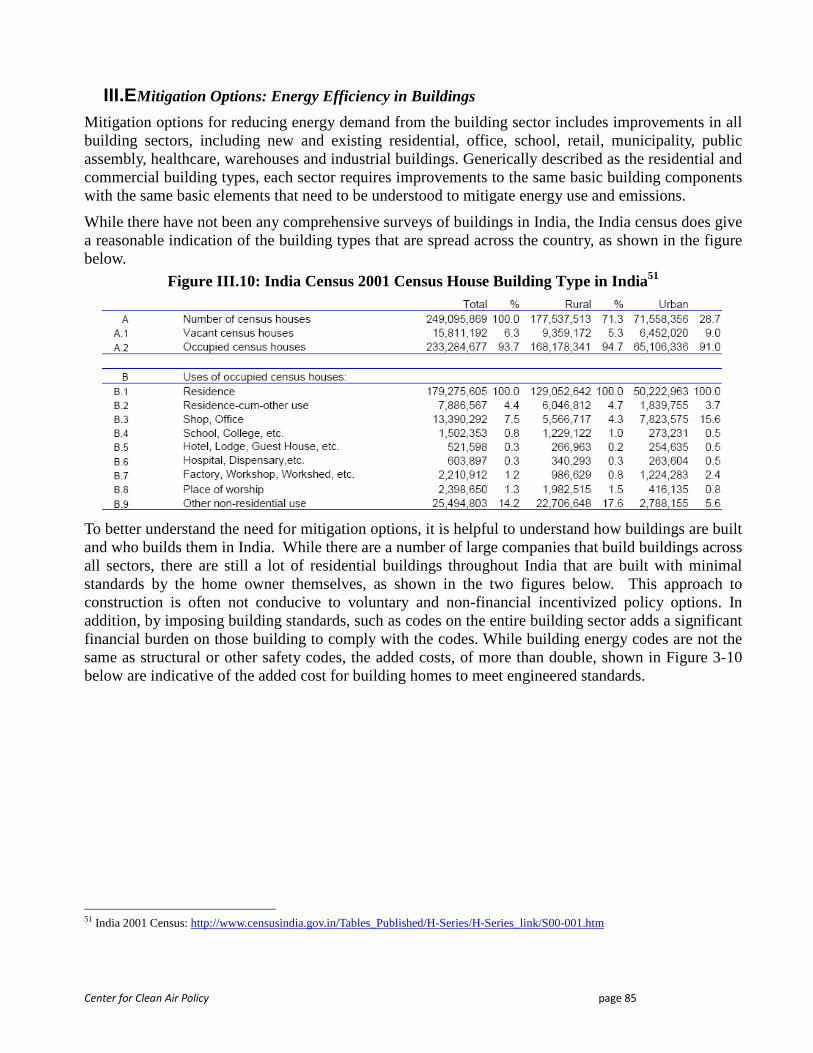
Center for Clean Air Policy page 85
III.E Mitigation Options: Energy Efficiency in Buildings
Mitigation options for reducing energy demand from the building sector includes improvements in all building sectors, including new and existing residential, office, school, retail, municipality, public assembly, healthcare, warehouses and industrial buildings. Generically described as the residential and commercial building types, each sector requires improvements to the same basic building components with the same basic elements that need to be understood to mitigate energy use and emissions.
While there have not been any comprehensive surveys of buildings in India, the India census does give a reasonable indication of the building types that are spread across the country, as shown in the figure below.
Figure III.10: India Census 2001 Census House Building Type in India51
To better understand the need for mitigation options, it is helpful to understand how buildings are built and who builds them in India. While there are a number of large companies that build buildings across all sectors, there are still a lot of residential buildings throughout India that are built with minimal standards by the home owner themselves, as shown in the two figures below. This approach to construction is often not conducive to voluntary and non-financial incentivized policy options. In addition, by imposing building standards, such as codes on the entire building sector adds a significant financial burden on those building to comply with the codes. While building energy codes are not the same as structural or other safety codes, the added costs, of more than double, shown in Figure 3-10 below are indicative of the added cost for building homes to meet engineered standards.
51 India 2001 Census: http://www.censusindia.gov.in/Tables_Published/H-Series/H-Series_link/S00-001.htm
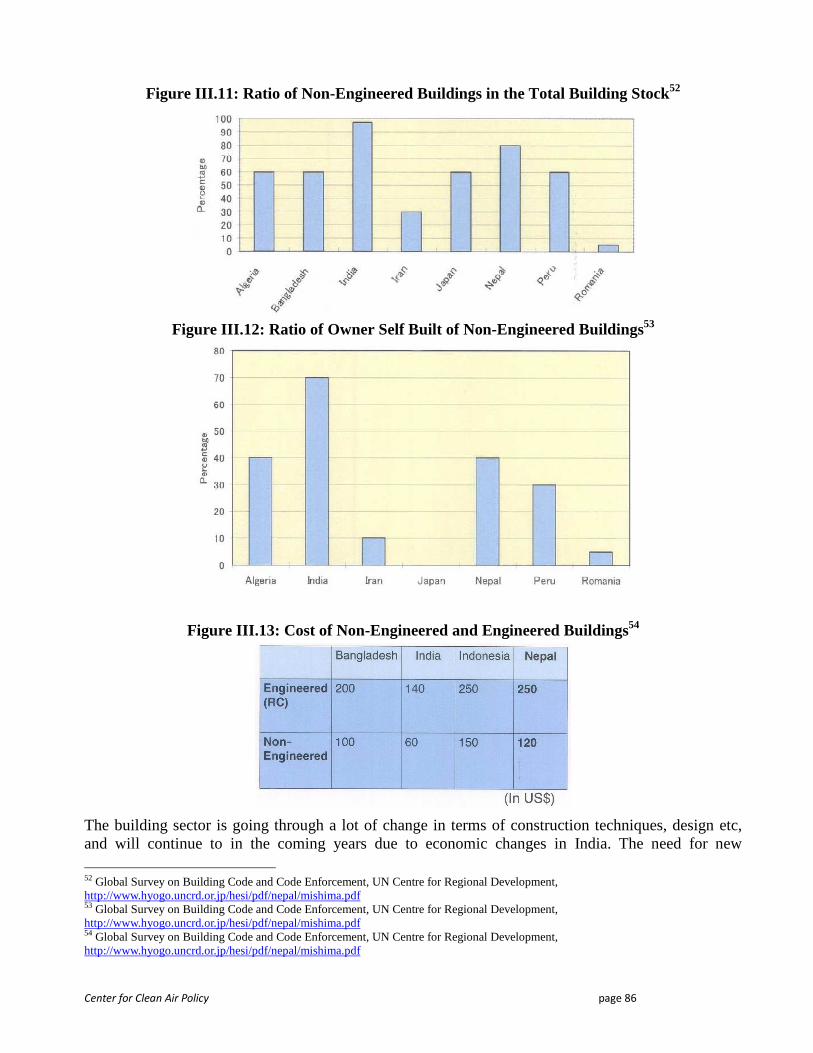
Center for Clean Air Policy page 86
Figure III.11: Ratio of Non-Engineered Buildings in the Total Building Stock52
Figure III.12: Ratio of Owner Self Built of Non-Engineered Buildings53
Figure III.13: Cost of Non-Engineered and Engineered Buildings54
The building sector is going through a lot of change in terms of construction techniques, design etc, and will continue to in the coming years due to economic changes in India. The need for new
52 Global Survey on Building Code and Code Enforcement, UN Centre for Regional Development, http://www.hyogo.uncrd.or.jp/hesi/pdf/nepal/mishima.pdf 53 Global Survey on Building Code and Code Enforcement, UN Centre for Regional Development, http://www.hyogo.uncrd.or.jp/hesi/pdf/nepal/mishima.pdf 54 Global Survey on Building Code and Code Enforcement, UN Centre for Regional Development, http://www.hyogo.uncrd.or.jp/hesi/pdf/nepal/mishima.pdf
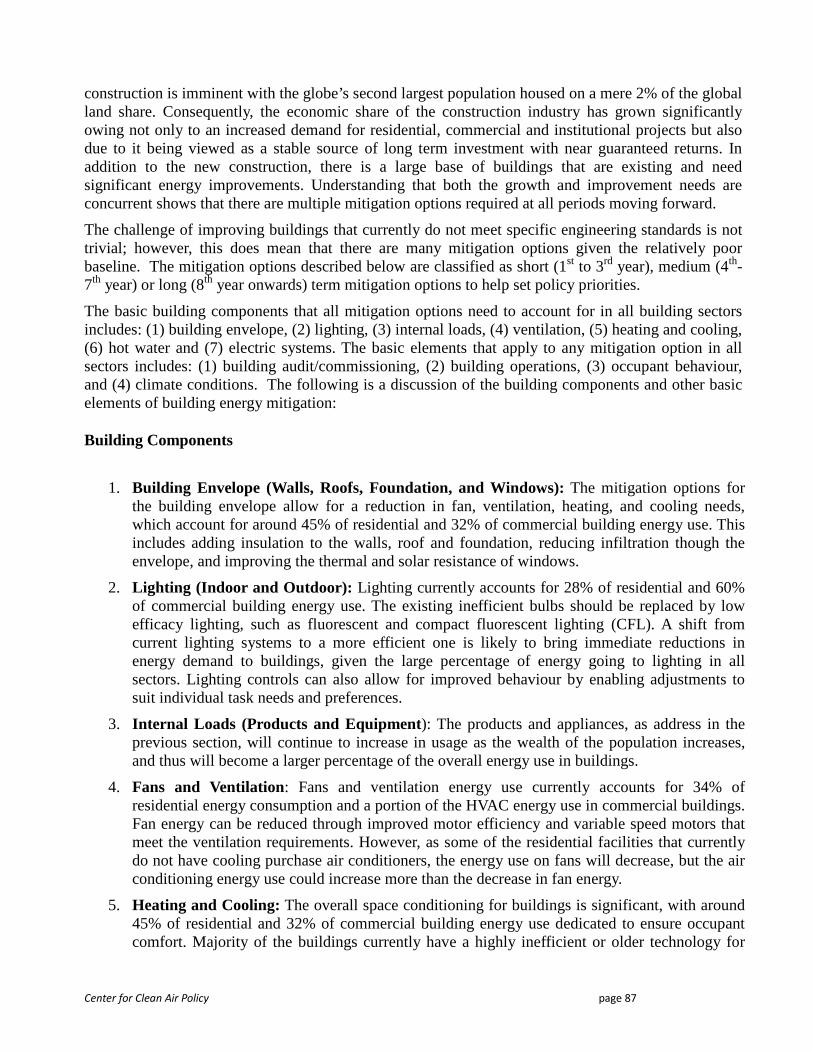
Center for Clean Air Policy page 87
construction is imminent with the globe’s second largest population housed on a mere 2% of the global land share. Consequently, the economic share of the construction industry has grown significantly owing not only to an increased demand for residential, commercial and institutional projects but also due to it being viewed as a stable source of long term investment with near guaranteed returns. In addition to the new construction, there is a large base of buildings that are existing and need significant energy improvements. Understanding that both the growth and improvement needs are concurrent shows that there are multiple mitigation options required at all periods moving forward.
The challenge of improving buildings that currently do not meet specific engineering standards is not trivial; however, this does mean that there are many mitigation options given the relatively poor baseline. The mitigation options described below are classified as short (1st to 3rd year), medium (4th-7th year) or long (8th year onwards) term mitigation options to help set policy priorities.
The basic building components that all mitigation options need to account for in all building sectors includes: (1) building envelope, (2) lighting, (3) internal loads, (4) ventilation, (5) heating and cooling, (6) hot water and (7) electric systems. The basic elements that apply to any mitigation option in all sectors includes: (1) building audit/commissioning, (2) building operations, (3) occupant behaviour, and (4) climate conditions. The following is a discussion of the building components and other basic elements of building energy mitigation:
Building Components
1. Building Envelope (Walls, Roofs, Foundation, and Windows): The mitigation options for the building envelope allow for a reduction in fan, ventilation, heating, and cooling needs, which account for around 45% of residential and 32% of commercial building energy use. This includes adding insulation to the walls, roof and foundation, reducing infiltration though the envelope, and improving the thermal and solar resistance of windows.
2. Lighting (Indoor and Outdoor): Lighting currently accounts for 28% of residential and 60% of commercial building energy use. The existing inefficient bulbs should be replaced by low efficacy lighting, such as fluorescent and compact fluorescent lighting (CFL). A shift from current lighting systems to a more efficient one is likely to bring immediate reductions in energy demand to buildings, given the large percentage of energy going to lighting in all sectors. Lighting controls can also allow for improved behaviour by enabling adjustments to suit individual task needs and preferences.
3. Internal Loads (Products and Equipment): The products and appliances, as address in the previous section, will continue to increase in usage as the wealth of the population increases, and thus will become a larger percentage of the overall energy use in buildings.
4. Fans and Ventilation: Fans and ventilation energy use currently accounts for 34% of residential energy consumption and a portion of the HVAC energy use in commercial buildings. Fan energy can be reduced through improved motor efficiency and variable speed motors that meet the ventilation requirements. However, as some of the residential facilities that currently do not have cooling purchase air conditioners, the energy use on fans will decrease, but the air conditioning energy use could increase more than the decrease in fan energy.
5. Heating and Cooling: The overall space conditioning for buildings is significant, with around 45% of residential and 32% of commercial building energy use dedicated to ensure occupant comfort. Majority of the buildings currently have a highly inefficient or older technology for
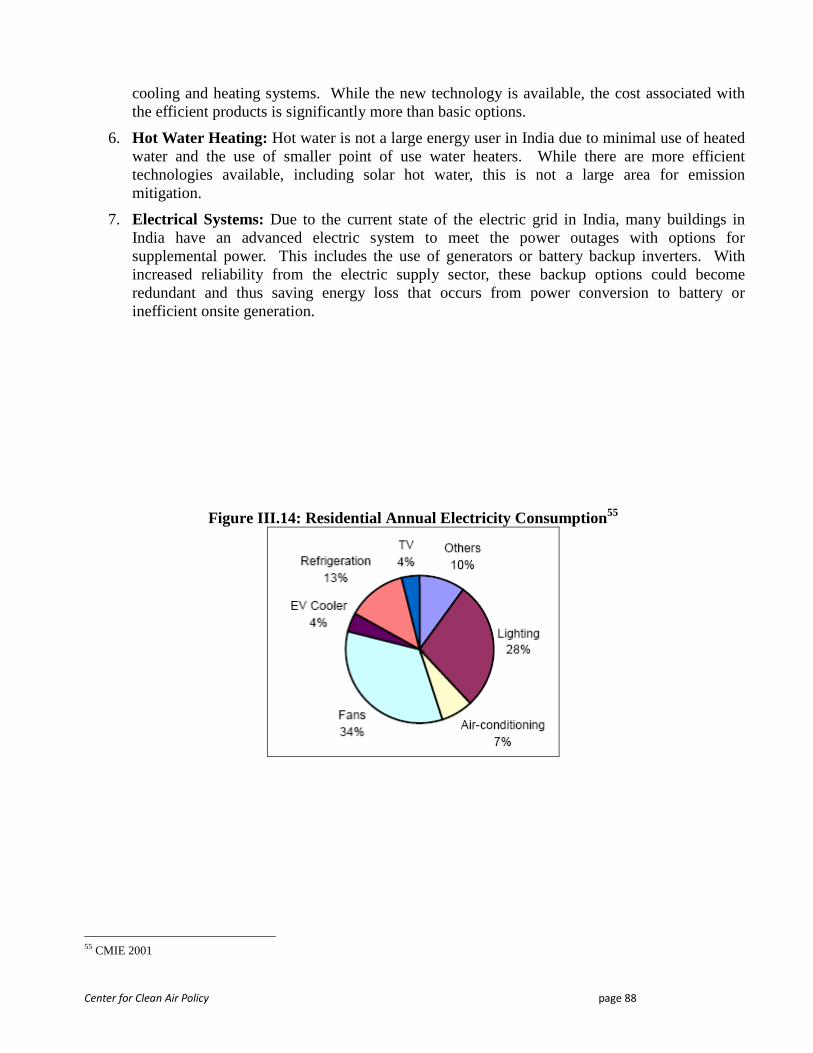
Center for Clean Air Policy page 88
cooling and heating systems. While the new technology is available, the cost associated with the efficient products is significantly more than basic options.
6. Hot Water Heating: Hot water is not a large energy user in India due to minimal use of heated water and the use of smaller point of use water heaters. While there are more efficient technologies available, including solar hot water, this is not a large area for emission mitigation.
7. Electrical Systems: Due to the current state of the electric grid in India, many buildings in India have an advanced electric system to meet the power outages with options for supplemental power. This includes the use of generators or battery backup inverters. With increased reliability from the electric supply sector, these backup options could become redundant and thus saving energy loss that occurs from power conversion to battery or inefficient onsite generation.
Figure III.14: Residential Annual Electricity Consumption55
55 CMIE 2001
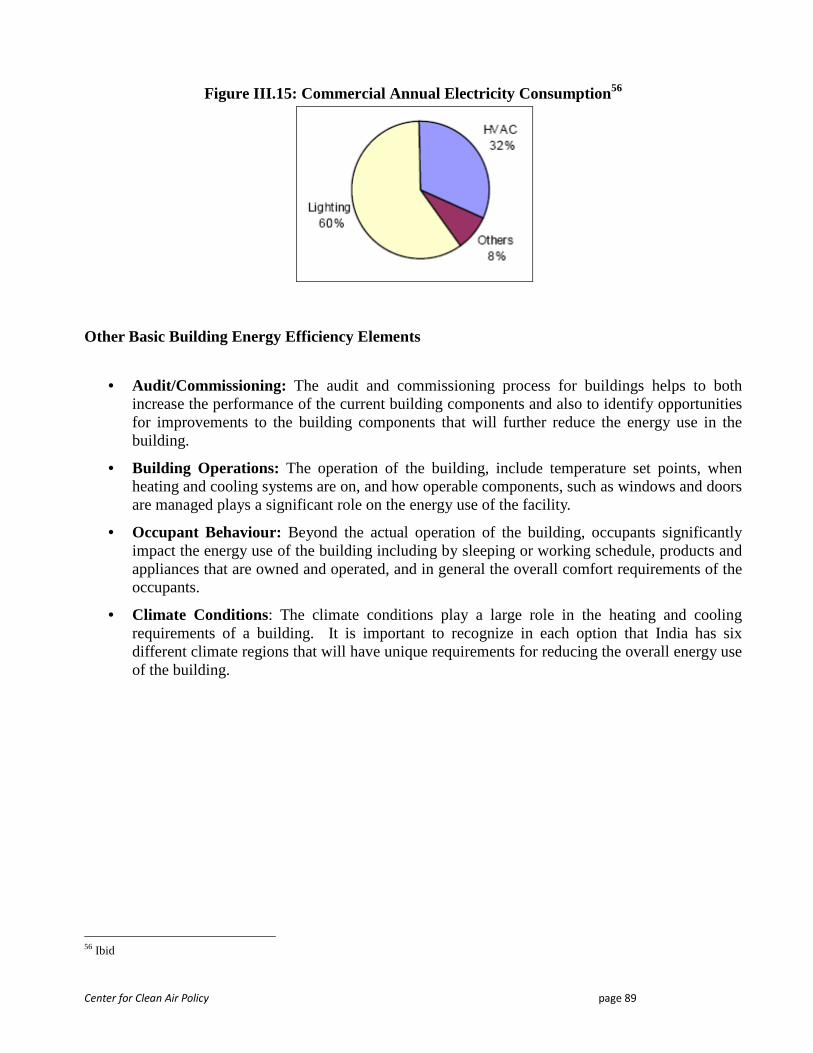
Center for Clean Air Policy page 89
Figure III.15: Commercial Annual Electricity Consumption56
Other Basic Building Energy Efficiency Elements
• Audit/Commissioning: The audit and commissioning process for buildings helps to both increase the performance of the current building components and also to identify opportunities for improvements to the building components that will further reduce the energy use in the building.
• Building Operations: The operation of the building, include temperature set points, when heating and cooling systems are on, and how operable components, such as windows and doors are managed plays a significant role on the energy use of the facility.
• Occupant Behaviour: Beyond the actual operation of the building, occupants significantly impact the energy use of the building including by sleeping or working schedule, products and appliances that are owned and operated, and in general the overall comfort requirements of the occupants.
• Climate Conditions: The climate conditions play a large role in the heating and cooling requirements of a building. It is important to recognize in each option that India has six different climate regions that will have unique requirements for reducing the overall energy use of the building.
56 Ibid
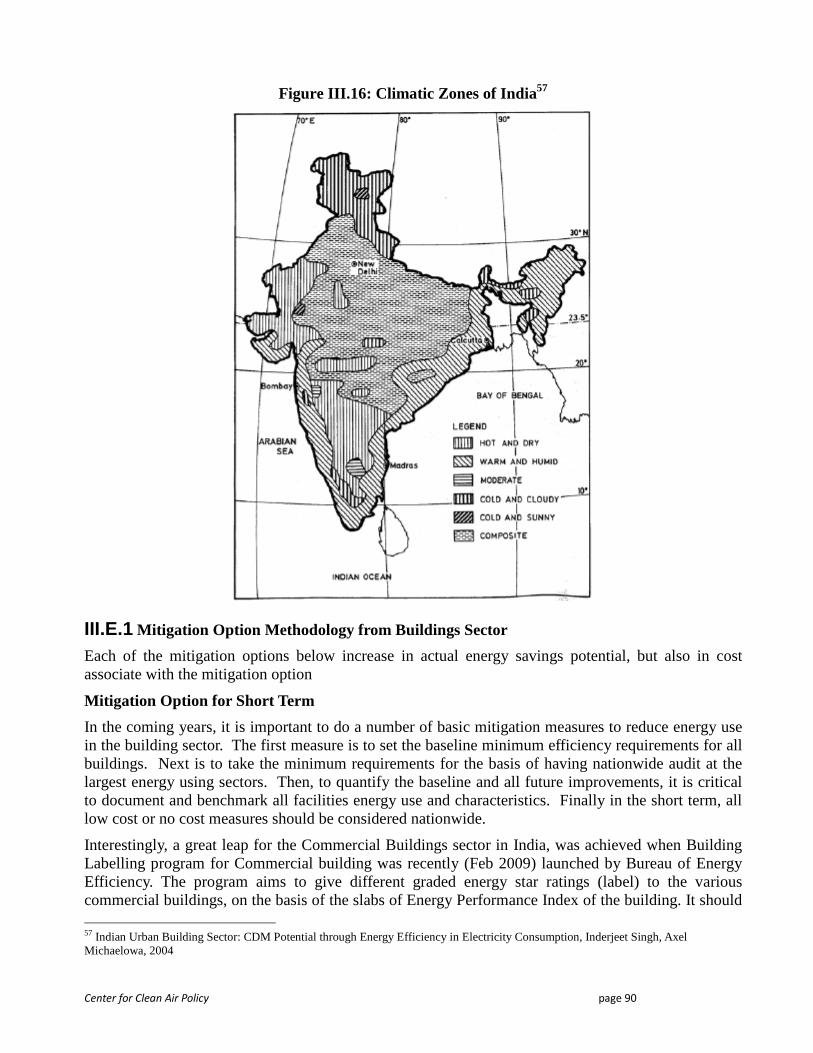
Center for Clean Air Policy page 90
Figure III.16: Climatic Zones of India57
III.E.1 Mitigation Option Methodology from Buildings Sector
Each of the mitigation options below increase in actual energy savings potential, but also in cost associate with the mitigation option
Mitigation Option for Short Term
In the coming years, it is important to do a number of basic mitigation measures to reduce energy use in the building sector. The first measure is to set the baseline minimum efficiency requirements for all buildings. Next is to take the minimum requirements for the basis of having nationwide audit at the largest energy using sectors. Then, to quantify the baseline and all future improvements, it is critical to document and benchmark all facilities energy use and characteristics. Finally in the short term, all low cost or no cost measures should be considered nationwide.
Interestingly, a great leap for the Commercial Buildings sector in India, was achieved when Building Labelling program for Commercial building was recently (Feb 2009) launched by Bureau of Energy Efficiency. The program aims to give different graded energy star ratings (label) to the various commercial buildings, on the basis of the slabs of Energy Performance Index of the building. It should 57 Indian Urban Building Sector: CDM Potential through Energy Efficiency in Electricity Consumption, Inderjeet Singh, Axel Michaelowa, 2004
Center for Clean Air Policy page 91
also be mentioned that the voluntary standard programs like LEED India and TERI-GRIHA, which have been for existent for quite a while now, have already brought good success in capturing many commercial buildings. With these two parallel complimentary approaches of Labelling and Standards of buildings, India may soon witness herself successfully traversing the low carbon trajectory, by abating the electricity demand emissions, in significant proportions.
Mitigation Option for Medium Term
In the mid term years, facilities have the opportunity to apply cost effective measures that are relatively low cost, including significant effort for improved building construction and renovation techniques, improved building maintenance and operations training. The mid term is also the time to spend on improved technologies that do not present significant cost barriers.
Mitigation Option for Long Term
In the long term, all baseline minimum efficiency requirements need to be periodically increased in requirement stringency. As the baseline improves, the above code programs must also periodically increase in requirements and include all measures that pass a life cycle cost effectiveness test, even if the first cost is significant.
III.E.2 Mitigation Option Results from Buildings Sector
The mitigation options discussed above were selected based on their cost effectiveness based on the currently low baseline and based on life cycle energy cost saving potential from each measure. The results for each term are discussed further below.
Short term results:
The goal of the first round of baseline efficiency measures would be to achieve 15% energy savings across all fuel types. As a result of some fuel switching and an increase in overall building amenities that comes with an increase in population wealth, it is hard to assess a straight 15% energy savings. Rather, the electricity baseline would otherwise be increasing each year, while the use of traditional fuels would be decreasing. If 15% were achieved evenly across all energy sources to the building sector and all emission factors remained the same, the short term mitigation option would result in emissions reductions of approximately 137 MMTCO2.
Medium term results:
The typical goal of 30% savings has been used for code improvement goals, early stage energy efficiency programs, like ENERGY STAR, and is between the short term and long term goals of building energy efficiency mitigation measures. If 30% were achieved evenly across all energy sources to the building sector and all emission factors remained the same, the short term mitigation option would result in emissions reductions of approximately 274 MMTCO2.
Long term results:
Based on studies by LBNL, it is achievable to get 50% energy savings from buildings with proper design and operation. While it can be said that 100% reduction is also achievable, the 50% target for energy savings is more typical goal for long term efficiency program measures. If 50% were achieved evenly across all energy sources to the building sector and all emission factors remained the same, the short term mitigation option would result in emissions reductions of approximately 457 MMTCO2.
Center for Clean Air Policy page 92
III.E.3 Adoption Barriers to Mitigation Options from Buildi ngs Sector
The potential barriers can be classified mainly as under the following:
Priorities: Many builders and contractors realize that opportunities to save energy and lower costs may exist, but they are not very enthusiastic to move forward with them. Others do not perceive the need, or feel a sense of urgency, to implement energy efficiency measures. It is a low priority compared with other objectives. Moreover, a chunk of population in India dwells in rural areas, most of which do not have even the basic amenities. Expecting them to employ energy efficient measures, which might not be cost effective, is unfair.
Lack of benchmarking: Builders and contractors often lack detailed energy consumption information about their facilities to help them understand their own energy and infrastructure needs as well as to identify and implement more beneficial energy savings choices. They also may lack the analytical tools to determine whether their facility is a good candidate for an energy efficiency project or not. Many builders do not have competent and knowledgeable technical staff that can successfully implement energy efficiency improvement programs
Investment costs: Often, building owners and contractors are not convinced about the initial high investment that is required in few of the energy efficiency measures. The fact that returns from energy savings are generally spread over a longer period of time, deters the builders to go for high cost energy efficiency measures.
Lack of understanding of comprehensive benefits: Most building owners and contractors are not aware that comprehensive energy efficiency projects can meet multiple objectives. Energy efficiency retrofits not only decrease energy use and costs; but they also improve the facility infrastructure, lower operating and maintenance costs, reduce environmental impacts and improve comfort levels. In many instances energy efficiency helps a facility owner to improve its competitiveness by lowering operating costs.
III.F Policy Options: Energy Efficient Buildings
There are a number of policies that could be conducted to improve the energy efficiency of the building sector in India. The following four policies have potential for improving the efficiency of buildings:
Building Energy Codes: Building codes set a series of minimum requirements/standards that all buildings should comply with. Building codes can be mandatory or voluntary depending on the enforcement options available to the market. Building codes should be set up to cover all type of buildings including new or existing in each of the building sectors like residential, commercial or industrial buildings.
Building Labelling: The India Green Building Council is the first well recognized labelling program for buildings in India to be energy efficient and sustainable. Other labelling programs for buildings around the world include the USGBC LEED program and US EPA’s ENERGY STAR program.
Tax Incentives: Tax incentives, such as property tax breaks for owners or developers of energy-efficient buildings, or buyers or manufactures of energy efficient products offer a simple financial means to promoting and tracking energy efficiency. The tax incentive could occur at various times of the life of the building or product, including at the construction, the purchase transaction or over the life of the product or building.
Time Zones: India can have multiple time zones similar to many larger countries around the world to

Center for Clean Air Policy page 93
reduce energy consumption. Daylight could be used to better effect if the country was divided by a north-south line into two or three time zones. India's east-west span of over 2,000 km covers over 28 degrees of longitude, results in a two hour time difference in the sun rise and set across Arunachal Pradesh in the east and Rann of Kutch in the west. If these variations are taken into account, much of the savings can occur without any capital investment.
On a timeline they can be represented as following: Figure III.17: Policy Option Timeline
Policies/Time Period 2009 2010 2011 2012 2013 2014 2015 2016 2017 2018 2019 2020 2021
Time Zones
Tax Incentives
Building Labelling
Building Energy Codes Medium term
Short Term
Short to medium term
Short Term
The policies are discussed in further detail in the sections below.
III.F.1 Building Energy Codes
Building codes set a series of minimum requirements/standards that all buildings should comply with. Building codes can be mandatory or voluntary depending on the enforcement options available to the market. Building codes should be set up to cover all type of buildings including new or existing in each of the building sectors like residential, commercial or industrial buildings. Unlike the developed countries, India had never witnessed any standard building energy efficiency codes, until just recently with the release of the voluntary ECBC from the BEE for commercial building. Therefore most of the buildings are highly energy inefficient, as described previously. The buildings in India consume energy not only in an inefficient way but also in surplus. Despite the obvious apparent inefficiencies, surprisingly, there is a general lack of literature that quantifies the potential for cost savings, GHG mitigation or energy savings for buildings in India. This perhaps, is one of the major hurdles in progressing on the path of energy efficiency.
In the United States, the Department of Energy estimates that their building codes program saves approximately $1 billion per year58, with estimated savings of $5.3 billion for the year 2030.
Currently there is no formal structure for residential building codes. To achieve any substantial impact through energy efficiency standard building codes for residential sector has to be evolved. These codes can be a modification of the practices that are followed in the developed countries by translating them to Indian context. The government should start a collaborative initiative that actively works with all stakeholders of the home building industry.
With an effective building energy code, not only will baseline buildings improve in their efficiency, but the opportunity for higher efficient buildings to be labelled will become more effective and accepted by the market. The energy evaluation and labelling of buildings will not only demonstrate their potential to save energy but also improve market transparency, which can be a catalyst for greater energy efficiency in buildings.
58 DOE: http://www.energycodes.gov/whatwedo/
Center for Clean Air Policy page 94
Approach for Building Codes
Energy Conservation Building Codes (ECBC) was voluntary introduced in May 2007 to set minimum energy efficiency standards for design and construction and encourages energy efficient design or retrofit of buildings. The code has been developed such that it should not constrain the building function, comfort, health, or the productivity of the occupants and the lifecycle costs, both first costs at construction and recurring costs including energy costs, are minimized.
The current ECBC is very general to cover the basics of many buildings, but does fail to address the specific issues of many commercial building. Therefore, India can leap forward by developing specific building energy code language for: residential, malls/shopping centres, data centres, schools, academic institutions, banks, special economy zones (SEZs), and other facilities not currently covered by the ECBC.
For both the new and existing construction, a building rating system should be designed to quantify the potential impact of energy efficiency measures. The rating system should be supported with a verification process which would involve performing the necessary in-field inspections to confirm whether the measures have been installed. The advantages include the ability to audit the progress for baseline energy codes, higher energy efficiency measures, and quantify emission and energy reduction for potential carbon market benefits. The information gathered from this verification process can also prove to be a good starting point of information for future policies.
Implementation Mechanism for Building Energy Codes
In India, on one hand, voluntary programs have a bleak chance of bringing successful results and on the other; a mandatory program is usually met by stiff resistance. An implementation mechanism which can trade-off the two scenarios should be in place for an effective implementation. One basis would be to have the building energy codes as voluntary but mandatory compliance required to receive any financial or other systematic benefit from the policy.
The enforcement and verification of building codes is difficult in many countries, but the government would need to require the use of code officials to verify compliance with code to quantify achieved savings. While this increases bureaucracy, it is a baseline requirement for this policy option to function consistently in India. The verification and documentation should be coordinated by State Nodal centres for Energy Efficiency.
Evaluation Mechanism for Building Codes
State Nodal centres, as explained above, will have the verified data for the buildings that are built to comply or exceed the minimum building energy code. The number of buildings that will be getting verified or certified would give a clear indication of the energy savings that would be achieved. Further auditing and benchmarking of the buildings should be done in a phased manner so as to have data for energy savings achieved each year and to record emission reductions delivered by energy efficiency, renewable energy and other building emission reduction actions. This would also imply bringing in trained code officials or building auditors/raters who would assess the performance level of the building after the conducting a detailed review.
Center for Clean Air Policy page 95
Road Map for Building Codes
Energy Codes have needed start as a voluntary initiative to actively promote the transformation of the mainstream home building industry towards more sustainable practices. It is estimated that the impact of ECBC would be to reduce energy use for buildings from a proposed National Benchmark (180 kWh/m2/year) to an ECBC compliant building (110 kWh/m2/ year).
Most commercial buildings in India have energy performance index (EPI) of 200 to 400 kWh/ m2/ year. Similar buildings in North America and Europe have EPI of less than 150 kWh/ m2/ year energy-conscious building design has been shown to reduce EPI to 100 to 150 kWh/m2/ year in India when restricted to environmentally-sensitive corporate arena.
Energy saving potential in the range of 23% - 46% has been identified through energy audits conducted in public buildings. Under the 1st phase of Energy Efficient Govt. Buildings Programme, 9 public buildings were taken up for energy audits. 17 additional Government buildings have been undertaken for 2nd phase through performance contracting under the ESCO route. A national program for existing buildings is under preparation Innovative financial instruments for promoting performance contracting are being developed to overcome lack of effective delivery mechanism.
Interface with Existing Policies for Building Codes
The Bureau of Energy Efficiency has taken the first step forward in formulating Energy Conservation Building Codes for the first of its kind in India, for commercial sector. Although nearly one hundred buildings are already following the Code and compliance with it has been incorporated into the Environmental Impact Assessment requirements for large buildings. However, the scope of energy conservation building codes is not limited to large commercial buildings only. The country is building-up numerous software parks, special economy zones, shopping malls and large housing complexes. This provides opportunity for further energy conservation in these establishments.
Indian Green Building Council (IGBC) has recently been established to promote Leadership in Energy and Environmental Design and evolve a national green building rating system. But no codes exist for residential buildings in India as of now. A rating mechanism called ‘Griha’ (Green Rating for Integrated Habitat Assessment), which has been developed by The Energy and Resources Institute (TERI) and the Ministry of New and Renewable Energy Sources based on inputs from the Power Ministry’s Energy Conservation Building Code, is in the process of being implemented for new commercial, institutional and large-scale residential buildings.
III.F.2 Time Zones
The use of time zones can be used in multiple ways to improve the opportunities for energy demand reduction. One way includes the use of location dependent time zones and the other is to have seasonally dependant time zones.
For the location specific time zones, India can have multiple time zones similar to many larger countries around the world to reduce energy consumption. Daylight could be used to better effect if the country was divided by a north-south line into two or three time zones. India's east-west span of over 2,000 km covers over 28 degrees of longitude, results in a two hour time difference in the sun rise and set across Arunachal Pradesh in the east and Rann of Kutch in the west. If these variations are taken into account, much of the savings can occur without any capital investment.
Center for Clean Air Policy page 96
For the seasonally depended time zones, Daylight Saving Time (DST) is an approach to optimise the daylight seen by a person on a fixed time schedule due to the changing amounts of daylight throughout the year, as the seasons change. In location specific time zone away from the equator, there are more hours of daylight per day in summer than there are in winter. So, the goal of DST is to adjust the typical waking hours so as to maximize the daylight hours available. By adjusting clocks forward on a specific date by a standard amount, (usually one hour), people can take better advantage of daylight during their typical working day.
Using DST approach would shift the peak of energy demand and also bring the total energy demand down. If people are working into the evening in the winter, when it gets dark, the lighting is on for one extra hour than it would have to be compared to if people were to leave the building when it gets dark. This effect would not only be on lighting, but also on overall energy consumption including temperature settings, HVAC systems and overall heating and cooling energy use. The advantage of DST policy is that, it requires minimal investment and yet produces sizeable impact with great uniformity. Though initially, the challenge that it will face is in the behavioural resistance of people but it can easily be overcome if the people are made aware of the positive impacts of it.
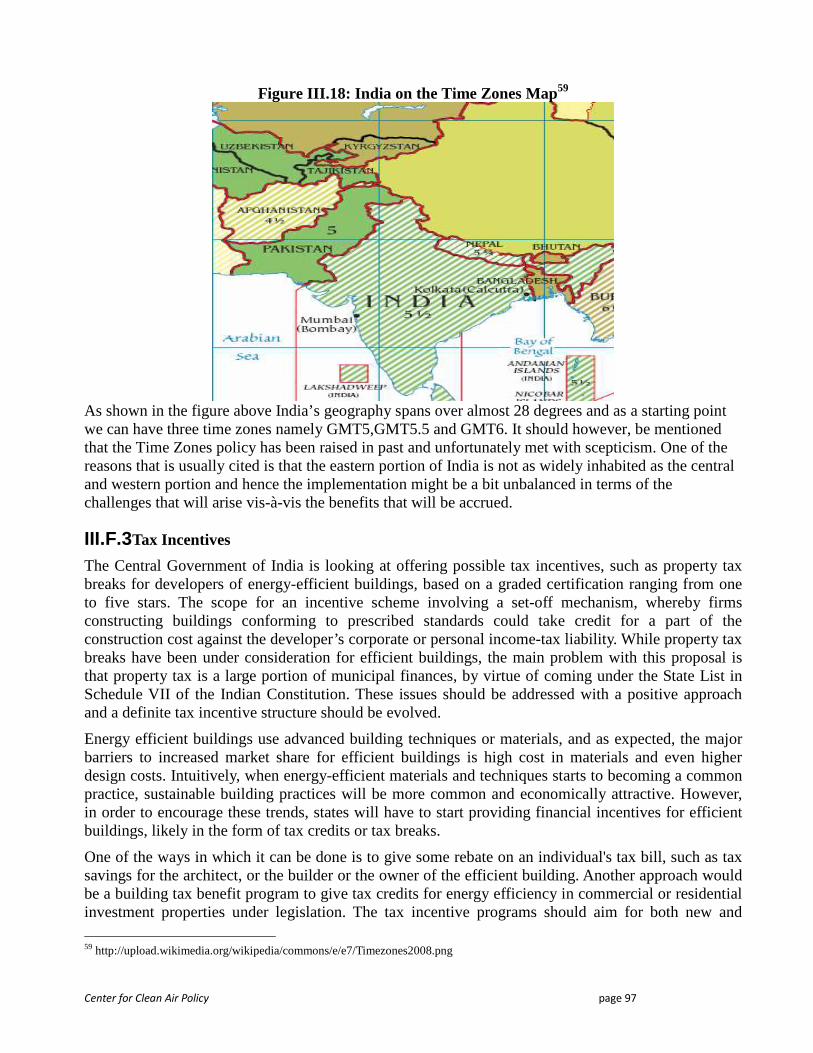
Center for Clean Air Policy page 97
Figure III.18: India on the Time Zones Map59
As shown in the figure above India’s geography spans over almost 28 degrees and as a starting point we can have three time zones namely GMT5,GMT5.5 and GMT6. It should however, be mentioned that the Time Zones policy has been raised in past and unfortunately met with scepticism. One of the reasons that is usually cited is that the eastern portion of India is not as widely inhabited as the central and western portion and hence the implementation might be a bit unbalanced in terms of the challenges that will arise vis-à-vis the benefits that will be accrued.
III.F.3 Tax Incentives
The Central Government of India is looking at offering possible tax incentives, such as property tax breaks for developers of energy-efficient buildings, based on a graded certification ranging from one to five stars. The scope for an incentive scheme involving a set-off mechanism, whereby firms constructing buildings conforming to prescribed standards could take credit for a part of the construction cost against the developer’s corporate or personal income-tax liability. While property tax breaks have been under consideration for efficient buildings, the main problem with this proposal is that property tax is a large portion of municipal finances, by virtue of coming under the State List in Schedule VII of the Indian Constitution. These issues should be addressed with a positive approach and a definite tax incentive structure should be evolved.
Energy efficient buildings use advanced building techniques or materials, and as expected, the major barriers to increased market share for efficient buildings is high cost in materials and even higher design costs. Intuitively, when energy-efficient materials and techniques starts to becoming a common practice, sustainable building practices will be more common and economically attractive. However, in order to encourage these trends, states will have to start providing financial incentives for efficient buildings, likely in the form of tax credits or tax breaks.
One of the ways in which it can be done is to give some rebate on an individual's tax bill, such as tax savings for the architect, or the builder or the owner of the efficient building. Another approach would be a building tax benefit program to give tax credits for energy efficiency in commercial or residential investment properties under legislation. The tax incentive programs should aim for both new and
59 http://upload.wikimedia.org/wikipedia/commons/e/e7/Timezones2008.png

Center for Clean Air Policy page 98
existing buildings energy efficient projects. There should be strict standards that must be abided by and should be detailed within the legislation, including mandatory verification and data collection.
The various tax components for building tax benefit program can have various components to encourage efficient buildings through financial gain to various sections of the overall building supply chain. Tax benefits could go to any of the following:
A. The implementing agency: to encourage strong leadership and verification standards for efficient buildings,
B. The designers, architects, developers, constructor/builder or contractor: to encourage design and construction despite added effort and change of business practice,
C. The building owner: to encourage buyers despite higher costs, and/or
D. The successor tenant: to encourage future energy efficiency improvements.
These tax incentives should be a joint program between the Income Tax Department and the BEE to ensure both financial and energy efficiency accountability.
The bottom line however, is that the tax structure should actually serve as a push for the energy efficiency implementation, and that there should be absolute improvements that are achieved, and not just the economic. Broadly, there are two challenges associated with the seemingly straightforward policy of Tax incentives: First, technically property taxes are a domain of the Municipality and so the proposed tax breaks must be laid out cautiously such that it does not interfere with the interests of the Central Government Tax department. Achieving this, would require a critical comparative analysis of the different formats of the tax structure that may be proposed.
Second challenge is that, though the idea of tax breaks has been quite successful in developed countries, it would be being too optimistic to hope that the same models would work in India as well. The reasons for such scepticism gets borne after witnessing the examples of past, where Indian market has reacted in unpredictable ways to the India-customised-models-of-abroad. An ideal way to address this would be to introduce Tax break structure in phases at different parts of the country. And with time, the structure should be evolved after feedbacks from those parts, before a nationwide structure is launched in full throttle.
III.F.4 Above Code Building Labelling
Energy labelling of buildings, similar to product labelling, helps to encourage the construction, sale and use of energy efficient buildings. The process for labelling buildings can also assist in tracking the building energy consumption of buildings over time; give building owners and operators the ability to set target for energy efficiency and track improvements; and quantify the carbon footprint of the building.
Multiple labelling systems for sustainable buildings have been applied in India including:
• The Leadership in Energy and Environmental Design (LEED-INDIA), and
• Green Rating for Integrated Habitat Assessment, GRIHA,
The Leadership in Energy and Environmental Design (LEED-INDIA) Green Building Rating System is a nationally and internationally accepted benchmark for the design, construction and operation of high performance green buildings. LEED-INDIA provides building owners, architects, consultants, developers, facility managers and project managers the tools they need to design, construct and
Center for Clean Air Policy page 99
operate green buildings IGBC, is actively involved in promoting the Green Building concept in India and implementing the LEED India.
TERI-GRIHA (TERI-Green Rating for Integrated Habitat Assessment) is a tool for measuring and rating a building’s environmental performance in the context of India’s varied climate and building practices. Designed as a unique system that evaluates a building’s compatibility with environmental priorities, TERI aims to mainstream the concept of green buildings in India. TERI-GRIHA, by its qualitative and quantitative assessment criteria, ‘rates’ buildings on their degree of ‘greenness’. The rating is applied to new and existing building stock of varied functions—commercial, institutional, and residential. TERI-GRIHA has been developed after thorough study and understanding of the prevailing building practices in India as well of green building rating systems prevalent internationally The rating system aims to achieve efficient resource utilization, enhanced resource efficiency, and an improved quality of life in buildings.
Both the LEED-INDIA and TERI-GRIHA ratings systems are voluntary, and have thus limited the number of buildings attempting to use the rating systems. Currently the actual number of projects that have been labelled by all systems in India together is below 100, which reflects the very low penetration in the Indian building market. While the programs are in there infant stages, it is important that the programs are combined into one strong marketable label that covers all building types. Over time with a strong brand and financial encouragement, these above code programs can have significant market penetration.
III.F.5 Policy Implementation Barriers in Buildings
Misplaced Incentives: Misplaced, or split, incentives are transactions or exchanges where the economic benefits of energy conservation do not accrue to the person who is trying to conserve. The terms have been used to describe certain classes of relationships, primarily in the real estate industry between landlords and tenants with respect to acquisition of energy-efficient equipment for rental property. When the tenant is responsible for the energy/utility bills, it is in the landlord’s interest to provide least-first-cost equipment rather than more efficient equipment for a given level of desired service. There is little or no incentive for the landlord to increase his or her own expense to acquire efficient equipment (e.g., refrigerators, heaters, and light bulbs) because the landlord does not bear the burden of the operating costs and will not reap the benefits of reducing those costs. This misplaced incentive is believed to extend to the commercial sector; however, most of the literature on misplaced incentives focuses on the residential sector. Carbon credits can be one alternative to address this issue..
Regulation: The regulation barrier referred to mis-pricing energy forms (such as electricity and natural gas) whose price was set administratively by regulatory bodies. These procedures and the cost structure of the industries typically result in different prices depending on whether they are set based on average costs (the regulated price) or marginal costs (the market price). Historically, the price of electricity as set by regulators was frequently below the marginal cost to produce the electricity. This mis-pricing was claimed to create an incentive to over consume electricity relative to conservation or efficiency.
Lack of Trained Professionals: This primarily is also one of the major barriers of implementing any energy efficiency polices in the first place because the market, since it has been completely oblivion to these new initiatives, doesn’t carries enough expertise in the form of trained experts.
Center for Clean Air Policy page 100
III.G Electricity Demand Sector Conclusion
Apart from reducing GHG emissions by increasing efficiency on generation side, there also exists a lot of scope for demand side management in India. Because of existence of high latent demand, the electricity demand is unlikely to come down even in periods of slow growth. On the demand side, increase in efficiency of product and equipments and buildings have been suggested as two major mitigation options.
The policies options discussed above under each of the mitigation option are likely to bring a significant reduction in GHG emissions on a national level. But one aspect that has to be kept in mind is that these policy options are overlapping as well as complimentary. A graded policy implementation targeting selected regions and the most cost effective measure first, would mitigate significant emissions with a sensible approach. In India, there is a huge variation across the spread in terms of development level of each state, living conditions, education, per capita income, etc. So if these policy options have to be most beneficial, then they should be flexible to take these variations into account.
On starting basis, State Nodal centres for energy efficiency can be created and sufficient authority should be provided to them. The role of local bodies should be the application of policies that are most appropriate for the climate and economic conditions. This way, a state specific framework would ensure that GHG emissions reduction potential is realized to the maximum in each state and hence, cumulatively for the nation
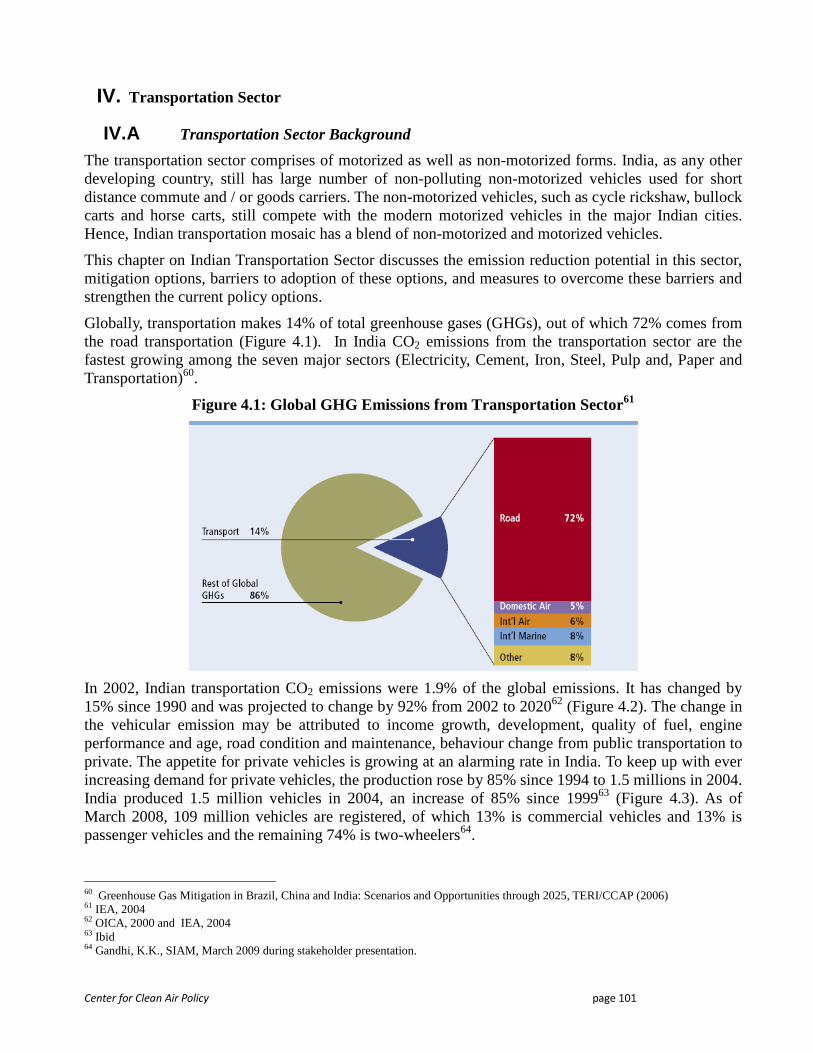
Center for Clean Air Policy page 101
IV. Transportation Sector
IV.A Transportation Sector Background
The transportation sector comprises of motorized as well as non-motorized forms. India, as any other developing country, still has large number of non-polluting non-motorized vehicles used for short distance commute and / or goods carriers. The non-motorized vehicles, such as cycle rickshaw, bullock carts and horse carts, still compete with the modern motorized vehicles in the major Indian cities. Hence, Indian transportation mosaic has a blend of non-motorized and motorized vehicles.
This chapter on Indian Transportation Sector discusses the emission reduction potential in this sector, mitigation options, barriers to adoption of these options, and measures to overcome these barriers and strengthen the current policy options.
Globally, transportation makes 14% of total greenhouse gases (GHGs), out of which 72% comes from the road transportation (Figure 4.1). In India CO2 emissions from the transportation sector are the fastest growing among the seven major sectors (Electricity, Cement, Iron, Steel, Pulp and, Paper and Transportation)60.
Figure 4.1: Global GHG Emissions from Transportation Sector61
In 2002, Indian transportation CO2 emissions were 1.9% of the global emissions. It has changed by 15% since 1990 and was projected to change by 92% from 2002 to 202062 (Figure 4.2). The change in the vehicular emission may be attributed to income growth, development, quality of fuel, engine performance and age, road condition and maintenance, behaviour change from public transportation to private. The appetite for private vehicles is growing at an alarming rate in India. To keep up with ever increasing demand for private vehicles, the production rose by 85% since 1994 to 1.5 millions in 2004. India produced 1.5 million vehicles in 2004, an increase of 85% since 199963 (Figure 4.3). As of March 2008, 109 million vehicles are registered, of which 13% is commercial vehicles and 13% is passenger vehicles and the remaining 74% is two-wheelers64.
60 Greenhouse Gas Mitigation in Brazil, China and India: Scenarios and Opportunities through 2025, TERI/CCAP (2006) 61 IEA, 2004 62 OICA, 2000 and IEA, 2004 63 Ibid 64 Gandhi, K.K., SIAM, March 2009 during stakeholder presentation.
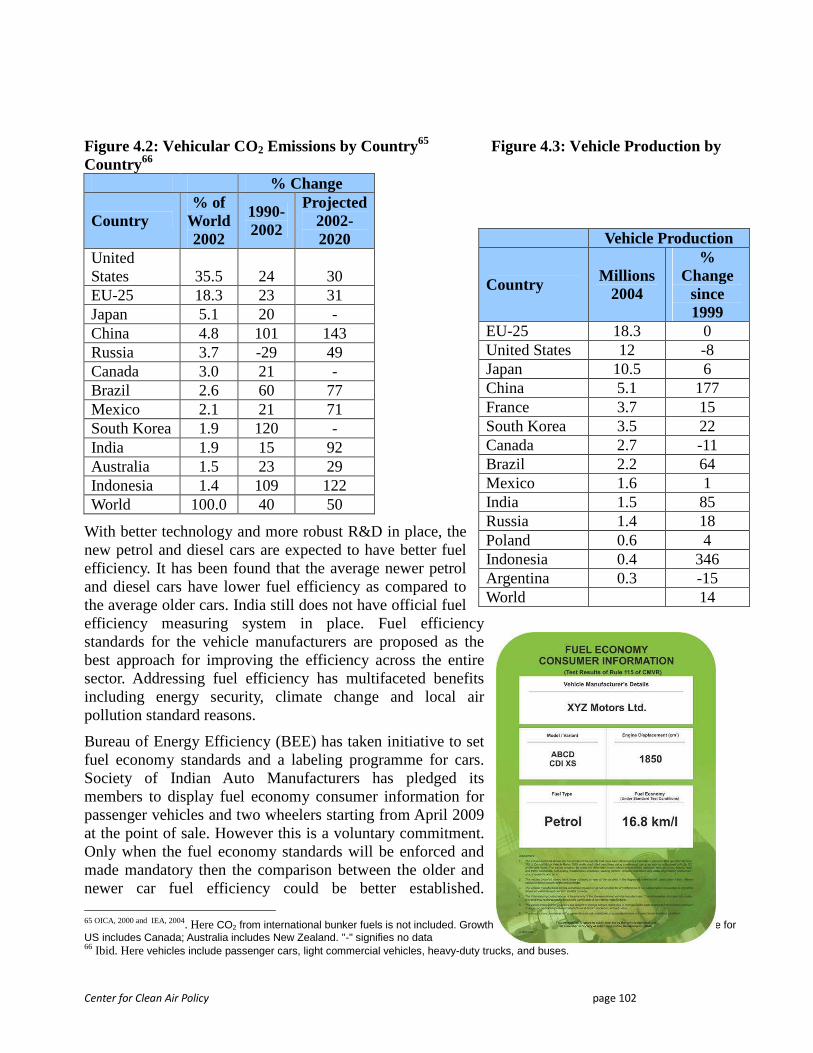
Center for Clean Air Policy page 102
Figure 4.2: Vehicular CO2 Emissions by Country65 Figure 4.3: Vehicle Production by Country66 % Change
Country % of
World 2002
1990-2002
Projected 2002-2020
United States 35.5 24 30 EU-25 18.3 23 31 Japan 5.1 20 - China 4.8 101 143 Russia 3.7 -29 49 Canada 3.0 21 - Brazil 2.6 60 77 Mexico 2.1 21 71 South Korea 1.9 120 - India 1.9 15 92 Australia 1.5 23 29 Indonesia 1.4 109 122 World 100.0 40 50
With better technology and more robust R&D in place, the new petrol and diesel cars are expected to have better fuel efficiency. It has been found that the average newer petrol and diesel cars have lower fuel efficiency as compared to the average older cars. India still does not have official fuel efficiency measuring system in place. Fuel efficiency standards for the vehicle manufacturers are proposed as the best approach for improving the efficiency across the entire sector. Addressing fuel efficiency has multifaceted benefits including energy security, climate change and local air pollution standard reasons.
Bureau of Energy Efficiency (BEE) has taken initiative to set fuel economy standards and a labeling programme for cars. Society of Indian Auto Manufacturers has pledged its members to display fuel economy consumer information for passenger vehicles and two wheelers starting from April 2009 at the point of sale. However this is a voluntary commitment. Only when the fuel economy standards will be enforced and made mandatory then the comparison between the older and newer car fuel efficiency could be better established. 65 OICA, 2000 and IEA, 2004. Here CO2 from international bunker fuels is not included. Growth rates for Russia are from 1992. Projected figure for US includes Canada; Australia includes New Zealand. "-" signifies no data 66 Ibid. Here vehicles include passenger cars, light commercial vehicles, heavy-duty trucks, and buses.
Vehicle Production
Country Millions 2004
% Change
since 1999
EU-25 18.3 0 United States 12 -8 Japan 10.5 6 China 5.1 177 France 3.7 15 South Korea 3.5 22 Canada 2.7 -11 Brazil 2.2 64 Mexico 1.6 1 India 1.5 85 Russia 1.4 18 Poland 0.6 4 Indonesia 0.4 346 Argentina 0.3 -15 World 14
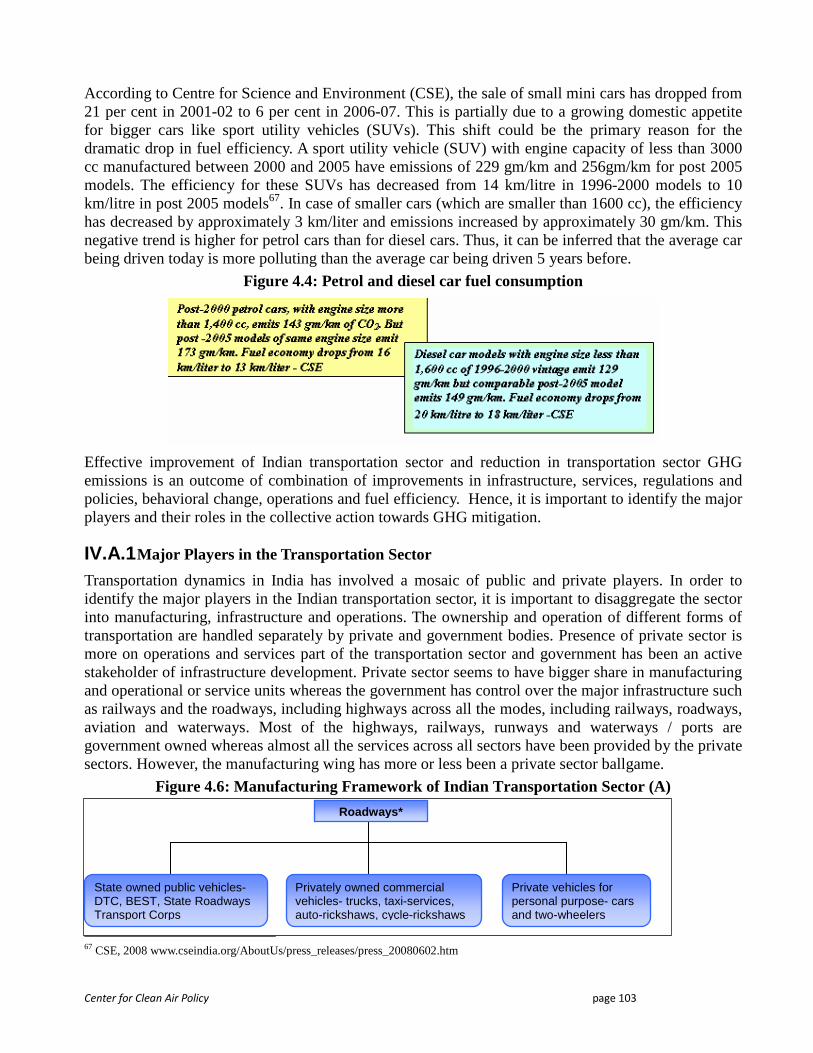
Center for Clean Air Policy page 103
According to Centre for Science and Environment (CSE), the sale of small mini cars has dropped from 21 per cent in 2001-02 to 6 per cent in 2006-07. This is partially due to a growing domestic appetite for bigger cars like sport utility vehicles (SUVs). This shift could be the primary reason for the dramatic drop in fuel efficiency. A sport utility vehicle (SUV) with engine capacity of less than 3000 cc manufactured between 2000 and 2005 have emissions of 229 gm/km and 256gm/km for post 2005 models. The efficiency for these SUVs has decreased from 14 km/litre in 1996-2000 models to 10 km/litre in post 2005 models67. In case of smaller cars (which are smaller than 1600 cc), the efficiency has decreased by approximately 3 km/liter and emissions increased by approximately 30 gm/km. This negative trend is higher for petrol cars than for diesel cars. Thus, it can be inferred that the average car being driven today is more polluting than the average car being driven 5 years before.
Figure 4.4: Petrol and diesel car fuel consumption
Effective improvement of Indian transportation sector and reduction in transportation sector GHG emissions is an outcome of combination of improvements in infrastructure, services, regulations and policies, behavioral change, operations and fuel efficiency. Hence, it is important to identify the major players and their roles in the collective action towards GHG mitigation.
IV.A.1 Major Players in the Transportation Sector
Transportation dynamics in India has involved a mosaic of public and private players. In order to identify the major players in the Indian transportation sector, it is important to disaggregate the sector into manufacturing, infrastructure and operations. The ownership and operation of different forms of transportation are handled separately by private and government bodies. Presence of private sector is more on operations and services part of the transportation sector and government has been an active stakeholder of infrastructure development. Private sector seems to have bigger share in manufacturing and operational or service units whereas the government has control over the major infrastructure such as railways and the roadways, including highways across all the modes, including railways, roadways, aviation and waterways. Most of the highways, railways, runways and waterways / ports are government owned whereas almost all the services across all sectors have been provided by the private sectors. However, the manufacturing wing has more or less been a private sector ballgame.
Figure 4.6: Manufacturing Framework of Indian Transportation Sector (A)
67 CSE, 2008 www.cseindia.org/AboutUs/press_releases/press_20080602.htm
State owned public vehicles- DTC, BEST, State Roadways Transport Corps
Privately owned commercial vehicles- trucks, taxi-services, auto-rickshaws, cycle-rickshaws
Private vehicles for personal purpose- cars and two-wheelers
Roadways*
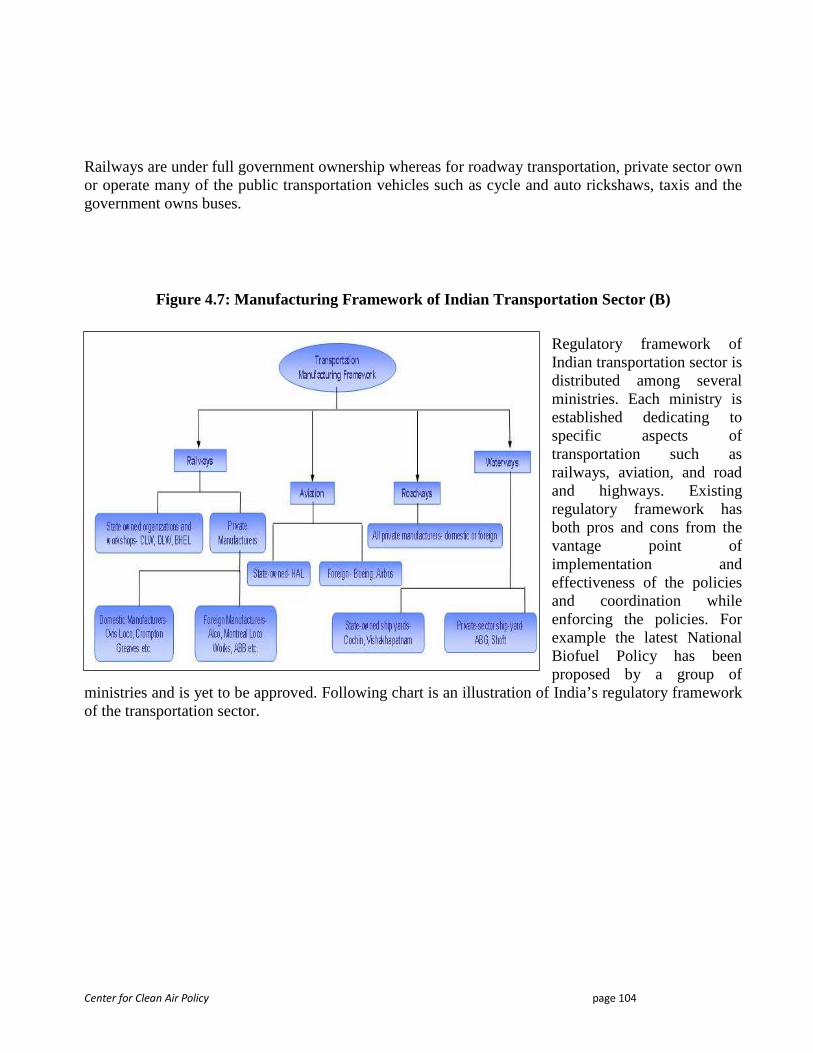
Center for Clean Air Policy page 104
Railways are under full government ownership whereas for roadway transportation, private sector own or operate many of the public transportation vehicles such as cycle and auto rickshaws, taxis and the government owns buses.
Figure 4.7: Manufacturing Framework of Indian Transportation Sector (B)
Regulatory framework of Indian transportation sector is distributed among several ministries. Each ministry is established dedicating to specific aspects of transportation such as railways, aviation, and road and highways. Existing regulatory framework has both pros and cons from the vantage point of implementation and effectiveness of the policies and coordination while enforcing the policies. For example the latest National Biofuel Policy has been proposed by a group of
ministries and is yet to be approved. Following chart is an illustration of India’s regulatory framework of the transportation sector.
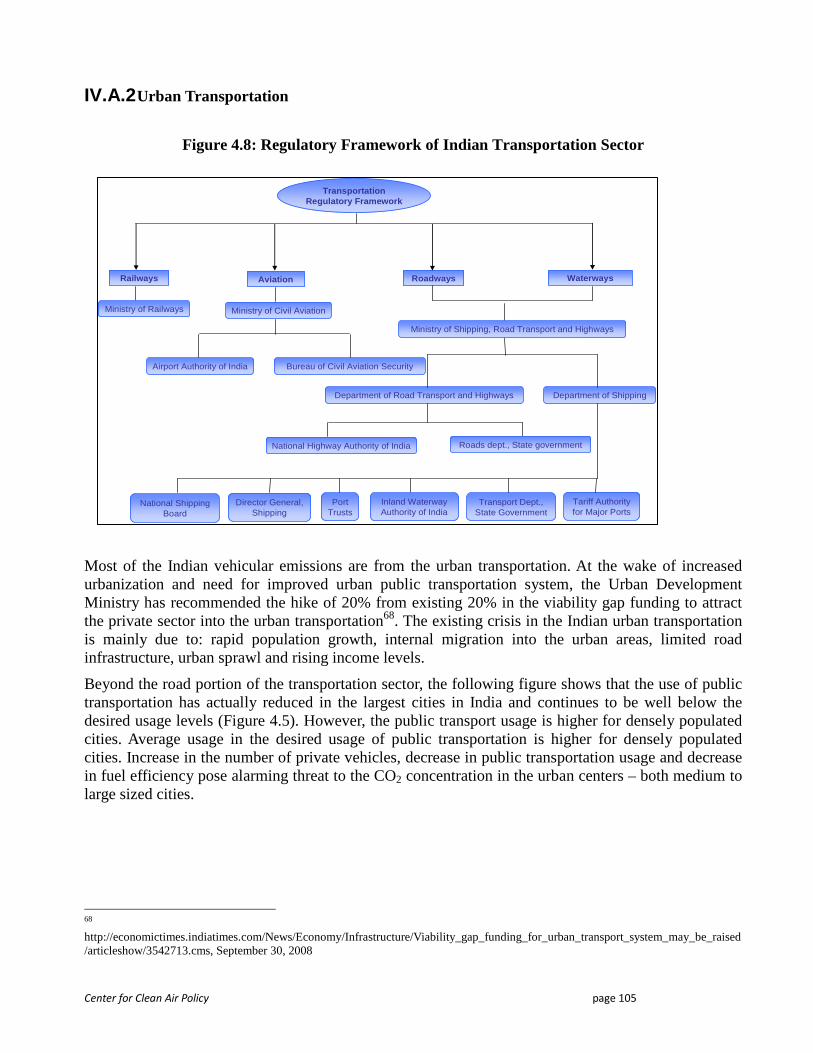
Center for Clean Air Policy page 105
IV.A.2 Urban Transportation
Figure 4.8: Regulatory Framework of Indian Transportation Sector
Most of the Indian vehicular emissions are from the urban transportation. At the wake of increased urbanization and need for improved urban public transportation system, the Urban Development Ministry has recommended the hike of 20% from existing 20% in the viability gap funding to attract the private sector into the urban transportation68. The existing crisis in the Indian urban transportation is mainly due to: rapid population growth, internal migration into the urban areas, limited road infrastructure, urban sprawl and rising income levels.
Beyond the road portion of the transportation sector, the following figure shows that the use of public transportation has actually reduced in the largest cities in India and continues to be well below the desired usage levels (Figure 4.5). However, the public transport usage is higher for densely populated cities. Average usage in the desired usage of public transportation is higher for densely populated cities. Increase in the number of private vehicles, decrease in public transportation usage and decrease in fuel efficiency pose alarming threat to the CO2 concentration in the urban centers – both medium to large sized cities.
68 http://economictimes.indiatimes.com/News/Economy/Infrastructure/Viability_gap_funding_for_urban_transport_system_may_be_raised/articleshow/3542713.cms, September 30, 2008
AviationRailways
Transportation Regulatory Framework
Department of Road Transport and Highways
Ministry of Shipping, Road Transport and Highways
Roadways
Airport Authority of India Bureau of Civil Aviation Security
Ministry of Railways Ministry of Civil Aviation
Waterways
Department of Shipping
National Highway Authority of India Roads dept., State government
National Shipping Board
Director General, Shipping
Port Trusts
Inland Waterway Authority of India
Transport Dept., State Government
Tariff Authority for Major Ports
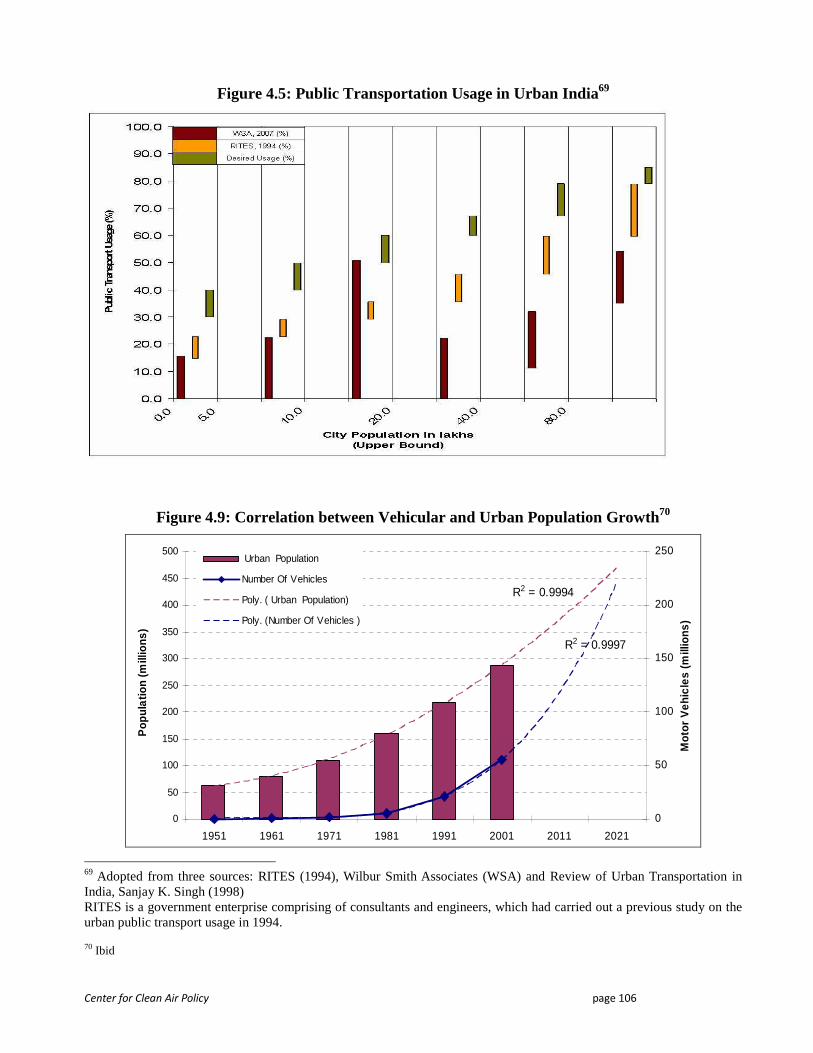
Center for Clean Air Policy page 106
Figure 4.5: Public Transportation Usage in Urban India69
Figure 4.9: Correlation between Vehicular and Urban Population Growth70
R2 = 0.9994
R2 = 0.9997
0
50
100
150
200
250
300
350
400
450
500
1951 1961 1971 1981 1991 2001 2011 2021
Pop
ula
tion
(milli
ons)
0
50
100
150
200
250
Mot
or V
ehic
les
(milli
ons)
Urban Population
Number Of Vehicles
Poly. ( Urban Population)
Poly. (Number Of Vehicles )
69 Adopted from three sources: RITES (1994), Wilbur Smith Associates (WSA) and Review of Urban Transportation in India, Sanjay K. Singh (1998) RITES is a government enterprise comprising of consultants and engineers, which had carried out a previous study on the urban public transport usage in 1994. 70 Ibid
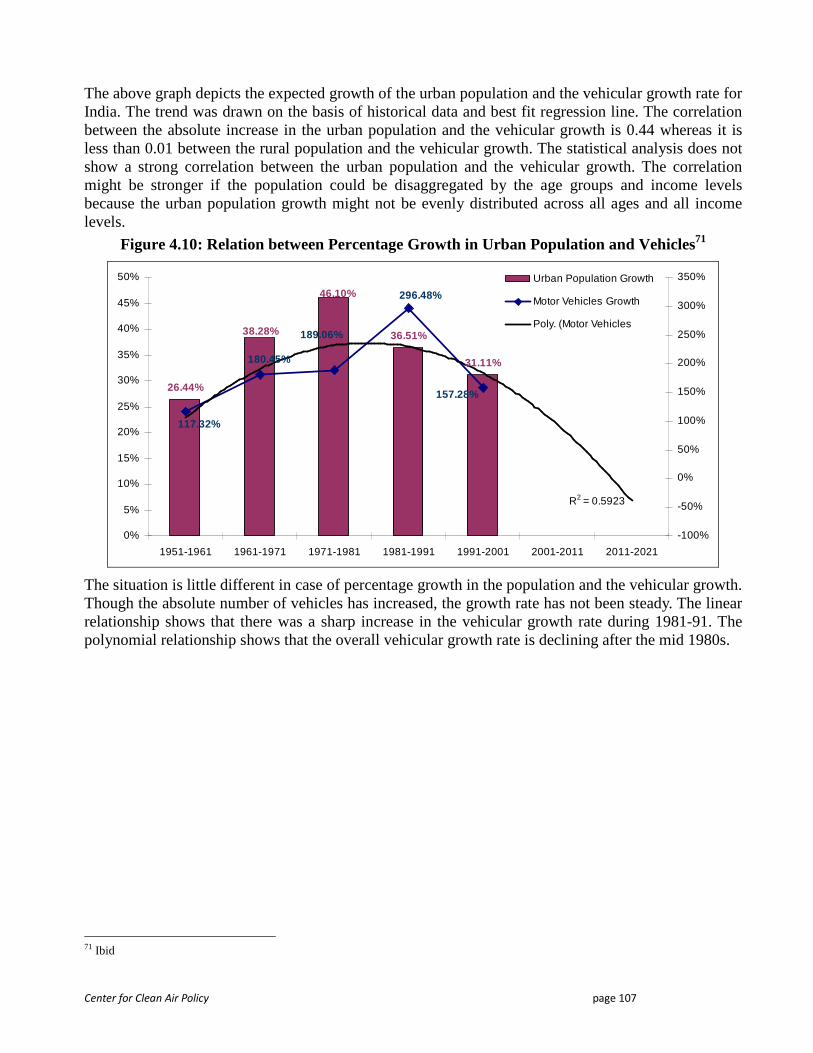
Center for Clean Air Policy page 107
The above graph depicts the expected growth of the urban population and the vehicular growth rate for India. The trend was drawn on the basis of historical data and best fit regression line. The correlation between the absolute increase in the urban population and the vehicular growth is 0.44 whereas it is less than 0.01 between the rural population and the vehicular growth. The statistical analysis does not show a strong correlation between the urban population and the vehicular growth. The correlation might be stronger if the population could be disaggregated by the age groups and income levels because the urban population growth might not be evenly distributed across all ages and all income levels.
Figure 4.10: Relation between Percentage Growth in Urban Population and Vehicles71
26.44%
36.51%
31.11%
46.10%
38.28%
157.28%
296.48%
189.06%
180.45%
117.32%
R2 = 0.5923
0%
5%
10%
15%
20%
25%
30%
35%
40%
45%
50%
1951-1961 1961-1971 1971-1981 1981-1991 1991-2001 2001-2011 2011-2021
-100%
-50%
0%
50%
100%
150%
200%
250%
300%
350%Urban Population Growth
Motor Vehicles Growth
Poly. (Motor Vehicles
The situation is little different in case of percentage growth in the population and the vehicular growth. Though the absolute number of vehicles has increased, the growth rate has not been steady. The linear relationship shows that there was a sharp increase in the vehicular growth rate during 1981-91. The polynomial relationship shows that the overall vehicular growth rate is declining after the mid 1980s.
71 Ibid
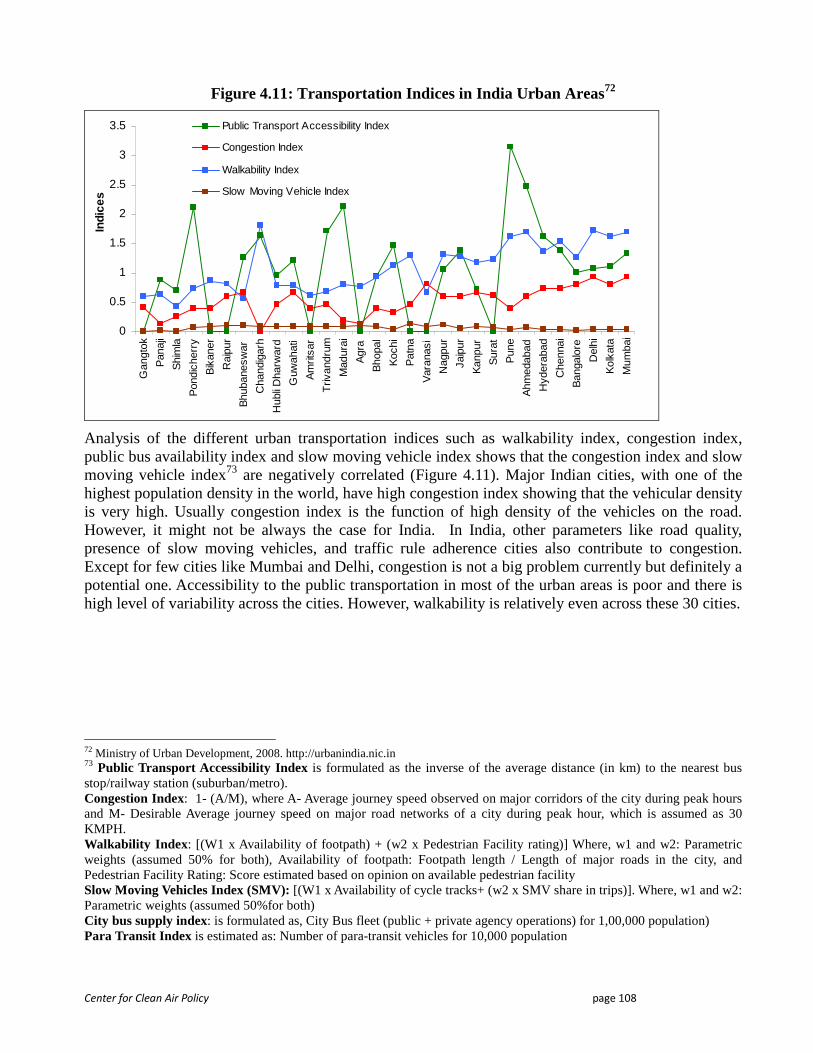
Center for Clean Air Policy page 108
Figure 4.11: Transportation Indices in India Urban Areas72
0
0.5
1
1.5
2
2.5
3
3.5
Gan
gtok
Pan
aji
Shi
mla
Pon
dich
erry
Bik
aner
Rai
pur
Bhu
bane
swar
Cha
ndig
arh
Hub
li D
harw
ard
Guw
ahat
i
Am
ritsa
r
Triv
andr
um
Mad
urai
Agr
a
Bho
pal
Koc
hi
Pat
na
Var
anas
i
Nag
pur
Jaip
ur
Kan
pur
Sur
at
Pun
e
Ahm
edab
ad
Hyd
erab
ad
Che
nnai
Ban
galo
re
Del
hi
Kol
kata
Mum
bai
Indi
ces
Public Transport Accessibility Index
Congestion Index
Walkability Index
Slow Moving Vehicle Index
Analysis of the different urban transportation indices such as walkability index, congestion index, public bus availability index and slow moving vehicle index shows that the congestion index and slow moving vehicle index73 are negatively correlated (Figure 4.11). Major Indian cities, with one of the highest population density in the world, have high congestion index showing that the vehicular density is very high. Usually congestion index is the function of high density of the vehicles on the road. However, it might not be always the case for India. In India, other parameters like road quality, presence of slow moving vehicles, and traffic rule adherence cities also contribute to congestion. Except for few cities like Mumbai and Delhi, congestion is not a big problem currently but definitely a potential one. Accessibility to the public transportation in most of the urban areas is poor and there is high level of variability across the cities. However, walkability is relatively even across these 30 cities.
72 Ministry of Urban Development, 2008. http://urbanindia.nic.in 73 Public Transport Accessibility Index is formulated as the inverse of the average distance (in km) to the nearest bus stop/railway station (suburban/metro). Congestion Index: 1- (A/M), where A- Average journey speed observed on major corridors of the city during peak hours and M- Desirable Average journey speed on major road networks of a city during peak hour, which is assumed as 30 KMPH. Walkability Index : [(W1 x Availability of footpath) + (w2 x Pedestrian Facility rating)] Where, w1 and w2: Parametric weights (assumed 50% for both), Availability of footpath: Footpath length / Length of major roads in the city, and Pedestrian Facility Rating: Score estimated based on opinion on available pedestrian facility Slow Moving Vehicles Index (SMV): [(W1 x Availability of cycle tracks+ (w2 x SMV share in trips)]. Where, w1 and w2: Parametric weights (assumed 50%for both) City bus supply index: is formulated as, City Bus fleet (public + private agency operations) for 1,00,000 population) Para Transit Index is estimated as: Number of para-transit vehicles for 10,000 population
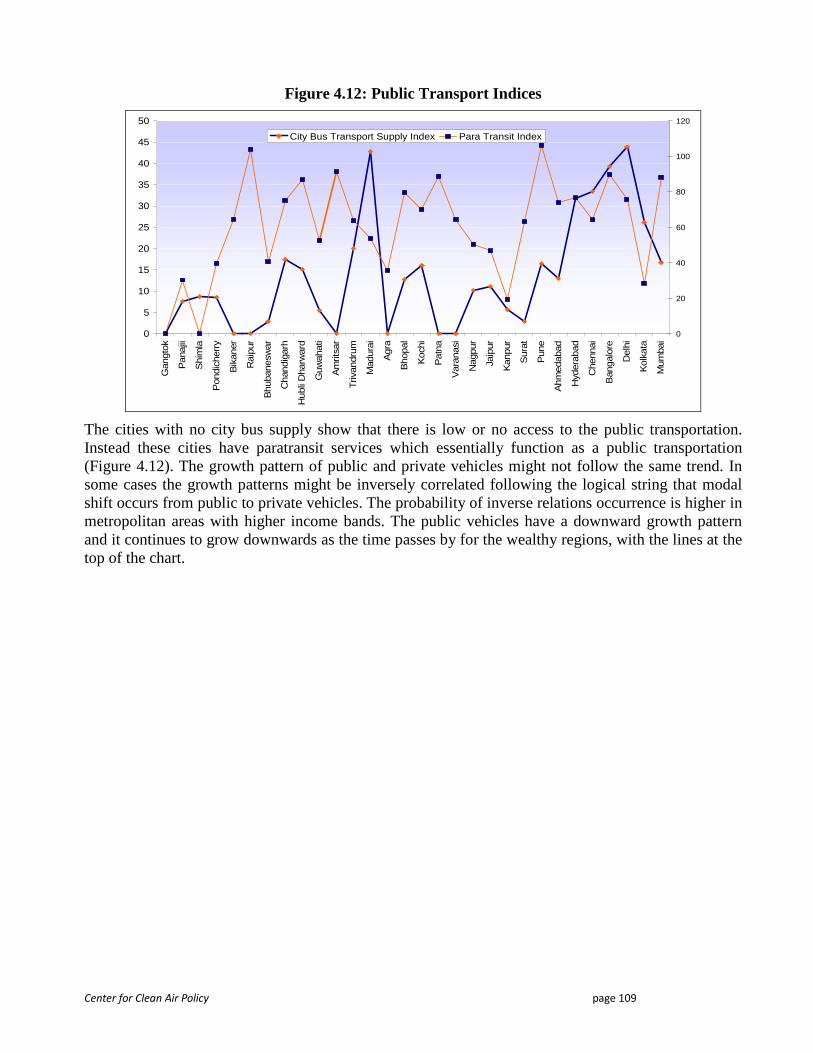
Center for Clean Air Policy page 109
Figure 4.12: Public Transport Indices
0
5
10
15
20
25
30
35
40
45
50
Gan
gtok
Pan
ajii
Shi
mla
Pon
dich
erry
Bik
aner
Rai
pur
Bhu
bane
swar
Cha
ndig
arh
Hub
li D
harw
ard
Guw
ahat
i
Am
ritsa
r
Triv
andr
um
Mad
urai
Agr
a
Bho
pal
Koc
hi
Pat
na
Var
anas
i
Nag
pur
Jaip
ur
Kan
pur
Sur
at
Pun
e
Ahm
edab
ad
Hyd
erab
ad
Che
nnai
Ban
galo
re
Del
hi
Kol
kata
Mum
bai
0
20
40
60
80
100
120
City Bus Transport Supply Index Para Transit Index
The cities with no city bus supply show that there is low or no access to the public transportation. Instead these cities have paratransit services which essentially function as a public transportation (Figure 4.12). The growth pattern of public and private vehicles might not follow the same trend. In some cases the growth patterns might be inversely correlated following the logical string that modal shift occurs from public to private vehicles. The probability of inverse relations occurrence is higher in metropolitan areas with higher income bands. The public vehicles have a downward growth pattern and it continues to grow downwards as the time passes by for the wealthy regions, with the lines at the top of the chart.
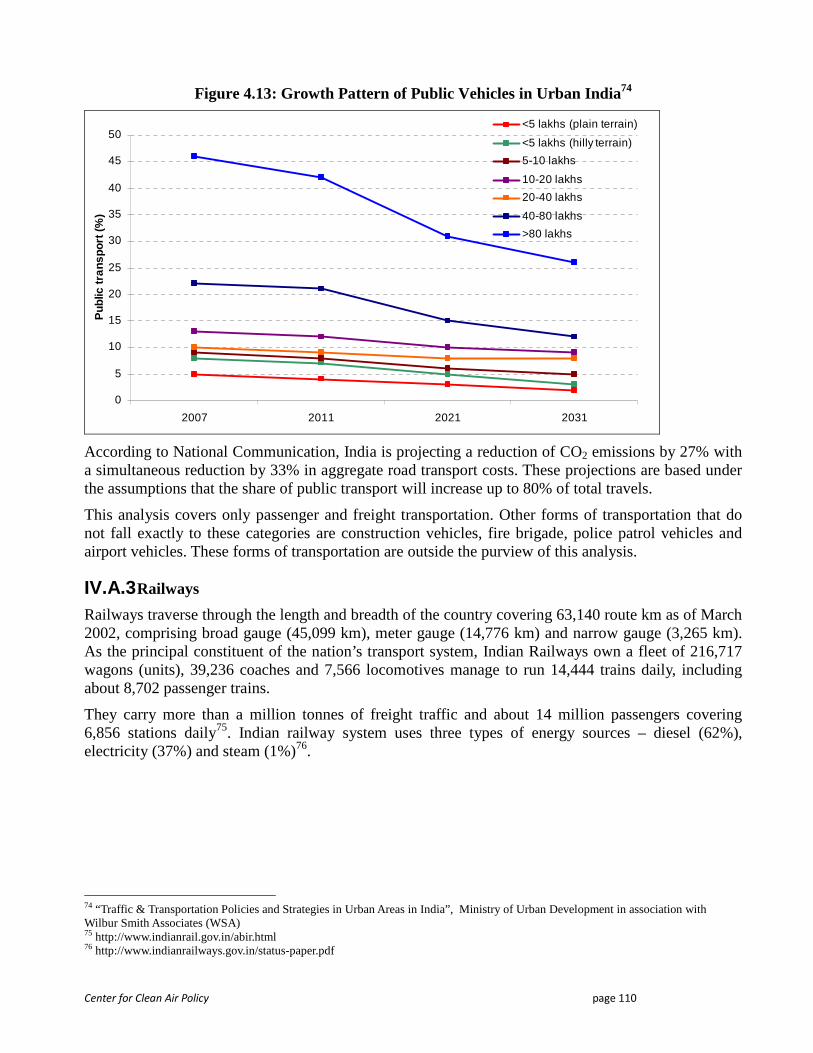
Center for Clean Air Policy page 110
Figure 4.13: Growth Pattern of Public Vehicles in Urban India 74
0
5
10
15
20
25
30
35
40
45
50
2007 2011 2021 2031
Pub
lic tr
ans
port
(%)
<5 lakhs (plain terrain)
<5 lakhs (hilly terrain)
5-10 lakhs
10-20 lakhs
20-40 lakhs
40-80 lakhs
>80 lakhs
According to National Communication, India is projecting a reduction of CO2 emissions by 27% with a simultaneous reduction by 33% in aggregate road transport costs. These projections are based under the assumptions that the share of public transport will increase up to 80% of total travels.
This analysis covers only passenger and freight transportation. Other forms of transportation that do not fall exactly to these categories are construction vehicles, fire brigade, police patrol vehicles and airport vehicles. These forms of transportation are outside the purview of this analysis.
IV.A.3 Railways
Railways traverse through the length and breadth of the country covering 63,140 route km as of March 2002, comprising broad gauge (45,099 km), meter gauge (14,776 km) and narrow gauge (3,265 km). As the principal constituent of the nation’s transport system, Indian Railways own a fleet of 216,717 wagons (units), 39,236 coaches and 7,566 locomotives manage to run 14,444 trains daily, including about 8,702 passenger trains.
They carry more than a million tonnes of freight traffic and about 14 million passengers covering 6,856 stations daily75. Indian railway system uses three types of energy sources – diesel (62%), electricity (37%) and steam (1%)76.
74 “Traffic & Transportation Policies and Strategies in Urban Areas in India”, Ministry of Urban Development in association with Wilbur Smith Associates (WSA) 75 http://www.indianrail.gov.in/abir.html 76 http://www.indianrailways.gov.in/status-paper.pdf
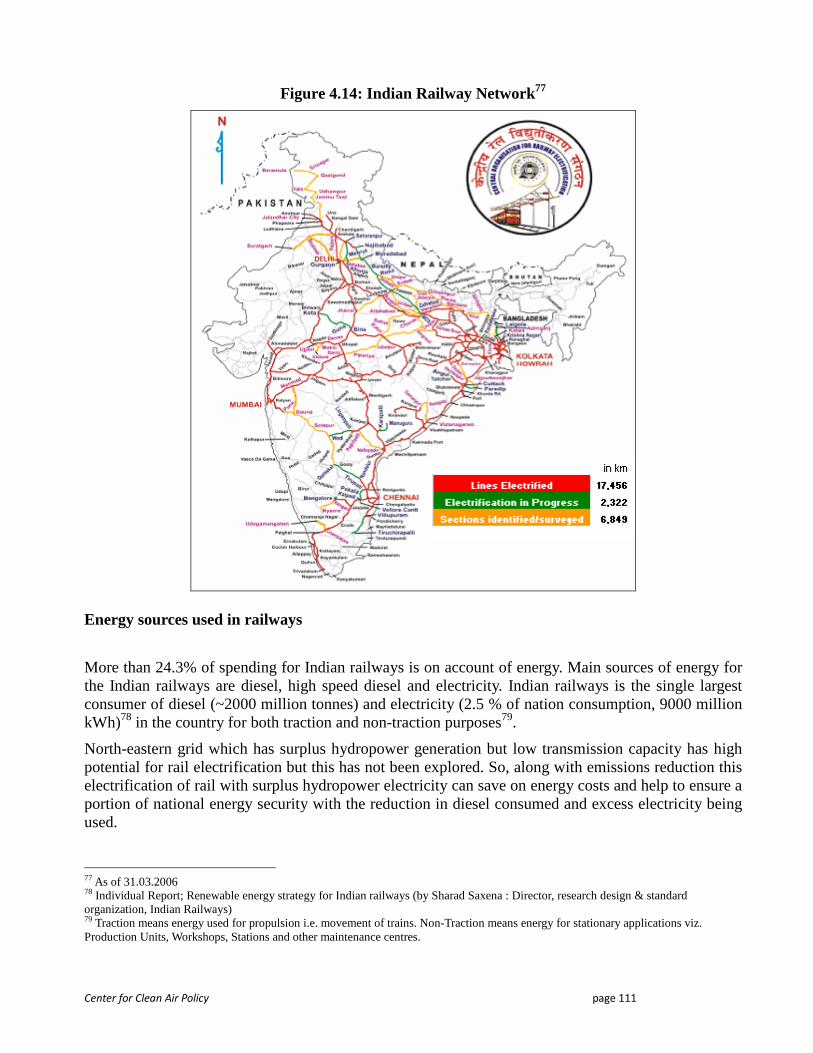
Center for Clean Air Policy page 111
Figure 4.14: Indian Railway Network77
Energy sources used in railways
More than 24.3% of spending for Indian railways is on account of energy. Main sources of energy for the Indian railways are diesel, high speed diesel and electricity. Indian railways is the single largest consumer of diesel (~2000 million tonnes) and electricity (2.5 % of nation consumption, 9000 million kWh)78 in the country for both traction and non-traction purposes79.
North-eastern grid which has surplus hydropower generation but low transmission capacity has high potential for rail electrification but this has not been explored. So, along with emissions reduction this electrification of rail with surplus hydropower electricity can save on energy costs and help to ensure a portion of national energy security with the reduction in diesel consumed and excess electricity being used.
77 As of 31.03.2006 78 Individual Report; Renewable energy strategy for Indian railways (by Sharad Saxena : Director, research design & standard organization, Indian Railways) 79 Traction means energy used for propulsion i.e. movement of trains. Non-Traction means energy for stationary applications viz. Production Units, Workshops, Stations and other maintenance centres.
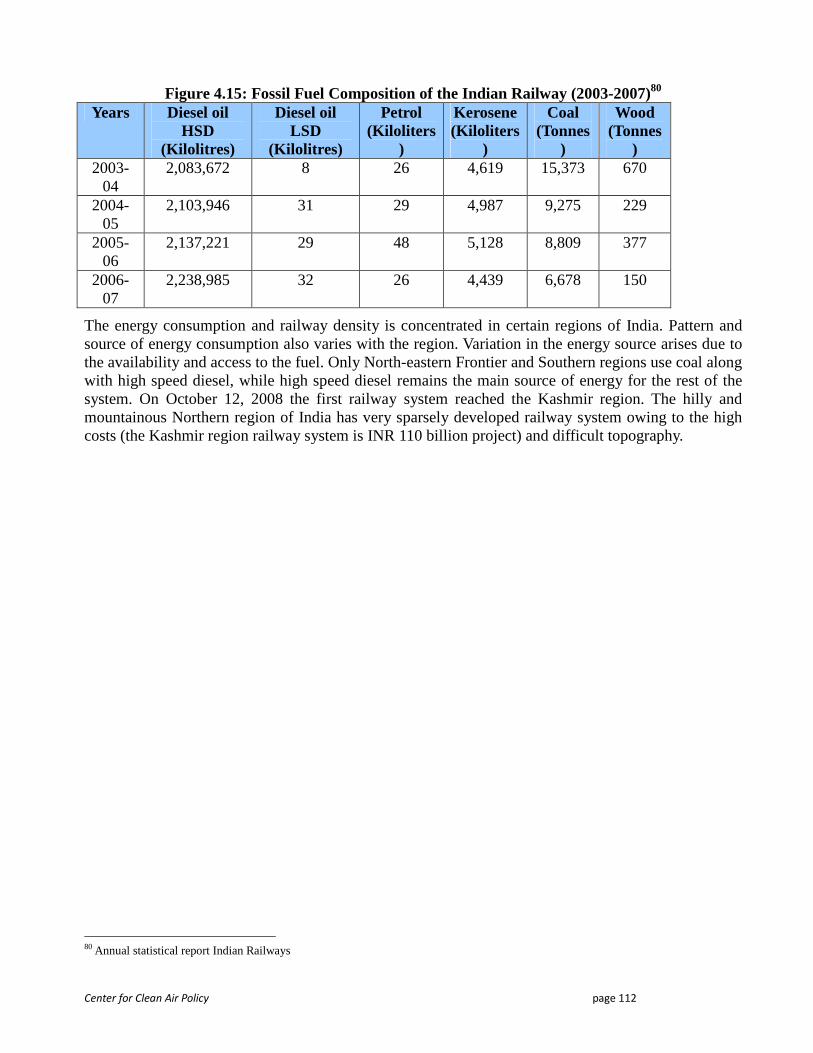
Center for Clean Air Policy page 112
Figure 4.15: Fossil Fuel Composition of the Indian Railway (2003-2007)80 Years Diesel oil
HSD (Kilolitres)
Diesel oil LSD
(Kilolitres)
Petrol (Kiloliters
)
Kerosene (Kiloliters
)
Coal (Tonnes
)
Wood (Tonnes
) 2003-
04 2,083,672 8 26 4,619 15,373 670
2004-05
2,103,946 31 29 4,987 9,275 229
2005-06
2,137,221 29 48 5,128 8,809 377
2006-07
2,238,985 32 26 4,439 6,678 150
The energy consumption and railway density is concentrated in certain regions of India. Pattern and source of energy consumption also varies with the region. Variation in the energy source arises due to the availability and access to the fuel. Only North-eastern Frontier and Southern regions use coal along with high speed diesel, while high speed diesel remains the main source of energy for the rest of the system. On October 12, 2008 the first railway system reached the Kashmir region. The hilly and mountainous Northern region of India has very sparsely developed railway system owing to the high costs (the Kashmir region railway system is INR 110 billion project) and difficult topography.
80 Annual statistical report Indian Railways
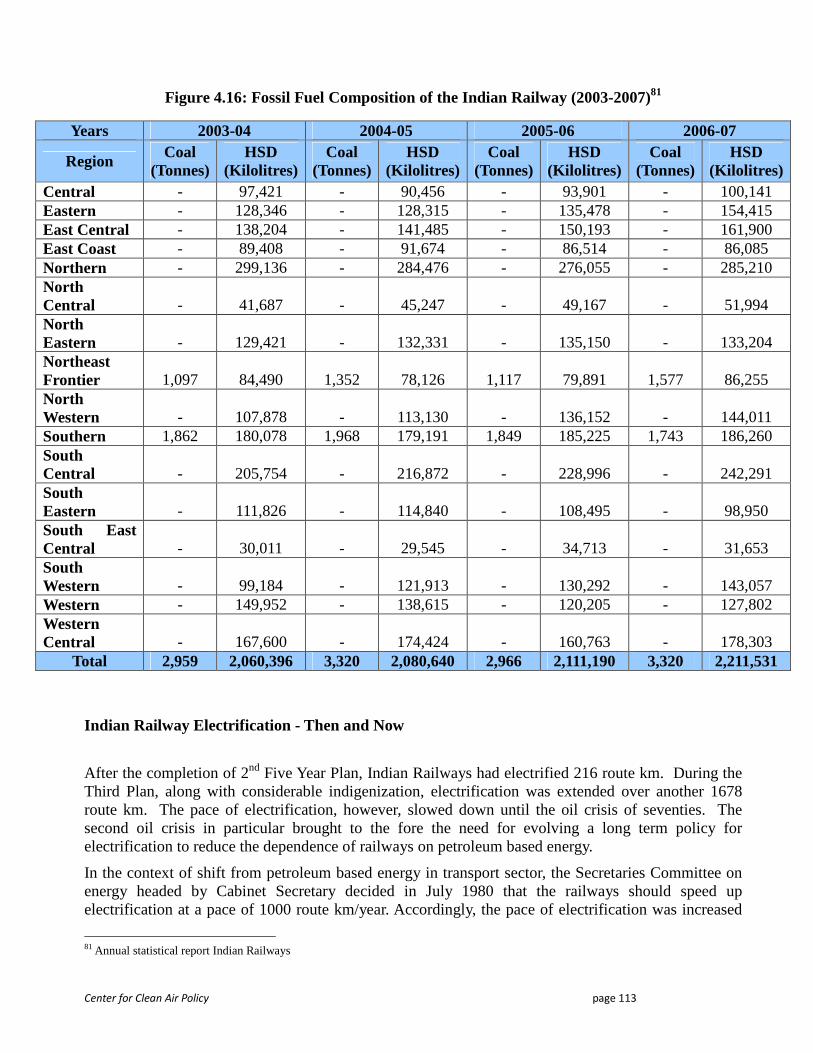
Center for Clean Air Policy page 113
Figure 4.16: Fossil Fuel Composition of the Indian Railway (2003-2007)81
Indian Railway Electrification - Then and Now
After the completion of 2nd Five Year Plan, Indian Railways had electrified 216 route km. During the Third Plan, along with considerable indigenization, electrification was extended over another 1678 route km. The pace of electrification, however, slowed down until the oil crisis of seventies. The second oil crisis in particular brought to the fore the need for evolving a long term policy for electrification to reduce the dependence of railways on petroleum based energy.
In the context of shift from petroleum based energy in transport sector, the Secretaries Committee on energy headed by Cabinet Secretary decided in July 1980 that the railways should speed up electrification at a pace of 1000 route km/year. Accordingly, the pace of electrification was increased
81 Annual statistical report Indian Railways
Years 2003-04 2004-05 2005-06 2006-07
Region Coal
(Tonnes) HSD
(Kilolitres) Coal
(Tonnes) HSD
(Kilolitres) Coal
(Tonnes) HSD
(Kilolitres) Coal
(Tonnes) HSD
(Kilolitres) Central - 97,421 - 90,456 - 93,901 - 100,141 Eastern - 128,346 - 128,315 - 135,478 - 154,415 East Central - 138,204 - 141,485 - 150,193 - 161,900 East Coast - 89,408 - 91,674 - 86,514 - 86,085 Northern - 299,136 - 284,476 - 276,055 - 285,210 North Central - 41,687 - 45,247 - 49,167 - 51,994 North Eastern - 129,421 - 132,331 - 135,150 - 133,204 Northeast Frontier 1,097 84,490 1,352 78,126 1,117 79,891 1,577 86,255 North Western - 107,878 - 113,130 - 136,152 - 144,011 Southern 1,862 180,078 1,968 179,191 1,849 185,225 1,743 186,260 South Central - 205,754 - 216,872 - 228,996 - 242,291 South Eastern - 111,826 - 114,840 - 108,495 - 98,950 South East Central - 30,011 - 29,545 - 34,713 - 31,653 South Western - 99,184 - 121,913 - 130,292 - 143,057 Western - 149,952 - 138,615 - 120,205 - 127,802 Western Central - 167,600 - 174,424 - 160,763 - 178,303
Total 2,959 2,060,396 3,320 2,080,640 2,966 2,111,190 3,320 2,211,531
Center for Clean Air Policy page 114
considerably and Indian Railways achieved progress of 2812 route km during the 7th Plan, 2708 route km during 8th Plan and 2484 route km during 9th Plan making it a total of 16001 route km. In the recently concluded 10th Plan, electrification of 1810 route km has been achieved which is more than the target of 1800 route km.
Six major trunk routes of Golden Quadrilateral and diagonals: Delhi - Calcutta, Delhi - Mumbai via Central and Western Railways, Delhi - Chennai, Mumbai - Calcutta and Howrah-Chennai have already been fully electrified. Electrification of remaining Mumbai-Chennai route (Nandalur-Pune) is in progress.
A total of 17811 route km has been electrified82, which makes up approximately 25% of Indian Railways on Indian Railways. Most of the electrification was carried out on heavy density routes. 11th Five Year Plan period has envisaged to further electrify 3500-4000 route km at the rate of 700 route km per year83.
Energy Efficiency in Indian Railways
Indian railway policies have addressed environmental issues like energy efficiency, fuel switch and renewable energy development. Indian railways, one of the designated consumers identified by NAPCC, has already started installing energy efficient appliances in the locomotives and its associated buildings as per BEE regulations. With the largest railway system in the world, India has huge opportunities to save energy and also the GHG emissions by implementing energy efficiency measures. Following are the some of the energy efficiency initiatives taken by the Indian railways:
• Adoption of 3-phase propulsion system for Electric and diesel locomotive and AC Electric Multiple Units (EMU), as a 3-phase locomotives saves 15-18% Energy and a 3-phase EMU saves 35-40% Energy
• Adoption of Static converter (Efficiency 93%) in place of Rotary converter (Induction generator) (Efficiency 83%) for Auxiliary panel supply.
• Installation of Power factor correction equipments at Traction Substation
• Replacement of incandescent lamps by CFL & T5 fluorescent lamps.
• Energy Audit of major work centres such as workshops, traction substations, diesel loco-sheds and production units
• Use of solar energy for manned level crossing and road side stations84
• Use of biodiesel for traction85
• Use of wind based power generation for internal usage86
IV.A.4 Aviation
With 454 airports and airstrips and growth rate of 27%, Indian aviation sector is one of the fastest growing aviation sectors in the world. With many private airlines entering into the Indian aviation, 82 As of 31.03.2007 83 www.indianrailways.gov.in/deptts/rly-elecfn/rly-elecfn.htm and www.core.railnet.gov.in/general/Brief%20on%20RE.htm 84 http://www.hinduonnet.com/businessline/blnus/09011741.htm 85 Kathpal biodiesel roadmap power point presentation 86 Annual statistical report Indian Railways
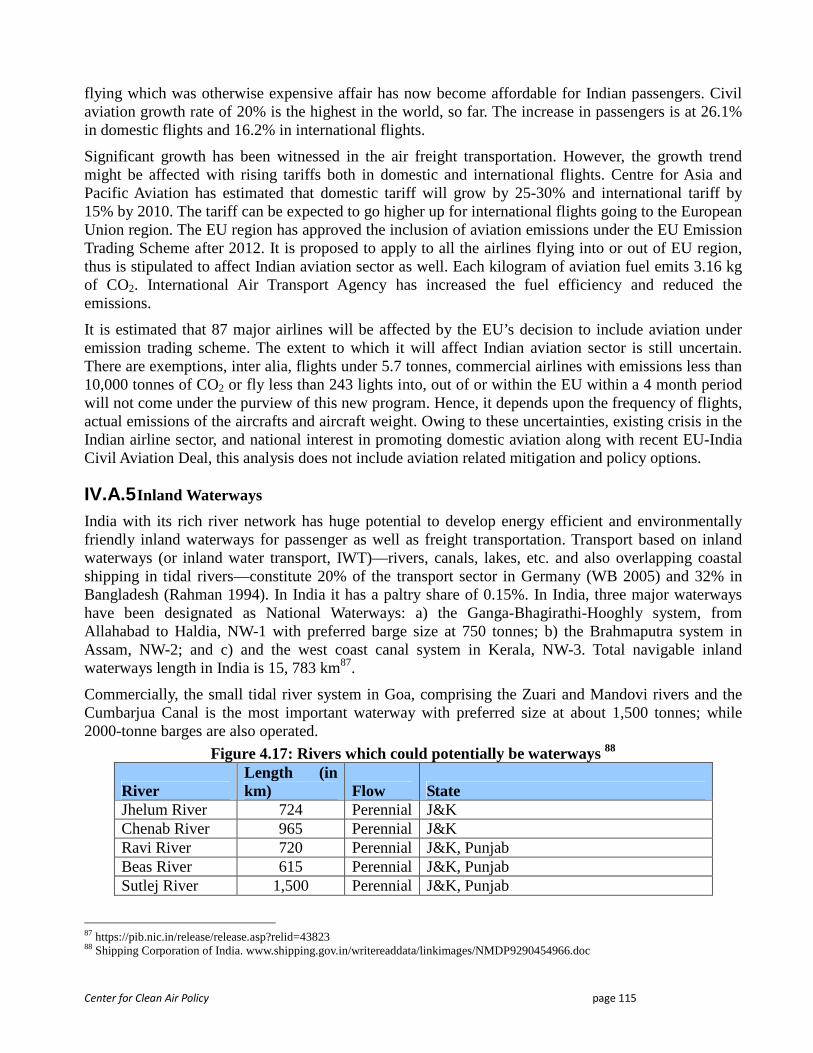
Center for Clean Air Policy page 115
flying which was otherwise expensive affair has now become affordable for Indian passengers. Civil aviation growth rate of 20% is the highest in the world, so far. The increase in passengers is at 26.1% in domestic flights and 16.2% in international flights.
Significant growth has been witnessed in the air freight transportation. However, the growth trend might be affected with rising tariffs both in domestic and international flights. Centre for Asia and Pacific Aviation has estimated that domestic tariff will grow by 25-30% and international tariff by 15% by 2010. The tariff can be expected to go higher up for international flights going to the European Union region. The EU region has approved the inclusion of aviation emissions under the EU Emission Trading Scheme after 2012. It is proposed to apply to all the airlines flying into or out of EU region, thus is stipulated to affect Indian aviation sector as well. Each kilogram of aviation fuel emits 3.16 kg of CO2. International Air Transport Agency has increased the fuel efficiency and reduced the emissions.
It is estimated that 87 major airlines will be affected by the EU’s decision to include aviation under emission trading scheme. The extent to which it will affect Indian aviation sector is still uncertain. There are exemptions, inter alia, flights under 5.7 tonnes, commercial airlines with emissions less than 10,000 tonnes of CO2 or fly less than 243 lights into, out of or within the EU within a 4 month period will not come under the purview of this new program. Hence, it depends upon the frequency of flights, actual emissions of the aircrafts and aircraft weight. Owing to these uncertainties, existing crisis in the Indian airline sector, and national interest in promoting domestic aviation along with recent EU-India Civil Aviation Deal, this analysis does not include aviation related mitigation and policy options.
IV.A.5 Inland Waterways
India with its rich river network has huge potential to develop energy efficient and environmentally friendly inland waterways for passenger as well as freight transportation. Transport based on inland waterways (or inland water transport, IWT)—rivers, canals, lakes, etc. and also overlapping coastal shipping in tidal rivers—constitute 20% of the transport sector in Germany (WB 2005) and 32% in Bangladesh (Rahman 1994). In India it has a paltry share of 0.15%. In India, three major waterways have been designated as National Waterways: a) the Ganga-Bhagirathi-Hooghly system, from Allahabad to Haldia, NW-1 with preferred barge size at 750 tonnes; b) the Brahmaputra system in Assam, NW-2; and c) and the west coast canal system in Kerala, NW-3. Total navigable inland waterways length in India is 15, 783 km87.
Commercially, the small tidal river system in Goa, comprising the Zuari and Mandovi rivers and the Cumbarjua Canal is the most important waterway with preferred size at about 1,500 tonnes; while 2000-tonne barges are also operated.
Figure 4.17: Rivers which could potentially be waterways 88
River Length (in km) Flow State
Jhelum River 724 Perennial J&K Chenab River 965 Perennial J&K Ravi River 720 Perennial J&K, Punjab Beas River 615 Perennial J&K, Punjab Sutlej River 1,500 Perennial J&K, Punjab
87 https://pib.nic.in/release/release.asp?relid=43823 88 Shipping Corporation of India. www.shipping.gov.in/writereaddata/linkimages/NMDP9290454966.doc
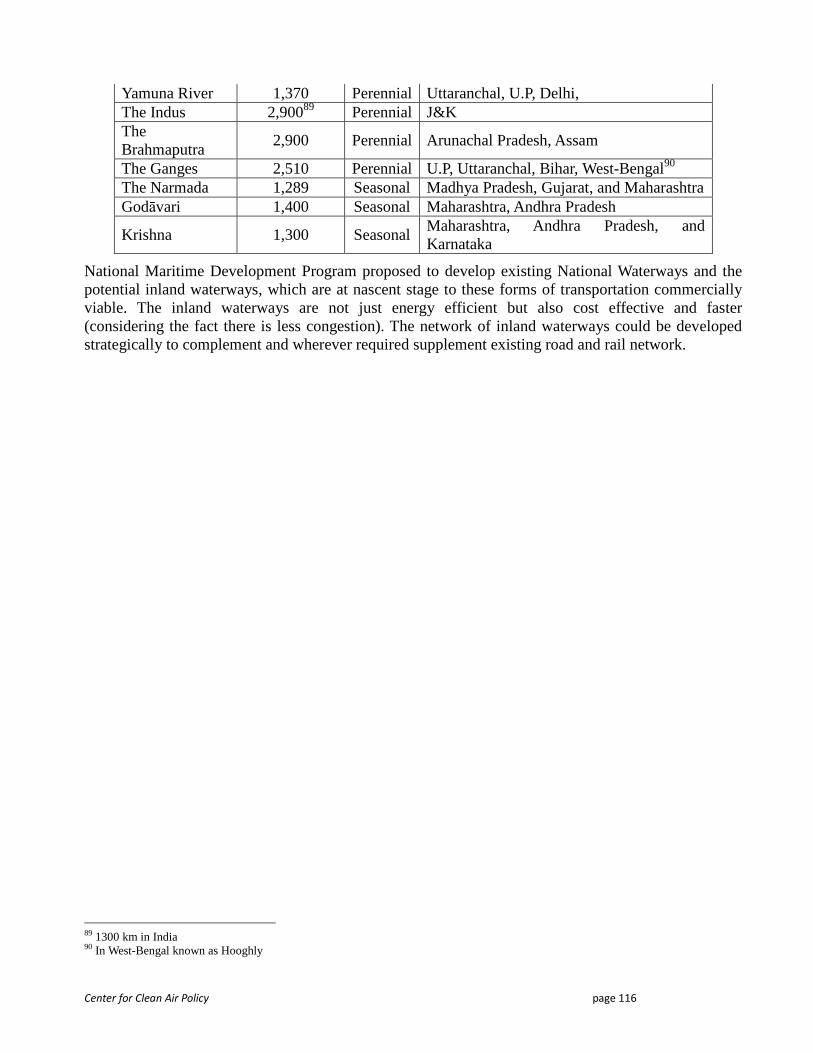
Center for Clean Air Policy page 116
Yamuna River 1,370 Perennial Uttaranchal, U.P, Delhi, The Indus 2,90089 Perennial J&K The Brahmaputra
2,900 Perennial Arunachal Pradesh, Assam
The Ganges 2,510 Perennial U.P, Uttaranchal, Bihar, West-Bengal90 The Narmada 1,289 Seasonal Madhya Pradesh, Gujarat, and Maharashtra Godāvari 1,400 Seasonal Maharashtra, Andhra Pradesh
Krishna 1,300 Seasonal Maharashtra, Andhra Pradesh, and Karnataka
National Maritime Development Program proposed to develop existing National Waterways and the potential inland waterways, which are at nascent stage to these forms of transportation commercially viable. The inland waterways are not just energy efficient but also cost effective and faster (considering the fact there is less congestion). The network of inland waterways could be developed strategically to complement and wherever required supplement existing road and rail network.
89 1300 km in India 90 In West-Bengal known as Hooghly
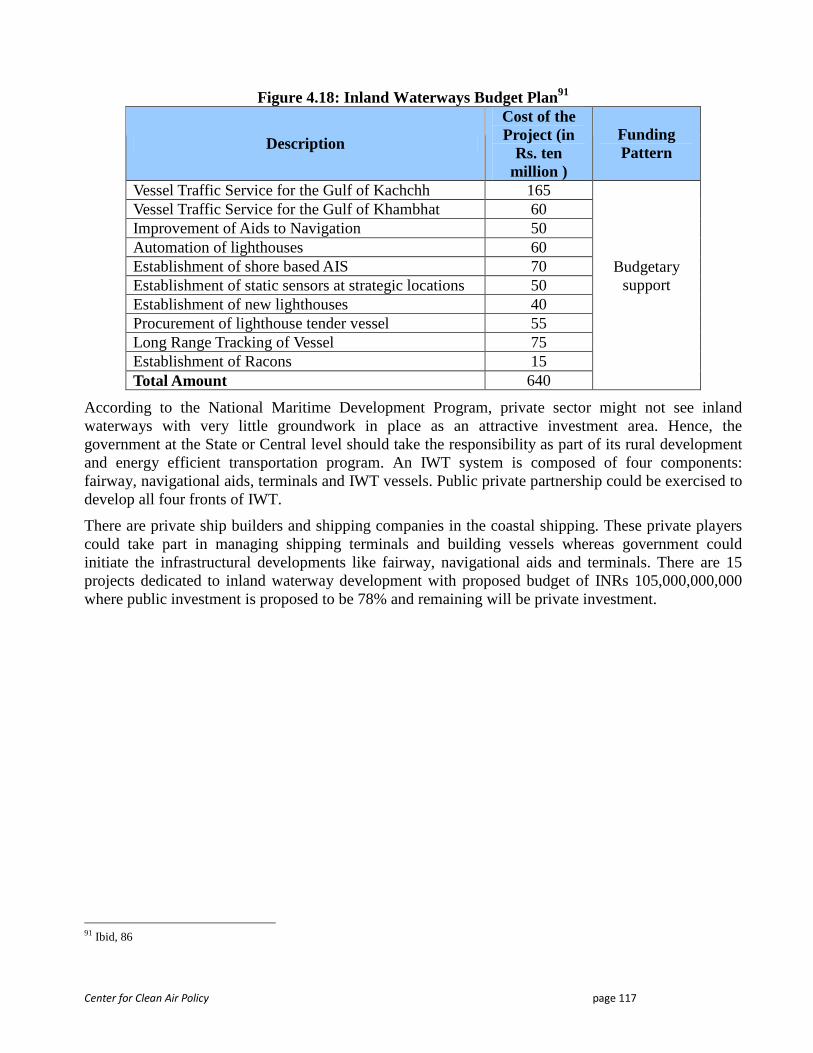
Center for Clean Air Policy page 117
Figure 4.18: Inland Waterways Budget Plan91
Description
Cost of the Project (in
Rs. ten million )
Funding Pattern
Vessel Traffic Service for the Gulf of Kachchh 165 Vessel Traffic Service for the Gulf of Khambhat 60 Improvement of Aids to Navigation 50 Automation of lighthouses 60 Establishment of shore based AIS 70 Establishment of static sensors at strategic locations 50 Establishment of new lighthouses 40 Procurement of lighthouse tender vessel 55 Long Range Tracking of Vessel 75 Establishment of Racons 15 Total Amount 640
Budgetary support
According to the National Maritime Development Program, private sector might not see inland waterways with very little groundwork in place as an attractive investment area. Hence, the government at the State or Central level should take the responsibility as part of its rural development and energy efficient transportation program. An IWT system is composed of four components: fairway, navigational aids, terminals and IWT vessels. Public private partnership could be exercised to develop all four fronts of IWT.
There are private ship builders and shipping companies in the coastal shipping. These private players could take part in managing shipping terminals and building vessels whereas government could initiate the infrastructural developments like fairway, navigational aids and terminals. There are 15 projects dedicated to inland waterway development with proposed budget of INRs 105,000,000,000 where public investment is proposed to be 78% and remaining will be private investment.
91 Ibid, 86
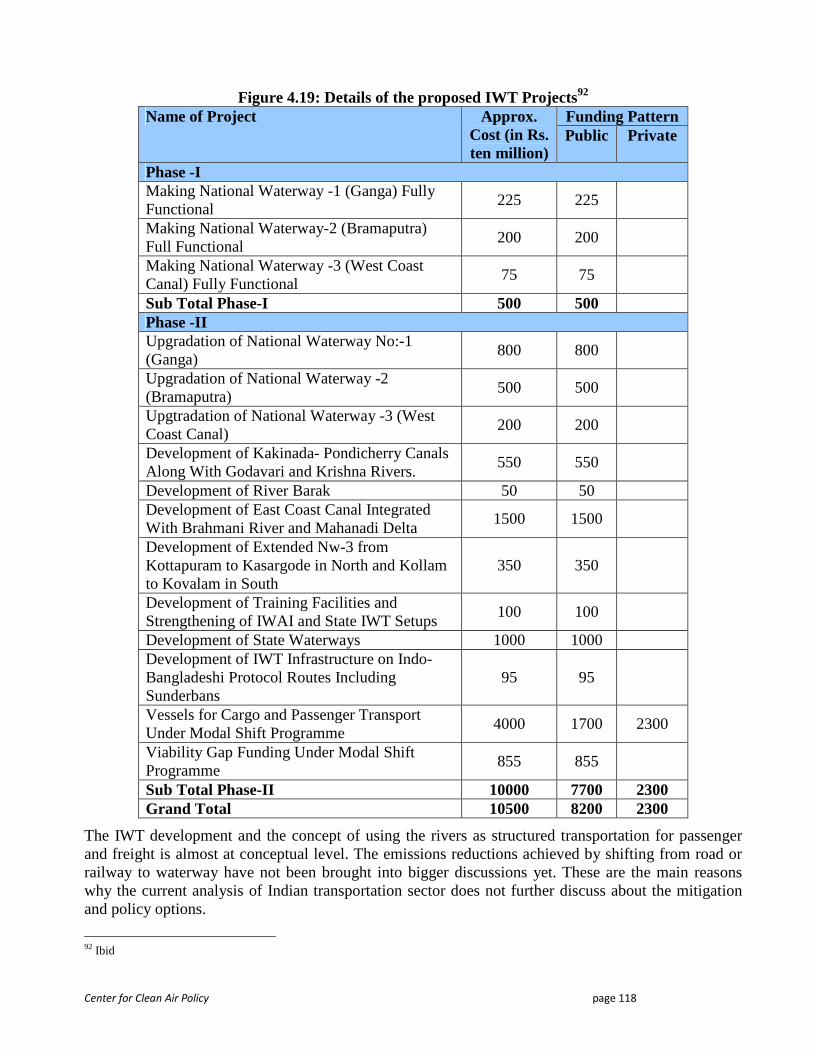
Center for Clean Air Policy page 118
Figure 4.19: Details of the proposed IWT Projects92 Funding Pattern Name of Project Approx.
Cost (in Rs. ten million)
Public Private
Phase -I Making National Waterway -1 (Ganga) Fully Functional
225 225
Making National Waterway-2 (Bramaputra) Full Functional
200 200
Making National Waterway -3 (West Coast Canal) Fully Functional
75 75
Sub Total Phase-I 500 500 Phase -II Upgradation of National Waterway No:-1 (Ganga)
800 800
Upgradation of National Waterway -2 (Bramaputra)
500 500
Upgtradation of National Waterway -3 (West Coast Canal)
200 200
Development of Kakinada- Pondicherry Canals Along With Godavari and Krishna Rivers.
550 550
Development of River Barak 50 50 Development of East Coast Canal Integrated With Brahmani River and Mahanadi Delta
1500 1500
Development of Extended Nw-3 from Kottapuram to Kasargode in North and Kollam to Kovalam in South
350 350
Development of Training Facilities and Strengthening of IWAI and State IWT Setups
100 100
Development of State Waterways 1000 1000 Development of IWT Infrastructure on Indo-Bangladeshi Protocol Routes Including Sunderbans
95 95
Vessels for Cargo and Passenger Transport Under Modal Shift Programme
4000 1700 2300
Viability Gap Funding Under Modal Shift Programme
855 855
Sub Total Phase-II 10000 7700 2300 Grand Total 10500 8200 2300
The IWT development and the concept of using the rivers as structured transportation for passenger and freight is almost at conceptual level. The emissions reductions achieved by shifting from road or railway to waterway have not been brought into bigger discussions yet. These are the main reasons why the current analysis of Indian transportation sector does not further discuss about the mitigation and policy options.
92 Ibid
Center for Clean Air Policy page 119
IV.A.6 Roadways
Road transportation is the biggest source of transportation related emissions in India. According to Phase I report by TERI, there have been shifts from railway to road transportation for passenger and freight transportation. The analysis mainly deals with the vehicular GHG emissions and the potential mitigation options. Phase I had identified biodiesel as the main GHG mitigation option for the vehicular emissions because of the low marginal cost of abatement and very high benefits on the overall emissions reductions.
Considering the conflicting argument of food vs. fuel, probable land use change issues and huge potential of integrating electric vehicles into the urban transportation, two mitigation options have been identified: expansion of biofuels (not just biodiesel) and integration of electric vehicles into the existing fleet. Financial, technical, environmental and infrastructural assessment has been carried out to analyse the selected mitigation options and barriers to implement these mitigation options. In the case of policy options, attempt has been made to find the gaps in existing policies and schemes and make further recommendations to strengthen these policies to mind the barriers.
IV.B Assumptions and Uncertainties
Mitigation measures selected vary according to the type of gas to be brought under control. The mitigation options can be implemented upstream, mid stream and downstream. The upstream mitigation measures can be more effective than the downstream owing to the easier monitoring mechanisms. The upstream mitigation measures could pass-on magnified mitigation impacts as one moves further along the value chain.
There are two categories of vehicular emissions, including gases controlled from air pollution perspective and gases controlled from climate change/ global warming perspective. Sometimes the mitigation measures taken against one category of gases increases the emission of other category of gases. The vehicular emissions controlled by the pollution control board include NOx, SOx, CO, and PM10. All of these gases and the particulate matter are controlled for health reasons and better air quality and not necessarily to mitigate the climate change problems. The gases that are categorized as GHG are not included under the pollution control board.
Mitigation options can be categorized as the direct mitigation and indirect mitigation. Direct mitigation options are associated with the vehicles and their direct emissions. These options include reducing actual emissions from the exhaust, increasing the energy efficiency of the vehicles, performance optimization of the vehicles and fuel efficiency. Indirect mitigation options are associated with management, operation and auxiliary systems including better traffic light systems, congestion tax/pricing, control in the quality of fuel, road maintenance and improving pedestrian walkways.
In this analysis, the mitigation options and the policy options were assumed for urban transportation. This includes in-depth analysis of road and brief analysis and description of aviation, waterway and railway transportation. The options analyzed are based on the existing and potential mitigation measures and supporting regulatory framework. It is assumed that both the mitigation measures and the barriers to their implementation can be categorized into short, medium and long term. The choice of mitigation options is based on the ultimate emissions reduction potential. Hence, the mitigation measures identified can be either direct or indirect. Accordingly, the policy options in support of these mitigation measures will also be categorized into short, medium and long term policies.
Mitigation measures such as modal shift and behaviour change are difficult to quantify. Hence, such qualitative mitigation measures entail uncertainties regarding the cost estimates. The cost estimation
Center for Clean Air Policy page 120
for such qualitative measures will assume indirect costs such as public awareness campaigns. Other uncertainties include the absence of time frame in the existing policies, validity of the assumptions and targets in the existing and proposed policies, alignment of state level policies and programs with national policies, and credibility of the statistical projections.
IV.C Existing Policy framework
Transportation policies alone will not be able to meet the emissions reduction target set by the National Communication and the National Action Plan on Climate Change. The policies, inter alia, land use, urban development, infrastructure development, agriculture development and housing; interplay with the mainstream transportation policies. For instance, Smart Growth policies can influence the shift from personal vehicles to public transportation.
There are several policies dedicated to transportation. Policies like Integrated Transport Policy, National Autofuel Policy, and National Urban Transport Policy aim at attaining energy efficiency and reduce the pollution as well as GHG emissions. Certain under dispute policies like Auto Fuel Standard policies could have supported existing ones to make the implementation and enforcement more effective. Following is the list of transportation related policies and schemes in India:
1. Indian Integrated Transport Policy 2020 focuses on meeting the higher transportation needs by combining energy efficiency, inter modal shift in freight and passenger transportation
2. Bharat Standards I-III , which follows the norms and guidelines of EU Vehicle Standards, focuses on the pollution emission threshold prescribed by the pollution control board. It does not necessarily deal with GHG emissions. However, implementation of Bharat Standards will help draw link with GHG emissions through its continuous effort to increase the vehicle efficiency.
3. India Hydrocarbon Vision 2025, released in 2000, lays down the framework for long term national energy security, i.e., till 2025. It recommends raising FDI ceiling for oil refining from the present 49 percent to 74 percent to meet US$57.54 billion investment required by the hydrocarbon sector over the next 25 years. It also emphasized on the need to have a long term policy for this sector to attract foreign investments.
4. National Urban Transportation Policy, 2006 promotes mass rapid transit system for the cities with population over four million. It also has the plans to improve the pedestrian walkways, dedicated lanes for non-motorized vehicles and heavy vehicles, allocating parking lots for heavy vehicles outside the city limits and mechanism to allot mandatory parking space for all commercial and residential properties and special preference for public and non-motorized vehicles.
5. National Auto Fuel Policy, 2003 gives a roadmap for achieving the vehicular emission norms- Bharat II & III over a period of time and the corresponding fuel quality upgradation requirements. The report has estimated that the existing domestic oil refineries would need to incur an additional investment of around Rs.18,000 crore by the year 2005. Further investment of around Rs.12,000 crore will need to be made during the period 2005-2010. The investment requirement of the automobile industry is estimated at around Rs.25,000 crore over this period.
6. Motor Vehicle Act, 1988 came into force in May 1989 covering the entire country states the rules and regulations pertaining to registration of vehicles and issuing driver’s license.
Center for Clean Air Policy page 121
7. Central Motor Vehicle Rules, 1989 encourages use of cleaner energy such as CNG, LPG, solar and battery and has provision for type approval for CNG/LPG vehicles among other motor vehicle related rules.
8. Petroleum and Natural Gas Regulatory Board Act, 2006: With the enactment of this policy a Petroleum and Natural Gas Regulatory Board to be set up to oversee and regulate the refining, processing, storage, transportation, distribution, marketing and sale of petroleum, petroleum products and natural gas.
9. Bio-diesel Purchase Policy, 2005 formulated by the MoPNG, came into effect from January 1, 2006 identified 20 purchase centres from where public sector oil marketing companies (OMCs) would purchase bio-diesel that meets the fuel quality standards prescribed by the Bureau of Industrial Standards (BIS) at a specified delivered price fixed for a period of six months at a time by the OMCs. Initial purchase price was slated at Rs.25/litre. Interestingly, so far, no party has been registered. Parties who have given expression of interest were either found not ready with production or were not willing to supply at the notified price
10. Pollution Under Control (PUC), 2004: All forms of vehicles – 2 wheelers, 3 wheelers, 4 wheelers, 2 stroke, 4 stroke, are required to undergo routine pollution check. Central Pollution Control Board (CPCB) has come up with new stricter PUC norms for in-use vehicles by CPCB. The norms include vehicular exhaust standards for light and heavy duty vehicles, auto fuel standards, Bharat Standards However, all of these norms are meant for gases which are not under the purview of the Kyoto Protocol.
There have been initiatives like phasing out of old and polluting vehicles, implementation of trial Bus Rapid Transit in Delhi and few other cities, switching the public transport fleet into less polluting natural gas.
Figure 4.20 illustrates barriers and potential solutions associated with transport technology in India.
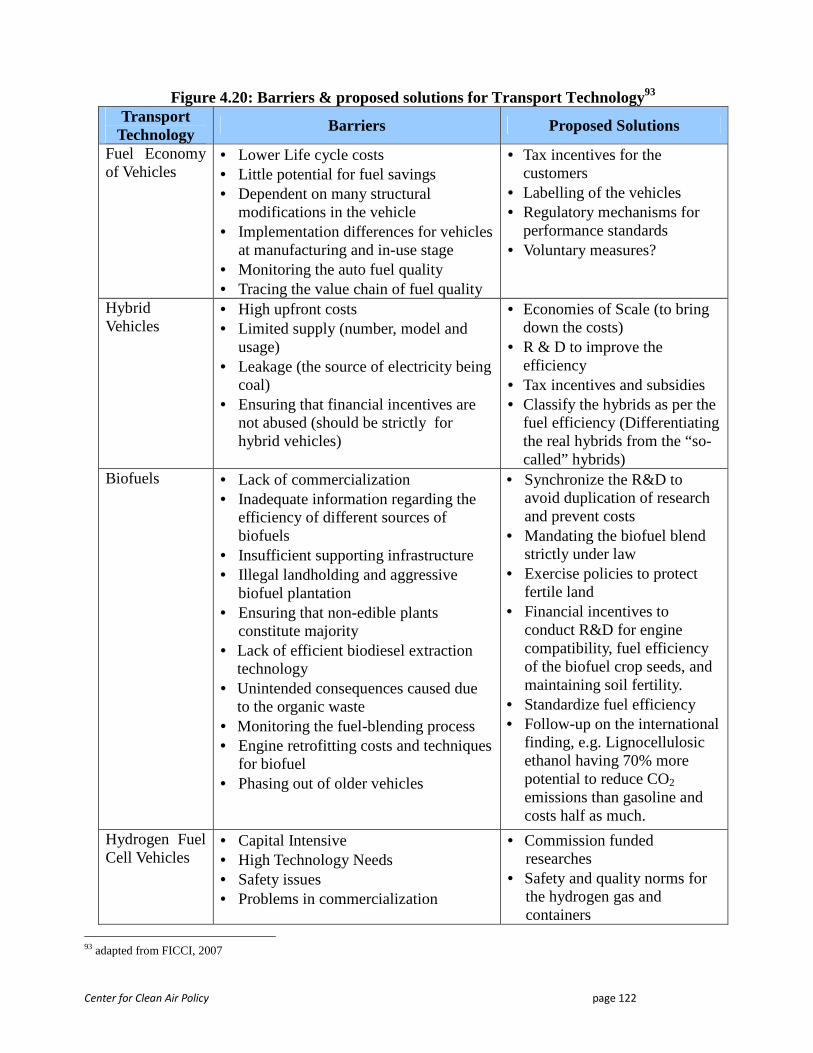
Center for Clean Air Policy page 122
Figure 4.20: Barriers & proposed solutions for Transport Technology93 Transport Technology
Barriers Proposed Solutions
Fuel Economy of Vehicles
• Lower Life cycle costs • Little potential for fuel savings • Dependent on many structural
modifications in the vehicle • Implementation differences for vehicles
at manufacturing and in-use stage • Monitoring the auto fuel quality • Tracing the value chain of fuel quality
• Tax incentives for the customers
• Labelling of the vehicles • Regulatory mechanisms for
performance standards • Voluntary measures?
Hybrid Vehicles
• High upfront costs • Limited supply (number, model and
usage) • Leakage (the source of electricity being
coal) • Ensuring that financial incentives are
not abused (should be strictly for hybrid vehicles)
• Economies of Scale (to bring down the costs)
• R & D to improve the efficiency
• Tax incentives and subsidies • Classify the hybrids as per the
fuel efficiency (Differentiating the real hybrids from the “so-called” hybrids)
Biofuels • Lack of commercialization • Inadequate information regarding the
efficiency of different sources of biofuels
• Insufficient supporting infrastructure • Illegal landholding and aggressive
biofuel plantation • Ensuring that non-edible plants
constitute majority • Lack of efficient biodiesel extraction
technology • Unintended consequences caused due
to the organic waste • Monitoring the fuel-blending process • Engine retrofitting costs and techniques
for biofuel • Phasing out of older vehicles
• Synchronize the R&D to avoid duplication of research and prevent costs
• Mandating the biofuel blend strictly under law
• Exercise policies to protect fertile land
• Financial incentives to conduct R&D for engine compatibility, fuel efficiency of the biofuel crop seeds, and maintaining soil fertility.
• Standardize fuel efficiency • Follow-up on the international
finding, e.g. Lignocellulosic ethanol having 70% more potential to reduce CO2 emissions than gasoline and costs half as much.
Hydrogen Fuel Cell Vehicles
• Capital Intensive • High Technology Needs • Safety issues • Problems in commercialization
• Commission funded researches
• Safety and quality norms for the hydrogen gas and containers
93 adapted from FICCI, 2007

Center for Clean Air Policy page 123
• Financing incentives for the private manufacturing units
Electric Vehicles
• Shifting the CO2 emissions from the cities to the electricity generation sites
• Enhancing battery life and efficiency • Disposal of used battery • Speed and carrying capacity constraints
• Promote hydroelectric and clean/renewable power
• In vehicle clean/renewable electric generation
IV.D Mitigation Option: Expansion of Biofuel use in all forms of transportation
IV.D.1 Background
India imported nearly 70% of its annual crude petroleum requirement in 2005. In the fiscal year 2007-08, India imported 111.089 million tonnes of crude oil, which is about 1 million more tonnes compared to 200594. While the international rate of crude oil price has been fluctuating and with domestic targets to reduce GHG emissions, India is exploring domestic biofuel production. Currently India has 5% ethanol mix in 9 states. Among the targets set by NAP, two most outstanding ones are: increasing the ethanol blend to 20% and research on manufacturing hydrogen fuel and hydrogen fuelled vehicles. National Mission on Biodiesel (TERI, 2005) India has already set targets to blend 10% ethanol by October 2008, establish biodiesel plantation in 26 states and increase the blend to 20% by 2011/12. However, National Mission on Biodiesel was replaced by National Biofuel Policy on September 11, 2008. The latter policy, National Biofuel Policy is more ambitious with the proposal to increase the current 5% ethanol blend to 20% for bioethanol and biodiesel by 2017.
In a view to increase country’s ethanol output, Indian government is likely to raise the fixed price of ethanol nearly 5 to 10 percent from its current level in the coming months95. National Action Plan on Climate Change (NAPCC) puts a lot of emphasis on the development of biodiesel fuels and biofuels, financial incentives for clean forms of transportation and improvement of existing railway system. India is relying on molasses and sugarcane for biofuel and Jatropha curcas and Pongamia for biodiesel. Jatropha curcas has 55-60% oil content which can be converted into biodiesel. TERI estimates that by 2010 ethanol demand will be approximately 3325 million liters.
Comparison of India against major biofuel producers
The use of biofuel blend with petrol and diesel is not a new practice, as countries like Sweden have historically been using ethanol in their vehicles. The context for the use of biofuels is however different. Earlier biofuels were used in response to energy crisis and now the biofuels are promoted as cleaner fuels, which also address fossil fuel scarcity issue. Biofuel consists of bioethanol (petrol blend), biodiesel (diesel blend) and biogas (natural gas blend). Bioethanol dominates the world biofuel market and its production is expected to grow at a cumulative average growth rate (CAGR) of around 6% during 2008-2017 and biodiesel production is expected to grow at a CAGR of over 5% during the same period. India is expected to have lower growth rate (CAGR of slightly over 2%) than the world average. However, with biodiesel mission mandating the use of 5% blend in nine states and now biofuel policy envisaging 20% blend by 2017 the domestic biofuel consumption rate is expected to
94 Commodity Online (http://www.commodityonline.com/news/topstory/Indian-crude-oil-imports-reach-at-111-ml-tonnes--7318-3.html) 95 Commodityonline. http://www.commodityonline.com/commodities/cereal/Govt-to-raise-ethanol-fixed-price-to-increase-output-9222-3.htmlethanol_10_percent_new.html
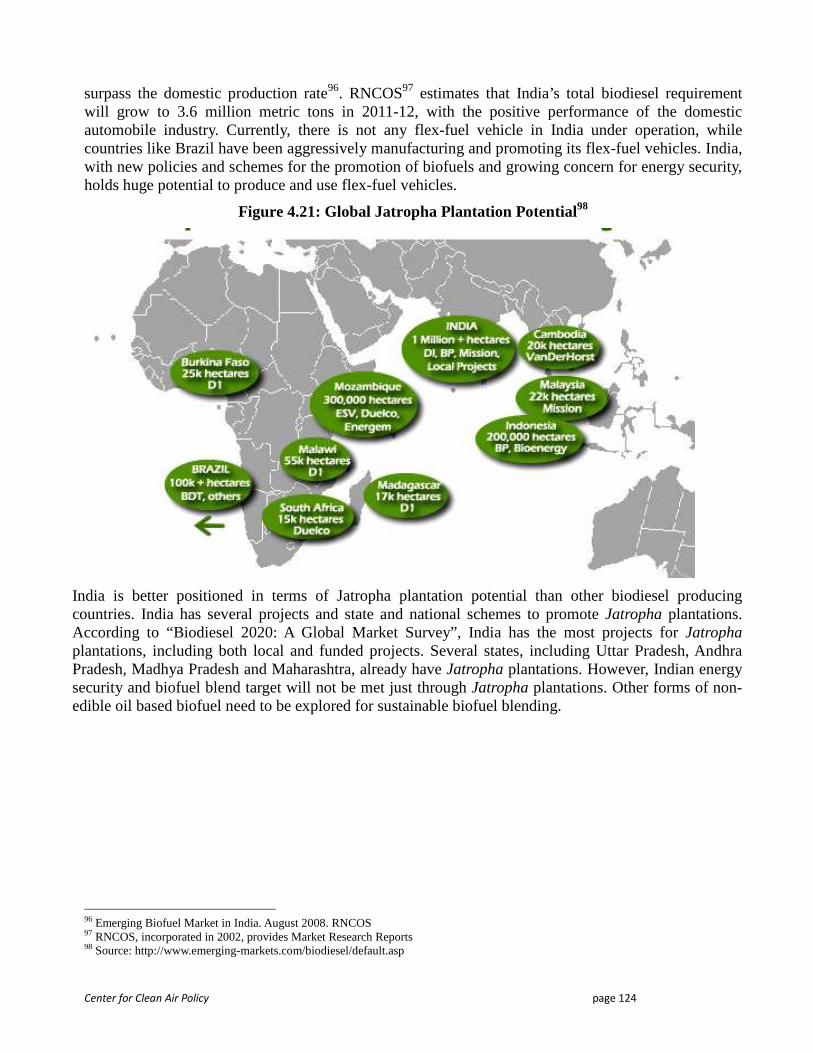
Center for Clean Air Policy page 124
surpass the domestic production rate96. RNCOS97 estimates that India’s total biodiesel requirement will grow to 3.6 million metric tons in 2011-12, with the positive performance of the domestic automobile industry. Currently, there is not any flex-fuel vehicle in India under operation, while countries like Brazil have been aggressively manufacturing and promoting its flex-fuel vehicles. India, with new policies and schemes for the promotion of biofuels and growing concern for energy security, holds huge potential to produce and use flex-fuel vehicles.
Figure 4.21: Global Jatropha Plantation Potential98
India is better positioned in terms of Jatropha plantation potential than other biodiesel producing countries. India has several projects and state and national schemes to promote Jatropha plantations. According to “Biodiesel 2020: A Global Market Survey”, India has the most projects for Jatropha plantations, including both local and funded projects. Several states, including Uttar Pradesh, Andhra Pradesh, Madhya Pradesh and Maharashtra, already have Jatropha plantations. However, Indian energy security and biofuel blend target will not be met just through Jatropha plantations. Other forms of non-edible oil based biofuel need to be explored for sustainable biofuel blending.
96 Emerging Biofuel Market in India. August 2008. RNCOS 97 RNCOS, incorporated in 2002, provides Market Research Reports 98 Source: http://www.emerging-markets.com/biodiesel/default.asp
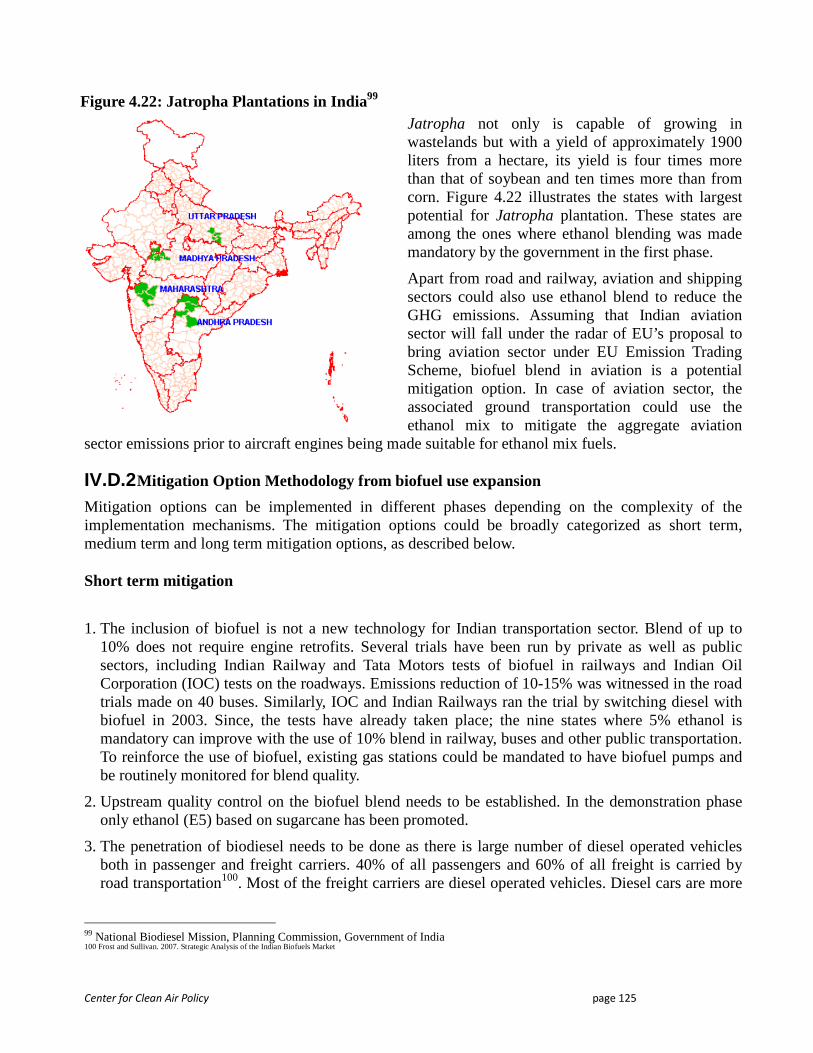
Center for Clean Air Policy page 125
Figure 4.22: Jatropha Plantations in India99
Jatropha not only is capable of growing in wastelands but with a yield of approximately 1900 liters from a hectare, its yield is four times more than that of soybean and ten times more than from corn. Figure 4.22 illustrates the states with largest potential for Jatropha plantation. These states are among the ones where ethanol blending was made mandatory by the government in the first phase.
Apart from road and railway, aviation and shipping sectors could also use ethanol blend to reduce the GHG emissions. Assuming that Indian aviation sector will fall under the radar of EU’s proposal to bring aviation sector under EU Emission Trading Scheme, biofuel blend in aviation is a potential mitigation option. In case of aviation sector, the associated ground transportation could use the ethanol mix to mitigate the aggregate aviation
sector emissions prior to aircraft engines being made suitable for ethanol mix fuels.
IV.D.2 Mitigation Option Methodology from biofuel use expansion
Mitigation options can be implemented in different phases depending on the complexity of the implementation mechanisms. The mitigation options could be broadly categorized as short term, medium term and long term mitigation options, as described below.
Short term mitigation
1. The inclusion of biofuel is not a new technology for Indian transportation sector. Blend of up to 10% does not require engine retrofits. Several trials have been run by private as well as public sectors, including Indian Railway and Tata Motors tests of biofuel in railways and Indian Oil Corporation (IOC) tests on the roadways. Emissions reduction of 10-15% was witnessed in the road trials made on 40 buses. Similarly, IOC and Indian Railways ran the trial by switching diesel with biofuel in 2003. Since, the tests have already taken place; the nine states where 5% ethanol is mandatory can improve with the use of 10% blend in railway, buses and other public transportation. To reinforce the use of biofuel, existing gas stations could be mandated to have biofuel pumps and be routinely monitored for blend quality.
2. Upstream quality control on the biofuel blend needs to be established. In the demonstration phase only ethanol (E5) based on sugarcane has been promoted.
3. The penetration of biodiesel needs to be done as there is large number of diesel operated vehicles both in passenger and freight carriers. 40% of all passengers and 60% of all freight is carried by road transportation100. Most of the freight carriers are diesel operated vehicles. Diesel cars are more
99 National Biodiesel Mission, Planning Commission, Government of India 100 Frost and Sullivan. 2007. Strategic Analysis of the Indian Biofuels Market
Center for Clean Air Policy page 126
popular owing to its lower operational cost. Hence, without the availability of biodiesel, these diesel vehicles will continue to emit the same level of GHGs.
4. Biofuel blend should be penetrated into the states and cities neighbouring the nine states that are piloting the biofuel blend. The use of indigenously produced biofuels needs to be enforced in order to avoid carbon footprints due to transportation of biofuels.
5. Green labelling cities on the basis of number of biofuel vehicles being promoted will help the aggressive penetration of biofuel. Similarly, labelling of gas stations on the basis of quality and amount of biofuel distributed could help invigorate the quality control of biofuels.
Other short term mitigation measures are related to behaviour change and not necessarily specific to biofuel use. Mitigation measures through behaviour change are inter alia, reduce the trip length by choosing the most direct and shortest route, control the use of A/C, stop the engine during idling and traffic signals, adapt car-pooling system, inflate the tires regularly, optimize the air-fuel ratio, and avoid travelling in the peak-hours for non-work related trips
Medium term mitigation
1. Biofuel plantations should be encouraged in the wasteland. Proper entitlement of the land and proper inventory of the wasteland as well as forest and agricultural land needs to be done.
2. Expansion of biofuel operated vehicles and higher blend should be encouraged. The blend higher than 10% requires engine modifications. Hence, this implies that the auto manufacturers need to manufacture flex fuel vehicles. So far, there is not any flex-fuel vehicles reported to have been manufactured in India. National Biofuel Policy aims to achieve 20% blend by the end of 2017 (end of 12th 5-Year Plan).
3. Geographical coverage of the biofuel use needs to be expanded. The National Mission on Biodiesel had envisaged expanding the use of biodiesel in 26 states in the second phase. However, the expansion plan should be integrated with domestic biofuel production potential.
4. Lowering the selling price of biofuel and making it more attractive as compared to the conventional fuel like hi-speed diesel, petrol and diesel.
Long term mitigation
1. On-going R&D for different types of biofuel feedstock needs to be established. There might be other feedstock which are more fuel efficient, have lower GHG emissions and higher per hectare oil yield than the existing proven breeds.
2. Phasing out of the older vehicles and gasoline/diesel operated vehicles should be carried out. Mechanisms should be worked out to monitor the biofuel quality and enforce penalties if the quality is breached.
3. Long term mitigation measures across all fuel types and mitigation measures include – better traffic management, proper and timely road maintenance, inclusion of feeder buses, dedicated lane for clean vehicles, gradation of different clean vehicles on the basis of GHG emission reduction, free or subsidized parking fees and highway tolls for clean vehicles.
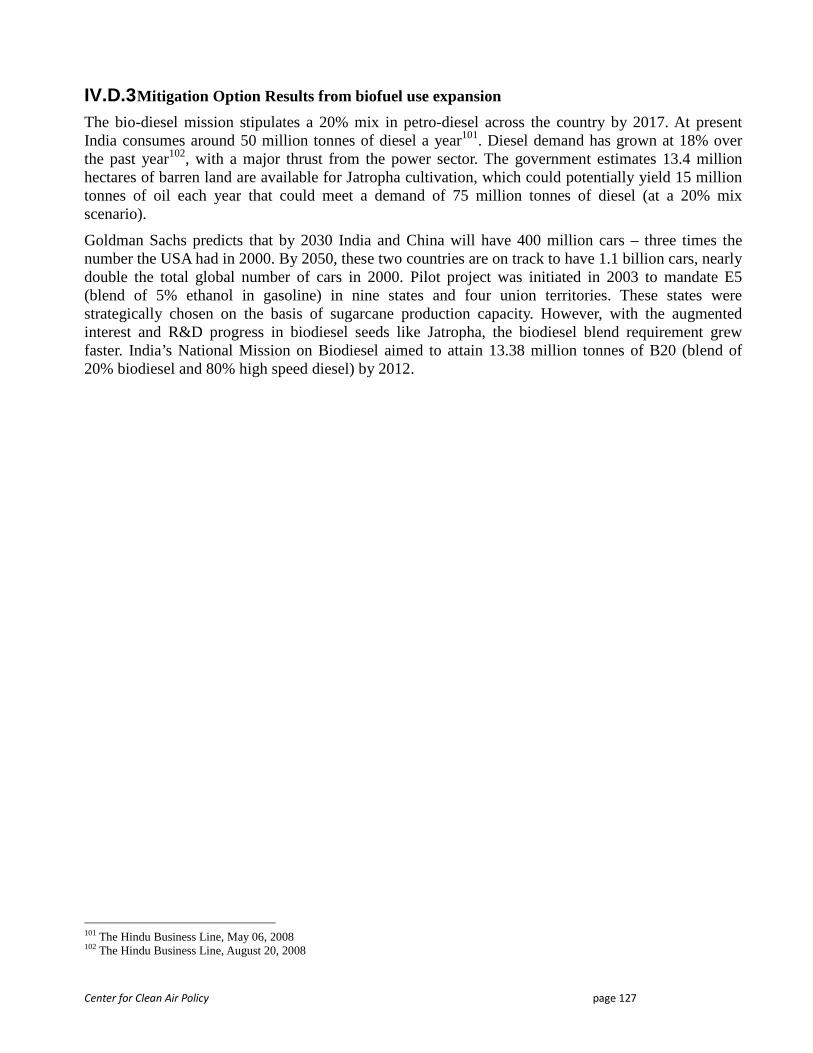
Center for Clean Air Policy page 127
IV.D.3 Mitigation Option Results from biofuel use expansion
The bio-diesel mission stipulates a 20% mix in petro-diesel across the country by 2017. At present India consumes around 50 million tonnes of diesel a year101. Diesel demand has grown at 18% over the past year102, with a major thrust from the power sector. The government estimates 13.4 million hectares of barren land are available for Jatropha cultivation, which could potentially yield 15 million tonnes of oil each year that could meet a demand of 75 million tonnes of diesel (at a 20% mix scenario).
Goldman Sachs predicts that by 2030 India and China will have 400 million cars – three times the number the USA had in 2000. By 2050, these two countries are on track to have 1.1 billion cars, nearly double the total global number of cars in 2000. Pilot project was initiated in 2003 to mandate E5 (blend of 5% ethanol in gasoline) in nine states and four union territories. These states were strategically chosen on the basis of sugarcane production capacity. However, with the augmented interest and R&D progress in biodiesel seeds like Jatropha, the biodiesel blend requirement grew faster. India’s National Mission on Biodiesel aimed to attain 13.38 million tonnes of B20 (blend of 20% biodiesel and 80% high speed diesel) by 2012.
101 The Hindu Business Line, May 06, 2008 102 The Hindu Business Line, August 20, 2008
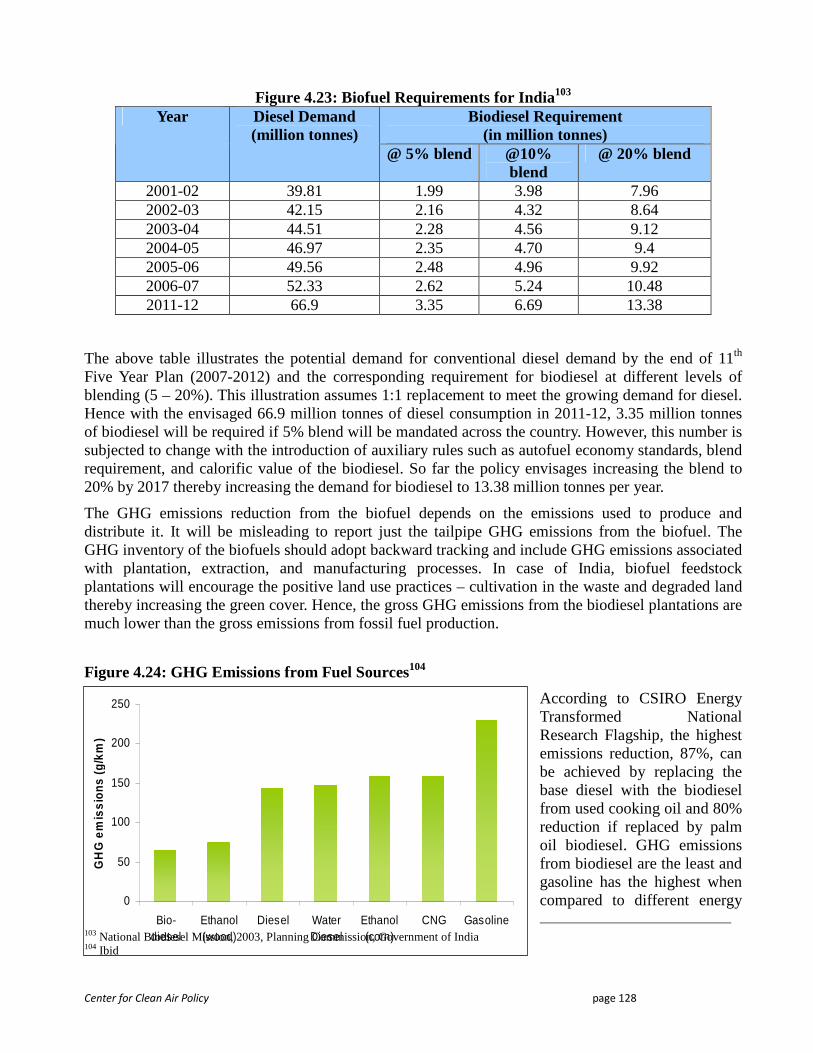
Center for Clean Air Policy page 128
Figure 4.23: Biofuel Requirements for India103 Biodiesel Requirement
(in million tonnes) Year Diesel Demand
(million tonnes) @ 5% blend @10%
blend @ 20% blend
2001-02 39.81 1.99 3.98 7.96 2002-03 42.15 2.16 4.32 8.64 2003-04 44.51 2.28 4.56 9.12 2004-05 46.97 2.35 4.70 9.4 2005-06 49.56 2.48 4.96 9.92 2006-07 52.33 2.62 5.24 10.48 2011-12 66.9 3.35 6.69 13.38
The above table illustrates the potential demand for conventional diesel demand by the end of 11th Five Year Plan (2007-2012) and the corresponding requirement for biodiesel at different levels of blending (5 – 20%). This illustration assumes 1:1 replacement to meet the growing demand for diesel. Hence with the envisaged 66.9 million tonnes of diesel consumption in 2011-12, 3.35 million tonnes of biodiesel will be required if 5% blend will be mandated across the country. However, this number is subjected to change with the introduction of auxiliary rules such as autofuel economy standards, blend requirement, and calorific value of the biodiesel. So far the policy envisages increasing the blend to 20% by 2017 thereby increasing the demand for biodiesel to 13.38 million tonnes per year.
The GHG emissions reduction from the biofuel depends on the emissions used to produce and distribute it. It will be misleading to report just the tailpipe GHG emissions from the biofuel. The GHG inventory of the biofuels should adopt backward tracking and include GHG emissions associated with plantation, extraction, and manufacturing processes. In case of India, biofuel feedstock plantations will encourage the positive land use practices – cultivation in the waste and degraded land thereby increasing the green cover. Hence, the gross GHG emissions from the biodiesel plantations are much lower than the gross emissions from fossil fuel production.
Figure 4.24: GHG Emissions from Fuel Sources104
According to CSIRO Energy Transformed National Research Flagship, the highest emissions reduction, 87%, can be achieved by replacing the base diesel with the biodiesel from used cooking oil and 80% reduction if replaced by palm oil biodiesel. GHG emissions from biodiesel are the least and gasoline has the highest when compared to different energy
103 National Biodiesel Mission, 2003, Planning Commission, Government of India 104 Ibid
0
50
100
150
200
250
Bio-diesel
Ethanol(wood)
Diesel WaterDiesel
Ethanol(corn)
CNG Gasoline
GH
G e
mis
sion
s (g
/km
)
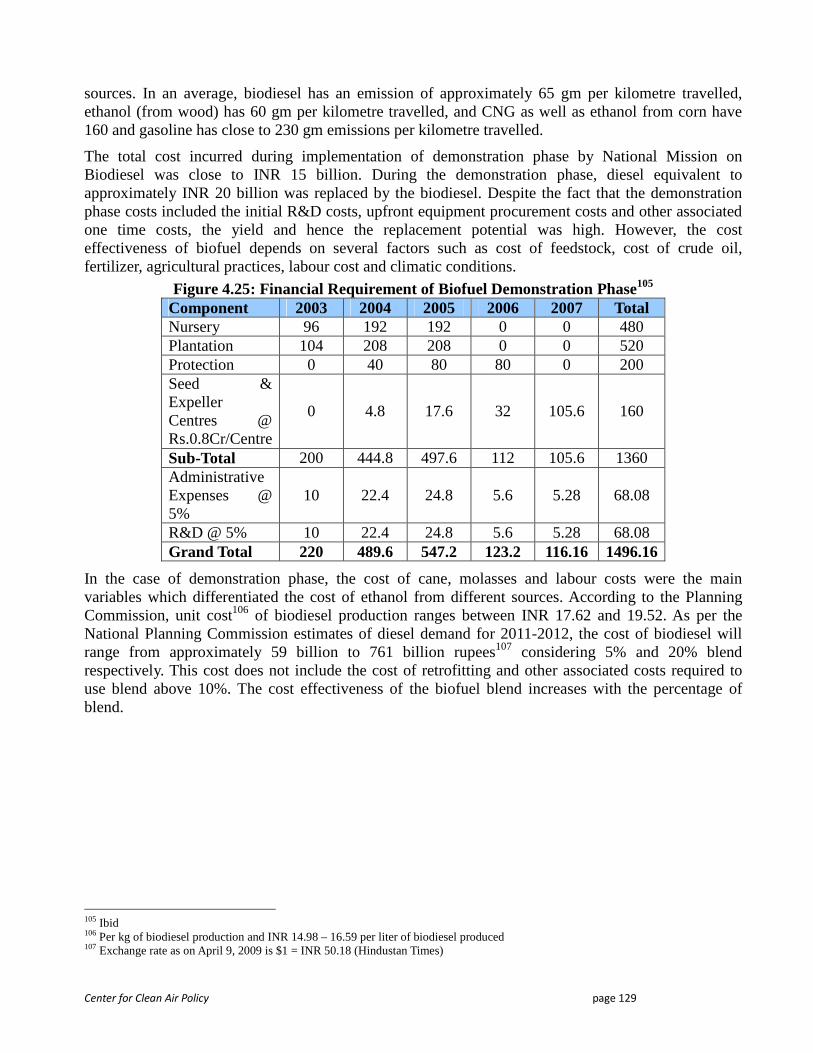
Center for Clean Air Policy page 129
sources. In an average, biodiesel has an emission of approximately 65 gm per kilometre travelled, ethanol (from wood) has 60 gm per kilometre travelled, and CNG as well as ethanol from corn have 160 and gasoline has close to 230 gm emissions per kilometre travelled.
The total cost incurred during implementation of demonstration phase by National Mission on Biodiesel was close to INR 15 billion. During the demonstration phase, diesel equivalent to approximately INR 20 billion was replaced by the biodiesel. Despite the fact that the demonstration phase costs included the initial R&D costs, upfront equipment procurement costs and other associated one time costs, the yield and hence the replacement potential was high. However, the cost effectiveness of biofuel depends on several factors such as cost of feedstock, cost of crude oil, fertilizer, agricultural practices, labour cost and climatic conditions.
Figure 4.25: Financial Requirement of Biofuel Demonstration Phase105 Component 2003 2004 2005 2006 2007 Total Nursery 96 192 192 0 0 480 Plantation 104 208 208 0 0 520 Protection 0 40 80 80 0 200 Seed & Expeller Centres @ Rs.0.8Cr/Centre
0 4.8 17.6 32 105.6 160
Sub-Total 200 444.8 497.6 112 105.6 1360 Administrative Expenses @ 5%
10 22.4 24.8 5.6 5.28 68.08
R&D @ 5% 10 22.4 24.8 5.6 5.28 68.08 Grand Total 220 489.6 547.2 123.2 116.16 1496.16
In the case of demonstration phase, the cost of cane, molasses and labour costs were the main variables which differentiated the cost of ethanol from different sources. According to the Planning Commission, unit cost106 of biodiesel production ranges between INR 17.62 and 19.52. As per the National Planning Commission estimates of diesel demand for 2011-2012, the cost of biodiesel will range from approximately 59 billion to 761 billion rupees107 considering 5% and 20% blend respectively. This cost does not include the cost of retrofitting and other associated costs required to use blend above 10%. The cost effectiveness of the biofuel blend increases with the percentage of blend.
105 Ibid 106 Per kg of biodiesel production and INR 14.98 – 16.59 per liter of biodiesel produced 107 Exchange rate as on April 9, 2009 is $1 = INR 50.18 (Hindustan Times)
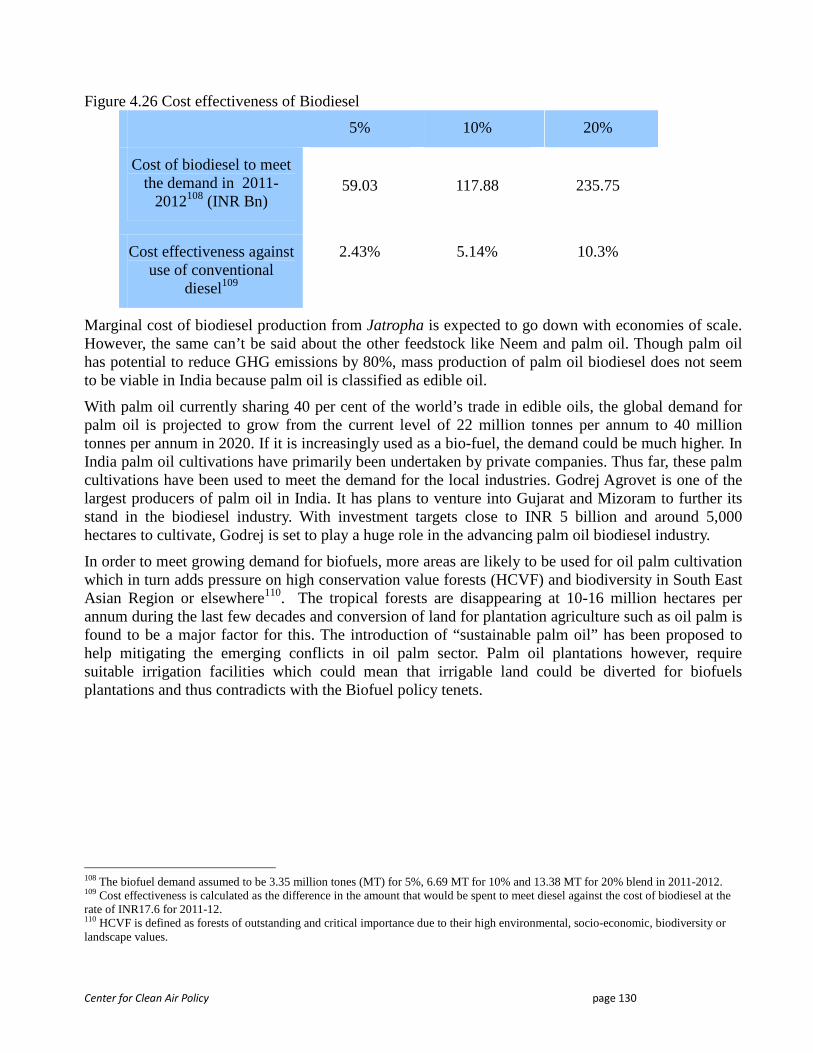
Center for Clean Air Policy page 130
Figure 4.26 Cost effectiveness of Biodiesel
5% 10% 20%
Cost of biodiesel to meet the demand in 2011-
2012108 (INR Bn)
59.03
117.88
235.75
Cost effectiveness against use of conventional
diesel109
2.43% 5.14% 10.3%
Marginal cost of biodiesel production from Jatropha is expected to go down with economies of scale. However, the same can’t be said about the other feedstock like Neem and palm oil. Though palm oil has potential to reduce GHG emissions by 80%, mass production of palm oil biodiesel does not seem to be viable in India because palm oil is classified as edible oil.
With palm oil currently sharing 40 per cent of the world’s trade in edible oils, the global demand for palm oil is projected to grow from the current level of 22 million tonnes per annum to 40 million tonnes per annum in 2020. If it is increasingly used as a bio-fuel, the demand could be much higher. In India palm oil cultivations have primarily been undertaken by private companies. Thus far, these palm cultivations have been used to meet the demand for the local industries. Godrej Agrovet is one of the largest producers of palm oil in India. It has plans to venture into Gujarat and Mizoram to further its stand in the biodiesel industry. With investment targets close to INR 5 billion and around 5,000 hectares to cultivate, Godrej is set to play a huge role in the advancing palm oil biodiesel industry.
In order to meet growing demand for biofuels, more areas are likely to be used for oil palm cultivation which in turn adds pressure on high conservation value forests (HCVF) and biodiversity in South East Asian Region or elsewhere110. The tropical forests are disappearing at 10-16 million hectares per annum during the last few decades and conversion of land for plantation agriculture such as oil palm is found to be a major factor for this. The introduction of “sustainable palm oil” has been proposed to help mitigating the emerging conflicts in oil palm sector. Palm oil plantations however, require suitable irrigation facilities which could mean that irrigable land could be diverted for biofuels plantations and thus contradicts with the Biofuel policy tenets.
108 The biofuel demand assumed to be 3.35 million tones (MT) for 5%, 6.69 MT for 10% and 13.38 MT for 20% blend in 2011-2012. 109 Cost effectiveness is calculated as the difference in the amount that would be spent to meet diesel against the cost of biodiesel at the rate of INR17.6 for 2011-12. 110 HCVF is defined as forests of outstanding and critical importance due to their high environmental, socio-economic, biodiversity or landscape values.
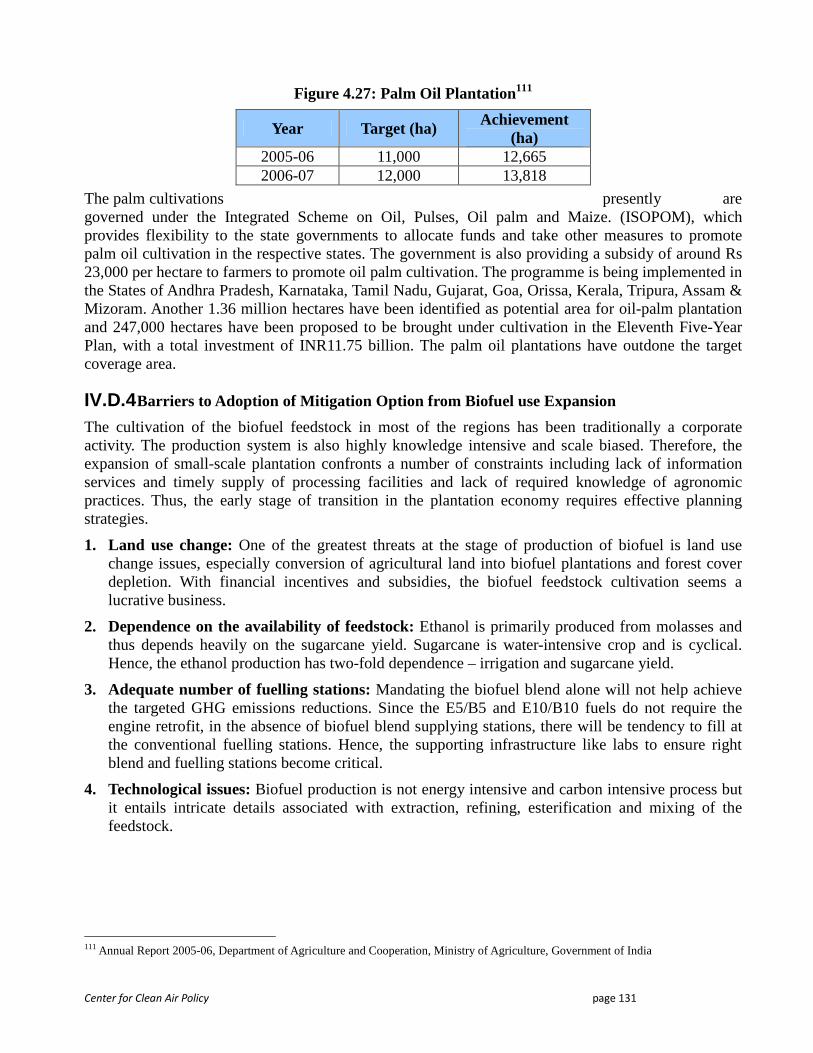
Center for Clean Air Policy page 131
Figure 4.27: Palm Oil Plantation111
The palm cultivations presently are governed under the Integrated Scheme on Oil, Pulses, Oil palm and Maize. (ISOPOM), which provides flexibility to the state governments to allocate funds and take other measures to promote palm oil cultivation in the respective states. The government is also providing a subsidy of around Rs 23,000 per hectare to farmers to promote oil palm cultivation. The programme is being implemented in the States of Andhra Pradesh, Karnataka, Tamil Nadu, Gujarat, Goa, Orissa, Kerala, Tripura, Assam & Mizoram. Another 1.36 million hectares have been identified as potential area for oil-palm plantation and 247,000 hectares have been proposed to be brought under cultivation in the Eleventh Five-Year Plan, with a total investment of INR11.75 billion. The palm oil plantations have outdone the target coverage area.
IV.D.4 Barriers to Adoption of Mitigation Option from Biof uel use Expansion
The cultivation of the biofuel feedstock in most of the regions has been traditionally a corporate activity. The production system is also highly knowledge intensive and scale biased. Therefore, the expansion of small-scale plantation confronts a number of constraints including lack of information services and timely supply of processing facilities and lack of required knowledge of agronomic practices. Thus, the early stage of transition in the plantation economy requires effective planning strategies.
1. Land use change: One of the greatest threats at the stage of production of biofuel is land use change issues, especially conversion of agricultural land into biofuel plantations and forest cover depletion. With financial incentives and subsidies, the biofuel feedstock cultivation seems a lucrative business.
2. Dependence on the availability of feedstock: Ethanol is primarily produced from molasses and thus depends heavily on the sugarcane yield. Sugarcane is water-intensive crop and is cyclical. Hence, the ethanol production has two-fold dependence – irrigation and sugarcane yield.
3. Adequate number of fuelling stations: Mandating the biofuel blend alone will not help achieve the targeted GHG emissions reductions. Since the E5/B5 and E10/B10 fuels do not require the engine retrofit, in the absence of biofuel blend supplying stations, there will be tendency to fill at the conventional fuelling stations. Hence, the supporting infrastructure like labs to ensure right blend and fuelling stations become critical.
4. Technological issues: Biofuel production is not energy intensive and carbon intensive process but it entails intricate details associated with extraction, refining, esterification and mixing of the feedstock.
111 Annual Report 2005-06, Department of Agriculture and Cooperation, Ministry of Agriculture, Government of India
Year Target (ha) Achievement (ha)
2005-06 11,000 12,665 2006-07 12,000 13,818
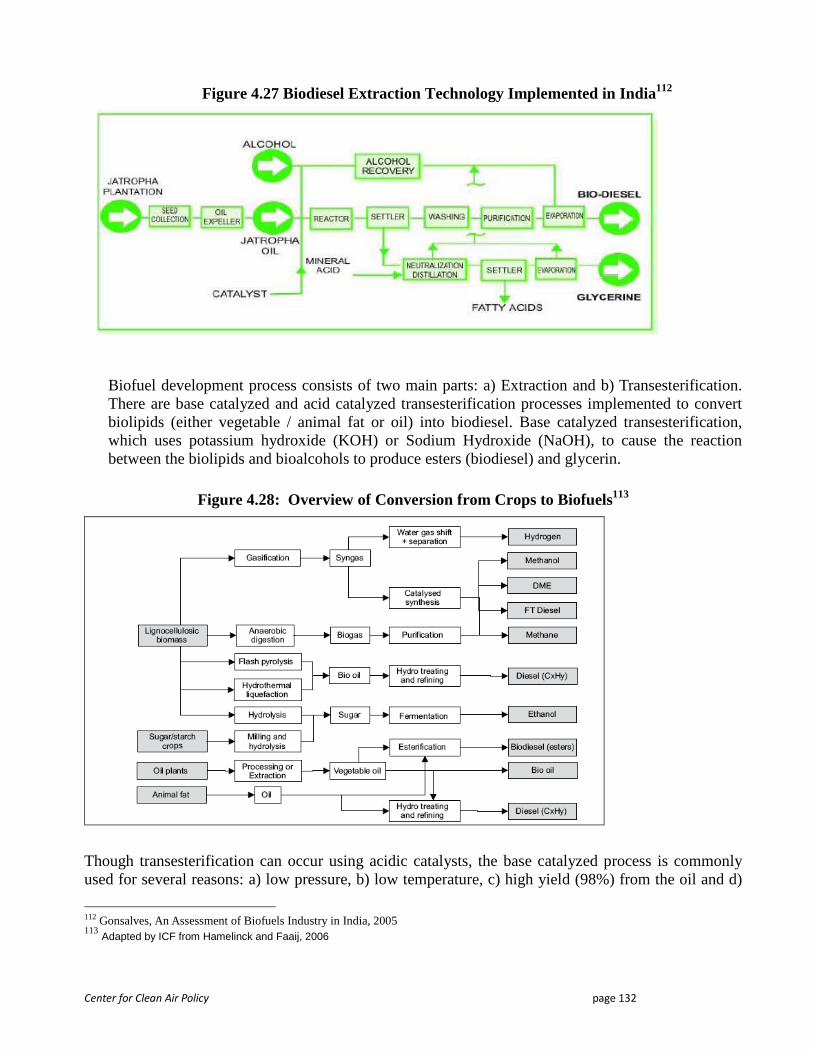
Center for Clean Air Policy page 132
Figure 4.27 Biodiesel Extraction Technology Implemented in India112
Biofuel development process consists of two main parts: a) Extraction and b) Transesterification. There are base catalyzed and acid catalyzed transesterification processes implemented to convert biolipids (either vegetable / animal fat or oil) into biodiesel. Base catalyzed transesterification, which uses potassium hydroxide (KOH) or Sodium Hydroxide (NaOH), to cause the reaction between the biolipids and bioalcohols to produce esters (biodiesel) and glycerin.
Figure 4.28: Overview of Conversion from Crops to Biofuels113
Though transesterification can occur using acidic catalysts, the base catalyzed process is commonly used for several reasons: a) low pressure, b) low temperature, c) high yield (98%) from the oil and d)
112 Gonsalves, An Assessment of Biofuels Industry in India, 2005 113 Adapted by ICF from Hamelinck and Faaij, 2006
Center for Clean Air Policy page 133
low cost. In case of bioethanol production from sugar, starch, and crops, different conversion route is followed – hydrolysis and fermentation. In India only first generation biofuels are produced. Though the technology is mature and proven, the biofuel production is still at nascent stage in India. National Policy emphasizes on the indigenous production methodology and limits the use of FFAs.
The biofuel extraction technology is not a common practice in India and hence poses technological barrier. Domestic R&D institutes need to participate more to develop technologies which suit better to the availability of local catalysts for esterification, feedstock and climatic conditions.
5. High Costs: Biofuel feedstock plantations require huge investments and large gestation periods. Cultivation of other feedstock is higher than for Jatropha. About 78% of the biofuel demand has been sufficed by importing the feedstock. Importing feedstock does not help reduce the energy security issues and the feedstock thus imported will have higher carbon footprint.
6. Monitoring the quality of mixing/blend: Efficiency and real reductions can be achieved only with the right blend of biofuel and petro-fuel. Quality control of the biofuel blend should be made mandatory at the mixing stations and at the distribution units – fuelling stations.
7. Dependence on supporting infrastructure and administrative mechanisms: Running the vehicles on the cleaner low carbon fuel alone will not automatically reduce the emissions. The effectiveness of this mitigation option depends on fuel efficiency standards, well-maintained roads, reliable emissions level check, traffic management and properly designed traffic lights. Unless these complementary mechanisms are addressed in the policies, rules or enforced, the optimal emissions reductions will be difficult to achieve.
IV.E Policy Options for Expansion of Biofuel use India has been trying to include biofuels as one of the mainstream transportation fuels. Government of India made considerable effort in development and expansion of biofuels. Initially National Mission on Biodiesel was proposed and then recently National Biofuel Policy was proposed which replaced the former regulatory framework. This section includes brief analysis of both the policies followed by policy options proposed to address the mitigation options identified earlier in this chapter.
IV.E.1 National Biofuel Policy
The cabinet approved National Biofuel Policy on September 11, 2008 replacing National Mission on Biodiesel. National Mission on Biodiesel introduced blending of 5% ethanol with motor spirit from January 1, 2003 in 8 States is a step in the right direction which simultaneously meets three objectives -reducing emissions, reducing energy imports and improving the livelihood of farmers. The plantation of tree-borne oil seeds for production of bio diesel was encouraged in under-utilized or unutilized land, either fallow, barren, degraded or under stocked, as in forests which are in drought prone areas.
Ethanol Blending Program - Demonstration Phase:
1. Coverage: 4L ha in compact areas each of 50-60K ha. Total 8 areas proposed- one in each of eight states- Tamil Nadu, Chhattisgarh, Gujarat and Tripura (forest land) and UP, MP, Andhra and Maharashtra (non-forest land)
2. Six micro-missions and the corresponding nodal-agencies identified 3. Financial Requirement: Rs.1496 Cr. for demo phase (from the govt.) Trans-esterification
unit- a commercial venture (from oil companies). R&D: collective efforts of parties involved 4. Output: 0.48 MMT of biodiesel and 10.52 MMT of compost
Center for Clean Air Policy page 134
The mission worked out the price of bio-diesel under the assumptions that:
a) Cost of seed as Rs. 5 per kg,
b) 3.28 kg of seed yielding one litre of oil and
c) Varying prices of by-products. The objective of the mission was to gradually raise it to take it to 20% in the year 2011 – 12 beginning with 5% in 2006-07.
It was estimated that high speed diesel demand by the end of 11th Plan (2011-12) shall be 66.9 MMT requiring 13.38 MMT of biodiesel which in turn will require plantation of Jatropha curcas over about 11.2 million ha of land. In order to achieve 5% replacement of petrodiesel by bio-diesel by the year 2006-07, minimum of 2.19 million ha area was required to be under Jatropha curcas plantation. Jatropha has been found most suitable for biodiesel production in India. It can be planted on under-stocked forest lands managed by the Joint Forestry Management Committees. Committees, farmers field boundaries to provide protective hedge, fallow lands, on farmers’ holdings as agro-forestry along with agricultural crops, public lands along railway tracks, highways, canals and community and government lands in villages. It can also be planted under the poverty alleviation programmes that deal with land improvement.
The National Mission on Biodiesel was proposed in two phases: Phase-I consisting of a Demonstration Project to be implemented by 2006-07 and Phase-II envisioned to be self-sustaining expansion of the programme beginning in 2007 leading to production of Biodiesel required in 2011-12. National Biofuel Policy is more comprehensive as it includes other oil sources and has more ambitious targets. The National Biofuel Policy envisages that bio-fuels, namely, bio-diesel and bio-ethanol may be brought under the ambit of “Declared Goods” by the Government to ensure unrestricted movement of bio-fuels within and outside the states.
The new policy targets to achieve 20% bio-ethanol and bio-diesel blend by 2017. The higher blend target increases the demand of the biofuel. India is already experiencing energy insecurity. Hence, this policy which targets for higher biofuel blend for transportation use should not rely on biofuel import. The policy envisages to: a) limit the biofuel extraction and production from non-edible oil seeds; b) use degraded, marginal and waste land for biofuel plantations and discourage the plantations in irrigated fertile lands; c) prohibit import of Free Fatty Acid (FFA); d) emphasize on the indigenous production of bio-diesel feedstock. Four types of non-edible oil seeds have been identified as the feasible feedstock for biodiesel cultivation - Jatropha curcas (Jatropha), Pongamia pinnata (Karanj), Azadirachta indica (Neem) and Madhuca indica (Mahua)
The policy thus aims for sustainable cultivation of the biofuel plants and meet the need for increased demand for the biofuel domestically. Thus, the biofuel policy have safety valve for the domestic production and ensures that the negative land use practices are not implemented. The biofuel policy actually helps to increase the green cover and improve the soil quality and water retention capacity of the soil. Thus, the approval of this landmark policy has environmental co-benefits along with remarkable reduction in GHG emissions.
The financial incentives are earmarked to promote the bio-diesel oil seeds. One of such incentives is Minimum Support Price (MSP) which provides fair price to the growers through periodic revisions. Another incentive is Minimum Purchase Price (MPP) which would allow the purchase of bio-ethanol by the Oil Marketing Companies (OMCs) based on the actual cost of production and import price of bio-ethanol. In case of bio-diesel, the MPP should be linked to the prevailing retail diesel price. Additionally, no tax and duty will be levied on the bio-diesel. However, it is not clear if this tax break is throughout the value chain of biodiesel production and distribution or just restricted to certain
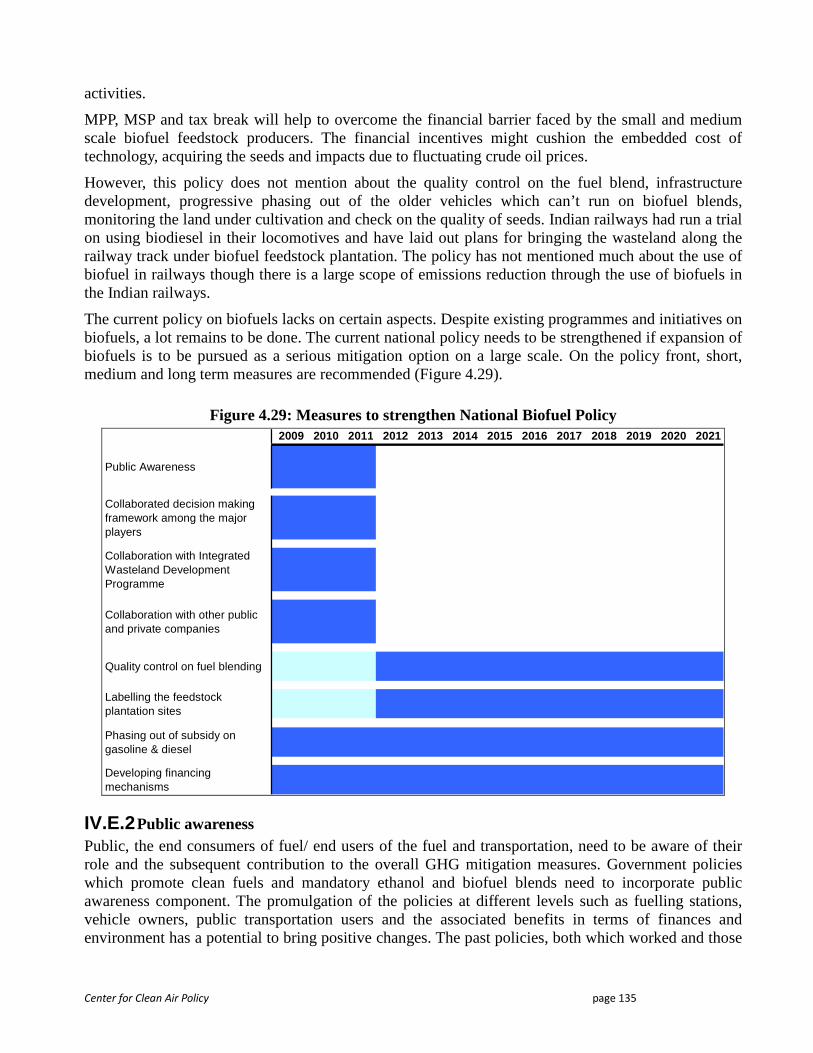
Center for Clean Air Policy page 135
activities.
MPP, MSP and tax break will help to overcome the financial barrier faced by the small and medium scale biofuel feedstock producers. The financial incentives might cushion the embedded cost of technology, acquiring the seeds and impacts due to fluctuating crude oil prices.
However, this policy does not mention about the quality control on the fuel blend, infrastructure development, progressive phasing out of the older vehicles which can’t run on biofuel blends, monitoring the land under cultivation and check on the quality of seeds. Indian railways had run a trial on using biodiesel in their locomotives and have laid out plans for bringing the wasteland along the railway track under biofuel feedstock plantation. The policy has not mentioned much about the use of biofuel in railways though there is a large scope of emissions reduction through the use of biofuels in the Indian railways.
The current policy on biofuels lacks on certain aspects. Despite existing programmes and initiatives on biofuels, a lot remains to be done. The current national policy needs to be strengthened if expansion of biofuels is to be pursued as a serious mitigation option on a large scale. On the policy front, short, medium and long term measures are recommended (Figure 4.29).
Figure 4.29: Measures to strengthen National Biofuel Policy 2009 2010 2011 2012 2013 2014 2015 2016 2017 2018 2019 2020 2021
Public Awareness
Collaborated decision making framework among the major players
Collaboration with Integrated Wasteland Development Programme
Collaboration with other public and private companies
Quality control on fuel blending
Labelling the feedstock plantation sites
Phasing out of subsidy on gasoline & diesel
Developing financing mechanisms
IV.E.2 Public awareness Public, the end consumers of fuel/ end users of the fuel and transportation, need to be aware of their role and the subsequent contribution to the overall GHG mitigation measures. Government policies which promote clean fuels and mandatory ethanol and biofuel blends need to incorporate public awareness component. The promulgation of the policies at different levels such as fuelling stations, vehicle owners, public transportation users and the associated benefits in terms of finances and environment has a potential to bring positive changes. The past policies, both which worked and those
Center for Clean Air Policy page 136
did not work, have shown that positive public participation is crucial for the success of the policies. In fact, government should make the public awareness and propagation of the policies an integral part of policy or regulation enforcement. In most of the cases, the public is not fully aware of the new policies and their implications and hence there exists a gap between the targets set by policies and the actual achievements. The public awareness can be a short term policy option implemented at the beginning of the policy enactment.
IV.E.3 Collaborated decision making framework among the major players
For successful implementation of biofuel in transportation, it is indispensable to have collaboration among different ministries and departments. Existing National Biofuel Policy is not under the jurisdiction of one ministry. Only spreading the jurisdiction among several ministries is not enough. Each of these ministries or departments needs to have clear mandate and protocol to follow. In the absence of this collaboration currently there is a fragmented decision framework. This fragmented decision making framework results in road blocks to implementation of the policy. Each responsible authority should have well defined tasks and demarcated targets and be made accountable to meet those targets. The infrastructure like road, highways, parking facilities, fuelling stations, public transport network system are crucial to ensure that the envisaged emissions reductions are attained. These are not directly affecting factors but they play very important role in optimizing the output of these policies. Apart from planning and regulatory bodies in the government, there are implementing and monitoring authorities in the government as well as non-government sectors. The planning, financing, implementing, monitoring, and evaluating bodies need to coordinate to avoid overlap and waste of budget but direct all the resources for better and more effective implementation of the policy.
Collaboration in the decision making can take place at different levels. The major policy decisions including the budget allocations take place at the central and state levels. Certain policies like financial incentives, funds disbursement and collaborative actions between different implementing agencies can be coordinated at the local government levels. Irrespective of the level of collaboration for decision making, this administrative system should be spread throughout the country.
The main barrier to this policy option might be the political differences between the ministries and different levels at which the collaboration would be required. One of the reasons for the delay in implementation of National Mission on Biodiesel was the incoherence between the members of group of ministries who were responsible for drafting the policy. The incoherence occurs mainly on the issues related to which organization should be the main governing body of the policy. Hence, the parliament or the office of the Prime Minister needs to interfere and appoint the most relevant ministry as the nodal governing body with other ministries functioning as satellite ministries with clear roles and responsibilities.
IV.E.4 Collaboration with Integrated Wasteland Development Programme
Generally speaking, any degraded land which does not have life sustaining potential – be it flora or fauna can be categorized as a wasteland. The National Biofuel policy has mentioned that it will encourage plantations in the wasteland and Jatropha Curcas, which is considered the most suitable for biodiesel, can grow in unproductive lands. Government of India has Integrated Wasteland Development Programme (IWDP), which envisages the conversion of the wastelands into arable land through reforestation and cultivation support. It is a central government scheme which disburses funds to the state government.
To ensure that the emissions reductions are sustainable and have wide coverage, the sustainable
Center for Clean Air Policy page 137
production, extraction and distribution of the biofuel is very important. Government is planning to plant Jatropha in the wastelands under the poverty alleviation programmes that deal with land improvements. Currently about 1.34 million hectares of wastelands have been identified where Jatropha could be planted. Several ventures including those by private companies such as Reliance & D1 Oils; public sector undertakings such as Hindustan Petroleum, Indian Railways, Indian Oil Corporation and state governments such as Andhra Pradesh, Chhattisgarh, Haryana and Rajasthan are prominent. Most of the Jatropha plantations have been in the procured land. Since, Jatropha does not require fertile and irrigated land, the plantations in the procured agricultural land should be discouraged by the regulatory framework. National Biofuel Mission as well as IWDP have designated budget. In order to ensure that the biofuel plantations are done in the wastelands and avoid unintended consequences, the National Biofuel Policy should collaborate with Integrated Wasteland Development Programme and State governments. For example, the state government of Uttar Pradesh has developed a plan to convert wastelands across the state into bio-diesel farms by cultivating Jatropha on over 40% of the total wasteland in the state. Collaboration with the IWDP will not only ensure the cultivation in the wastelands but also will help to expand the geographical coverage of Jatropha plantations utilizing the joint funds. The percentage of funds from National Biofuel Policy and IWDP can be decided on the basis of their respective total allocated budgets.
The main barriers to this policy option are the absence of sophisticated wasteland inventory, land titles to the wasteland and consonance between the implementing and funding agencies. Government of India keeps a record of wasteland inventory. However, the inventory is not updated and largely depends on the definition of wasteland used in each state.
The issues related to the land titles to these wastelands (wasteland constitutes approximately 17.45% of the total land) need to be sorted out. Disputed land titles will cause delays towards the land procurement for Jatropha plantations. Additionally, the disputed or non-existent titles and clear boundaries of forest land can create unintended consequences such as deforestation. If biofuel plantation entails deforestation, the emissions reductions envisaged will not be attained. Hence, it becomes very important for the government to define coherent definition of wasteland, update the land use and land use change data and keep records of land acquisition and land title.
IV.E.5 Collaboration with other public and private companies
Private companies have huge role to play in the promotion of sustainable biofuels. Cashing on the existing tax incentives on biodiesel, big players in Indian petroleum sector – Indian Oil and Bharat Petroleum have already started procuring land and bringing land under Jatropha plantations. The government, at central as well as state and local levels should collaborate with the PSUs and the private companies in development of biofuel development. The collaboration can be at various stages of biofuel development – land procurement, treatment of wasteland, Jatropha plantations, biofuel extraction, research and development and awareness campaigns. As indicated earlier, biofuel plantation and extraction process is still foreign to India. Among others, combined efforts also mean combined financing from all the interested parties. Hence, combined efforts will be more output driven and implemented faster.
The main barrier to this policy option might be inclusion of private sector as one of the stakeholders and conflict of interests among the public and private sectors. Rarely do the regulatory, implementing and regulated bodies have coherence.
Center for Clean Air Policy page 138
IV.E.6 Quality control on fuel blending
Biofuel has to be blended properly and be devoid of any adulteration. The engines which are retrofitted for higher blends of biofuel have known to emit more if gasoline or diesel is used instead of biofuels owing to the knocking effect. Hence, quality control of the fuel becomes very crucial in order to ensure the optimal emissions reduction by using biofuels. Central Pollution Control Board (CPCB) has mandated auto fuel standards for gasoline and diesel. The ethanol and biodiesel quality and blending should also be brought under the purview of auto fuel standards. Until the quality control is mandated, implementation and assurance of envisaged emissions reduction will have performance barriers. The fuelling stations should distribute only certified fuel blends. Government should demand that the fuelling stations have a dedicated pump for each category of blend such as 5% ethanol blend, 10% ethanol blend and so on for quality control purposes.
Plant, storage facility and transportation system needs to be embedded into the policy. The infrastructure, both physical and administrative, should be integral part of the biofuel development policy. Without efficient supporting infrastructure, the mandatory blend will be lame. Creating demand alone will not ensure smooth implementation of policy. Currently, CPCB does not have facilities to test the biofuel blends because auto fuel standards covers only petrol and diesel. In order to expand the auto fuel standards, CPCB or any other regulatory agency will need to improve their laboratory conditions and train the human resources to undertake the tests. Government will have to appoint an accredited agency to certify the fuel blend and the quality of biofuel. Absence of required infrastructure and trained human resources to execute quality control will pose to be the biggest barrier towards implementation of this policy option.
IV.E.7 Labelling the feedstock plantation sites
National Biofuel Policy has a provision that the biofuel feedstock used as transportation fuel will be limited to non edible oil seeds. So far most of the ethanol in India is extracted from sugarcane molasses. Price dynamics between sugarcane molasses and ethanol could shift the farmers’ interest from supplying the sugarcane to sugar mills to the biofuel plants. This shift might be triggered with the increase in ethanol demand to meet the 10% blend requirement. Hence there are chances that pressure be exerted on the sugarcane growers and sugar/distillery manufacturers in the quest to develop biofuels.
Making provision to use only non edible oil seeds for biofuel extraction does not rule out the threat to other ethanol sources like sugarcane. Depending on sugarcane molasses to meet biofuel demand has a risk of jeopardizing sugar and distillery industry. Also, this could potentially exert pressure on the agricultural land where cane is cultivated. To avoid unintended consequences in the sugarcane production, the government should make additional effort to label the feedstock plantation sites and make a provision for non-oil seed biofuel feedstock. All non-oil feedstock should have a quota that the producers can supply for biofuel extraction. Government has to decide on the quota on the basis of feedstock production and requirement for the primary industry / sector.
Creating and maintaining a database of the cash crop plantation sites and allocating quota might be difficult to achieve in short duration. Landuse pattern and crop yield trend also needs to be established. This is another evident barrier to the recommended policy option. However, the government can control the price dynamics in each sector. If government could subsidize the feedstock costs and maintain the price slightly lower than what the primary industry or sector would have paid, then the farmers would not have incentive to exhaust the soil resources and channelize the feedstock to biofuel plants.

Center for Clean Air Policy page 139
IV.E.8 Phasing out of subsidy on gasoline and diesel
Biofuel Policy mentions tax incentives for biodiesel. Affirmative action towards biodiesel promotion alone will not be enough to incentivize farmers and manufacturers. Indian government provides oil bonds to three major oil companies and bears huge loss. Biofuel Policy should be able to add subsidy to the cleaner fuel at the expense of reduced subsidy for conventional fuels.
Gradual phasing out of the subsidy and transferring the proportionate amount of the subsidies to biofuel promotion will function as a double-edged sword. By lifting the subsidy in the gasoline the government will generate funds to support biofuel subsidies. Also, it will help to shift the ownership and ridership from conventional fuel operated vehicles to biofuel operated ones.
Amidst political rife related to fuel price, supply and distribution, lifting existing subsidy will be a huge political challenge. Until and unless there is an alternative arrangement, mere lifting of subsidy might be very difficult.
IV.E.9 Developing financing mechanisms for plantation and extraction
The average price of Jatropha seeds is INR 6 per kg. Jatropha needs to be promoted as a cash crop and should not be interspersed with other regular plants to optimize the yield. Biofuel blending will help to reduce the amount of petro-based fuel imported into the country. Financing mechanism needs to be developed to ensure that the savings from the oil import is dedicated for biofuel plantation, extraction, production and other associated costs. Investment cost to set up a 1000 LPD plant is estimated to be approximately INR 14 million114.
The existing budget at the central level and at state level (for some states) needs to be reinforced with other revolving financing mechanisms to promote Jatropha plantations, extraction and R&D activities. One of the financing mechanisms could be carbon markets. The Jatropha plantation and extraction activities could be developed either as a carbon market project or voluntary emissions reduction (VER) project.
Another financing mechanism could be through financing institutions. Several financing institutions have started showing interest in renewable energy sources and cleaner fuel generation. For example, Export Import Bank of India (EXIM Bank) has announced Euros 150 millions to support projects contributing to climate change mitigation. Similarly, other national and private financial institutions started financing climate change mitigation projects.
Financing through ODAs and other funding agencies is tried and tested financing mechanism. Existing ODAs and other multi lateral/ multi party funds needs to be strengthened by making these funding more sustainable in the biofuel sector. Governments at various levels need to have a bi/ multi lateral agreements with the funding agencies to support the R&D activities, micro finance the small entrepreneurs and developers and help in establishing the biofuel extraction, refining and blending units.
Many emerging economies, especially in the Latin America and South East Asia, are aggressively promoting biofuel production. Bi or multi-lateral cooperation among the biofuel producing countries for technology could work towards mutual benefit.
The major barriers to establishing financing mechanisms for biofuels are absence of mandatory use of biofuels in the vehicles, uncertainties in the biofuel plant yield, incentives to domestic financiers and
114 http://www.i-sis.org.uk/JatrophaBiodieselIndia.php
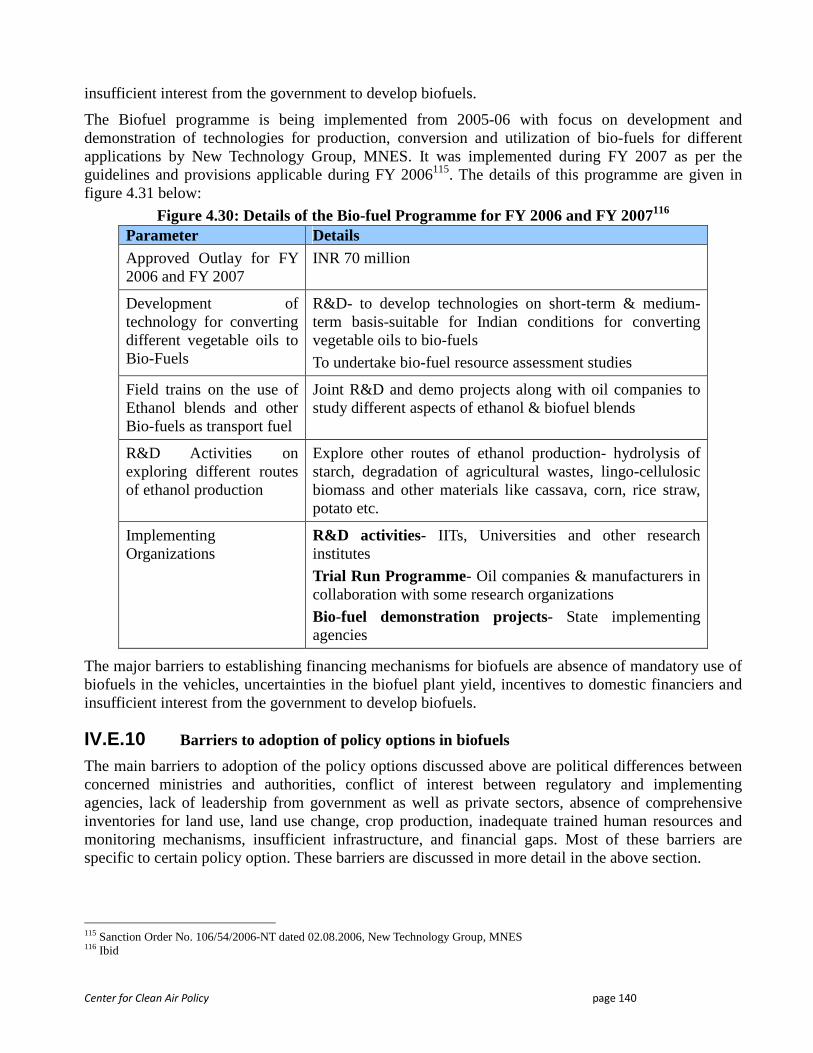
Center for Clean Air Policy page 140
insufficient interest from the government to develop biofuels.
The Biofuel programme is being implemented from 2005-06 with focus on development and demonstration of technologies for production, conversion and utilization of bio-fuels for different applications by New Technology Group, MNES. It was implemented during FY 2007 as per the guidelines and provisions applicable during FY 2006115. The details of this programme are given in figure 4.31 below:
Figure 4.30: Details of the Bio-fuel Programme for FY 2006 and FY 2007116
The major barriers to establishing financing mechanisms for biofuels are absence of mandatory use of biofuels in the vehicles, uncertainties in the biofuel plant yield, incentives to domestic financiers and insufficient interest from the government to develop biofuels.
IV.E.10 Barriers to adoption of policy options in biofuels
The main barriers to adoption of the policy options discussed above are political differences between concerned ministries and authorities, conflict of interest between regulatory and implementing agencies, lack of leadership from government as well as private sectors, absence of comprehensive inventories for land use, land use change, crop production, inadequate trained human resources and monitoring mechanisms, insufficient infrastructure, and financial gaps. Most of these barriers are specific to certain policy option. These barriers are discussed in more detail in the above section.
115 Sanction Order No. 106/54/2006-NT dated 02.08.2006, New Technology Group, MNES 116 Ibid
Parameter Details Approved Outlay for FY 2006 and FY 2007
INR 70 million
Development of technology for converting different vegetable oils to Bio-Fuels
R&D- to develop technologies on short-term & medium-term basis-suitable for Indian conditions for converting vegetable oils to bio-fuels
To undertake bio-fuel resource assessment studies
Field trains on the use of Ethanol blends and other Bio-fuels as transport fuel
Joint R&D and demo projects along with oil companies to study different aspects of ethanol & biofuel blends
R&D Activities on exploring different routes of ethanol production
Explore other routes of ethanol production- hydrolysis of starch, degradation of agricultural wastes, lingo-cellulosic biomass and other materials like cassava, corn, rice straw, potato etc.
Implementing Organizations
R&D activities- IITs, Universities and other research institutes
Trial Run Programme- Oil companies & manufacturers in collaboration with some research organizations
Bio-fuel demonstration projects- State implementing agencies
Center for Clean Air Policy page 141
IV.F Mitigation Option: Integrating Electric Vehicles in Urban Transportation
IV.F.1 Electric Vehicles Background
Urban transportation in India is dominated by fossil fuel operated vehicles – both road and railways. Alternative fuel operated vehicles have penetrated the Indian transportation system but is limited to certain cities, states or modes of transportation. Among all forms of alternative fuels experimented on the Indian roads and railways, electricity has the smallest share – only 37% in railways and negligible share in road. Electric vehicles generally refer to two categories – hybrid vehicles and battery operated vehicles. Hybrid vehicles have considerably higher penetration globally due to flexibility of using either petro-fuel or electric power to run the vehicles. Battery operated vehicles (BOVs) have higher potential to reduce the emissions (up to 100%) depending upon the efficiency and electricity generation source. BOVs and Zero emission vehicles (ZEVs) are used interchangeably because BOVs do not have tailpipe emissions and run on the batteries of different capacities. However, BOVs are not necessarily ZEVs. A BOV should be considered a true ZEV only when the source of electricity used to charge the batteries is renewable.
In the Indian context, there are domestic manufacturers of electric vehicles like Reva and Bajaj Auto. These manufacturers have taken initiatives to come up with different models and capacities of electric vehicles. Reva has developed prototype passenger cars and Bajaj Auto has three wheelers. Though Reva claims to have exported these models, there is negligible presence in the Indian market.
Indian railways have progressed comparatively better and faster in replacing fossil fuel with electricity for traction purposes. Railways have achieved 25% of the total route kilometres (RKM) electrified and are envisioning to electrify another 7000 RKM during the 11th Five Year Plan (FYP).
IV.F.2 Mitigation Option Methodology for Electric Vehicles
Integration of electric vehicles into the public transportation fleet will help achieve huge emissions reductions. Higher emissions reduction targets could be met through phase-wise replacement of the polluting vehicles with minimally polluting electric vehicles. The replacement of the existing fleet of publicly owned and privately owned public transportation could be a very ambitious plan. Hence, disaggregation of the electric vehicles development into short, medium and long term mitigation strategies would be more practical and doable.
The mitigation measures and policy options for the electric vehicles has been done on the basis of different success models such as congestion fees in Stockholm and soft loans for electric three wheelers in Nepal. The policy options discussed in this section are divided into short, medium and long term depending upon the complexity and achievability. The policy option discussion analyzes the existing schemes and builds upon the gaps in these schemes and includes the policies i successfully implemented elsewhere. These are the policy options recommended to be implemented so towards the end of the section, potential barriers to adopt these policy options are discussed.
Amount of emissions reductions achieved from the modal shift to electric vehicles from the conventional ones is difficult to quantify. It is so because the emissions reductions are the function of quantity of EVs used, type of electricity generation source and the grid emission factor. At the level of an end user, the calculation of emissions reductions will require lot of assumptions and a model to assess the assumptions. Hence, this section does not analyze the emissions reductions.
Center for Clean Air Policy page 142
Short term mitigation options
Pilot projects could be run to replace publicly owned public transportation like buses and railways. The city owned or state owned bus fleet could include 5% of the total fleet in the first phase. The first phase can have a mixture of hybrid engines and battery operated engines for comparison. This will require engine retrofit in the existing buses or manufacture of buses with hybrid or battery operated engines.
Already existing Reva cars and Ecorick three wheelers need to be penetrated more aggressively. This integration will not require any additional technology as both these models have proven and tested domestic technologies. According to Bajaj Auto, the Ecoricks were INR 35,000 more than the conventional petrol-three wheelers in 2005. Though upfront costs were higher, per kilometre operational costs were proven to be 3 to 4 times less than that for the petrol-three wheelers. Both Reva and Ecorick are battery operated vehicles.
Ecorick runs on 12 volt lead acid cell battery which can be charged in the household electric circuit. Reva uses 9 units to charge the battery completely. One set of completely charged battery can run approximately 80 km in the city conditions. Operation and maintenance cost is also comparatively lower than petrol cars. According to Reva cars, the operation cost per unit kilometre is approximately 50 paisa117, which is almost 10 times lower than petrol cars.
Few years ago there was a wave of introducing electric vehicle into the Indian urban transportation. Mahindra and Mahindra was yet another upcoming player in this market. However, the wave was subdued and manufacturing processes were halted.
Revival of the manufacturing and penetration of the electric vehicles into the public and private transportation will help to attain short term GHG emissions reduction objectives. As a pilot run, the government vehicles, foreign mission vehicles, services vehicles could adopt the electric vehicles in their fleet. Technology and equipment are available so practically it will not have substantial financial and technical barriers to revive the subdued initiations.
Medium Term Mitigation Option
The inclusion of electric vehicles into the public and private transportation system can be done in phases.
Phase 1: Procurement of electric vehicles instead of petrol vehicles for inner-city use passenger and goods carriers in the government offices, international organizations, business houses. This penetration will not require financial incentives like tax breaks and subsidies.
In the same phase, the construction of pilot charging stations and mechanism to pay for charging batteries or replacing the discharged batteries with charged ones needs to be figured out.
Phase 2: Further R&D to achieve higher battery efficiency, higher carrying capacity and better speed is important to ensure that higher emissions reductions could be achieved.
Use of electric trams, electrified railways, and metro system should be encouraged. There is very limited utilization of electric modes of transportation in India. Railway (covering 25% of total railway network) is the largest electrified mode of transportation followed by metro systems in Delhi and 117 1 INR = 100 paisa
Center for Clean Air Policy page 143
Kolkata. There are expansion plans for Delhi metro making it more integrated with other road networks.
IV.F.3 Mitigation Option Results from Electric Vehicles The mitigation options discussed above are envisaged to increase the interest of the potential private vehicle owners, entrepreneurs who are planning to invest in vehicle manufacturing towards electric vehicles. The shortcomings of the electric vehicles for long distance, higher speed, charging requirement and load capacity are afloat. The mitigation options discussed above address these shortcomings as well as the past failures and identify the potential leaders at the supply and demand side. Since this analysis is at the demand side of the value chain with many players and parameters affecting the emissions reduction and that it was not based on any models, the mitigation options discussion does not provide emissions reduction results. However, it does not rule out the probability that the government and the private sector will revive the subdued sector. Though there will not be huge reductions in the national GHG emissions, there will be relief from the vehicular emissions in the cities where the problem is very stark.
Center for Clean Air Policy page 144
IV.F.4 Adoption Barriers to Mitigation Options from Electr ic Vehicles
The barriers associated with the short-term mitigation measure through electric vehicles are primarily public awareness creation. Public needs to be made aware of the advantages of electric vehicles and remove the stereotypes about the electric vehicles. Electric vehicles are thought to have low mileage, low speed and low capacity as compared to petrol vehicles. However, both Reva and Ecorick have gone through the approval tests which have proved otherwise.
1. Limited Distance: For the short term penetration of the electric vehicles, charging the vehicles is the biggest barrier. It might not be as much of a barrier for private electric vehicles as for the public ones because a fully charged vehicle can run for 80 km, which would not pose much problem within the city limits. However, the public vehicles weight and distance both become limitations.
2. Limited Weight: The electric vehicles, with the existing technology, are not fit for carrying heavy load. The carrying capacity of the existing batteries, which are essentially lead-acid batteries, is low.
3. Limited Emission Reductions: One of the biggest problems in promoting a type of transport often espoused by environmentalists may be its limited impact on emissions, because India gets about 70% of its power from dirty coal. According to McKinsey study an electric car would have 19 percent less emissions than a conventional gasoline powered vehicle over its lifetime, but a full hybrid vehicle, running on gasoline with a high-tech engine and a battery to power acceleration, can make a 56 percent cut.
4. Charging Stations: The strategic locations, distance between the charging stations, charging capacity and the battery storage capacity of the charging stations are crucial for electric vehicle penetration. Establishment of proper network of charging stations has financial as well as technical barriers. The charging stations need to have heavy duty transformers and charging mechanism to support optimal number of electric vehicles.
5. High Costs: The electric vehicles are more expensive than the conventional vehicles because of the battery and specialized engine motor. The cost incurred towards research and development and retrofit are internalized into the vehicle cost. There are certain financial incentives for the manufacturers of electric vehicles but no substantial financial or tax incentives. The potential vehicle buyers do not have incentives, apart from Delhi, where the buyers get subsidy through Air Ambience Fund. Depicting just environmental benefits is not attractive enough reason for common car buyers who look for higher mileage, marked down prices, operational cost and payback period. Exorbitantly priced hybrid vehicles are still far from reach for a commoner. Honda Civic introduced the first ever hybrid in India with a price tag five times an ordinary locally manufactured car.
6. Lack of Supply of Batteries: The running cost of battery-operated electric vehicles is lower than the conventional fuel vehicles but the repair and maintenance costs are higher. The batteries are not readily available and priced high. Thus, the overall operational cost of battery operated vehicles under current circumstances is higher and unattractive.
7. Lack of Institutional Support: Most of the developments attained in the electric vehicle sector can be credited to the private sector. There seems to be lack of initiation and interest from government sector towards development of electric vehicles. Though Ministry of New and Renewable Energy has been working on R&D of battery-operated vehicles for almost two decades,
Center for Clean Air Policy page 145
There is very limited institutional support, inter alia, policy, R&D, financial, technical, support from the central government. There are few commendable efforts at the state or city level. For instance, Delhi government has agreed to take 30% of the total cost of an electric vehicle. However, this kind of institutional support is not available in many other states.
8. Competition with Conventional Public Vehicles: The electric vehicles as public transportation will have a big barrier competing with conventional vehicles mainly due to the higher operational costs and lower carrying capacity. For fixed route public transportation, charging batteries might not be as big a barrier as for the customer tailored public transportation like auto rickshaws.
IV.G Policy Options: Electric Vehicles
India does not have a policy dedicated for electric vehicles. The first part of this section discusses about the various existing schemes and incentives that the government has in place to support the electric vehicle promotion. The second part of the sections recommends policy options which are envisaged to contribute to strengthening and promotion of electric vehicles.
IV.G.1 Analysis of Existing Schemes and Incentives
Transportation, Environment and Energy related policies mention about the budget allocation, promotion and subsidies for electric vehicles. Indian government started promoting the electric vehicles in 1997. However, the schemes developed for electric vehicles were ceased the following year. The scheme had provided subsidy of INR. 170,000 towards EV purchase. This subsidy had limitations. The subsidy was applicable for chosen consumers - government departments, public sector undertakings, educational institutions, hospitals, tourism and archaeological sites. Though some state and city level policies exist, these policies do not have wide geographic and technical coverage to actually promulgate use of electric vehicles as a significant share of urban transportation. For instance, Green Chandigarh campaign provides 15% subsidy for electric vehicles and Delhi government has set up Air Ambience Fund created from the environment cess of 25 paisa (INR 0.25) for every litre of diesel sold in Delhi region. There are tax incentives for electric vehicles, with special emphasis on domestically manufactured Reva cars, in Bangalore. Electric vehicles are exempt from sales tax and road tax in Karnataka, Andhra Pradesh, Rajasthan, Goa and Pondicherry whereas Delhi exempts sales tax and West Bengal exempts road tax for the EVs.
On the other hand, metro system and electrified railway system, though belong to electric vehicles, are not directly governed by any of these schemes. The main players of the Delhi metro system are Ministry of Urban Development, Delhi Development Authority (DDA), Central Government (GoI) and State Government. The funds are made available to the DMRC (Delhi Metro Rail Corporation) as pass through assistance, which is included in the budgetary resources of the Ministry of Urban Development and Poverty Alleviation. The project is scheduled for completion in March, 2006. During the Annual Plan, 2003-04, INR.6.8 billion was kept as pass through assistance against which a provisional expenditure of INR 1,4.30 billion has been reported by the Ministry. During 2003-04, INR 1.9 billion has been given to DMRC as equity support. For the Annual Plan 2004-05, the pass through assistance from Japan Bank for International Cooperation has been kept at INR.2.8 billions and provisions of INR 2 billion have been made towards equity to DMRC.
Ministry of New and Renewable Energy (MNRE) has developed a scheme for Battery Operated Vehicles (BOVs) in 2006. This scheme focuses on the promotion of indigenous electric vehicles and gives different amount of subsidy depending on type of BOV. The total amount of subsidy for fiscal year 2006 was INR. 50million. MNRE is implementing R&D projects on development of advanced
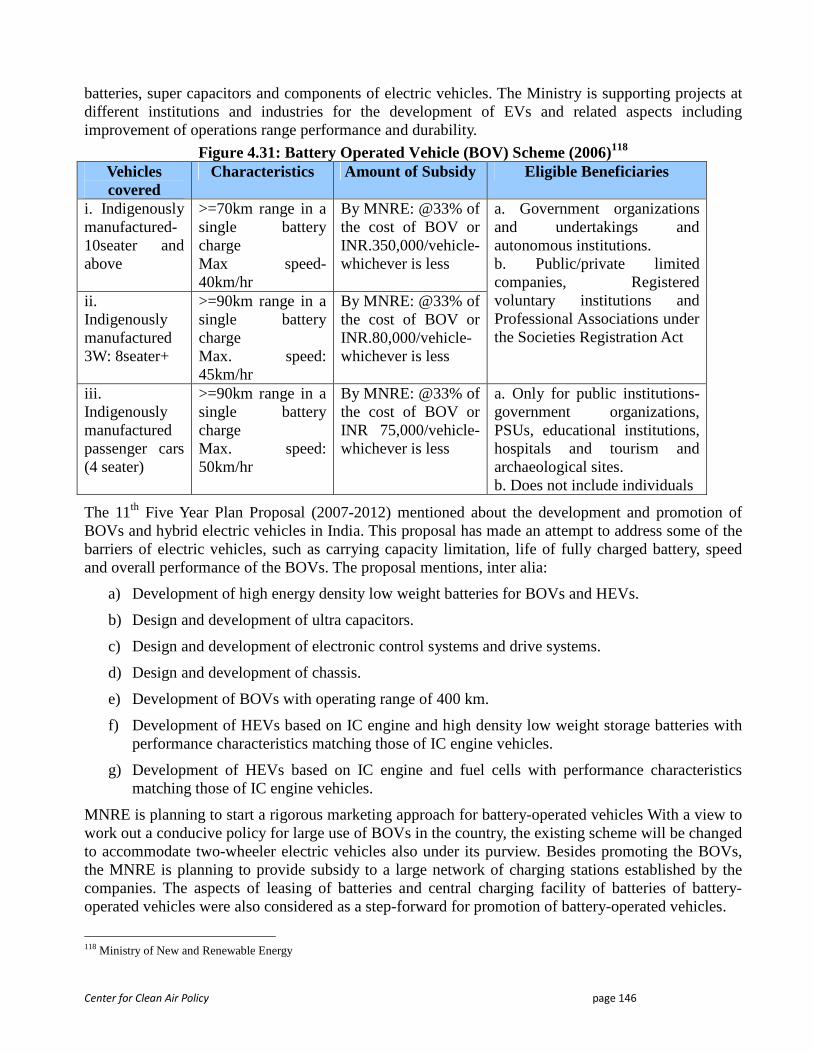
Center for Clean Air Policy page 146
batteries, super capacitors and components of electric vehicles. The Ministry is supporting projects at different institutions and industries for the development of EVs and related aspects including improvement of operations range performance and durability.
Figure 4.31: Battery Operated Vehicle (BOV) Scheme (2006)118 Vehicles covered
Characteristics Amount of Subsidy Eligible Beneficiaries
i. Indigenously manufactured- 10seater and above
>=70km range in a single battery charge Max speed- 40km/hr
By MNRE: @33% of the cost of BOV or INR.350,000/vehicle- whichever is less
ii. Indigenously manufactured 3W: 8seater+
>=90km range in a single battery charge Max. speed: 45km/hr
By MNRE: @33% of the cost of BOV or INR.80,000/vehicle- whichever is less
a. Government organizations and undertakings and autonomous institutions. b. Public/private limited companies, Registered voluntary institutions and Professional Associations under the Societies Registration Act
iii. Indigenously manufactured passenger cars (4 seater)
>=90km range in a single battery charge Max. speed: 50km/hr
By MNRE: @33% of the cost of BOV or INR 75,000/vehicle- whichever is less
a. Only for public institutions- government organizations, PSUs, educational institutions, hospitals and tourism and archaeological sites. b. Does not include individuals
The 11th Five Year Plan Proposal (2007-2012) mentioned about the development and promotion of BOVs and hybrid electric vehicles in India. This proposal has made an attempt to address some of the barriers of electric vehicles, such as carrying capacity limitation, life of fully charged battery, speed and overall performance of the BOVs. The proposal mentions, inter alia:
a) Development of high energy density low weight batteries for BOVs and HEVs.
b) Design and development of ultra capacitors.
c) Design and development of electronic control systems and drive systems.
d) Design and development of chassis.
e) Development of BOVs with operating range of 400 km.
f) Development of HEVs based on IC engine and high density low weight storage batteries with performance characteristics matching those of IC engine vehicles.
g) Development of HEVs based on IC engine and fuel cells with performance characteristics matching those of IC engine vehicles.
MNRE is planning to start a rigorous marketing approach for battery-operated vehicles With a view to work out a conducive policy for large use of BOVs in the country, the existing scheme will be changed to accommodate two-wheeler electric vehicles also under its purview. Besides promoting the BOVs, the MNRE is planning to provide subsidy to a large network of charging stations established by the companies. The aspects of leasing of batteries and central charging facility of batteries of battery-operated vehicles were also considered as a step-forward for promotion of battery-operated vehicles.
118 Ministry of New and Renewable Energy
Center for Clean Air Policy page 147
Initiatives of Local Governments: a. Delhi government has announced a 29.5 per cent discount for the small electric car–Reva. b. “Air Ambience Fund” created by the Delhi government- funds collected from environment fee on
sale of diesel @ 25p/litre. Part of funds to be used for covering the subsidies/discounts given on EVs.
1. Responsible departments: Delhi Pollution Control Committee for disbursement/allocation of funds
2. Finance Dept.: For setting up of the fund and collecting the tax c. Purchaser of battery-operated vehicles will get 15 percent subsidy on the base price of the
vehicle, a value added tax (VAT) refund of 12.5 percent and a 2 percent concession on road tax and registration expenses. In total these incentives has cut the price of Reva by a lakh rupees.
d. Chandigarh has offered a subsidy of 15 per cent on battery-operated vehicles. e. Bangalore has taken the lead to give 4 per cent VAT waiver for the initial five years after the
launch of the car and on registration costs.
According to the sources119, about 130,000 electric vehicles were sold in the Indian market in the fiscal year 2008 against 98 million petrol and diesel vehicles during the same period. The electric vehicle industry was mainly driven by the electric two-wheelers, which formed bulk of the total sales. However, very little is said for the promotion of two-wheeler electric vehicles. Most of the schemes and incentives are directed towards the four wheeler electric vehicles. Since large portion of the potential buyers would go for two-wheelers, which are currently being imported from China, there should be more affirmative policies for indigenous electric two-wheelers. Most of the electric two-wheelers or e-bikes as they are popularly known are manufactured by smaller players in the market. Thus, the affirmative policy support and funding becomes more significant.
End-consumers are major beneficiaries of the existing schemes related to promotion of electric vehicles. These schemes and financial incentives fail to give substantial focus to other significant sectors of electric vehicle like manufacturing, infrastructure, distribution and maintenance. There is very little emphasis on the continued research and development of the efficient batteries and engine, speed and carrying capacity. The existing policies might work towards popularizing electric vehicles among the users by giving attractive subsidies. For example, the Delhi government pro-EV policy provisions a purchaser of battery-operated vehicles a 15 percent subsidy on the base price of the vehicle, a value added tax (VAT) refund of 12.5 percent and a 2 percent concession on road tax and registration expenses120. The total subsidy and concession for a Reva car comes around to be INR. 100,000 (about 25% of the total tag price). The manufacturers, distributors and charging station owners/managers are not given due incentives and facilities. In order to substantiate the existing schemes incentives should be distributed proportionately across each section of the electric vehicles.
Figure 4.32: Measures to strengthen Electric Vehicle Schemes
119 http://economictimes.indiatimes.com/News/News_By_Industry/Auto/Duty_waiver_to_bring_down_prices_of_electric_bikes/articleshow/2996864.cms 120 Fact Sheet: New Developments on electric vehicles in India http://www.cseindia.org/campaign/apc/pdf/electric_drive.pdf
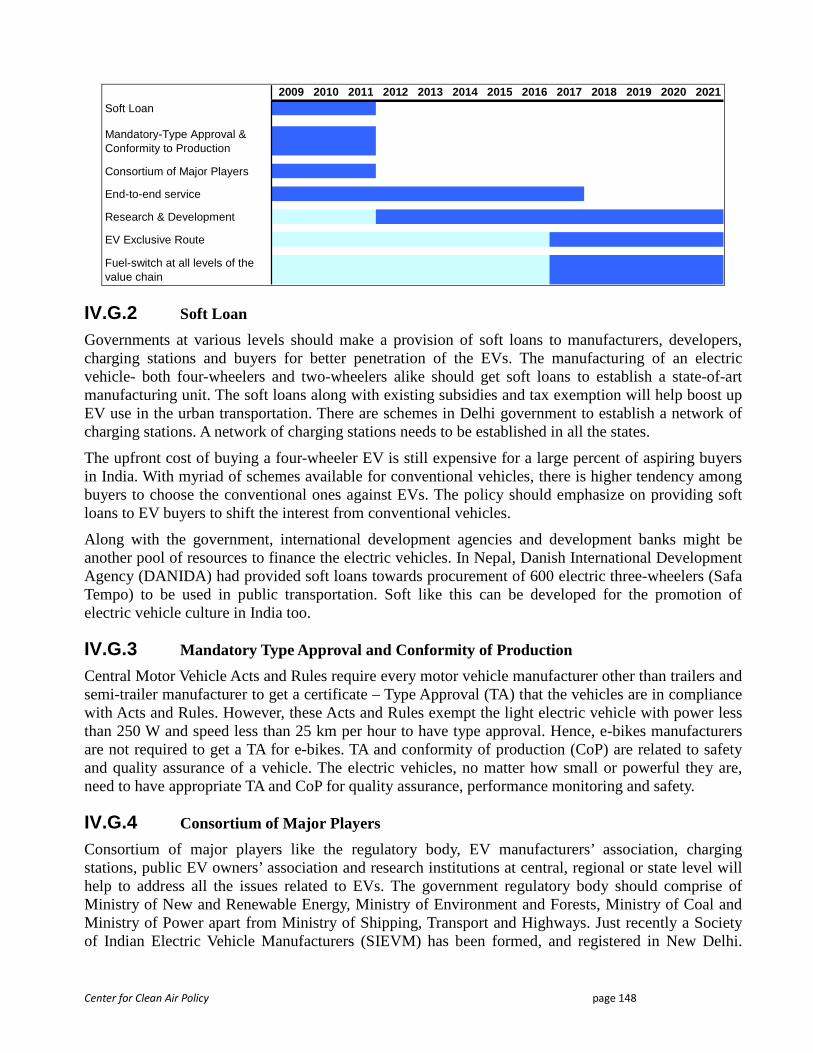
Center for Clean Air Policy page 148
2009 2010 2011 2012 2013 2014 2015 2016 2017 2018 2019 2020 2021Soft Loan
Mandatory-Type Approval & Conformity to Production
Consortium of Major Players
End-to-end service
Research & Development
EV Exclusive Route
Fuel-switch at all levels of the value chain
IV.G.2 Soft Loan
Governments at various levels should make a provision of soft loans to manufacturers, developers, charging stations and buyers for better penetration of the EVs. The manufacturing of an electric vehicle- both four-wheelers and two-wheelers alike should get soft loans to establish a state-of-art manufacturing unit. The soft loans along with existing subsidies and tax exemption will help boost up EV use in the urban transportation. There are schemes in Delhi government to establish a network of charging stations. A network of charging stations needs to be established in all the states.
The upfront cost of buying a four-wheeler EV is still expensive for a large percent of aspiring buyers in India. With myriad of schemes available for conventional vehicles, there is higher tendency among buyers to choose the conventional ones against EVs. The policy should emphasize on providing soft loans to EV buyers to shift the interest from conventional vehicles.
Along with the government, international development agencies and development banks might be another pool of resources to finance the electric vehicles. In Nepal, Danish International Development Agency (DANIDA) had provided soft loans towards procurement of 600 electric three-wheelers (Safa Tempo) to be used in public transportation. Soft like this can be developed for the promotion of electric vehicle culture in India too.
IV.G.3 Mandatory Type Approval and Conformity of Production
Central Motor Vehicle Acts and Rules require every motor vehicle manufacturer other than trailers and semi-trailer manufacturer to get a certificate – Type Approval (TA) that the vehicles are in compliance with Acts and Rules. However, these Acts and Rules exempt the light electric vehicle with power less than 250 W and speed less than 25 km per hour to have type approval. Hence, e-bikes manufacturers are not required to get a TA for e-bikes. TA and conformity of production (CoP) are related to safety and quality assurance of a vehicle. The electric vehicles, no matter how small or powerful they are, need to have appropriate TA and CoP for quality assurance, performance monitoring and safety.
IV.G.4 Consortium of Major Players
Consortium of major players like the regulatory body, EV manufacturers’ association, charging stations, public EV owners’ association and research institutions at central, regional or state level will help to address all the issues related to EVs. The government regulatory body should comprise of Ministry of New and Renewable Energy, Ministry of Environment and Forests, Ministry of Coal and Ministry of Power apart from Ministry of Shipping, Transport and Highways. Just recently a Society of Indian Electric Vehicle Manufacturers (SIEVM) has been formed, and registered in New Delhi.
Center for Clean Air Policy page 149
SIEVM is composed of two wings: EV manufacturers121 and EV component manufacturers122. With development and growing interest in the EVs, more players might come along the way. However, it is important that the existing bodies coordinate to address the barriers in the existing schemes and make a policy dedicated to the electric vehicles.
IV.G.5 End-to-end service
End-to-end service and support includes support in procurement, flexible financing options, infrastructure support and proper disposal of the used batteries.
a) Financing of the EVs could be direct and indirect. Direct financing methods include soft loans, financing schemes and subsidies at the time of procurement. Indirect financing schemes such as tax break, free parking, toll free passes and congestion fee break (in the states and cities where congestion tax is under making) could function as substantial support. Government financing mechanisms could be like the Air Ambience Fund set up by Delhi government from the pollution tax collected from conventional fuel vehicles. In the absence of funds at disposal to finance the electric vehicle promotion, funds collected from pollution tax, congestion tax, and higher tolls for conventional vehicles. Most of the financing schemes are meant for end-consumers.
Financing should be for EV manufacturers and distributors as well. Exemption on import duty on spare parts for EV manufacturing, certain tax break to the manufacturers –EVs, EV batteries and chargers; financial support for technology transfer and making provision for copyright and patents for the designs and technology will stand as strong incentives for the suppliers and support-system of EVs.
b) The existing schemes have very limited mention about the life support system of the EVs – the charging stations. Financial incentives and technical support to establish high capacity charging station is very crucial, especially to promote EVs as public transport. Many cities in India do not have public transport system and paratransit system is minding the gap. If these cities are to be developed into exclusively EV cities, fully enabled charging stations become indispensable. Government policies must have provision for charging stations with independent transformers and subsidized tariff rates. In case of public EVs, the batteries can be charged during the night and off-peak hours when the tariff is lower. However, for the spot charging, the peak hour rates might apply. In order to make the operation of EVs cheaper and hence more attractive, the peak and off-peak hour tariff needs to be lowered.
c) Disposal of used EV battery and associated risk of lead and acid contamination of the land and water bodies and workers’ exposure in the “backyard” recycling units pose a significant amount of problem. The Battery Handling Rules of India require that 90% of the lead acid batteries be collected and disposed by the manufacturers. In reality, the collection rate is close to 20%123. The Battery Handling Rules should be empowered with the how to collect and dispose tools and also make a provision of high penalties like suspension of license to manufacture or suspension of tax incentives to meet the stipulated 90% collection and disposal target.
IV.G.6 Research and Development
Certain features of a battery like - life time, charging time, capacity and discharge time and 121 Hero Electric, Mahindra & Mahindra, Electrotherm, Avon Cycles, Lohia Auto, BSA Motors, Lectrix Motors, Paradise Electro, Shubh Arya Steel, Crazye Bikes, ACE, Sinic Motors, Genex Power and Kabir Dass Motor 122 Exide Industries, Freescale Semiconductors, Crompton Greaves, Axiom, Hinode Technology, Fiem Industries, Rotomag, NEC, and Texas Instruments 123 Fact Sheet: New Developments on electric vehicles in India, http://www.cseindia.org/campaign/apc/pdf/electric_drive.pdf
Center for Clean Air Policy page 150
mechanical features of an EV like – size proportions, material, weight and motor efficiency are the major limitations of the existing EVs. For higher performance and better popularity of EVs, these functional features need to be improved significantly. Most of the EVs today use lead-acid battery. Lithium ion batteries, which are used in cell phones and laptops, and nickel metal hydride batteries, which are used in the hybrid cars, have better performance but these batteries are still not economically viable. Additionally, the efficient charging mechanism is also important to ensure quick charging while maintaining high energy efficiency. The efficiency and life of battery depends a lot on the structure of the vehicle, its weight and the efficiency of regenerative brakes. These technical efficiency norms need to be integral part of national policies with substantial financial backing.
IV.G.7 EV exclusive route
As mentioned in the barrier section, a normal EV has speed and size barrier. These barriers could be turned around to become opportunities if the government could assign or dedicate EV exclusive routes (EVERs) or EV exclusive zones (EVEZs) for public transportation. The EVs will not have to compete with other conventional public transportation and thus will not be disadvantaged. There are non-motorized and electric vehicle zones in some parts of India such as Chadani Chowk in Old Delhi and Taj Mahal area in Agra. These places wanted to curb local air pollution problems. Since this zoning has already been tested and proven, the implementation of similar zoning for the promotion of EVs seems to be practical.
IV.G.8 Fuel-switch at all levels of the value chain
The NAPCC and the recent Indo-US Nuclear Deal have given hopes that the share of cleaner source of electricity generation will increase in the future. In order to avoid the argument of shifting urban missions to the generation sites and make the electric vehicles zero emission vehicles, government at all levels should make special provisions for EV charging. This argument holds especially strongly for India because of two reasons: a) about 70% of the total electricity generation mix is from coal and b) the power station efficiency in India is low efficiency – 50% higher than the world average.124Unlike in air pollution, shifting the emissions sources does not minimize the effect the way it works for pollution due to dilution of pollutants. Hence, to achieve real GHG emissions reductions, shift has to occur both at the upstream, midstream and downstream. In the case of electric vehicles, upstream would be electricity generation sites, midstream would be charging stations and distributors and downstream would be the end-consumers. The policy should have differentiated degree of EV integration into the urban transportation depending upon the availability of clean electricity generation and connectivity to clean electricity grid125.
IV.G.9 Barriers to adoption of policy options
These policy options are categorized to be short term, medium and long term depending upon the complexity and preparation time before they are ready for implementation. Since there is no dedicated policy for electric vehicles leaving certain central and local schemes and initiatives, adoption of these policy options will have barriers. This section will briefly discuss about the potential barriers towards adoption of the policy options discussed above.
124 Ibid 125 According to CSE, Reva car can actually achieve zero emissions against 63 gm of CO2 per kilometre if renewable energy is used from power stations in the UK.
Center for Clean Air Policy page 151
Insufficient capacity
Government tests the vehicles in a special lab for type approval and conformity of approval. The EVs are differently made and the parameters to be tested for type approval and conformity of approval will be different from conventional vehicles. The barriers will include identification of the parameters to be tested, lab to test the EVs and the trained human resources to execute these tests. Though these tests are seemingly easy and apparently require no special arrangement in addition to what already exists for conventional vehicles, the real implementation would not be as easy.
Similarly, government can not allocate designated lane and routes for the EVs. The experience with bus rapid transit shows that designated lane is capital intensive option to control vehicular emissions. This is mainly because most of the roads inside the cities are narrow and already are facing congestion problems. Hence, assigning dedicated lanes seems to be impossible within inner city boundaries without widening the roads. This is possible only in the highways and outer ring roads which have scope for widening.
One of the biggest issues entailed with EV operation is disposal of exhausted batteries. Government has to establish designated sites and work out a scheme for proper disposal of the batteries. Establishing a designated unit and executing proper disposal technique is not possible in the absence of sufficient funds and trained human resource.
Financing
Government does not have readily available budget for large scale soft loan, financing, and R&D activities to promote EVs. There are just schemes at central and state/city levels. However, none of these are significant. In order to be able to provide soft loans to manufacture, procure, distribute and establish charging station, government should have sufficient fund. Getting funds from donor agencies or other financing institutions will also require time and technical preparations.
Establishing environmental funds such as Air Ambience Fund will require the government to levy tax to the conventional vehicles. In the present time of recession, government might want to be careful before levying extra taxes on the citizens.
Similarly, government has big financial barrier to switch the electricity generation source from coal to cleaner forms like hydro, nuclear or implementation of IGCC and/or CCS in the existing power plants. Without the fuel switch or technology switch at the electricity supply end, just promoting EVs will not contribute substantially towards total GHG emissions reduction. It would be mere shifting of emissions from cities to the sources because with higher number of EVs there will be higher electricity supply requirement. Meeting the increased electricity demand due to EVs might be an issue in the given context of power shortage in many parts of the country. The international community can assist domestic penetration of electric vehicles and infrastructure by providing soft-loans and other financial assistance.
Political problem to lift existing subsidy or increase pollution tax
Lifting the existing subsidy from the conventional fuels, levying pollution tax in the places where it is not already implemented and increase the pollution taxes where it is already in place might have huge
Center for Clean Air Policy page 152
political and administrative barrier. Convincing different lobbies and unions to be deprived of the subsidies that the petrol and diesel are enjoying currently will be a big barrier. Until and unless government has alternative plan for the conventional fuels and international pressure to levy pollution or carbon tax, adoption of this policy might be challenging.
Monitoring of funds
Even if the government will be able to establish the funds, channelizing it to promotion of EVs will have challenges. If the funds collected from pollution tax and curtailing subsidies in conventional fuels will not be properly utilized for EVs, then continuation of the fund will become more challenging than implementing it.
Also, levying of pollution tax or environmental cess needs to be decided carefully. If the neighbouring state or city has lower pollution tax or environmental cess then there are huge chances of leakages and it will become difficult to monitor the emissions reductions as well as funds.
IV.H Transportation Sector Conclusion
The transportation sector has immense emission reduction potential which has hardly been exploited till now. Most of the emissions of this sector come from roadways and railways. Emissions from transportation are responsible for 14% of the world’s total GHG emissions, which make it imperative for this sector to explore and adopt cleaner energy alternatives. In this policy paper, in a roadmap to a cleaner transportation sector, increased use of biofuel and electric vehicles has been suggested as the two major mitigation options. There are certain policies and programmes in place in India which encourage use of cleaner technology in transport sector. However, there are certain barriers to adoption of these technologies and these policies already in existence are not sufficient to overcome these barriers. Therefore we suggest measures to strengthen these policies which if implemented would go a long way in encouraging the use of cleaner technology in India and thereby reducing emissions from transportation sector. Assistance from the international community would eliminate significant barriers in the transport sector; for example in biofuels, the import of high-efficiency feedstock conversion processes such as cellulosic technologies could greatly enhance the viability of biodiesel projects. For electric vehicles, financial assistance can help eliminate barriers such as investment in infrastructure.
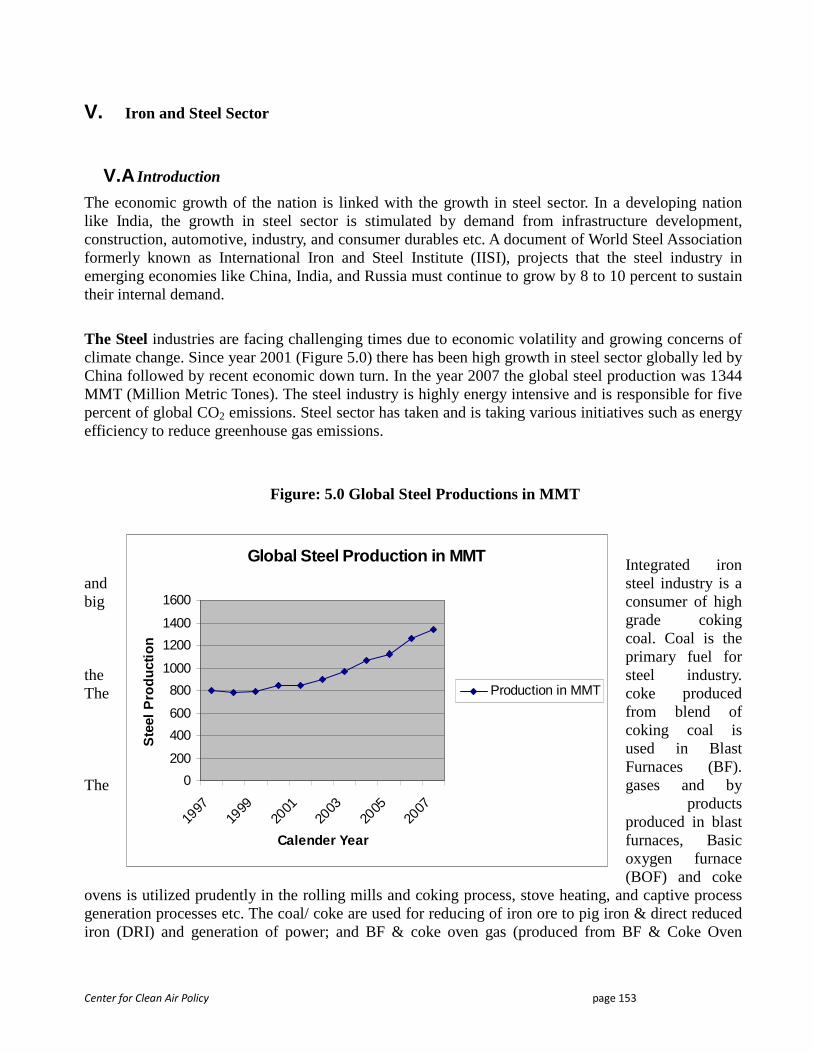
Center for Clean Air Policy page 153
V. Iron and Steel Sector
V.A Introduction
The economic growth of the nation is linked with the growth in steel sector. In a developing nation like India, the growth in steel sector is stimulated by demand from infrastructure development, construction, automotive, industry, and consumer durables etc. A document of World Steel Association formerly known as International Iron and Steel Institute (IISI), projects that the steel industry in emerging economies like China, India, and Russia must continue to grow by 8 to 10 percent to sustain their internal demand.
The Steel industries are facing challenging times due to economic volatility and growing concerns of climate change. Since year 2001 (Figure 5.0) there has been high growth in steel sector globally led by China followed by recent economic down turn. In the year 2007 the global steel production was 1344 MMT (Million Metric Tones). The steel industry is highly energy intensive and is responsible for five percent of global CO2 emissions. Steel sector has taken and is taking various initiatives such as energy efficiency to reduce greenhouse gas emissions.
Figure: 5.0 Global Steel Productions in MMT
Integrated iron and steel industry is a big consumer of high
grade coking coal. Coal is the primary fuel for
the steel industry. The coke produced
from blend of coking coal is used in Blast Furnaces (BF).
The gases and by products
produced in blast furnaces, Basic oxygen furnace (BOF) and coke
ovens is utilized prudently in the rolling mills and coking process, stove heating, and captive process generation processes etc. The coal/ coke are used for reducing of iron ore to pig iron & direct reduced iron (DRI) and generation of power; and BF & coke oven gas (produced from BF & Coke Oven
Global Steel Production in MMT
0
200
400
600
800
1000
1200
1400
1600
1997
1999
2001
2003
2005
2007
Calender Year
Ste
el P
rodu
ctio
n
Production in MMT
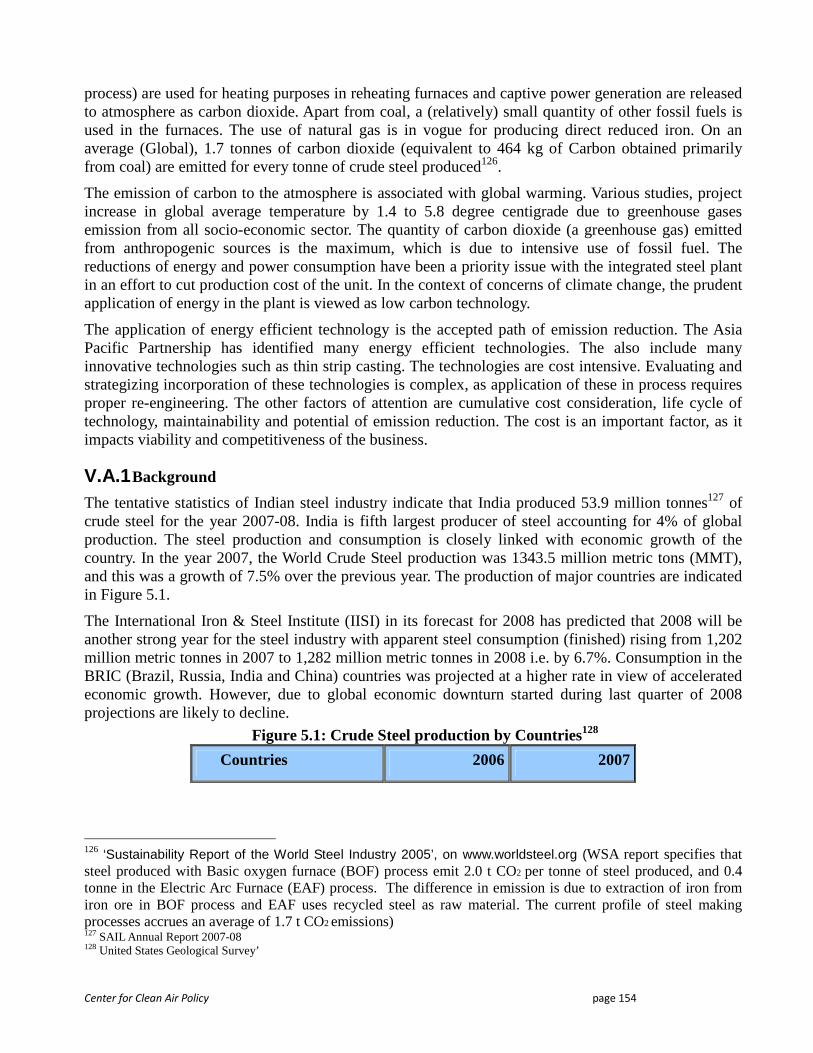
Center for Clean Air Policy page 154
process) are used for heating purposes in reheating furnaces and captive power generation are released to atmosphere as carbon dioxide. Apart from coal, a (relatively) small quantity of other fossil fuels is used in the furnaces. The use of natural gas is in vogue for producing direct reduced iron. On an average (Global), 1.7 tonnes of carbon dioxide (equivalent to 464 kg of Carbon obtained primarily from coal) are emitted for every tonne of crude steel produced126.
The emission of carbon to the atmosphere is associated with global warming. Various studies, project increase in global average temperature by 1.4 to 5.8 degree centigrade due to greenhouse gases emission from all socio-economic sector. The quantity of carbon dioxide (a greenhouse gas) emitted from anthropogenic sources is the maximum, which is due to intensive use of fossil fuel. The reductions of energy and power consumption have been a priority issue with the integrated steel plant in an effort to cut production cost of the unit. In the context of concerns of climate change, the prudent application of energy in the plant is viewed as low carbon technology.
The application of energy efficient technology is the accepted path of emission reduction. The Asia Pacific Partnership has identified many energy efficient technologies. The also include many innovative technologies such as thin strip casting. The technologies are cost intensive. Evaluating and strategizing incorporation of these technologies is complex, as application of these in process requires proper re-engineering. The other factors of attention are cumulative cost consideration, life cycle of technology, maintainability and potential of emission reduction. The cost is an important factor, as it impacts viability and competitiveness of the business.
V.A.1 Background
The tentative statistics of Indian steel industry indicate that India produced 53.9 million tonnes127 of crude steel for the year 2007-08. India is fifth largest producer of steel accounting for 4% of global production. The steel production and consumption is closely linked with economic growth of the country. In the year 2007, the World Crude Steel production was 1343.5 million metric tons (MMT), and this was a growth of 7.5% over the previous year. The production of major countries are indicated in Figure 5.1.
The International Iron & Steel Institute (IISI) in its forecast for 2008 has predicted that 2008 will be another strong year for the steel industry with apparent steel consumption (finished) rising from 1,202 million metric tonnes in 2007 to 1,282 million metric tonnes in 2008 i.e. by 6.7%. Consumption in the BRIC (Brazil, Russia, India and China) countries was projected at a higher rate in view of accelerated economic growth. However, due to global economic downturn started during last quarter of 2008 projections are likely to decline.
Figure 5.1: Crude Steel production by Countries128
Countries 2006 2007
126 ‘Sustainability Report of the World Steel Industry 2005’, on www.worldsteel.org (WSA report specifies that steel produced with Basic oxygen furnace (BOF) process emit 2.0 t CO2 per tonne of steel produced, and 0.4 tonne in the Electric Arc Furnace (EAF) process. The difference in emission is due to extraction of iron from iron ore in BOF process and EAF uses recycled steel as raw material. The current profile of steel making processes accrues an average of 1.7 t CO2 emissions) 127 SAIL Annual Report 2007-08 128 United States Geological Survey’
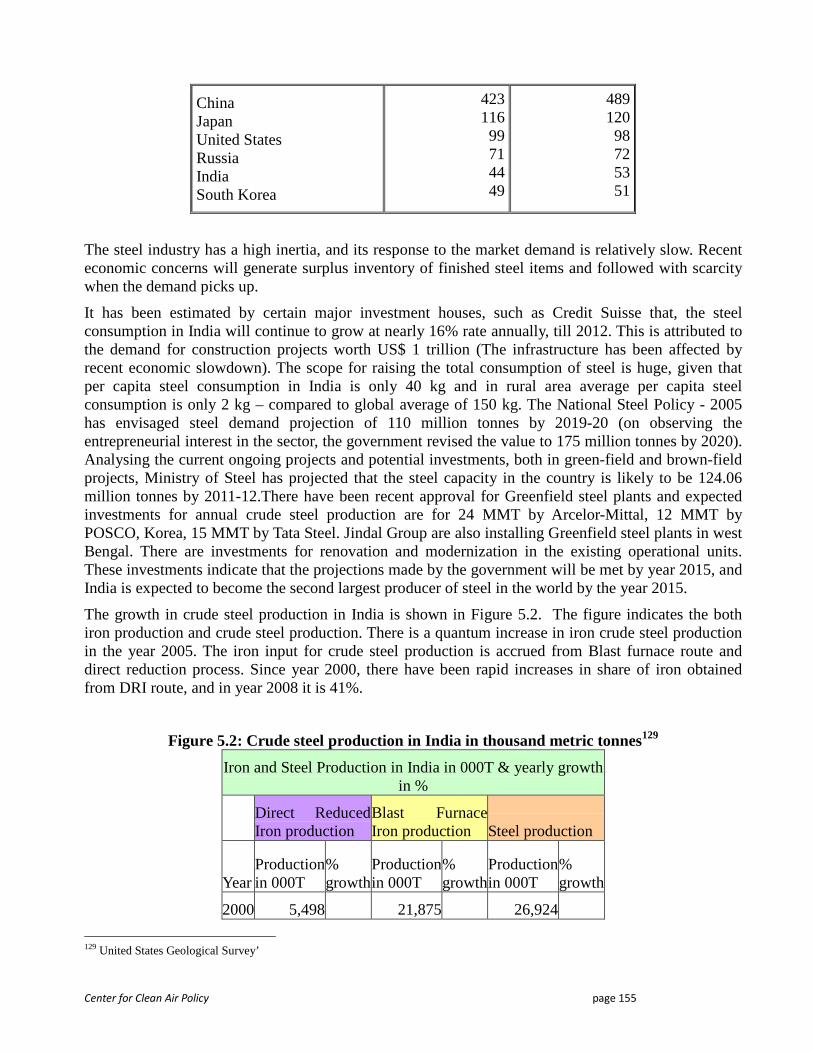
Center for Clean Air Policy page 155
China Japan United States Russia India South Korea
423 116 99 71 44 49
489 120 98 72 53 51
The steel industry has a high inertia, and its response to the market demand is relatively slow. Recent economic concerns will generate surplus inventory of finished steel items and followed with scarcity when the demand picks up.
It has been estimated by certain major investment houses, such as Credit Suisse that, the steel consumption in India will continue to grow at nearly 16% rate annually, till 2012. This is attributed to the demand for construction projects worth US$ 1 trillion (The infrastructure has been affected by recent economic slowdown). The scope for raising the total consumption of steel is huge, given that per capita steel consumption in India is only 40 kg and in rural area average per capita steel consumption is only 2 kg – compared to global average of 150 kg. The National Steel Policy - 2005 has envisaged steel demand projection of 110 million tonnes by 2019-20 (on observing the entrepreneurial interest in the sector, the government revised the value to 175 million tonnes by 2020). Analysing the current ongoing projects and potential investments, both in green-field and brown-field projects, Ministry of Steel has projected that the steel capacity in the country is likely to be 124.06 million tonnes by 2011-12.There have been recent approval for Greenfield steel plants and expected investments for annual crude steel production are for 24 MMT by Arcelor-Mittal, 12 MMT by POSCO, Korea, 15 MMT by Tata Steel. Jindal Group are also installing Greenfield steel plants in west Bengal. There are investments for renovation and modernization in the existing operational units. These investments indicate that the projections made by the government will be met by year 2015, and India is expected to become the second largest producer of steel in the world by the year 2015.
The growth in crude steel production in India is shown in Figure 5.2. The figure indicates the both iron production and crude steel production. There is a quantum increase in iron crude steel production in the year 2005. The iron input for crude steel production is accrued from Blast furnace route and direct reduction process. Since year 2000, there have been rapid increases in share of iron obtained from DRI route, and in year 2008 it is 41%.
Figure 5.2: Crude steel production in India in thousand metric tonnes129
Iron and Steel Production in India in 000T & yearly growth in %
Direct Reduced Iron production
Blast Furnace Iron production Steel production
Year Production in 000T
% growth
Production in 000T
% growth
Production in 000T
% growth
2000 5,498 21,875 26,924
129 United States Geological Survey’

Center for Clean Air Policy page 156
2001 5,720 4.0 21,875 0.0 27,291 1.4
2002 5,731 0.2 24,315 11.2 28,814 5.6
2003 7,051 23.0 26,550 9.2 31,779 10.3
2004 9,121 29.4 25,117 -5.4 32,626 2.7
2005 12,052 32.1 27,125 8.0 45,780 40.3
2006 15,032 24.7 28,256 4.2 49,450 8.0
2007 18,056 20.1 28,828 2.0 53,080 7.3
2008 20,150 11.6 28,900 0.2 55,050 3.7
www.worldsteel.org
India is the world’s largest producer of sponge iron/ direct reduced iron (DRI)130. Approximately 194 Memoranda of Understanding (MoUs) have been signed in various States with a total planned capacity of around 243 million tonnes, with a total proposed investment of over Rs.131 515 billions. Major investment plans are in Orissa, Jharkhand, Karnataka, Chhattisgarh and West Bengal. Data relating to production, consumption, import and export of finished steel (alloy & non-alloy) and crude steel from the year 2002-03 onwards are reflected in the Figure 5.3. The Figure also indicates the demand and supply scenario over the years. The government had projected steel export in tune of US$ 200 billion for the FY 2008-09. Currently there is a slump in global steel market due to economic slowdown.
130 Annual Report Ministry of Steel 2007-08 page 5 131 one US$ is equivalent to approximately Rs. fifty only
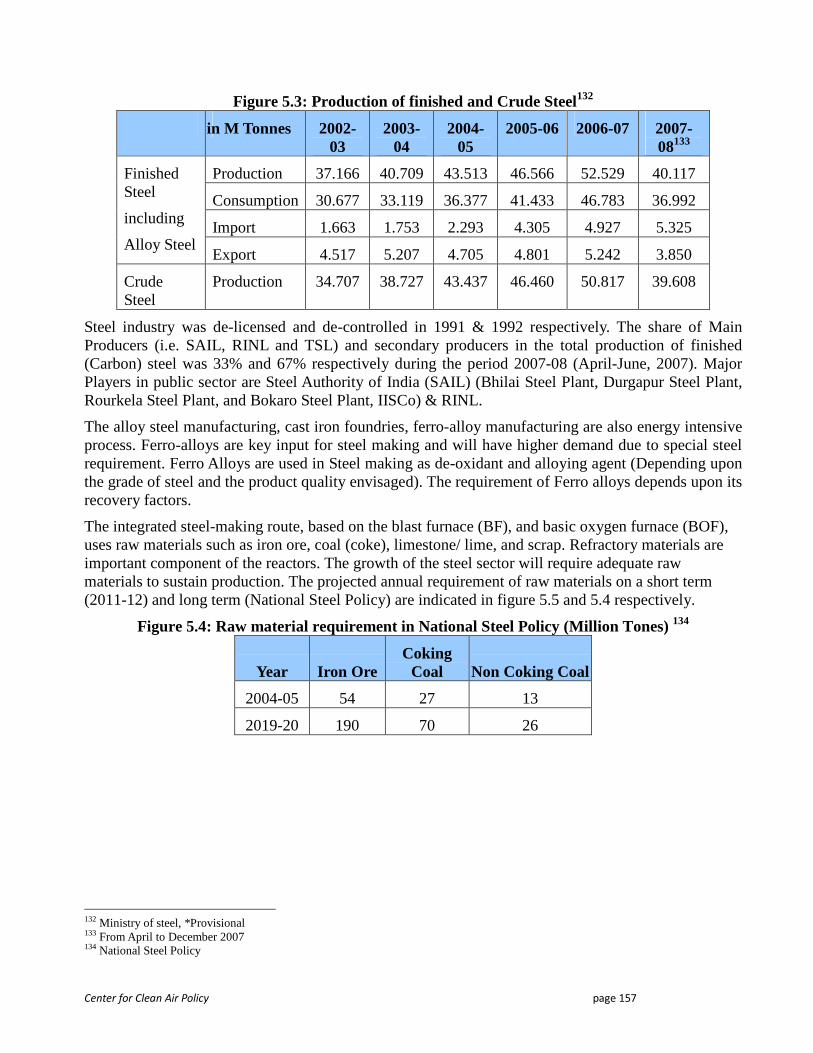
Center for Clean Air Policy page 157
Figure 5.3: Production of finished and Crude Steel132
in M Tonnes 2002-03
2003-04
2004-05
2005-06 2006-07 2007-08133
Production 37.166 40.709 43.513 46.566 52.529 40.117
Consumption 30.677 33.119 36.377 41.433 46.783 36.992
Import 1.663 1.753 2.293 4.305 4.927 5.325
Finished Steel
including
Alloy Steel Export 4.517 5.207 4.705 4.801 5.242 3.850
Crude Steel
Production 34.707 38.727 43.437 46.460 50.817 39.608
Steel industry was de-licensed and de-controlled in 1991 & 1992 respectively. The share of Main Producers (i.e. SAIL, RINL and TSL) and secondary producers in the total production of finished (Carbon) steel was 33% and 67% respectively during the period 2007-08 (April-June, 2007). Major Players in public sector are Steel Authority of India (SAIL) (Bhilai Steel Plant, Durgapur Steel Plant, Rourkela Steel Plant, and Bokaro Steel Plant, IISCo) & RINL.
The alloy steel manufacturing, cast iron foundries, ferro-alloy manufacturing are also energy intensive process. Ferro-alloys are key input for steel making and will have higher demand due to special steel requirement. Ferro Alloys are used in Steel making as de-oxidant and alloying agent (Depending upon the grade of steel and the product quality envisaged). The requirement of Ferro alloys depends upon its recovery factors.
The integrated steel-making route, based on the blast furnace (BF), and basic oxygen furnace (BOF), uses raw materials such as iron ore, coal (coke), limestone/ lime, and scrap. Refractory materials are important component of the reactors. The growth of the steel sector will require adequate raw materials to sustain production. The projected annual requirement of raw materials on a short term (2011-12) and long term (National Steel Policy) are indicated in figure 5.5 and 5.4 respectively.
Figure 5.4: Raw material requirement in National Steel Policy (Million Tones) 134
Year Iron Ore Coking
Coal Non Coking Coal
2004-05 54 27 13
2019-20 190 70 26
132 Ministry of steel, *Provisional 133 From April to December 2007 134 National Steel Policy
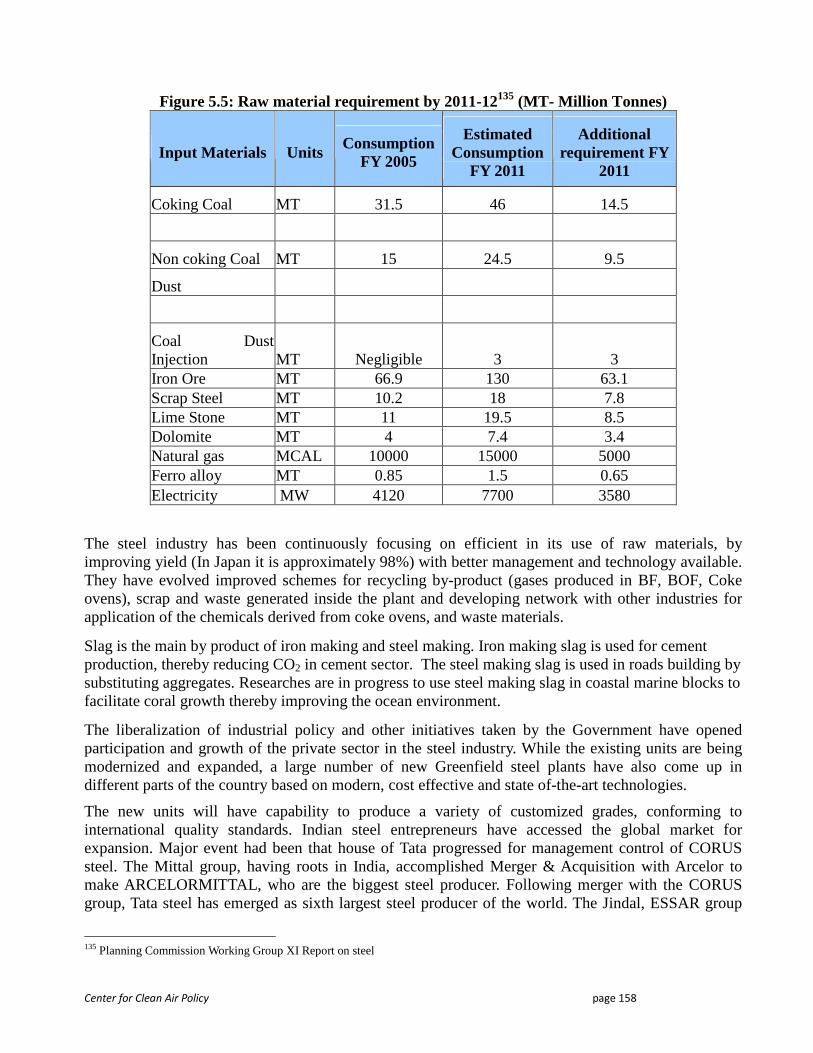
Center for Clean Air Policy page 158
Figure 5.5: Raw material requirement by 2011-12135 (MT- Million Tonnes)
Input Materials Units Consumption
FY 2005
Estimated Consumption
FY 2011
Additional requirement FY
2011
Coking Coal MT 31.5 46 14.5
Non coking Coal MT 15 24.5 9.5
Dust
Coal Dust Injection MT Negligible 3 3 Iron Ore MT 66.9 130 63.1 Scrap Steel MT 10.2 18 7.8 Lime Stone MT 11 19.5 8.5 Dolomite MT 4 7.4 3.4 Natural gas MCAL 10000 15000 5000 Ferro alloy MT 0.85 1.5 0.65 Electricity MW 4120 7700 3580
The steel industry has been continuously focusing on efficient in its use of raw materials, by improving yield (In Japan it is approximately 98%) with better management and technology available. They have evolved improved schemes for recycling by-product (gases produced in BF, BOF, Coke ovens), scrap and waste generated inside the plant and developing network with other industries for application of the chemicals derived from coke ovens, and waste materials.
Slag is the main by product of iron making and steel making. Iron making slag is used for cement production, thereby reducing CO2 in cement sector. The steel making slag is used in roads building by substituting aggregates. Researches are in progress to use steel making slag in coastal marine blocks to facilitate coral growth thereby improving the ocean environment.
The liberalization of industrial policy and other initiatives taken by the Government have opened participation and growth of the private sector in the steel industry. While the existing units are being modernized and expanded, a large number of new Greenfield steel plants have also come up in different parts of the country based on modern, cost effective and state of-the-art technologies.
The new units will have capability to produce a variety of customized grades, conforming to international quality standards. Indian steel entrepreneurs have accessed the global market for expansion. Major event had been that house of Tata progressed for management control of CORUS steel. The Mittal group, having roots in India, accomplished Merger & Acquisition with Arcelor to make ARCELORMITTAL, who are the biggest steel producer. Following merger with the CORUS group, Tata steel has emerged as sixth largest steel producer of the world. The Jindal, ESSAR group
135 Planning Commission Working Group XI Report on steel
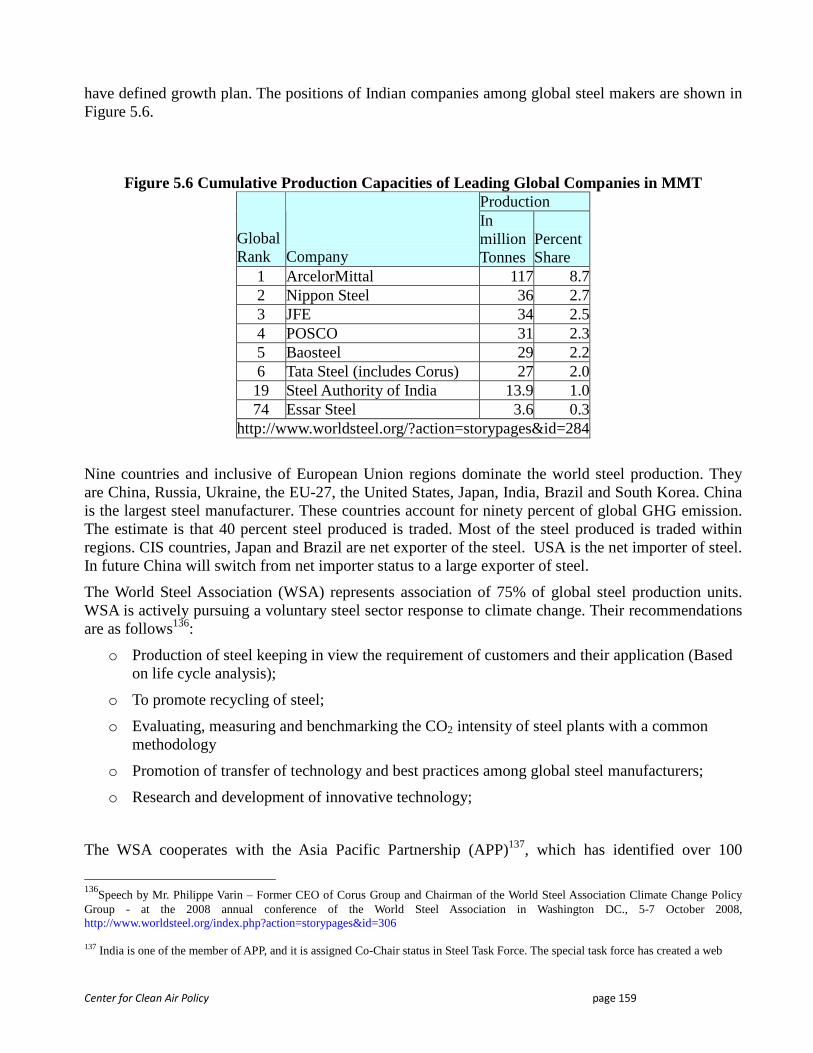
Center for Clean Air Policy page 159
have defined growth plan. The positions of Indian companies among global steel makers are shown in Figure 5.6.
Figure 5.6 Cumulative Production Capacities of Leading Global Companies in MMT
Production
Global Rank Company
In million Tonnes
Percent Share
1 ArcelorMittal 117 8.72 Nippon Steel 36 2.73 JFE 34 2.54 POSCO 31 2.35 Baosteel 29 2.26 Tata Steel (includes Corus) 27 2.019 Steel Authority of India 13.9 1.074 Essar Steel 3.6 0.3
http://www.worldsteel.org/?action=storypages&id=284
Nine countries and inclusive of European Union regions dominate the world steel production. They are China, Russia, Ukraine, the EU-27, the United States, Japan, India, Brazil and South Korea. China is the largest steel manufacturer. These countries account for ninety percent of global GHG emission. The estimate is that 40 percent steel produced is traded. Most of the steel produced is traded within regions. CIS countries, Japan and Brazil are net exporter of the steel. USA is the net importer of steel. In future China will switch from net importer status to a large exporter of steel.
The World Steel Association (WSA) represents association of 75% of global steel production units. WSA is actively pursuing a voluntary steel sector response to climate change. Their recommendations are as follows136:
o Production of steel keeping in view the requirement of customers and their application (Based on life cycle analysis);
o To promote recycling of steel;
o Evaluating, measuring and benchmarking the CO2 intensity of steel plants with a common methodology
o Promotion of transfer of technology and best practices among global steel manufacturers;
o Research and development of innovative technology;
The WSA cooperates with the Asia Pacific Partnership (APP)137, which has identified over 100
136
Speech by Mr. Philippe Varin – Former CEO of Corus Group and Chairman of the World Steel Association Climate Change Policy Group - at the 2008 annual conference of the World Steel Association in Washington DC., 5-7 October 2008, http://www.worldsteel.org/index.php?action=storypages&id=306 137 India is one of the member of APP, and it is assigned Co-Chair status in Steel Task Force. The special task force has created a web
Center for Clean Air Policy page 160
technologies that can be transferred. WSA observes that main barrier to technology transfer are the lack of willingness of advanced steel companies to supply technologies, intellectual property rights and fears for undue subsidies of plants. Considering Tata Steel, ArcelorMittal being advanced steel companies, the proposed barrier can be surmounted.
The Indian steel Industry has taken various initiatives to enhance energy efficiency in their units to reduce operational cost and stay competitive in business. This is a continuous effort and has to be sustained over time. The national action plan for climate change specifies creation of strategic knowledge base, which will enhance all efforts to mitigate greenhouse gas emissions in steel sector.
V.A.2 Key Stakeholders
• The Ministry of Steel (MoS): The Department of Steel is the central government institution responsible for managing growth of Iron & steel sector, and demand and supply of steel in the country. It coordinates with different ministries for infrastructure development, resolving issues of the concerning steel sector, and ensure efficient supply chain. They analyse requirement of stakeholders and oversee the steel market and draft policies conducive to the sector. It is responsible for formulation of policies concerning steel sector in respect of production, pricing, distribution, import and export of iron & steel product, Ferro alloys and refractories. It is also responsible for development of mining industries and Refractories, required by the steel industry.
• Planning Commission: Planning Commission concerns itself with the building of strategies of growth of national economy inclusive of steel sector for next ‘five year plan’ and a long-term strategic vision of socio-economic growth. They have prepared the 11th plan working group report. The commission prepares the supply target inclusive of inputs required to achieve target. The planning process covers requirement of all the economic sectors. The planning commission documents the plausible course of development towards the targeted GDP growth, attending to requirement of all sections of the society.
• Join Plant Committee: The organization reports to the Ministry of Steel on progress in steel sector. Prior to liberalization the body had the mandate to decide price of steel products. Currently they are the information bases of the ministry and updates ministry on the current issues. They are bridge between steel producer and end consumers. The organization can support life cycle analysis as proposed by World Steel Association
• Ministry of Coal : The Ministry of Coal has the overall responsibility of monitoring, administering the coal sector in India. It is also responsible for the growth of the sector by providing continuous support of exploration and development of coal and lignite reserves. It draft policies and strategies addressing concerns of coal consumers and stakeholders, and coordinates with appropriate ministries to resolve constraints of stakeholder.
• Ministry of Commerce: The ministry guides the department of steel on foreign trade. The ministry also addresses the issues of anti-dumping. The have also important say in the mineral policies.
based document “State of the Art Clean Technology – Steel Handbook”.
Center for Clean Air Policy page 161
• Bureau of Energy Efficiency: The regulatory body had been playing the role of capacity building for industry to bring about energy conservation and efficiency in Industrial sector. They are expected to make guidelines and benchmark for the steel industry also on the energy efficiency parameters. After release of National Action Plan for Climate Change, the Bureau has authority to suggest path of mitigation of GHG for the designated consumers.
• National Mineral Development Corporation (NMDC) – They have control over major iron ore, manganese ore, chrome ore and flux mines. They are associated with ministry of steel.
• State Industries Ministry: The state is responsible for the safety norms of the industry such as boiler, environment pollution. The state also approves small-scale industries like sponge iron units. In majority of the states, the state government manages electric supply to the industry. Approximately ninety-five percent of Indian consumers get their power supply from the state electricity boards, or the state government owned companies carved out from erstwhile State Electricity Boards. State government have the power to lease the mines.
• Private sector steel manufacturing units: The future growth in the steel sector is expected from the private sector. Following mergers and acquisition in developed countries, the Arcelor-Mittal and Tata group have the access to the best technological practices. It is expected that in future new integrated steel plant will have improved energy efficiency parameters equivalent to global benchmark, may be equivalent to the best global plants. The other important investors in the sector are Jindal Group; POSCO, Korea; Essar Group. Many mini steel units using direct reduced Iron, electric furnaces are coming up with private investments.
• Ministry of Environment and Forests (MoEF): The Ministry of Environment & Forests is the nodal agency in the administrative structure of the Central Government, for the planning, promotion, co-ordination and overseeing the implementation of environmental and forestry programmes. The Ministry is also the Nodal agency in the country for the United Nations Environment Programme (UNEP). The ministry is responsible for issuing project go-ahead following Environment Impact Assessment.
• Ministry of Finance: The ministry of finance in India governs the entire fiscal system of the Government of India. It administers all the issues in India pertaining to economy and finance. This also includes the task of mobilization of resources in terms of execution of developmental programmes. The ministry declares taxes, import and export duties for execution by designated authority.
• Department of Science and Technology (DST): DST plays the role of a nodal department for organizing, coordinating and promoting Science & Technology activities in India. National Metallurgical laboratory, Jamshedpur is a CSIR unit.
• Centrally owned research organizations: Steel Authority of India Limited (SAIL), Tata steel have R&D Centre. M/S MECON is the design and consultancy body.
• Other Government Institution: MMTC is an government arm of trade and Indian Standard Institute (ISI)
• Sponge Iron India Limited: The unit was created to develop sponge iron technology in India. Currently it is in consultancy business.
• Private Players in DRI process
Center for Clean Air Policy page 162
• Technology Supplier: The major technology supplier and supplier of electrics and automation scheme have their based in India. Some the Important organizations are SMS Demag, Voest- Alpine, ABB, Siemens, GE, have their offices in India.
• Ministry of Water Resources: Steel Industry is huge consumer of water for the cooling system and boilers.
• Design Bureaus and Consultants: M/S MN Dastur, is a leading consultant in the steel sector. Arcelormittal is taking the services of the Hewitt group for their proposed plant in Jharkhand and Orissa.
• Ministry of Mines: Major steel plants have captive mines. Ministry of mines have an authority on other mines except those of coal, nuclear materials.
• Ferro alloy suppliers: The main Ferro alloys used are Ferro silicon, Ferro manganese, and Ferro chrome. The noble Ferro alloys are Ferro molybdenum, Ferro vanadium, Ferro niobium, Ferro titanium, Ferro tungsten etc. Strong growth in special steel is expected in the future with increased demand from power and auto sector. Demand for Noble Ferro Alloys has been growing at an average rate of 14% since 2000. This trend has to be sustained.
Private entrepreneurs are executing most of the investments in the steel sector. Prominent among them are ArcelorMittal; Tata Steel; POSCO, Korea; Jindal group. ESSAR group are having direct reduction and smelting process and they are using Natural Gas. The public sector corporate SAIL, RINL are investing to modernize the existing units with technologies that are energy efficient, and eliminate process redundancies.
The important government policies concerning steel sector are National steel policy-2005, Export policy of Iron ore, Duty structure, National Mineral Policy, Industrial Policy, Foreign Trade policy, National Environment Policy, National electricity Policy, distribution of iron and steel to small scale industries (SSI), Coal Policy and Guidelines.
Acts enacted and are vital to the study are Water (prevention & control of pollution) Act, Energy conservation act, Environment Act, Electricity Act 2003, and Factories Act. The prime Minister of India has released National action plan for climate change.
V.A.3 Capacity by ownership After independence, Indian government initiated development of steel sector in public sector. They created SAIL (formerly Hindustan Steel Limited), RINL, Sponge iron India limited for growth of the sector. Few sick private units were also nationalized under SAIL management. Indian entrepreneur observed opportunity in direct reduced iron process and since 1980 there has been continuous private investment in the DRI process. Following economic liberalization of the 1990s the sector was opened for private participation. The growth of steel sector is currently being driven by private investment. The government is focusing in revitalizing the existing Public Sector units (PSU) by supporting modernization. The manufacturing base in public and private sector in the steel sector is shown in Figure 5.7. In the earlier years steel production was achieved through integrated steel plant and the alloys steel from electric furnaces. The electric furnaces depend on steel scrap as primary input. Since 1980, direct reduced iron process developed rapidly, and India became a leading producer of sponge iron. Currently 66% percent of steel production in the country is from private units. In future with commissioning of Greenfield plants in private sector this percentage will increase substantially.
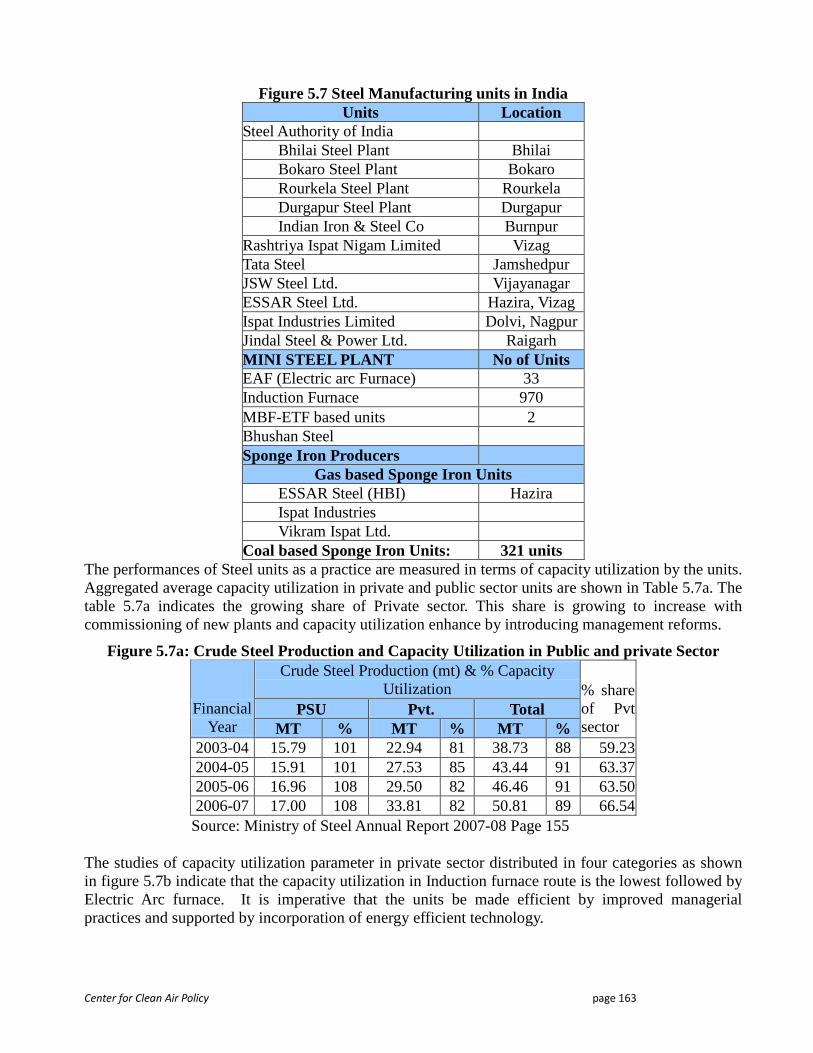
Center for Clean Air Policy page 163
Figure 5.7 Steel Manufacturing units in India Units Location
Steel Authority of India Bhilai Steel Plant Bhilai Bokaro Steel Plant Bokaro Rourkela Steel Plant Rourkela Durgapur Steel Plant Durgapur Indian Iron & Steel Co Burnpur
Rashtriya Ispat Nigam Limited Vizag Tata Steel Jamshedpur JSW Steel Ltd. Vijayanagar ESSAR Steel Ltd. Hazira, Vizag Ispat Industries Limited Dolvi, Nagpur Jindal Steel & Power Ltd. Raigarh MINI STEEL PLANT No of Units EAF (Electric arc Furnace) 33 Induction Furnace 970 MBF-ETF based units 2 Bhushan Steel Sponge Iron Producers
Gas based Sponge Iron Units ESSAR Steel (HBI) Hazira Ispat Industries Vikram Ispat Ltd.
Coal based Sponge Iron Units: 321 units The performances of Steel units as a practice are measured in terms of capacity utilization by the units. Aggregated average capacity utilization in private and public sector units are shown in Table 5.7a. The table 5.7a indicates the growing share of Private sector. This share is growing to increase with commissioning of new plants and capacity utilization enhance by introducing management reforms.
Figure 5.7a: Crude Steel Production and Capacity Utilization in Public and private Sector Crude Steel Production (mt) & % Capacity
Utilization PSU Pvt. Total Financial
Year MT % MT % MT %
% share of Pvt sector
2003-04 15.79 101 22.94 81 38.73 88 59.23 2004-05 15.91 101 27.53 85 43.44 91 63.37 2005-06 16.96 108 29.50 82 46.46 91 63.50 2006-07 17.00 108 33.81 82 50.81 89 66.54 Source: Ministry of Steel Annual Report 2007-08 Page 155
The studies of capacity utilization parameter in private sector distributed in four categories as shown in figure 5.7b indicate that the capacity utilization in Induction furnace route is the lowest followed by Electric Arc furnace. It is imperative that the units be made efficient by improved managerial practices and supported by incorporation of energy efficient technology.
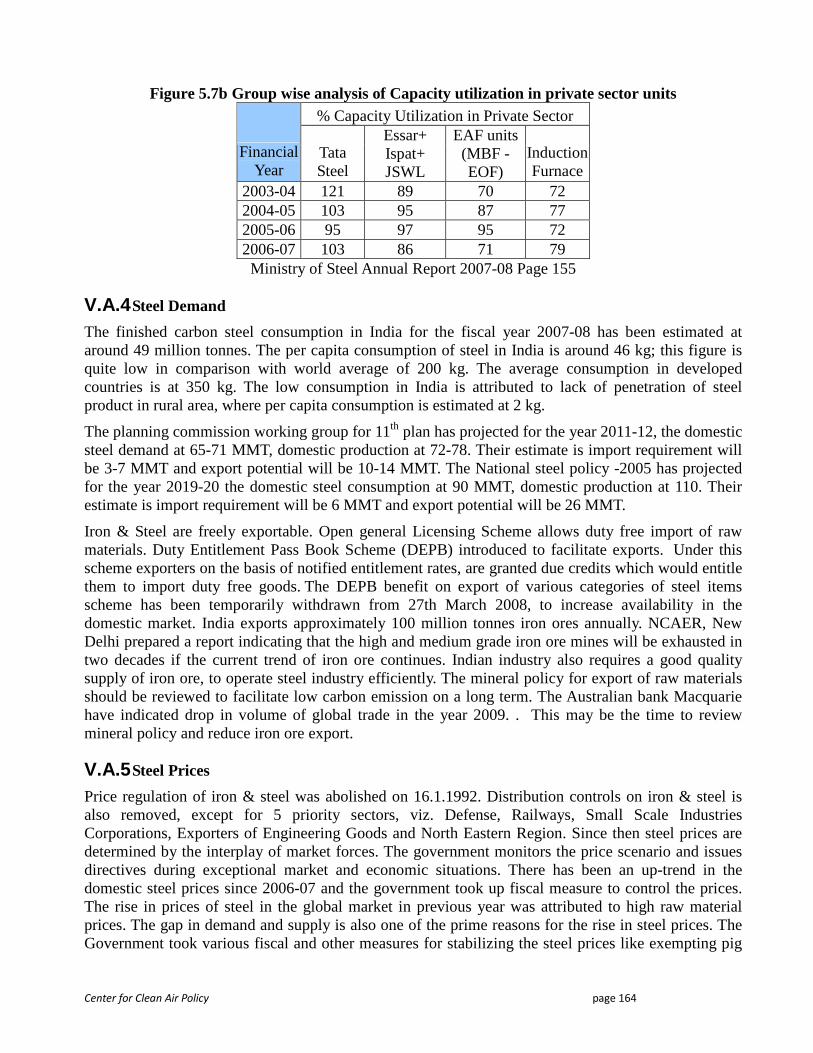
Center for Clean Air Policy page 164
Figure 5.7b Group wise analysis of Capacity utilization in private sector units % Capacity Utilization in Private Sector
Financial Year
Tata Steel
Essar+ Ispat+ JSWL
EAF units (MBF -EOF)
Induction Furnace
2003-04 121 89 70 72 2004-05 103 95 87 77 2005-06 95 97 95 72 2006-07 103 86 71 79 Ministry of Steel Annual Report 2007-08 Page 155
V.A.4 Steel Demand
The finished carbon steel consumption in India for the fiscal year 2007-08 has been estimated at around 49 million tonnes. The per capita consumption of steel in India is around 46 kg; this figure is quite low in comparison with world average of 200 kg. The average consumption in developed countries is at 350 kg. The low consumption in India is attributed to lack of penetration of steel product in rural area, where per capita consumption is estimated at 2 kg.
The planning commission working group for 11th plan has projected for the year 2011-12, the domestic steel demand at 65-71 MMT, domestic production at 72-78. Their estimate is import requirement will be 3-7 MMT and export potential will be 10-14 MMT. The National steel policy -2005 has projected for the year 2019-20 the domestic steel consumption at 90 MMT, domestic production at 110. Their estimate is import requirement will be 6 MMT and export potential will be 26 MMT.
Iron & Steel are freely exportable. Open general Licensing Scheme allows duty free import of raw materials. Duty Entitlement Pass Book Scheme (DEPB) introduced to facilitate exports. Under this scheme exporters on the basis of notified entitlement rates, are granted due credits which would entitle them to import duty free goods. The DEPB benefit on export of various categories of steel items scheme has been temporarily withdrawn from 27th March 2008, to increase availability in the domestic market. India exports approximately 100 million tonnes iron ores annually. NCAER, New Delhi prepared a report indicating that the high and medium grade iron ore mines will be exhausted in two decades if the current trend of iron ore continues. Indian industry also requires a good quality supply of iron ore, to operate steel industry efficiently. The mineral policy for export of raw materials should be reviewed to facilitate low carbon emission on a long term. The Australian bank Macquarie have indicated drop in volume of global trade in the year 2009. . This may be the time to review mineral policy and reduce iron ore export.
V.A.5 Steel Prices
Price regulation of iron & steel was abolished on 16.1.1992. Distribution controls on iron & steel is also removed, except for 5 priority sectors, viz. Defense, Railways, Small Scale Industries Corporations, Exporters of Engineering Goods and North Eastern Region. Since then steel prices are determined by the interplay of market forces. The government monitors the price scenario and issues directives during exceptional market and economic situations. There has been an up-trend in the domestic steel prices since 2006-07 and the government took up fiscal measure to control the prices. The rise in prices of steel in the global market in previous year was attributed to high raw material prices. The gap in demand and supply is also one of the prime reasons for the rise in steel prices. The Government took various fiscal and other measures for stabilizing the steel prices like exempting pig
Center for Clean Air Policy page 165
iron, non alloy steel and steel making inputs like zinc, ferro-alloys and met coke from customs duty; withdrawing DEPB benefits on export of various categories of steel products and bringing back railway freight on iron ore from classification 180 to 170 for domestic steel producers138.
In May 2008, on observing market, the Government imposed 15% export duty on semi-finished products, and hot rolled coils/sheet, 10% export duty on cold rolled coils/sheets and pipes and tubes and 5% export duty on galvanized steel in coil/sheet form in order to further curtail rising prices and increase supply of steel in the domestic market. Since the global economic recession government has initiated policy measures to assist steel consumers and producer. The steel ministry website publishes the duty structure.
V.A.6 Imports and exports of Iron and steel
Iron & Steel are freely importable as per the existing policy. Last four years import of Finished (Carbon) Steel is given below in figure 5.8:
138 Ministry of Steel, www.steel.nic.in

Center for Clean Air Policy page 166
Figure 5.8: Import of Finished (Carbon) Steel139
Year Qty. (In Million Tonnes)
2003-04 1.540
2004-05 2.109
2005-06 3.850
2006-07(Provisional. estimated) 4.100
2007-08 (Apr-June, 207)(Provisional estimated)
0.800
Despite the aging of steel industry, the management of this sector has been aware of modern technology developments and market demand of quality and cost-competitiveness of its product in the wake of globalization. They have upgraded the units at the indication of aging i.e. higher consumption of energy and power, downward trend in yield parameter, and to ensure quality of steel product according to market compliance, and competitiveness. The steel for auto sector and special applications are imported. National Steel policy-2005 envisages substantial export of Steel product. The developed countries are thinking of Carbon leakage strategy to mitigate their GHG emission from steel sector. Carbon leakage is defined as increasing CO2 emissions abroad because of national CO2 policies. India can consider the strategy of augmenting steel manufacturing capacity by negotiating erection and commissioning of Greenfield steel plant having low carbon feature within its geographical boundaries, if any developed country plans for carbon leakage strategy to address GHG mitigation options.
V.A.7 Iron and Steel making process Steel in India is produced using three different technological routes, (1) the integrated steel plant uses coke ovens, Blast furnace, Basic Oxygen process followed by rolling mills (2) Direct reduction iron furnace, to make sponge iron, and sponge iron is treated in electric are furnace/ electric Induction furnace to make steel followed by rolling mill (3) steel scrap treated in electric are furnace/ electric Induction furnace to make steel followed by rolling mill. There are many secondary steel maker, re-rollers, and the government is planning to set up special steel processing units, through SAIL. The Iron-making production profile constitutes of, where Blast furnaces accounts for 48%, Kiln type direct reduction accounts for 43%, direct reduction-shaft accounts for 7% and Corex process accounts for 2% iron production. The Steel-making production profile constitutes of, where Basic oxygen furnace (BOF) accounts for 41%, Induction Furnace accounts for 30%, Electric Arc Furnaces accounts for 27% and open-hearth furnace process accounts for 2% iron production.140
139 Ibid 140 “Techno-economic Consideration for Augmenting India Steel Capacity” presentation by Mr. S Das Gupta & Mr. Bhaskar Roy of M/S M N Dastur Co.
Center for Clean Air Policy page 167
Iron and steel production
Broadly iron and steel production can be divided into 5 steps: 1) Raw material handling and processing 2) Iron making 3) Steel making 4) Casting, and 5) Rolling and finishing
Depending on the production route the steps are upgraded with innovative and improved technology; thus substantially reducing the energy and power consumption of the overall route:
a) Treatment of raw material
The main raw materials in the iron production process are coal (Coking and non-coking), iron ore and limestone. During the process of mining a significant quantity of fines are generated that are not suitable for BF process. There are various agglomeration technologies to make fines compliance for process application. The treatment of raw materials consists of effective blending at each storage site, sizing by screening of raw materials, for coal there are coal washeries. These are the ways to mitigated energy consumption, thereby ensuring the processes of consistent quality raw materials and smooth process functioning. The integrated steel plant processes starts from a carbonization process of coal, where heating coal in the absence of air produces coke. The by-products of this process are separated and cleaned and gas is used in the plant as a fuel. The other by-product gases are blast furnace gas and Basic Oxygen furnace gas. During the process of iron ore mining more than 50% iron ore dust are generated. Steel Industry has sinter plants to produce self-flux sinter/ pellet plants to provide iron making process iron bearing input in desired form. One of the additional feature of I&S industry is release of GHG gas due calcinations of limestone and dolomite, which are used as flux and refractory. Indian Coal is having high ash content. The ash will consume greater amount of limestone for slag formation, and heat during process flow. For this reason use of imported coal having low ash is preferred to reduce limestone consumption. The non-coking coal is used for coal dust injection and Direct reduction processes.
The steel industry uses steel scrap in large quantity in BOF, EAF, and Induction furnaces. Parts of the scrap are generated within various units and processes, and these are recycled. Good quality scraps are used in furnaces (BOF, EAF, IF), while scales, iron dust are used in sinter units. By products of coke-ovens are marketed. BF slag is used for cement plant (mitigating GHG emission from cement sector) and use of steel melting is being researched for marine application.
Integrated steel plant has in-house oxygen plant for manufacturing oxygen, which is used for BOF process. In future additional oxygen can be used for oxy-fuel combustion in power plant. The nitrogen separated in oxygen plant can be used gainfully.
b) Iron making
This is the most energy intensive step in the steel making process and more than fifty percent of total energy required in the plant is consumed in this area. Effective operation is the preferred way to reduce energy consumption. The blast furnace inputs are coke, (ore + sinter), and limestone. At high-pressure and temperature blast is blown from the bottom into the furnace. Molten pig iron/ hot metal, rich in carbon, is tapped from the bottom and transferred in ladle to the Basic oxygen steel plant. The
Center for Clean Air Policy page 168
coal dust/ natural gases are injected into the blast furnace to reduce coke consumption. There are direct reduction processes to produce sponge iron, also known as direct reduced iron. (DRI) Some of the new technologies are (DRI and smelting) COREX, and Ciercofer (Outokompu, Finland) process, although not at large scale and their market penetration is small.
c) Steel making
Theoretically Steel making is the reduction of Carbon in iron to below 1.9%. In integrated I&S industry, carbon content of the hot metal is reduced below 0.2%. In steel melting shop carbon and other element (Si, P, and S) of hot metal are removed by oxygen blowing. The specified chemical analysis and attributes of steel are obtained by adding ferroalloys. The raw materials for steel making are hot metal from iron making process, scrap, lime, and more than 99% pure is blown in the reactor. Optimum raw materials are added to obtain steel in one process run. The final characteristics and quality of the crude steel are adjusted in a series of ladle refining processes. Integrated steel mills use the Basic Oxygen Furnace (BOF). The other process is use of electric furnaces. The electric furnaces are of induction or electric arc furnace. For historical reason electric steel making is termed as secondary steel making. Secondary steel is produced in an electric arc furnace (EAF); here scrap is melted and refined using electrical energy. There are several reasons for the popularity of Induction Melting Furnaces for making steel in India. They consume less power compared to EAFs. Expenditure on electrode is nil. The erosion of refractory is less. Initial investment is less on plant and equipment. Thus, there are economic advantages in making steel through Induction Furnaces route. The only constraint is that at present bulk quantity steel cannot be produced through Induction Furnace route.
The electric furnace using scraps consume less energy, as reduction of iron ore is not required. In future, when the national economy becomes mature, the steel scrap availability will increase. The electric process of steel making share will increase. An effective policy on scrap handling will be needed.
d) Casting The molten steel casting is categorized in product-wise as (1) flat or long product (2) rimming, semi killed or killed steel, and technology wise as (a) continuous Casting (b) ingot casting`. The casting of steel can either be continuous or batch (ingot casting). In ingot casting liquid steel is cast into ingots that are cooled, stripped and then reheated in soaking pit and is rolled into slabs, blooms or billets in the primary mill. In continuous casting the soaking pit and primary rolling is eliminated because the molten steel is cast directly into slabs or blooms or billet. The heat and power requirement of a process is eliminated. The current development is of thin strip casting. This will save addition requirement of fuel and electrical power.
e) Rolling and finishing The cast steel is reheated, rolled and processed through a number of finishing operations. These final operations depend largely on the type of steel that is produced. Hot rolling, where the heated steel (Ingot/slab/bloom/billet) is passed between roll housing arranged in tandem or specially designed roll housing; until it attains the desired thickness. The products are slabs, strips, bars, structural, merchant product, rods, tubes and plates etc. The scope of energy & power in this area can be achieved by optimized use of reheating furnace, hot charging, eliminating heat losses with box cover etc. Cold forming/ rolling processes produce wires, sheets and strips. After rolling is completed, the some finished steel pieces are processed to prevent corrosion and improve properties of the metal. Packaging of steel Items are developing with time. The finished steel is marketed to the consumer,
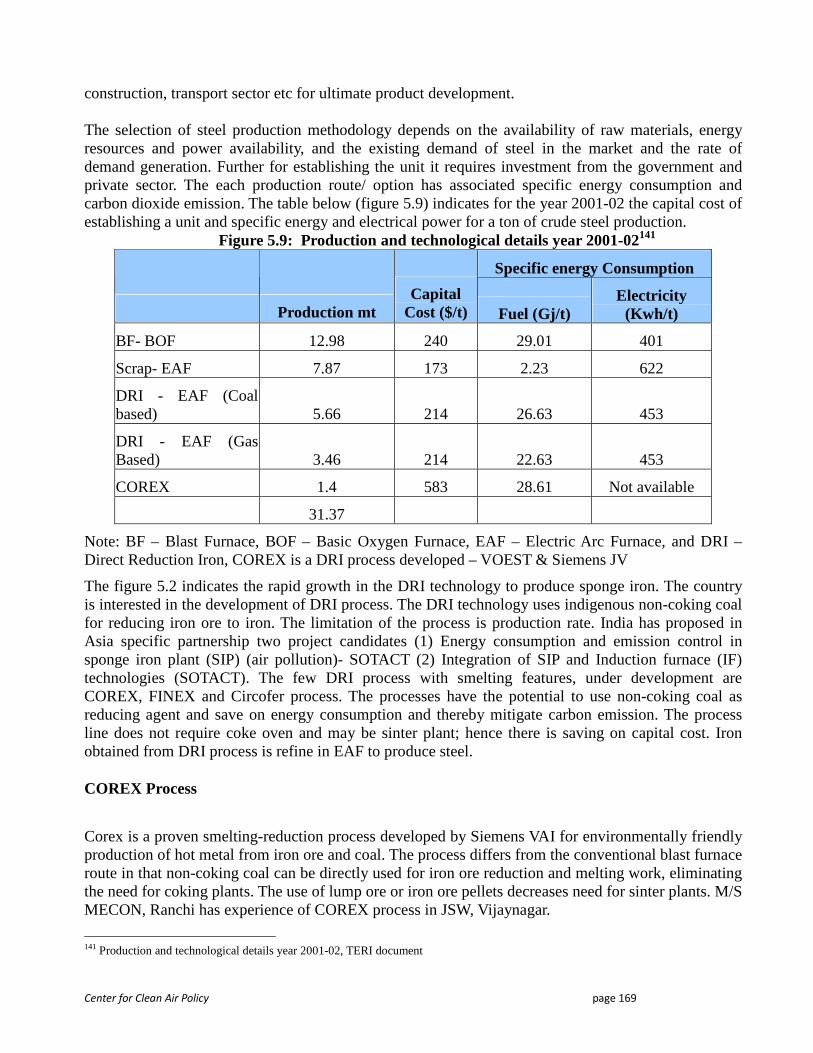
Center for Clean Air Policy page 169
construction, transport sector etc for ultimate product development. The selection of steel production methodology depends on the availability of raw materials, energy resources and power availability, and the existing demand of steel in the market and the rate of demand generation. Further for establishing the unit it requires investment from the government and private sector. The each production route/ option has associated specific energy consumption and carbon dioxide emission. The table below (figure 5.9) indicates for the year 2001-02 the capital cost of establishing a unit and specific energy and electrical power for a ton of crude steel production.
Figure 5.9: Production and technological details year 2001-02141
Specific energy Consumption
Production mt Capital
Cost ($/t) Fuel (Gj/t) Electricity (Kwh/t)
BF- BOF 12.98 240 29.01 401
Scrap- EAF 7.87 173 2.23 622
DRI - EAF (Coal based) 5.66 214 26.63 453
DRI - EAF (Gas Based) 3.46 214 22.63 453
COREX 1.4 583 28.61 Not available
31.37
Note: BF – Blast Furnace, BOF – Basic Oxygen Furnace, EAF – Electric Arc Furnace, and DRI – Direct Reduction Iron, COREX is a DRI process developed – VOEST & Siemens JV
The figure 5.2 indicates the rapid growth in the DRI technology to produce sponge iron. The country is interested in the development of DRI process. The DRI technology uses indigenous non-coking coal for reducing iron ore to iron. The limitation of the process is production rate. India has proposed in Asia specific partnership two project candidates (1) Energy consumption and emission control in sponge iron plant (SIP) (air pollution)- SOTACT (2) Integration of SIP and Induction furnace (IF) technologies (SOTACT). The few DRI process with smelting features, under development are COREX, FINEX and Circofer process. The processes have the potential to use non-coking coal as reducing agent and save on energy consumption and thereby mitigate carbon emission. The process line does not require coke oven and may be sinter plant; hence there is saving on capital cost. Iron obtained from DRI process is refine in EAF to produce steel.
COREX Process
Corex is a proven smelting-reduction process developed by Siemens VAI for environmentally friendly production of hot metal from iron ore and coal. The process differs from the conventional blast furnace route in that non-coking coal can be directly used for iron ore reduction and melting work, eliminating the need for coking plants. The use of lump ore or iron ore pellets decreases need for sinter plants. M/S MECON, Ranchi has experience of COREX process in JSW, Vijaynagar.
141 Production and technological details year 2001-02, TERI document
Center for Clean Air Policy page 170
Corex plant emissions contain only insignificant amounts of NOx, SO2 (Indian coal have low sulphur content), dust, and pollutants of coke oven e.g. phenols, sulphides and ammonium. Wastewater pollution from the Corex Process is far lower than those in the conventional blast-furnace route. These environmental features are additional key reasons for the attractiveness of the Corex Process.
The process also generates gas that can be used as fuel gas.
The latest generation of Corex plants, the C-3000, is ideally suited for integration into green- or brown-field steel works projects. It can replace the blast furnace, or can be used as a source of molten iron for mini-mills. The economics of the Corex plant already provide an option to future scrap and coke shortages, and the continually increasing demands placed on steel quality. Another alternative is the installation of a Corex C-3000 plant as a stand-alone merchant plant for the production of hot metal and/or pig iron.
Circofer Process142
Circofer process combines excellent heat and mass transfer in the circulating fluidized bed to convert iron ore fines and coal into low cost DRI with no export fuel. Sticking, accretion and re-oxidation problems associated with previous processes are avoided by operation with excess carbon and separation of the gasification and reduction zones.
Process Description: The ore fines are preheated in a two-stage-preheating system before being introduced into a two- stage reactor system. The reactors circulating fluidized bed (CFB) and fluidized bed (FB) are connected in series. This arrangement allows optimized gas utilization, and permits efficient process control of reduction reaction. The initial reaction step of pre-reduction accomplish up to about 70 % metallization. The final reduction to a level of metallization of plus 92 % is accomplished in the second stage in FB reactor. This stage takes longer retention times.
In order to ensure optimized gas utilization and hence optimize energy consumption, the CIRCOFER Process operates according to the countercurrent principle for the flow of gas and solids. The coal gasification stage in the 'gasifiers' is separate from the actual reduction of the ore in the reduction reactor. The energy necessary for the endothermic reduction reaction is generated in the gasifiers.
The highly metallized iron (93%) produced from Ciercofer process can be used in electric arc furnace (EAF) for steel making. This process has potential of CO2 saving and is in development stage. The development of Circofer technology can be developed in Indian context by establishing joint venture with Outocompu, Finland. The challenge of the process is in production intensification. The waste gas generated in the process has high concentration of carbon dioxide, and can be used for CCS application on commercial maturity of the CCS process.
V.A.8 Domestic Raw Materials Status The iron ore reserve has been estimated at 25 billion tonnes, the hematite ore reserves is estimated at 11.43 billion tonnes and Magnetite ore is estimated at 10.68 billion tonnes. The region wise reserve availability of Iron ore identified for commercial exploitation is Jharkhand 3985 million tonnes (mT), Orissa 4014 mT , Chattisgarh 2651 mT, Karnataka 8897 mT, Goa 803 mT, others being 3254 mT. Major Consumers, SAIL and Tata Steel have captive mines, RINL, Vizag procures their ore from NMDC. ESSAR, Ispat, Vikram Ispat, JVSL procure their ore from NMDC and private sources. India 142 Low CO2 emission technologies for iron and steel making as well as titania slag formation Science Direct Mineral Engineering 20(2007) 854-861
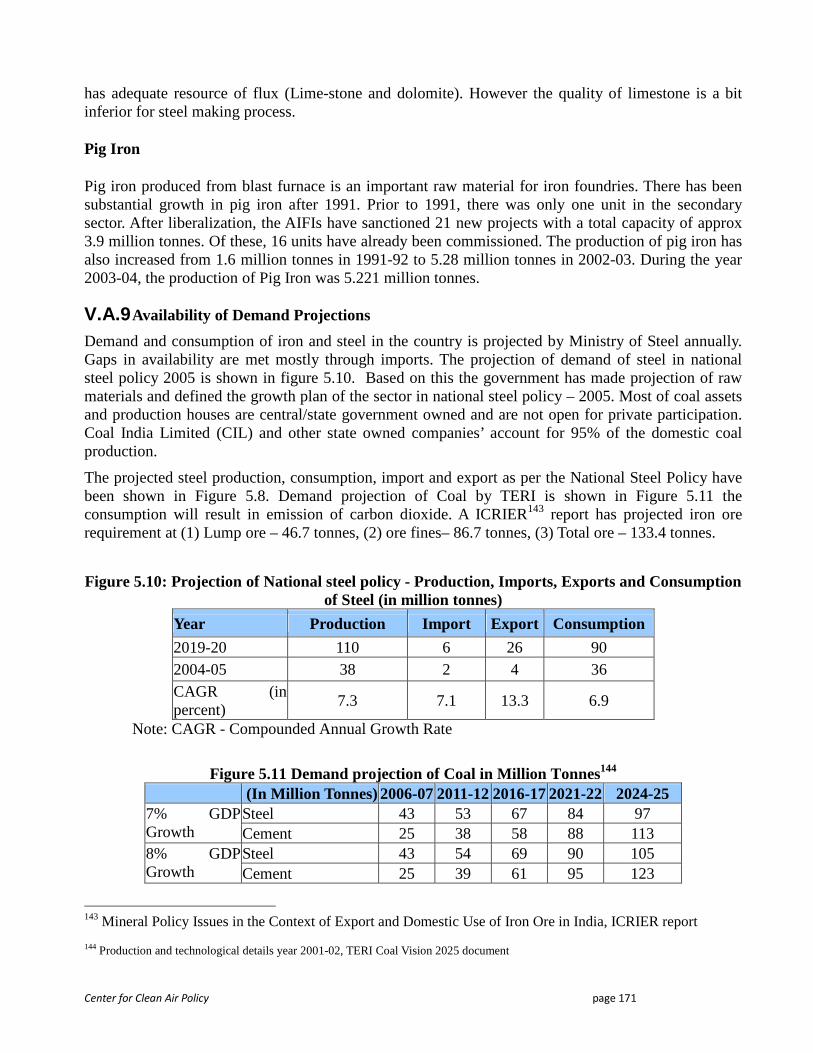
Center for Clean Air Policy page 171
has adequate resource of flux (Lime-stone and dolomite). However the quality of limestone is a bit inferior for steel making process.
Pig Iron
Pig iron produced from blast furnace is an important raw material for iron foundries. There has been substantial growth in pig iron after 1991. Prior to 1991, there was only one unit in the secondary sector. After liberalization, the AIFIs have sanctioned 21 new projects with a total capacity of approx 3.9 million tonnes. Of these, 16 units have already been commissioned. The production of pig iron has also increased from 1.6 million tonnes in 1991-92 to 5.28 million tonnes in 2002-03. During the year 2003-04, the production of Pig Iron was 5.221 million tonnes.
V.A.9 Availability of Demand Projections
Demand and consumption of iron and steel in the country is projected by Ministry of Steel annually. Gaps in availability are met mostly through imports. The projection of demand of steel in national steel policy 2005 is shown in figure 5.10. Based on this the government has made projection of raw materials and defined the growth plan of the sector in national steel policy – 2005. Most of coal assets and production houses are central/state government owned and are not open for private participation. Coal India Limited (CIL) and other state owned companies’ account for 95% of the domestic coal production.
The projected steel production, consumption, import and export as per the National Steel Policy have been shown in Figure 5.8. Demand projection of Coal by TERI is shown in Figure 5.11 the consumption will result in emission of carbon dioxide. A ICRIER143 report has projected iron ore requirement at (1) Lump ore – 46.7 tonnes, (2) ore fines– 86.7 tonnes, (3) Total ore – 133.4 tonnes.
Figure 5.10: Projection of National steel policy - Production, Imports, Exports and Consumption of Steel (in million tonnes)
Year Production Import Export Consumption
2019-20 110 6 26 90 2004-05 38 2 4 36 CAGR (in percent)
7.3 7.1 13.3 6.9
Note: CAGR - Compounded Annual Growth Rate
Figure 5.11 Demand projection of Coal in Million Tonnes144
(In Million Tonnes) 2006-07 2011-12 2016-17 2021-22 2024-25 Steel 43 53 67 84 97 7% GDP
Growth Cement 25 38 58 88 113 Steel 43 54 69 90 105 8% GDP
Growth Cement 25 39 61 95 123
143 Mineral Policy Issues in the Context of Export and Domestic Use of Iron Ore in India, ICRIER report 144 Production and technological details year 2001-02, TERI Coal Vision 2025 document
Center for Clean Air Policy page 172
The development path of India is based on harnessing the domestic resource endowments.
The New Industrial policy regime
The New Industrial policy has opened up the iron and steel sector for private investment by (a) removing it from the list of industries reserved for public sector and (b) exempting it from compulsory licensing. Imports of foreign technology (c) foreign direct investment are freely permitted up to certain limits under an automatic route. Ministry of Steel plays the role of facilitator, providing broad directions and assistance to new and existing steel plants in the liberalized scenario.
V.B Assumptions and Uncertainties
V.B.1 Assumptions The mitigation plans are considered on the basis of (1) least cost methods of mitigation and scope of improvement in mitigation parameter. (2) Commercially viable state of art technology – The performance of the technology has been established and accepted by the market. (3) Maintenance capability and the expected life cycle of the technology – The product cycle of automation equipment getting shorter as is observed, and spares availability becomes and issue (4) Peripheral development – the steel plant can take up program to enhance ecosystem for additional carbon sinks under corporate social responsibility (5) Best operation and maintenance practices as specified in ISO scheme (6) Improved process control systems to enhance energy efficiency. (7) Special drive for harnessing waste heat and energy being lost to environment. (8) Innovative application of renewable energy (e.g. installing solar cells at the roof of industrial sheds). (9) IGCC in captive power plant. The steel units in Japan, Western Europe have developed many technologies accruing energy efficiency and GHG mitigation. Ranking and incorporating these technologies in Indian plants is a complex issue. The selection process of technologies for incorporation should consider (1) Technology profile and equipments available in the unit (2) History of operation, raw materials, and other resources available, and profitability (3) Life cycle of the technology and its potential to yield benefit in the concerned units (4) maintainability and spares availability (5) cost consideration – the incorporation of technology should not result in loss of competitiveness.
V.B.2 Uncertainties The recent downturns in the global market have indicated the vulnerability in the total supply chain. For manufacturing 1 ton of steel it requires 4 ton of raw materials, and they should be available at the site. Steel industries have a high momentum and it takes time in reacting to market. India can consider meeting self sufficiency of national steel demand through indigenous production at an optimum level of say 90% (decided by volume of global steel trade.). There are concerns about finiteness of the raw material reserve. Then there is growing demand of imported coking coal. The cost of import is dependent on Baltic dry index. India has to strategize to control impact of the fluctuating shipping costs and smooth up logistics. The development of indigenous technology of DRI process like COREX and Circofer cannot be forecasted. The kiln type DR production accounts for 43% of the iron making. The technology development for mitigation of GHG emission in this area is relatively slow.
V.B.3 SWOT Analysis The SWOT Analysis as documented in national steel policy 2005 has been reviewed and adapted for
Center for Clean Air Policy page 173
the report. The adaptation from National Steel Policy 2005, and analysis is as follows: Strengths
a. Available reserves of iron ore, fluxes, and non-coking coal. All the major steel units have captive iron ore mines, and some of them have captive coalmines. The flux available for the BOF process is not of desired quality.
b. India has history of one hundred years of steel making. The manpower employed per million tones is higher than those in advanced countries. Availability of quality manpower can be assumed
c. Mature production base and existing infrastructure for brown- field expansion. d. All the integrated steel plants have captive power plants, which provides sufficient power
requirement of the units. All steel plants are connected with the national power grid to operate heavy-duty rolling mills. The grid connectivity facilitates transfer of surplus power of captive generation to sister unit in the industry using power-wheeling provision of national grid.
e. SAIL, Tata Steel, and ESSAR steel have established R&D Centres. Mr. L N Mittal is Chairman of ArcelorMittal, and Tata Steel has majority stake in CORUS. These companies have state of art R&D facility. India can benefit from these connections.
f. Integrated Steel Plant Have good sales and marketing division to efficiently service the demand of each region.
g. India have established consultant MECON, M N Dastur Co, and equipment manufacturing set up with HEC, Ranchi, L&T etc.
Weaknesses
a. Due to unscientific mining, the quality of raw material received is inconsistent. Thus the benefits of raw material blending are not fully accrued.
b. Low productivity and yield from the technologically obsolete process e.g. open-hearth furnace, ingot casting. The government is encouraging units to replace with efficient technology. (Open hearth process accounts for 2% steel production and Continuous casting is applied in 70% units
c. The dependence on coal supplies from overseas supplier for coking coal. d. The investment in the R&D of steel sector is comparatively low. Development of indigenous
technology is lagging in comparison to those in the developed country. Thus the project costs tend to be high. There is no mention of climate change in the national steel policy.
e. The cost of short term and long-term credits are high. f. Integrated steel plants and coalmines are located in the eastern region of India. Similarly the
major ore mines are located in the state of Jharkhand, Orissa, and Chattisgarh. This creates pressure on logistics of supply chain. (For producing 1 ton of steel 4 tons of raw materials are needed; hence strong infrastructure support is needed.)
g. Indian coal has very high ash content. The relative alumina content in Indian ore and coal ash is also high.
h. There are large numbers of un-0organized secondary steel producers. i. There are scalability issues with steel plants. There are limitations of space in old plants
constraining incorporation of new technology. j. Approximately 43% of Iron productions are from Kiln type DRI. R&D in this sphere is weak. k. Due to employment strategies made during early seventies, the labour productivity is low.
Opportunities
Center for Clean Air Policy page 174
a. Steel consumption in India is growing at a rate, more than 10%. This trend will continue to sustain economic growth. The eleventh five-year plan has assigned major thrust on infrastructure (power sector, port, energy, rural development under Bharat Nirman, railways and transportation, and roads) development, and a total spending expected to be in tune of approximately US$ 500 billion by the year 2012.
b. Indian steel industry is open to the global market both for Import and Exports. c. There are recessions in the global economy, and steel manufacturer may push their steel
product to Indian market. There may be opportunity to use low cost steel in the growth in rural area. This will also enable development of infrastructure. However quality aspect should be adhered to for sectors such as power, ports, roads, rail transports etc.
d. It is desired that the Greenfield integrated iron and steel industry have high capacity captive thermal power plant, using IGCC technology. This is suggested to mitigate power congestion in the grid. The saving in gaseous energy at various points in the plant can be used for thermal power plant. IGCC is proposed because the coal chemicals in volatile matter extraction can be connected with coke oven network. Additional Oxygen can be used for oxy-fuel firing. Additional gases generated from IGCC can be used for coal dust injection. The proposed scheme is complex (IGCC scheme require consistent Calorific value of fuel). Higher capacity captive power generation may consider application of CCS technology.
e. The defined missions “Enhanced Energy Efficiency” of National Action Plan for Climate Change will guide the development of sector, while addressing climate change concerns. Indian companies have opportunities to progress with low carbon technologies. The growth in production capacity in steel sector is expected to be more than 100% in next decade, and they can use state of art technology. There are potential to use carbon leakage option, expected to be strategy in few developed countries.
f. There is significant scope in enhancing production efficiency. There are more than 2000 steel grades. Steel industry can play its role as solution provider with development of application specific low alloy steel for industrial application such as boiler of thermal power plant, bridge, automotive body etc. “The WSA proposes a life cycle assessment (LCA) approach to measure the potential greenhouse gas impacts from all stages of manufacture, product use and end-of-life.”
g. It is reported that “International Coal Ventures”, a special purpose vehicle formed by major steel and power PSUs to scout for coal properties abroad, would soon be incorporated as a company with an authorized capital of INR 35 billion, Similarly Tata steel is investing iron ore mines in other countries.
h. Renovation and Modernization of Kiln based DRI process. i. Adequate R&D support is needed for underground coal gasification opportunities. j. Improvement in Refractory materials.
Threats a. The raw material (coking coal) prices needed for the Steel production is very volatile with
rising trend. Current shortage of inputs has pushed up the raw material costs for the steel industry.
b. The government has to peg the prices of steel to control inflation. There are regulatory issues to safeguard against abnormal market situation.
c. In future, China will be a net exporter of steel. d. A significant percentage of steel in India is being produced through Direct reduction process,
i.e. sponge iron followed by steel making in EAF &/or induction furnace. These industries
Center for Clean Air Policy page 175
especially low capacity units may not be able to incorporate low carbon technology without losing competitiveness.
e. According to the WSA are the lack of willingness of advanced steel companies to supply technologies, intellectual property rights and fears for undue subsidies of plants.145
f. Slow Growth in the infrastructure and logistics support for raw materials and finished product in the country will impede development in steel sector.
g. India exports Iron ore to other countries in large quantity. The NCAER study indicates that at the current rate (approximately 100 mT) of export of the rich and medium grade iron ore reserve will be depleted significantly.
h. More than 100% production growth is expected from green-field units. This will need extensive land reclamation. The land reclamation is also associated with GHG emission.
V.C Mitigation Options for the Steel Industry
Steel industry is a highly energy intensive industry. It consumes high quality coking coal, and electricity generated from thermal power plant. Each of the processes of steel plant operates at high temperature i.e. in the range of 1000 degree centigrade and 1700 degree centigrade. There are many areas of heat losses (with a potential for energy harnessing) and it means superfluous CO2 emission. The current steel consumption in India is 49 MMT, and by 2020 it is expected to increase to 90 MMT. The cumulative CO2 emission from steel sector will continue to increase with increase in steel production. India should focus on reducing specific energy consumption per ton of steel produced and associated carbon dioxide emission. The other item of focus is NOx emission from burners. Average CO2 emission in Indian steel plant is 2.8T of carbon dioxide/ per ton of steel, and in Raahe pant, Finland it is 1.9 T/ per ton of steel. Assuming value of 1.9 being high due to high ash, we can select an intermediate target for reduction of emission. The CO2 emission for 110 million tonnes of steel production at emission rate per ton of steel at a value of 2.8, 2.2, 1.9 will be 308, 242, 209 million tonnes of CO2 respectively. The applicable strategy in India is to focus on mitigation of CO2 emission per tonne of crude steel. Energy consumption per tonnes of crude steel varies from plant to plant depending on (1) process technology used (2) quality of raw material used (3) effectiveness of instrumentation; automation, control and IT used in the unit (5) market for the product. As CO2
emission is not used as a control parameter, the energy consumption per tonnes of crude steel is considered an appropriate control parameter. The mitigation of carbon dioxide emission can be achieved by use of better production technologies also, which effectively reduces CO2 emission, and proper control of processes of iron and steel making. The average energy consumption of Steel Authority of India is 7.16 Gcal per tonne of crude steel as indicated in recent annual report..
Total Energy cost in the integrated steel complex accounts for approximately 20% of total production cost. The strategy for curtailing production cost has been focused on optimized and integrated energy saving technologies, and energy management system for the supply, generation, consumption, maximized utilization of energy, and devising innovative methods to utilize waste heat in the process cycle. The energy consumption accounting and management to reduce energy consumption (Gcal/ Ton of Crude steel) has been in vogue since long. The energy conservation act 2001 provides legal mandate for implementation of the energy efficiency measures. The figure 5.12 indicates the international benchmark of energy consumption and carbon dioxide emission per tonne of crude steel.
Figure 5.12: CO2 Emissions from Steel Plants & Sp. Energy Consumption per tonne of steel146
145 http://www.clingendael.nl/publications/2009/20090226_ciep_corus.pdf 146 http://www.teriin.org/events/docs/canada%20minister/Steel.pdf
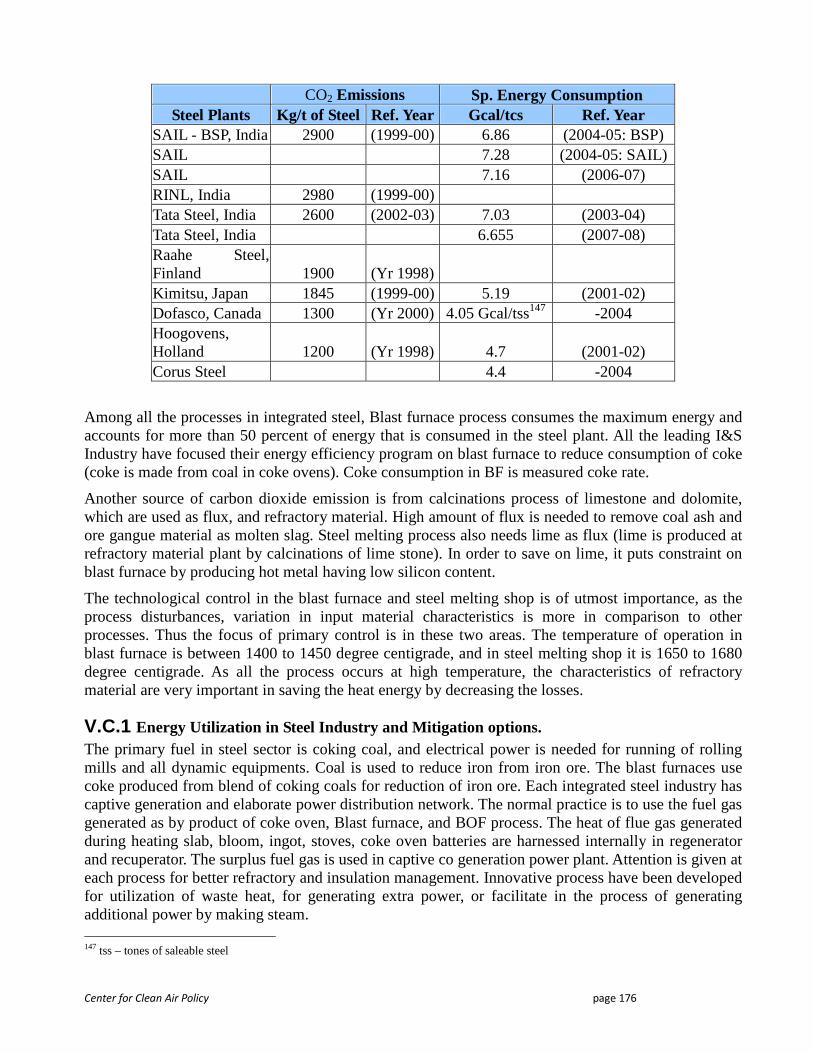
Center for Clean Air Policy page 176
CO2 Emissions Sp. Energy Consumption Steel Plants Kg/t of Steel Ref. Year Gcal/tcs Ref. Year
SAIL - BSP, India 2900 (1999-00) 6.86 (2004-05: BSP) SAIL 7.28 (2004-05: SAIL) SAIL 7.16 (2006-07) RINL, India 2980 (1999-00) Tata Steel, India 2600 (2002-03) 7.03 (2003-04) Tata Steel, India 6.655 (2007-08) Raahe Steel, Finland 1900 (Yr 1998) Kimitsu, Japan 1845 (1999-00) 5.19 (2001-02) Dofasco, Canada 1300 (Yr 2000) 4.05 Gcal/tss147 -2004 Hoogovens, Holland 1200 (Yr 1998) 4.7 (2001-02) Corus Steel 4.4 -2004
Among all the processes in integrated steel, Blast furnace process consumes the maximum energy and accounts for more than 50 percent of energy that is consumed in the steel plant. All the leading I&S Industry have focused their energy efficiency program on blast furnace to reduce consumption of coke (coke is made from coal in coke ovens). Coke consumption in BF is measured coke rate.
Another source of carbon dioxide emission is from calcinations process of limestone and dolomite, which are used as flux, and refractory material. High amount of flux is needed to remove coal ash and ore gangue material as molten slag. Steel melting process also needs lime as flux (lime is produced at refractory material plant by calcinations of lime stone). In order to save on lime, it puts constraint on blast furnace by producing hot metal having low silicon content.
The technological control in the blast furnace and steel melting shop is of utmost importance, as the process disturbances, variation in input material characteristics is more in comparison to other processes. Thus the focus of primary control is in these two areas. The temperature of operation in blast furnace is between 1400 to 1450 degree centigrade, and in steel melting shop it is 1650 to 1680 degree centigrade. As all the process occurs at high temperature, the characteristics of refractory material are very important in saving the heat energy by decreasing the losses.
V.C.1 Energy Utilization in Steel Industry and Mitigation options. The primary fuel in steel sector is coking coal, and electrical power is needed for running of rolling mills and all dynamic equipments. Coal is used to reduce iron from iron ore. The blast furnaces use coke produced from blend of coking coals for reduction of iron ore. Each integrated steel industry has captive generation and elaborate power distribution network. The normal practice is to use the fuel gas generated as by product of coke oven, Blast furnace, and BOF process. The heat of flue gas generated during heating slab, bloom, ingot, stoves, coke oven batteries are harnessed internally in regenerator and recuperator. The surplus fuel gas is used in captive co generation power plant. Attention is given at each process for better refractory and insulation management. Innovative process have been developed for utilization of waste heat, for generating extra power, or facilitate in the process of generating additional power by making steam. 147 tss – tones of saleable steel
Center for Clean Air Policy page 177
The steel industry is a continuous process with periodic maintenance program as a preventive measure. The focus is absolute capacity utilization, reduce process cycle time, and avoid unplanned maintenance due to breakdown. If there is delay in operation in coke ovens, or break down in blast furnace, increase in cycle time of BOF process, the available quantity of fuel goes down significantly. Such events also increase specific energy consumption. The effective use of secondary fuel and recovery of surplus energy can be achieved by a supervisory optimization computer system facilitated by rugged automation system. The aim of automation system is to control process operation in optimum level and establish coordination between different processes at the same time. The heat/ energy recovery, from flue gas is an important part of energy saving. The coal dust injection using indigenous coal in blast furnace can save on imported coking coal. The direct reduced iron (DRI) process use indigenous non-coking coal to produce sponge iron from the iron ore. The research and development are in progress to make the process more efficient and improve upon rate of production. The sponge iron is made into steel by smelting reduction or electric arc furnace/ induction furnace or BOF. There have been significant developments in DRI process such as COREX process (VAI & Siemens) and Circofer (Outokompu, Finland). The developers of Circofer process claim a changeover in steelmaking is possible from the traditional route of coke/ ore agglomeration/blast furnace/oxygen converter to the alternative routes Circofer/ Hismelt /oxygen converter or Circofer/EAF. Circofer process produces a pure CO2 stream, which can be captured and stored at geological site as perceived by CCS technology, once reliable sequestration methods are established.
The continuous casting technology is used commercially since forty years, and the technology is being upgraded continuously. The technology of casting of thin slab/ strip (recent development) from continuous casting route has been established. This will substantially reduce electricity and fuel consumption in hot rolling mills.
Development of combined cycle power station has to be pursued for captive power generation. Blast furnace gas on its own cannot be used for combined cycle power generation due to low calorific value. A mixed gas or IGCC can be planned for captive generation while taking care to supply constant CV gas. Any saving in secondary fuel can be diverted to co-generation power plant.
All steel plants import power from national grid. The captive generation is synchronized with national grid. Care is taken such that the plant power factor is near about ideal value of 1. There are electrical schemes like capacitor bank to keep the power factor at the optimum level.
The existing plants have a big scope of improvement in energy efficiency. Use of instrumentation, automation, IT, and raw material quality control can significantly mitigate carbon emission. The incorporation of modern automation requires appropriate re-engineering to make the scheme viable. The optimization system, gas and utility supervisory distribution system, enterprise resource planning can enhance energy efficiency significantly.
A market-based mechanism will be required to enhance cost effectiveness of improvement in energy efficiency, thereby mitigating emissions.
India has a co-chair status in Steel Task Force in Asia pacific partnership on clean development & Climate. The proposed project candidates by India are as follows;
1. Heat recovery from Sinter Cooler and other energy optimizing schemes in Sinter Plant
Center for Clean Air Policy page 178
2. Hot charging of semi-finished steel (Blooms/Slabs) 3. Heat recovery from hot BF stoves’ exhaust/flues 4. Sensible heat recovery from LD/BOF gas. 5. Application of regenerative burners in iron and steel making process 6. Recovery of energy from BF top gas pressure 7. Secondary emission control in SMS (BOF and EAFs) 8. Improving design and operation of coke oven effluent (BOD) plant 9. Recycling of steel plant dust and sludge using rotary hearth furnace 10. Recovery of iron ore from slime / tailing of iron ore washeries 11. Treatment and disposal of used PCB based transformer oil. 12. Technology know-how of new design ESP to control particulate matter emission from stack to
20–30 mg/Nm3 (for Sinter Plant) 13. Energy consumption and emission control in sponge iron plants (SIP) (air pollution)—
SOTACT 14. Integration of SIP and induction furnace (IF) technologies (SOTACT) 15. Involvement of R & D engineers in pilot / commercial plant operation of SCOPE—21 coke-
making processes
V.C.2 Up-gradation of sponge iron plant and making the technology indigenous
In view of increase in raw material prices needed for producing iron, the operation of many small sponge iron units will not be able to sustain, and will continue to operate inefficiently. The Government should formulate a policy to encourage mergers, up-gradation with current state of art by enhancing their capacities. R&D on Kiln based direct reduced iron process should be stressed and the development of this technology should be given adequate attention. Indian coal has high ash content (35 – 45%), high ash fusion temperature, high reactivity and low sulphur content (0.5%). Due to high coal reactivity of Indian coal the COREX process with indigenous coal should be commercially viable.
Energy efficiency in Steel Sector
Preventive maintenance is the key activity in a steel plant to increase equipment, process availability, and capacity utilization. The preventive maintenance must be effective to avoid breakdown maintenance and may be leading to accident. Preventive maintenance tasks are regular features, and maintenance of capital intensive and heavy equipments are done during capital repairs. These are categorized depending on the equipment life, reengineering and requirement of modernization. The Capital repair and maintenance activities must be backed by timely spares availability, drawing, and plans to schedule maintenance. These activities are computerized and also known as computerized maintenance management system. The maintenance is an essential item to increase life cycle of the equipments, and effective utilization. The government can consider a directive on the maintenance in energy conservation act.
The guarantee of the health of process equipment is followed with the process and production control of the industry. The production compliance with the market demand is necessary such that the production efforts accrues revenue and ensure quick return on working expenses. The steel plant consists of multiple processes operating synchronously with upstream and downstream process to ensure timely processing of throughput from upstream process to provide input for downstream process. The efficient working of internal supply chain facilitates substantial energy savings. The instrumentation and automation scheme are needed to control the individual process at optimum level
Center for Clean Air Policy page 179
and IT is needed to establish efficient supply chain for the entire process and guide production according to plan. The use of IT backed enterprise resource planning; optimisation system (Supervisory Computer) ensures best use of energy, power and process inputs. The steel plant produces fuel gas as a by product, and these energy utilization can be done optimally.
The steel plant management try hard to use uniform quality of raw materials having specific size distribution profile in iron making zone. In rest of the process they exercise their control over the inputs. This is desired by process manager to operate the process at optimum level and ensuring mitigation of power and energy.
In addition to good maintenance and operation practices there is a scope of innovative technology to mitigate energy consumption and there by reduce carbon emission to atmosphere. The carbon emissions in Indian plants are higher than those in the developed countries. Hence, the estimates stated in figure 5.13, needs revision in the context of Indian coal. There are various schemes to harness waste energy. There have been technology developments to mitigate emissions in steel industry. Each technology has a cost. These technologies have been sorted according cost of retrofit per giga joules. It is proposed the least cost technologies be pursued on priority. These schemes should weigh for complexity of technology and feasibility of maintenance.
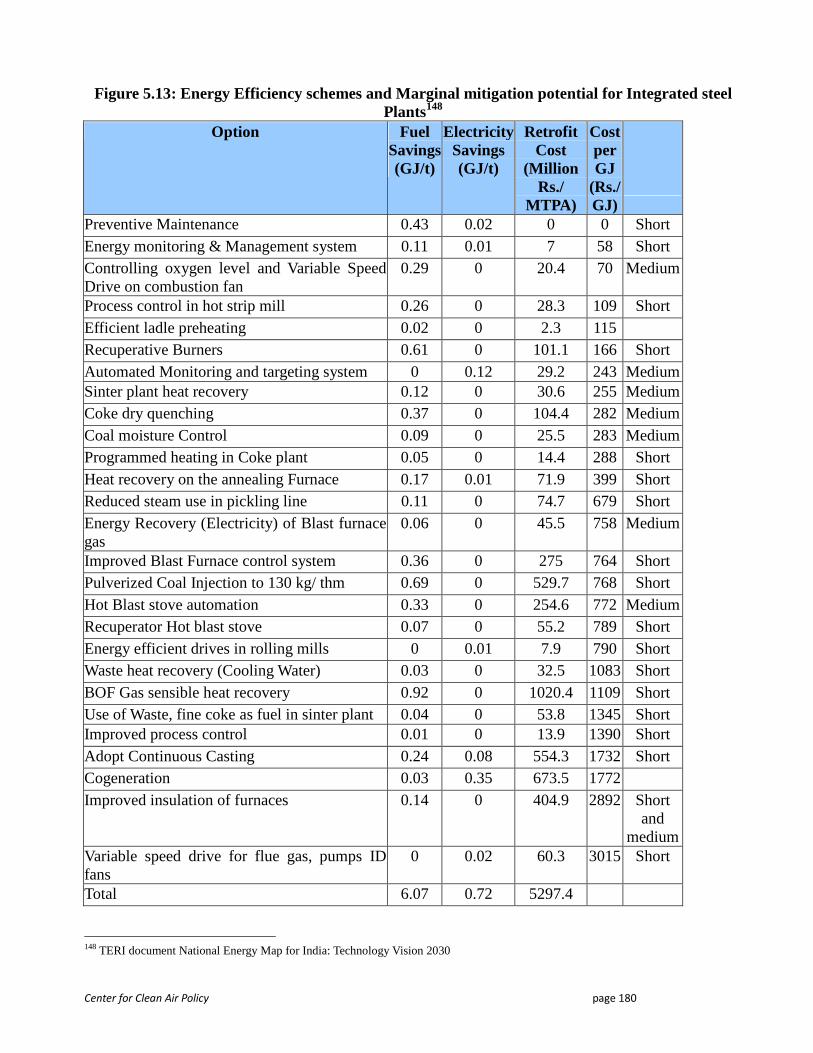
Center for Clean Air Policy page 180
Figure 5.13: Energy Efficiency schemes and Marginal mitigation potential for Integrated steel Plants148
Option Fuel Savings (GJ/t)
Electrici ty Savings (GJ/t)
Retrofit Cost
(Million Rs./
MTPA)
Cost per GJ
(Rs./GJ)
Preventive Maintenance 0.43 0.02 0 0 Short Energy monitoring & Management system 0.11 0.01 7 58 Short Controlling oxygen level and Variable Speed Drive on combustion fan
0.29 0 20.4 70 Medium
Process control in hot strip mill 0.26 0 28.3 109 Short Efficient ladle preheating 0.02 0 2.3 115 Recuperative Burners 0.61 0 101.1 166 Short Automated Monitoring and targeting system 0 0.12 29.2 243 Medium Sinter plant heat recovery 0.12 0 30.6 255 Medium Coke dry quenching 0.37 0 104.4 282 Medium Coal moisture Control 0.09 0 25.5 283 Medium Programmed heating in Coke plant 0.05 0 14.4 288 Short Heat recovery on the annealing Furnace 0.17 0.01 71.9 399 Short Reduced steam use in pickling line 0.11 0 74.7 679 Short Energy Recovery (Electricity) of Blast furnace gas
0.06 0 45.5 758 Medium
Improved Blast Furnace control system 0.36 0 275 764 Short Pulverized Coal Injection to 130 kg/ thm 0.69 0 529.7 768 Short Hot Blast stove automation 0.33 0 254.6 772 Medium Recuperator Hot blast stove 0.07 0 55.2 789 Short Energy efficient drives in rolling mills 0 0.01 7.9 790 Short Waste heat recovery (Cooling Water) 0.03 0 32.5 1083 Short BOF Gas sensible heat recovery 0.92 0 1020.4 1109 Short Use of Waste, fine coke as fuel in sinter plant 0.04 0 53.8 1345 Short Improved process control 0.01 0 13.9 1390 Short Adopt Continuous Casting 0.24 0.08 554.3 1732 Short Cogeneration 0.03 0.35 673.5 1772 Improved insulation of furnaces 0.14 0 404.9 2892 Short
and medium
Variable speed drive for flue gas, pumps ID fans
0 0.02 60.3 3015 Short
Total 6.07 0.72 5297.4
148 TERI document National Energy Map for India: Technology Vision 2030
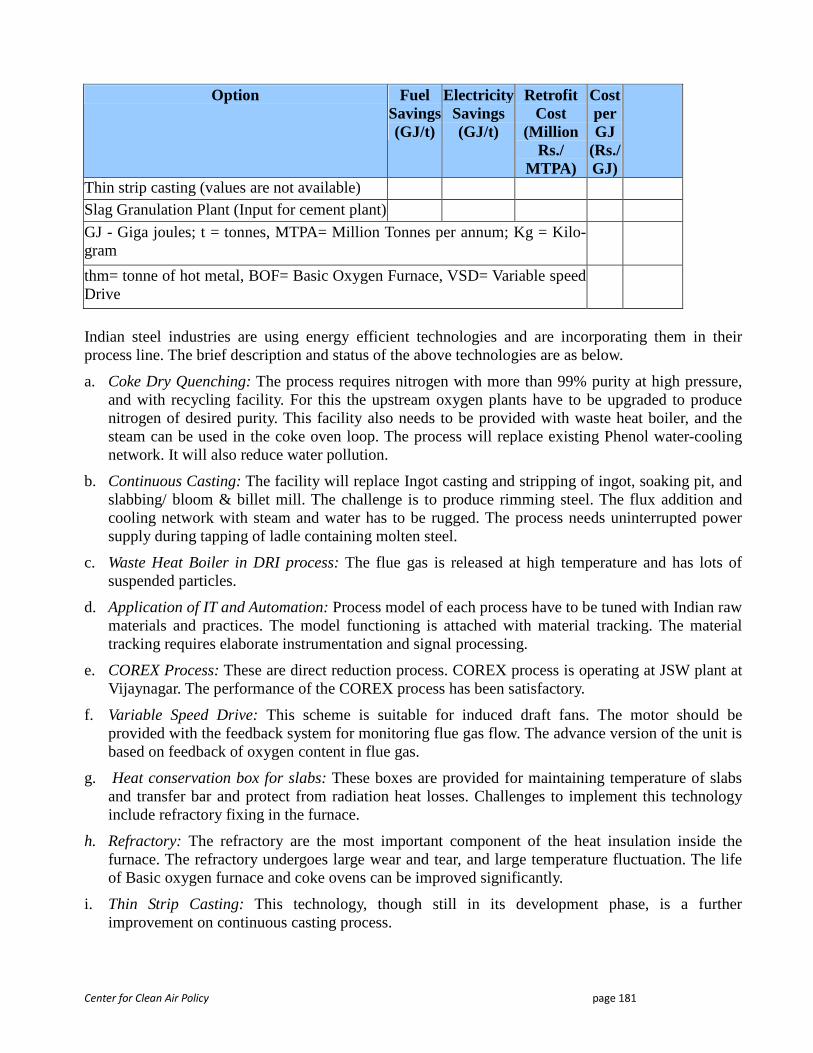
Center for Clean Air Policy page 181
Option Fuel Savings (GJ/t)
Electrici ty Savings (GJ/t)
Retrofit Cost
(Million Rs./
MTPA)
Cost per GJ
(Rs./GJ)
Thin strip casting (values are not available) Slag Granulation Plant (Input for cement plant)
GJ - Giga joules; t = tonnes, MTPA= Million Tonnes per annum; Kg = Kilo-gram
thm= tonne of hot metal, BOF= Basic Oxygen Furnace, VSD= Variable speed Drive
Indian steel industries are using energy efficient technologies and are incorporating them in their process line. The brief description and status of the above technologies are as below.
a. Coke Dry Quenching: The process requires nitrogen with more than 99% purity at high pressure, and with recycling facility. For this the upstream oxygen plants have to be upgraded to produce nitrogen of desired purity. This facility also needs to be provided with waste heat boiler, and the steam can be used in the coke oven loop. The process will replace existing Phenol water-cooling network. It will also reduce water pollution.
b. Continuous Casting: The facility will replace Ingot casting and stripping of ingot, soaking pit, and slabbing/ bloom & billet mill. The challenge is to produce rimming steel. The flux addition and cooling network with steam and water has to be rugged. The process needs uninterrupted power supply during tapping of ladle containing molten steel.
c. Waste Heat Boiler in DRI process: The flue gas is released at high temperature and has lots of suspended particles.
d. Application of IT and Automation: Process model of each process have to be tuned with Indian raw materials and practices. The model functioning is attached with material tracking. The material tracking requires elaborate instrumentation and signal processing.
e. COREX Process: These are direct reduction process. COREX process is operating at JSW plant at Vijaynagar. The performance of the COREX process has been satisfactory.
f. Variable Speed Drive: This scheme is suitable for induced draft fans. The motor should be provided with the feedback system for monitoring flue gas flow. The advance version of the unit is based on feedback of oxygen content in flue gas.
g. Heat conservation box for slabs: These boxes are provided for maintaining temperature of slabs and transfer bar and protect from radiation heat losses. Challenges to implement this technology include refractory fixing in the furnace.
h. Refractory: The refractory are the most important component of the heat insulation inside the furnace. The refractory undergoes large wear and tear, and large temperature fluctuation. The life of Basic oxygen furnace and coke ovens can be improved significantly.
i. Thin Strip Casting: This technology, though still in its development phase, is a further improvement on continuous casting process.
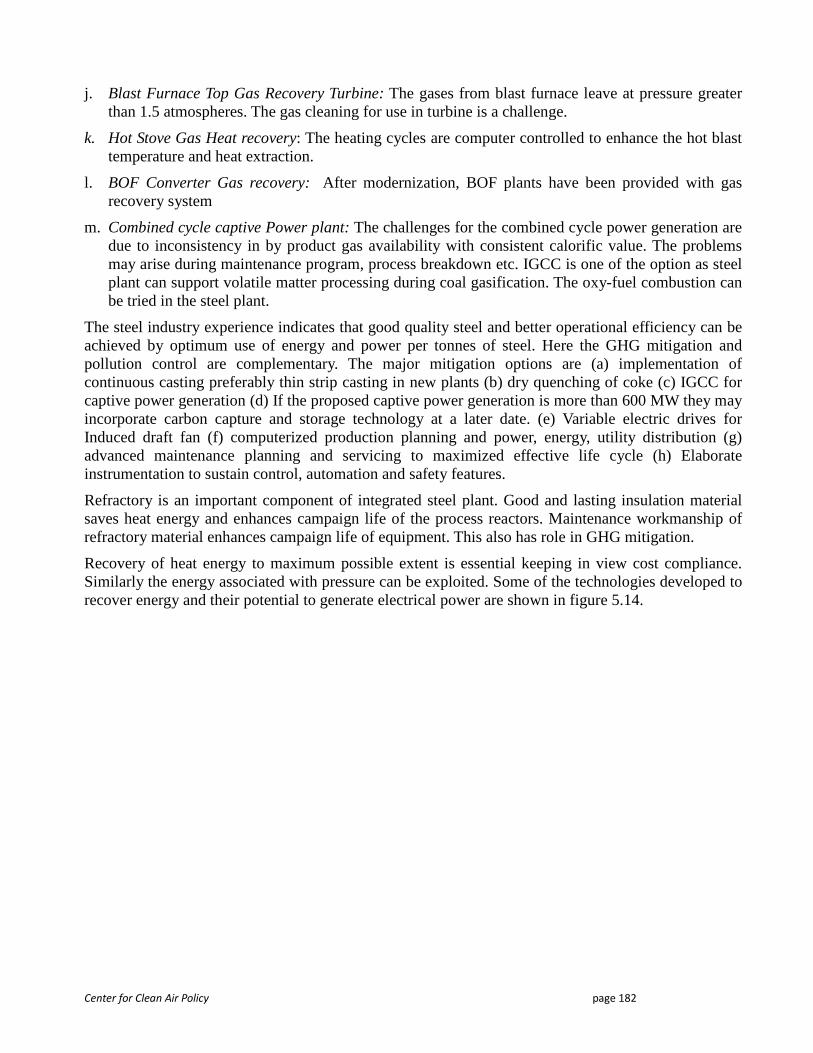
Center for Clean Air Policy page 182
j. Blast Furnace Top Gas Recovery Turbine: The gases from blast furnace leave at pressure greater than 1.5 atmospheres. The gas cleaning for use in turbine is a challenge.
k. Hot Stove Gas Heat recovery: The heating cycles are computer controlled to enhance the hot blast temperature and heat extraction.
l. BOF Converter Gas recovery: After modernization, BOF plants have been provided with gas recovery system
m. Combined cycle captive Power plant: The challenges for the combined cycle power generation are due to inconsistency in by product gas availability with consistent calorific value. The problems may arise during maintenance program, process breakdown etc. IGCC is one of the option as steel plant can support volatile matter processing during coal gasification. The oxy-fuel combustion can be tried in the steel plant.
The steel industry experience indicates that good quality steel and better operational efficiency can be achieved by optimum use of energy and power per tonnes of steel. Here the GHG mitigation and pollution control are complementary. The major mitigation options are (a) implementation of continuous casting preferably thin strip casting in new plants (b) dry quenching of coke (c) IGCC for captive power generation (d) If the proposed captive power generation is more than 600 MW they may incorporate carbon capture and storage technology at a later date. (e) Variable electric drives for Induced draft fan (f) computerized production planning and power, energy, utility distribution (g) advanced maintenance planning and servicing to maximized effective life cycle (h) Elaborate instrumentation to sustain control, automation and safety features.
Refractory is an important component of integrated steel plant. Good and lasting insulation material saves heat energy and enhances campaign life of the process reactors. Maintenance workmanship of refractory material enhances campaign life of equipment. This also has role in GHG mitigation.
Recovery of heat energy to maximum possible extent is essential keeping in view cost compliance. Similarly the energy associated with pressure can be exploited. Some of the technologies developed to recover energy and their potential to generate electrical power are shown in figure 5.14.
Center for Clean Air Policy page 183
Figure: 5.14 Waste energy recovery systems149 Technology Potential energy saved Blast Furnace Top Gas Recovery Turbine
Up to 10.5 MW
Hot Stove Gas Heat recovery Up to 10 MW BOF Converter Gas recovery Up to 16 MW Heat conservation box for slabs Up to 15 MW Reheating Furnace Heat recovery Boiler
20 MW
An integrated steel plant is operating continuously in 24 hours and 7 days week mode. The idling of any process results in radiation heat losses, electricity consumption, which has to be avoided. The facilities must operate continuously. The precaution mentioned facilitates optimal use of resources, power and energy, utilities. In order to ensure uninterrupted working of all features, the modern plants are using instrumentation, automation and IT extensively. The structure of IT and process control is being updated according to development in automation technology; hardware, network and software e.g. bus communication networking, wireless communication, power of hardware. The automation structure was divided in four level of control. Each level is interconnected.
Process Control level/ Regulation control: At this level, movement of raw material/ input is monitored, and there is elaborate instrumentation to measure and detect process parameter, controllers (control loops) are there to control the flow of process. Display systems are provided to help the operator. The Program Logic Controller are provided to regulate and control the process interlocks based on empirical equations. Digital control system are there to control front end process controller.
Optimization: At this level the process data and material tracking data are obtained from the process control level and an optimization model with adaptive features processes the data to establish appropriate setting of the controllers in the regulation level. The model operation is guided by the material tracking. The system provides interactive terminal to the operator.
Zonal and Energy, Power and Utility Control: This level tries to establish inter process connectivity and facilitates the material tracking, accounting of raw material, throughput accounting, storage yards accounting, maintains energy, power, utility balancing. At this level model computation is to establish optimality in inter process energy distribution. Management Information System/ Enterprise Resource Planning: At this level Finance, materials, Projects, Maintenance, Zonal Control System interact to facilitate smooth and profitable running of plant. Incase of holding company another control level can be added to establish interplant coordination. In these reliability of networking is essential.
V.C.3 Other Environmental Parameters Steel industry consumes a large quantity of water for cooling purposes. The vapour generation (GHG 149 Voest Alpine document
Center for Clean Air Policy page 184
gas) and water pollution are associated hazards. The slag is generated in blast furnace and steel melting shop. Blast furnaces slags are used for making slag granules as input for cement plant. Japanese steel plants are conducting fundamental research on cooling steel slag with Carbon dioxide and use slag for marine purposes. The steel industry due to old burner design emits other GHG like NOX, SOx. Some of them can be controlled by improved burner design.
V.C.4 Barriers for Adopting Modern and Low carbon technology in Iron & Steel Sector
a) Technical Barrier
Indian coal has high as content. Quality of Steel melting grade limestone is below par. For manufacturing one ton of steel four ton of raw materials have to be transported.
The Renovation and Modernization of Kiln type DRI furnace is a challenging task, due to lack of R&D support,
Application of low carbon and energy efficient technology in old plant is difficult due to extensive re-engineering requirement.
Maintenance of New technology with existing manpower requires extensive capacity building, and hence there is a resistance to change. The incorporation of new technologies in existing units is associated with initial maintenance problems. These teething problems are seldom observed in the Greenfield units. The scheme should have adequate commissioning and operational spares.
Spares availability of equipments installed during renovation and modernization.
The demand of quality steel will increase, and product marketing will need life cycle assessment. Hence the need of modernization of existing unit will become mandatory.
The workmen, supervisory staff, management of steel units may not be aware of strategizing application of energy efficient technology in their plant.
b) Policy Related During the volatile market situation the trade policies require periodic review with fiscal rates alteration.
The Intellectual Property Rights are getting more stringent. These may generate barriers for adaptation of affordable low carbon technology to Indian industries.
There are large numbers of secondary steel unit, and they are unorganised. The R&D supports for these units are essential. A policy initiative is essential as more then 40% DR iron is received from Kiln type DR process.
Land reclamations also generate GHG gas, Environment Impact assessment may consider the fact and Ministry of Environment may issue guidelines on land reclamation.
The R&D activity has to be promoted, the government should think of incentive scheme to promote it.
Prudent use of ferrous scrap, and slag will find increased application. Incentive for scrap collection in scientific way should be promoted.
Rural consumption of steel has to be augmented. This may result in subsidy scheme.
Indigenous manufacturing base for high tech product needed for Automation in the industry. The product should be compatible to local environmental condition.
Center for Clean Air Policy page 185
c) Commercial
The cost of Low carbon technology is high, and this may impact business competitiveness
The exports of Iron ore are in tune of 100 million tones annually. The NCAER report projects that the future availability of high grade and medium grade iron ore are bleak. The mitigation option for future also requires quality raw materials.
The technology transfer from advanced steel making companies will have additional constraints (1) weak rupee against dollar, (2) The interest rates are high and hence cost of capital is high.
There is lack of capital in the country. FDI is encouraged.
Global trade and shipping industry is highly sensitive to abnormal happenings.
V.D Policy Options in Steel Sector
V.D.1 Existing policy: National Steel Policy 2005
The government of India declared their national steel policy in the year 2005, based on the demand projection of steel till 2020, and requirement of raw materials for the production. The long-term goal of the national steel policy is that India should have a modern and efficient steel industry of world standards, catering to diversified steel demand, and establish infrastructure to sustain projected growth. The focus of the policy has been to achieve global competitiveness not only in terms of cost, quality and product-mix but also in terms of global benchmarks of efficiency and productivity. Though the policy is silent on climate change, but it does address it through energy efficiency. This will require indigenous production of over 100 million tonnes (mT) per annum by 2019-20 from the 2004-05 level of 38 mT. This implies a compounded annual growth of 7.3 percent per annum.

Center for Clean Air Policy page 186
V.D.2 Strategy to achieve policy objective
A multi-pronged strategy would have to be adopted to move towards the long-term policy goal. On the demand side, the strategy would be to create incremental demand through promotional efforts, creation of awareness and strengthening the delivery chain, particularly in rural areas. On the supply side, the strategy would be to facilitate creation of additional capacity, remove procedural and policy bottlenecks in the availability of inputs such as iron ore and coal, make higher investments in R&D and HRD and encourage the creation of infrastructure such as roads, railways, and ports.
Some of the features of the government policies on steel are:
• There has to be a need-based assessment of demand of steel in the country, depending on steel usage profile of population in urban and rural area.
• There should be focus on increase in consumption of steel in the rural area, by increased mechanization of agriculture and rural housing activities. There are promotional activities from the industries to boost consumption in rural area.
• The government has initiated “Bharat Nirman” to boost economic activities in rural area. Similar scheme is there for urban poor. There is a need to continue the current thrust on infrastructure related activities and extend them to rural India. Rural Indian presents a challenge for economic development of the country, as percentage share of rural GDP is continuously declining. The opportunity exists to boost rural economy with increased usage of steel.
• Indian steel industry was primarily meeting the requirement of the domestic sector. The Government is focusing on the export market and has provided incentives for the export. There are proposal of SEZ for steel units. The government should review the export options when some of the developed countries are analysing “Carbon Leakage” issue.
• In order to sustain steel production of 110 mT by FY 2020, at 100 percent capacity utilization of production units, the constraint of unavailability of good quality coking coal must b considered. The projected demand servicing is based on the assumption that demand will be met from 60 percent through the Blast Furnace (BF) route, 33 percent through the Sponge Iron – Electric Arc Furnace (EAF) route and 7 percent through other routes. The integrated steel plants can consider having COREX, FINEX, and Circofer smelting process to meet part of hot metal requirement.
• Numerous Investors in India being consumers of coal have been reported to be looking for global coal assets, and small reserve of iron ore mines. In order to ensure availability of 190 mT of iron ore for domestic production of steel by 2019-20, Government should encourage investments in the sector. The projected investment is estimated at around Rs. 200 billion.
• India has about 4.6 billion-ton reserve of coking coal. These coals contain high ash, and impact productivity of the blast furnace. The government plans to approve coal blend of 85% imported coal and 15% domestic coal.
• The current trends indicate that a large number of sponge iron based steel units may come up in the states of Chattisgarh, Andhra Pradesh, Orissa, and Jharkhand. Secondary steel making sector is not organized. The government may have to intervene to promote R&D to support development in this sector.
• In event of deregulation of coal sector, the sponge iron units will get the priority of allocation of non-coking coal.
Center for Clean Air Policy page 187
• The steel industry should give proper attention to use of refractory, for decrease of heat losses, and increase in campaign life of the process.
• Cost compliant application of IT, automation, and instrumentation
• Incentives of waste energy harnessing.
• Depending on the age of the unit, technology, and raw materials a baseline of energy consumption should be estimated. The benchmark for each process needs to be established. Period target should be assigned for units.
• Joint ventures are established for development of breakthrough technology.
• Establish procedure for technology transfer of advanced steel making technology.
• As there is an awareness of GHG emission during land reclamation, there should be guideline for land reclamation for green field plants.
Direct reduction and smelting Iron making is relatively new and has achieved commercial success, energy consumption statistics of these processes under Indian condition is not established. The COREX is the accepted process, using coal as the energy resource for reduction and thermal energy. The primary challenge for direct reduction and smelting Iron process is in ensuring intensity of production of molten iron equivalent to that achieved by blast furnace route. Since last two decades there have been significant development in technology and process in Electric arc furnace technology. These have been incorporated in the existing processes, or are in the stage of acceptance. Some of these are:
• Preheating of Scrap by the hot gases emitted by electric arc furnaces. • The electrical schemes have been developed to operate at a high voltage while maintaining
power factor of the scheme within control. • Oxy fuel burners have been developed to maintain temperature uniformity within the furnace. • Oxygen injection has been introduced to ensure complete combustion of carbon monoxide
inside the furnace. This is to ensure total energy of the furnace being used inside the furnace. • Foamy Slag Practice
Center for Clean Air Policy page 188
V.D.3 Domestic Policy Options for Steel Industry
The government policies are designed to encourage investment in Greenfield plants that will have best performance parameters, and retrofitting the existing plants with advanced technology after incorporating re-engineering. The focus of development will be to ensure lowering of specific energy consumption per tonnes of steel. The burner design for industrial application should facilitate lower NOx emission. The government should focus as a short term measures to encourage IT and automation schemes development to develop process models, scheduling of supply chain, adaptation of models to industrial set-up, control technologies, vision and sensor based technologies, safety systems, laser based flexible tooling, and robotics etc. On a long term innovative technologies implementation can be planned as a joint venture with leading technology supplier. Most of the investments in steel in future are expected from the private sector. Government policies should be favourable for inducing investment in other sectors like energy, IT, automation.
The development of quality steel for the end user steel is essential. The WSA suggestion on life cycle assessment should be pursued. The relevant performance criteria for the steel of the future is needed e.g. include increased temperature resistance and comprehensive strength for ultra mega power plants, increased durability and creep resistance, and improved characteristics concerning resistance against corrosion and wear. In the automotive industry, the usage of tailored products has improved crash protection attributes and weight reduction compared to the conventional construction. For the usage in electrical systems, steels have been developed that increases the efficiency and reduce the losses in transformers. The end users of steels can benefit from the innovative material and activity of the steel producers.
A specific monitoring parameter of Maintenance is needed to evaluate process availability and share of cost of maintenance to production cost.
V.D.4 Relation to current policies, processes and trends underway in the country
The Government of India recently came out with a National Action Plan on Climate Change (NAPCC) according to which the Iron and Steel industry is one of the nine designated energy intensive consumers. The NAPCC outlines eight national missions. These missions will be institutionalized by the ministry and will be organized by inter- sectoral groups. These missions and their relevance to the steel sector as understood are as follows.
• National Mission for enhanced energy efficiency: The energy conservation act of 2001 provides a legal mandate for the implementation of the energy efficiency measures by Bureau of Energy efficiency. Prior to the act the industry was focused on energy efficiency for economic and commercial benefits. The implementation of equipments and technology yielding energy efficiency were slow due to apprehension of industry on robustness, reliability and benefits. Further there was skepticism on cost technology may impact business competitiveness. Bureau of Energy efficiency (an organization setup by the government to implement the act can devise a system of approving the performance of schemes and technology). Use of IT and automation schemes for the production, planning, and process control is one of the effective options for enhanced productivity while ensuring GHG mitigation. These also require practices of best maintenance and operation guidelines.
• National Mission on Sustainable Habitat: The integrated steel Industry has significant number of office buildings, apart from production sheds. All new plants have to develop a new (may be
Center for Clean Air Policy page 189
small) township for its employees. The sustainable habitat guidelines issued may be beneficial for development of projects and fulfilling the mission objectives, such as energy efficiency in building, use of solar energy, management of solid waste and public transport.
• National Water Mission: Steel Industry is a major consumer of water for cooling and cleaning system for which they use industrial water. The industrial water is a source of pollution (for streams, lakes, underground water), which has to be prevented. The research and development of pollution control is essential. The circulation of steam and cooling water affects the environment temperature. The conservation of water is an important issue. The objective of the mission is to optimize the use of cooling system and steam cycle (may form the part of energy efficiency also). Special innovative effort is needed to recover steam and heat energy to maximum feasible level.
• National Mission for a Green India: The national target of area under forest and tree cover is 33% while current area under forest is 23%. The plants have provisions for horticulture development to provide improved environment for their employees, and development of forest area may be included in their “corporate social responsibility”. The industry can encourage soil sequestration as CSR. The industry can initiate the peripheral development (surrounding area) under corporate social responsibility with best horticulture practices. The land reclamation results in extensive GHG emission. Adequate precaution on this aspect is needed.
• National Mission of Strategic Knowledge for Climate Change: The steel industry processes finds application of all conceivable technology and is highly energy intensive. Most of these plants have captive power generation. The locations of plants are both at inland and coastal sites. The sector offers maximum opportunity of R&D. The R&D institutes of steel sector can be associated in development of strategic knowledge for climate change. These centers can serve for dissemination of knowledge development on climate change. The annual report of the corporate house should mention carbon emission in the section of energy reporting.
V.D.5 Research and Development focusing on quality of steel
Special attention on R&D activities is required to achieve the desired energy efficiency and GHG emission reduction in this industry. The thermodynamic requirement (minimum) at room temperature for reducing haematite ore is 6.9 GJ/ton. In industrial practice this parameter is 3-4 times of this value. The R&D activities should be of three kinds:
• Development of special grade steel for new generation equipments and product. The WSA proposes a life cycle assessment (LCA) approach to measure the potential greenhouse gas impacts inclusive of all stages of manufacture, product use and end-of-life of the product.
• Evaluating benchmark for each process for vintage plants and new generation plant. Evaluate compliance of energy efficient technology in the unit.
• Improve process yield. Focus should also be on defects redressal in steel manufacturing i.e. quality improvement of existing products,
• Monitoring and assessments of change in characteristics of raw materials such as iron ore from different mines & imported coal also needs to be given due attention.
• Scope of energy efficiency in the operation and maintenance is a continuous task and the same should be pursued.
Center for Clean Air Policy page 190
• Development of process model (computerized) for each process for optimisation of the process.
• By year 2020, approximately 60% steel production will be from Greenfield units. A modelling for process route selection considering factors such as raw material availability, engineering and process development, market, technology and logistics, will be beneficial.
There should be assessments carried out for deploying DRI process with domestic coal, so as to have a continuous evaluation of scope of improvement in the technology. There needs to be detailed in-house or through external agencies, to analyse, scope of capturing waste heat and cleaning of flue gases. As specified earlier, breakthrough technology developments are in progress in developed countries. An integrated approach is needed to introduce LCT so that it is commercially viable.
V.D.6 Strategic training to facilitate pending technical issues
The steel sector is in its growth phase, and ArcelorMittal, POSCo, Jindal group, and Tata Steel will commission many new high capacity plants in future. All the public sector units are undergoing modernization. There is a need of skilled and qualified manpower forming a multidisciplinary team to service process operation, manage technology discipline, maintenance, project team to commission new facility, marketing and product development, monitoring legal and regulatory compliance, spares & raw material procurement, financing & accounting, logistics, and Human resource development etc. Capacity building requirement differs for experienced worker and new entrants. There is an institute specific to steel sector. In future quality manpower will be needed to operate advanced technology steel plant.
The R&D activities have to be intensified, to cater to the needs for special grade of steel and for development of process. The automation features in steel industry are increasing. The process modelling technologies have to be created to operate and control the steel mill processes with indigenous development. IISI initiative is very relevant to Indian context where they recommend biomass based steel production, an Idea being pursued for long. Integrated steel plant has a peripheral development program under corporate social responsibility clause. Carbon sequestration can be a part of scientific forest and agriculture development under peripheral development. The forests and agriculture have separate potential of sequestration during their growth phase. The biomass from the peripheral area can be used for cogeneration.
V.D.7 Developing adequate financing mechanisms
The current growth in steel sector is coming from expansion and modernization of PSU units and new investment from private sector. The private investment was previously directed towards direct reduced iron process. Now private investments are forthcoming in integrated steel plants also.
The recent investment plans in steel sector in the state of Orissa, Jharkhand, Karnataka, West Bengal and Chhattisgarh; indicate that the cumulative production per annum will exceed the 110 million tonnes of steel envisaged in the National Steel Policy - 2005 by 2019-20. The steel industry has invested a capital of over Rs. 900 billion. Investments are also forthcoming in secondary steel production sector.
Ministry of Steel assists in arranging finance for new ventures. Currently credit availability in India is at a high cost. Government should review the interest rates, as the investment value is very high.
Center for Clean Air Policy page 191
Industry should be allowed to have a fair return on investment and contribute to the overall health of the Indian manufacturing segment.
As a fiscal measure cap and Carbon cess may be tried judiciously to generate fund for development of the sector. As big investments are forthcoming in the sector, the entrepreneurs seek incentives, instead of taxes. The carbon consumption of the industry depends upon quality of raw material, vintage, status of technology etc. A prudent mechanism is desired for carbon tax on the operating margin. The profitability aspect of the unit is essential in view of technology up-gradation at an appropriate time.
The unit emitting more carbon per tonnes will be less profitable. A tax as a cess can be imposed on operating margin of the unit proportional to the carbon emission can be imposed. Prior to it a benchmark on emission is needed. The fund established from the cess can be used for development and modernization of the sector. The target of achievement should be reviewed periodically. Tax incentives can be given to the best performing plant on energy parameters. The challenge to establishing a benchmark is due to multiple processes and difference in source of raw materials.
Establishing national fund(s) could provide support to secondary steel industry to invest to upgrade the conventional units. The high capital costs are one of the significant barriers to incorporate efficient energy technology. A fund established for such purposes can help to finance a component of addition, modification and replacement costs of outdated technology
Direct government subsidies
The government should provide tax rebate for incorporating energy efficient schemes, approved by competent authority, in the manufacturing process. The government should also consider boosting steel consumption in rural sector by implicitly subsidizing (cost of manufacturing + reasonable profit) steel prices up to a defined quota. Marketing in the rural sector will be a challenge.
Private financing
Industry should be allowed to have a fair return on investment and contribute to the overall health of the Indian manufacturing segment.
Private financing for co-processing of steel mill by product should be developed. Steel mills currently are focused on steel production, while they also generate many by-products. These opportunities can be utilized with local entrepreneur. Private financing with co-production of chemical products should also be encouraged The co- production of cement, tar and chemical products produced as by product in the industry should be taken up with private entrepreneurs.
CRISIL in a recent study has concluded that given the large exposure that banks and financial institutions have to the steel industry, a healthy steel sector is in the interest of the economy. Steel industry still continues to be unattractive for investors and a recent study by CRIS INFAC suggests that any new projects with target price below $270/MT will be economically unattractive. Also, loan for working capital in a recessionary market is difficult.
Grants from national/international funds
Ministry should encourage and propagate application of carbon market mechanisms in the process of
Center for Clean Air Policy page 192
existing units for incorporating energy efficient scheme. Revenue earning from the carbon market mechanisms will motivate the unit to sustain effective use of energy efficient scheme. Soft-loans could be provided by developed countries for the purpose of technology transfer. The cost of technology is difficult to estimate; hence a modality of assessment of cost of technology is needed.
Carbon Market Mechanisms
Steel sector is highly energy intensive industry. Any saving of energy and power will reduce consumption on coal and grid power respectively. The incorporation of new technology in existing plant as retrofit will require new scheme, re-engineering of existing process to absorb new scheme, and finance for modernization / retrofitting. One of the options is the use of carbon market mechanisms for funding modernization and retrofitting. The benefits of the scheme can be obtained after earning carbon credits.
Project Categories • Renewable Energy (Solar, wind, biomass & hydro) • The replacement / switching of CO2 intensive fuel (e.g. oil to gas, Coal to gas) • Energy efficiency in the process technology (lighting, insulation, process optimization) • Waste Processing (e.g. land fill gas extraction, waste incineration) • Waste heat recovery projects including power generation • Energy savings by elimination of reheating processes
Potential Opportunity Areas
• Use of renewable energy at remote mines • Switching over from Open hearth furnace to BOF • Increased use of Continuous Casting facilities in the country. • Installation of Top Recovery Turbine (TRT) in blast furnaces • Effective Sensible heat recovery from flue gas network (Sinter Cooler and stove, SMS ID Fans
etc.) • Replacing energy-intensive motors by efficient motors • Waste Heat recovery projects including power generation • Efficient re-heating furnace in Rolling Mills • Switch over from coal-fired to gas fired boilers, use of IGCC in captive power generation and
potential to use oxy-fuel technology can be pursued • Reduction in flaring of BF & CO gas with computerized management of Energy and Power
distribution. • BOF gas recovery • Use surplus gases for steam / power generation. • Green Belt Development & a-forestation to act as a sink for CO2 etc.
V.D.8 Challenges & Concerns The steel is an essential item for modern day life. Their demand will continue to increase. The economists and planners will recommend neutral tax system and this will continue. The fiscal policy options are needed for inducing plant to go for quality product, take up timely modernization/ retrofitting program leading to carbon emission mitigation and ensuring clean environment.
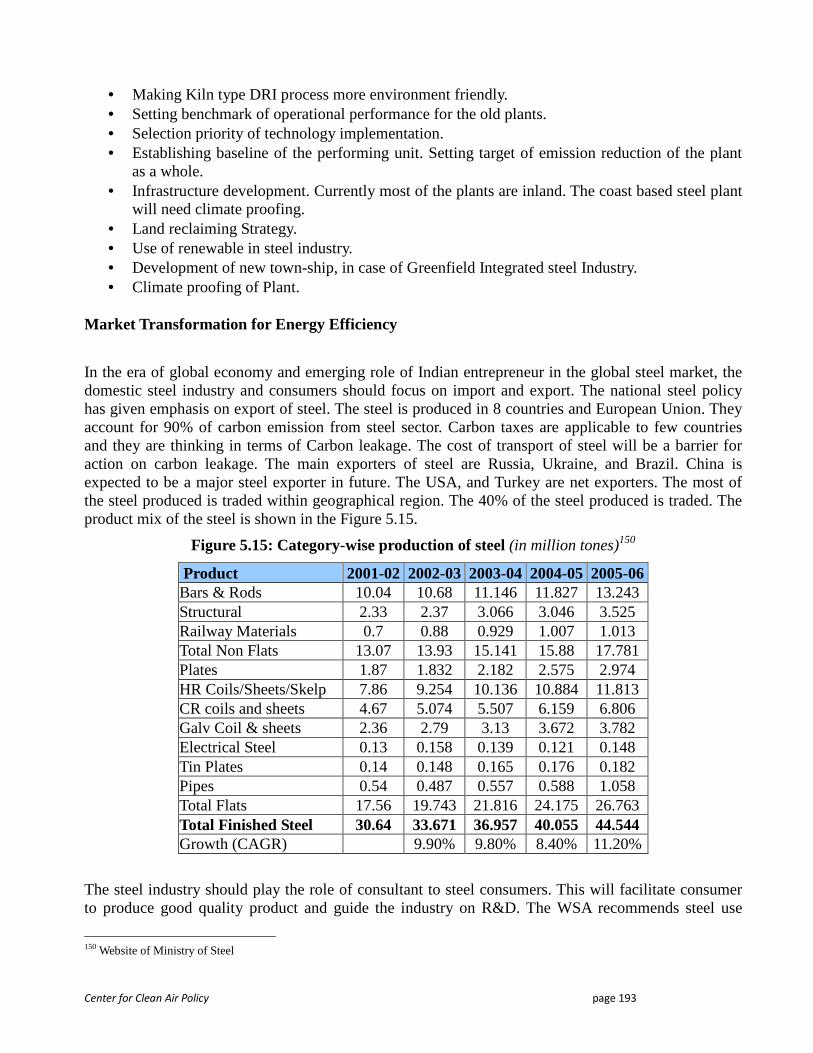
Center for Clean Air Policy page 193
• Making Kiln type DRI process more environment friendly. • Setting benchmark of operational performance for the old plants. • Selection priority of technology implementation. • Establishing baseline of the performing unit. Setting target of emission reduction of the plant
as a whole. • Infrastructure development. Currently most of the plants are inland. The coast based steel plant
will need climate proofing. • Land reclaiming Strategy. • Use of renewable in steel industry. • Development of new town-ship, in case of Greenfield Integrated steel Industry. • Climate proofing of Plant.
Market Transformation for Energy Efficiency
In the era of global economy and emerging role of Indian entrepreneur in the global steel market, the domestic steel industry and consumers should focus on import and export. The national steel policy has given emphasis on export of steel. The steel is produced in 8 countries and European Union. They account for 90% of carbon emission from steel sector. Carbon taxes are applicable to few countries and they are thinking in terms of Carbon leakage. The cost of transport of steel will be a barrier for action on carbon leakage. The main exporters of steel are Russia, Ukraine, and Brazil. China is expected to be a major steel exporter in future. The USA, and Turkey are net exporters. The most of the steel produced is traded within geographical region. The 40% of the steel produced is traded. The product mix of the steel is shown in the Figure 5.15.
Figure 5.15: Category-wise production of steel (in million tones)150
Product 2001-02 2002-03 2003-04 2004-05 2005-06 Bars & Rods 10.04 10.68 11.146 11.827 13.243 Structural 2.33 2.37 3.066 3.046 3.525 Railway Materials 0.7 0.88 0.929 1.007 1.013 Total Non Flats 13.07 13.93 15.141 15.88 17.781 Plates 1.87 1.832 2.182 2.575 2.974 HR Coils/Sheets/Skelp 7.86 9.254 10.136 10.884 11.813 CR coils and sheets 4.67 5.074 5.507 6.159 6.806 Galv Coil & sheets 2.36 2.79 3.13 3.672 3.782 Electrical Steel 0.13 0.158 0.139 0.121 0.148 Tin Plates 0.14 0.148 0.165 0.176 0.182 Pipes 0.54 0.487 0.557 0.588 1.058 Total Flats 17.56 19.743 21.816 24.175 26.763 Total Finished Steel 30.64 33.671 36.957 40.055 44.544 Growth (CAGR) 9.90% 9.80% 8.40% 11.20%
The steel industry should play the role of consultant to steel consumers. This will facilitate consumer to produce good quality product and guide the industry on R&D. The WSA recommends steel use
150 Website of Ministry of Steel
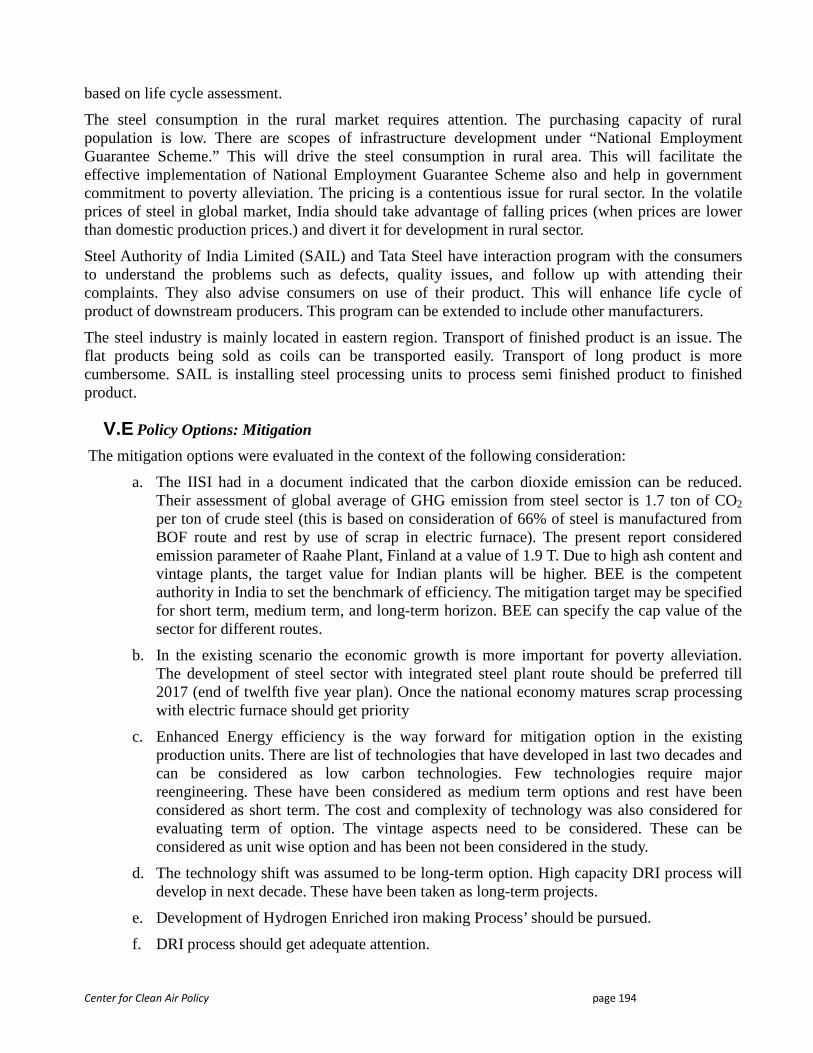
Center for Clean Air Policy page 194
based on life cycle assessment.
The steel consumption in the rural market requires attention. The purchasing capacity of rural population is low. There are scopes of infrastructure development under “National Employment Guarantee Scheme.” This will drive the steel consumption in rural area. This will facilitate the effective implementation of National Employment Guarantee Scheme also and help in government commitment to poverty alleviation. The pricing is a contentious issue for rural sector. In the volatile prices of steel in global market, India should take advantage of falling prices (when prices are lower than domestic production prices.) and divert it for development in rural sector.
Steel Authority of India Limited (SAIL) and Tata Steel have interaction program with the consumers to understand the problems such as defects, quality issues, and follow up with attending their complaints. They also advise consumers on use of their product. This will enhance life cycle of product of downstream producers. This program can be extended to include other manufacturers.
The steel industry is mainly located in eastern region. Transport of finished product is an issue. The flat products being sold as coils can be transported easily. Transport of long product is more cumbersome. SAIL is installing steel processing units to process semi finished product to finished product.
V.E Policy Options: Mitigation
The mitigation options were evaluated in the context of the following consideration:
a. The IISI had in a document indicated that the carbon dioxide emission can be reduced. Their assessment of global average of GHG emission from steel sector is 1.7 ton of CO2 per ton of crude steel (this is based on consideration of 66% of steel is manufactured from BOF route and rest by use of scrap in electric furnace). The present report considered emission parameter of Raahe Plant, Finland at a value of 1.9 T. Due to high ash content and vintage plants, the target value for Indian plants will be higher. BEE is the competent authority in India to set the benchmark of efficiency. The mitigation target may be specified for short term, medium term, and long-term horizon. BEE can specify the cap value of the sector for different routes.
b. In the existing scenario the economic growth is more important for poverty alleviation. The development of steel sector with integrated steel plant route should be preferred till 2017 (end of twelfth five year plan). Once the national economy matures scrap processing with electric furnace should get priority
c. Enhanced Energy efficiency is the way forward for mitigation option in the existing production units. There are list of technologies that have developed in last two decades and can be considered as low carbon technologies. Few technologies require major reengineering. These have been considered as medium term options and rest have been considered as short term. The cost and complexity of technology was also considered for evaluating term of option. The vintage aspects need to be considered. These can be considered as unit wise option and has been not been considered in the study.
d. The technology shift was assumed to be long-term option. High capacity DRI process will develop in next decade. These have been taken as long-term projects.
e. Development of Hydrogen Enriched iron making Process’ should be pursued.
f. DRI process should get adequate attention.

Center for Clean Air Policy page 195
The Asia Pacific Partnership have released a Steel Handbook available on the net describing LCT option available. Analysis based on the book is tedious. The potential mitigation options have been reviewed and the feasibility of their effectiveness has been categorized. These are short term (eleventh five year plan 2007-2012), Medium term (twelfth five year plan 2012-2017), long term (thirteenth five year plan 2017-2022) options. Figure 5.16 is the graphical representation of activities related to policy and mitigation option and projection of feasible timeframe to take up the activity.
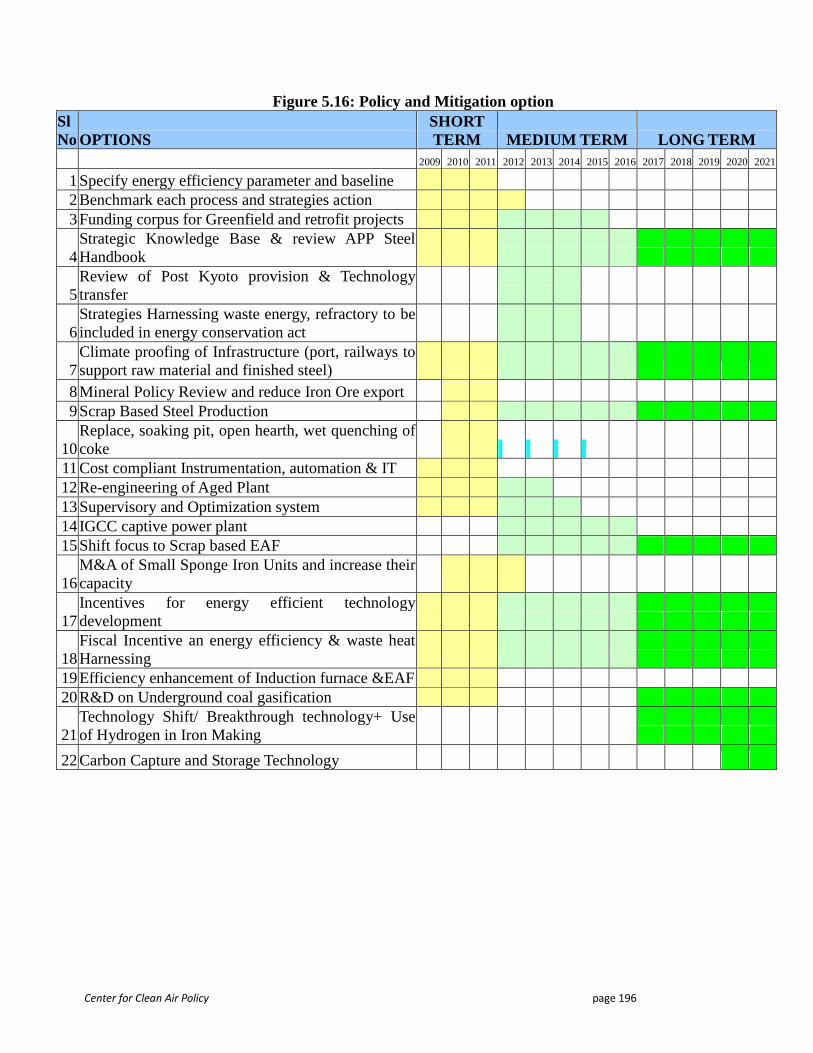
Center for Clean Air Policy page 196
Figure 5.16: Policy and Mitigation option Sl No OPTIONS
SHORT TERM MEDIUM TERM LONG TERM
2009 2010 2011 2012 2013 2014 2015 2016 2017 2018 2019 2020 2021
1 Specify energy efficiency parameter and baseline 2 Benchmark each process and strategies action 3 Funding corpus for Greenfield and retrofit projects
4 Strategic Knowledge Base & review APP Steel Handbook
5 Review of Post Kyoto provision & Technology transfer
6 Strategies Harnessing waste energy, refractory to be included in energy conservation act
7 Climate proofing of Infrastructure (port, railways to support raw material and finished steel)
8 Mineral Policy Review and reduce Iron Ore export 9 Scrap Based Steel Production
10 Replace, soaking pit, open hearth, wet quenching of coke
11 Cost compliant Instrumentation, automation & IT 12 Re-engineering of Aged Plant 13 Supervisory and Optimization system 14 IGCC captive power plant 15 Shift focus to Scrap based EAF
16 M&A of Small Sponge Iron Units and increase their capacity
17 Incentives for energy efficient technology development
18 Fiscal Incentive an energy efficiency & waste heat Harnessing
19 Efficiency enhancement of Induction furnace &EAF 20 R&D on Underground coal gasification
21 Technology Shift/ Breakthrough technology+ Use of Hydrogen in Iron Making
22 Carbon Capture and Storage Technology
Center for Clean Air Policy page 197
V.F Co-impacts analysis
a. Enhancements in economic productivity and performance: The commercial demand to remain competitive induces the plants to go for continuous cost cutting exercise. The reduction in energy consumption, planned maintenance of the equipments and infrastructure, increase in capacity utilization, reduction in rejections and diversions to lower grade steel, and increase in process yield are the focus areas. Economic productivity and performance enhancement will facilitate mitigation of GHG per ton of steel.
b. Job creation and poverty alleviation: The steel industry in India has been traditionally over-manned per million tonnes of production capacity in comparison to the steel industries in developed countries. This has been due to level of automation and use of robotics in the plants of developed countries. The steel industry requires a constant stream of trained & skilled manpower to sustain its operation. The capacity building of existing workforce is on-going activity. Steel Industry has its own township, which generates indirect employment. The “Poverty Alleviation” has been part of “Peripheral Development” within “corporate social responsibility”.
c. Technology innovation, research, development and transfer: The R&D activities have to be intensified, as the sector has to cater to need for special grade of steel as suggested by WSA-life cycle assessment. The automation features in steel industry are increasing. The process modeling technologies have to be created to operate and control the steel mill processes with indigenous development. The quality issue of steel product is determined in steel melting shop. The rolling mills determine the market compliance of the product. At rolling mills savings in electricity can be achieved with optimized mill setting. Indian IT houses can partake in development of packages customized for steel Industry. The government used to have a steel development fund, which can be used for R&D activity. India has to undertake fundamental research as joint venture in steel sector for development of breakthrough technology. There are researches like use of carbon dioxide sequestration in steel melting shop at slag handling stage, carbon capture and storage technology. The steel slag quenched with carbon dioxide has good marine application.
d. Improved water quality: The main source of water pollution in steel industry is coke ovens and captive thermal power plant. The use of dry quenching of coke with waste heat extraction system will reduce water pollution significantly. Cooling system and ash collection system in captive power plants results in local warming of the area. The cooling ponds are not suitable for natural biological growth. The water used for cooling in rolling mills are processed for recovery of scales. The scales can be used in sinter plant.
e. Education, learning and training: The steel sector is in growth phase, and in next few years ArcelorMittal, POSCo, Jindal group, Tata Steel will commission many high capacity plants. All the public sector units are undergoing modernization. The units are expected to have high degree automation. The skilled and qualified manpower is needed for the sector for construction/ project, operation and maintenance of these units. The sector has good amount of manpower attrition, as the sector provides ample opportunities for growth.
f. Infrastructure development: The steel industry has a convoluted role in infrastructure development. Steel is needed for infrastructure development, while steel industry needs adequate infrastructure for sustaining operation of steel plant i.e. adequate power, water, coal
Center for Clean Air Policy page 198
(most of the coal is imported), logistics, and railways etc. As most of coal is imported, the port facilities have to increase significantly. Inland plants require railways to carry, raw materials.
g. Government should encourage high capacity captive power plant in steel plants having near 10 million tonnes or higher production capacity to avoid network/ grid congestion.
h. Protection of biodiversity: The “Protection of Biodiversity” has been part of “Peripheral Development” within “corporate social responsibility”. There is need for strategy for use of mining pits effectively. The steel plants will have high concentration of carbon dioxide locally. The coastal green field plants (eastern shores are prone to cyclones), and inland plants with greater concentration of trees may be proposed.
V.G Steel Sector Conclusion Indian economy is in growth trajectory, and the moderate estimate is that in next two decades the steel production capacity will grow by more than two times may be three times. The carbon emission will increase due to growth in production volume. India have to focus on reducing specific energy consumption, energy saving of fossil fuel, as nuclear energy and alternate energy cannot provide chemical energy and facilitate reduction process and repeated reheating of input material in the coming decade. The application of fossil fuel is mandatory in absence of alternate options. India is member of World steel association, and Asia pacific partnership. They have co-chair status in the steel task force. India has national steel policy – 2005. It is focused on growth and energy efficiency. The National Action Plan for climate change (NAPCC) has a defined national mission for “enhanced energy efficiency”. NAPCC has seven other missions. Each has relevance to steel industry. The mitigation of carbon emission can be achieved in existing plants by retrofitting appropriate low carbon technologies. For short-term mitigation, application of IT is recommended for maintenance planning and execution, optimised best operation practices, material tracking and material tracing, input quality control, to optimise use of energy & power and efficient distribution of secondary fuel. Microchip based process control, instrumentation, automation, supervisory system, executive information system, and enterprise resource management can strategize the mitigation options of carbon emission. India should use its national competence in IT to make automation and control package for steel industry. The adherences of best maintenance & operation practices are essential to achieve best plant performance. The government may check possibility of inclusion of maintenance issue and waste heat and energy harnessing in Energy conservation act.
The current energy efficient technologies/ low carbon technologies are capital intensive. There are / will be stringent IPR issues in future in their application and use. There is lack of willingness of transfer technology by advanced steel making companies. India will have to focus on R&D to develop most of their need of energy efficient technology. Incorporating innovative process needs extensive re-engineering. There is urgent need to enhance efficiency in Kiln type DRI process. There are concerns about finiteness of raw materials reserves in the country. India has big expansion plan in steel sector in future. The government have to review mineral policy for export of Iron ore. Large quantity of coking coal will be needed through import. A good infrastructure is needed for logistic support for supply chain. On a short term India should focus on Infrastructure development for
Center for Clean Air Policy page 199
up-coming projects. Since last two years there are issues of price volatility of raw materials and steel. The scenario generates impediment in development of the sector. The importance of the electric furnace for steel making will increase as the economy of the country matures equivalent to developed countries. Development of enhanced energy efficiency technology for Steel making by steel scrap and electric furnace route needs to be accelerated in short term time frame. The steel sectors have many mines, and many mines have been abandoned after total reserve excavation. The alternate use of abandoned mines needs to be planned. Land reclamation needs attention.
India can reduce their cost of reducing emission per ton of steel by developing indigenous energy efficient technology, management control system driven by intensive R&D. Simply retrofitting low carbon technology does not yield Potential benefit of the scheme. There is a prior need of re-engineering of Steel Industry in view of significant development in Control system (Program Logic Control), Instrumentation and automation, Information technology, ERP system. Some of the identified energy saving process (direct and Indirect) in iron making using indigenous non-coking coal such as COREX process should be customized to Indian condition by establishing joint venture with technology supplier. Indigenous technology equivalent to COREX, FINEX, Ciercofer can be developed by establishing joint ventures with Voest-Alpine, Austria, Outokompu, Finland. The preference of choosing coke oven and Blast furnace route is the intensity of production. The expected developments in DRI route processes are to enhance production intensity. The existing small capacity kiln type DRI processes are emitting carbon at higher rate than higher capacity units. Incorporation of LCT in small capacity units are not commercially viable and hence should be phased out. In future higher capacity DRI units having scalability provisions are desired. In view of emission control there should be directive for un-organized secondary steel making units having sponge iron set up, about capacity, and emission cap of the units.
There are entrepreneurs (LN Mittal, Tata Steel, Jindal Group, POSCO etc) have committed to invest in Indian steel sector. They are proposing high capacity units. These units should consider high capacity captive thermal power plant to avoid power transmission congestion in the national grid. The suggestions are to use IGCC thermal plant. The chemical generated during gasification can be processed in coke oven complex. Oxy-fuel firing of boilers can be implemented. Cumulative local emission from these integrated steel plants will be very high. These units can consider Carbon capture and Storage technology for their use. All the blast furnaces should have slag granulation plant for indirectly reducing GHG emission from cement manufacturing. Coal dust injection in blast furnace technology has been established for Indian coal. The scheme should be incorporated in all blast furnaces. Coal gasification and underground coal gasification in the un-mineable mines is in the R&D stage. Steel industry should promote research in underground coal gasification. Gas from these mines can be used for injection in the blast furnaces or as fuel in thermal
Center for Clean Air Policy page 200
power plant and reheating furnaces. The IGCC process can provide hydrogen for blast furnaces.
Research is needed to develop application specific micro-alloy steel having superior characteristics, strength etc. There can be another way to reduce steel consumption by increasing lifecycle of product made from Indian steel. The alloy steel requirement is expected to grow significantly due to increase in demand of special steel.
The steel plants should not become climate change hotspots due to cumulative intensity of emission of greenhouse gases (from steel making, power generation, calcinations etc), and the heat losses from the processes. The situation may worsen due to accidents etc. All the technical issues are essential for reducing the intensity of emission marginally. During initial phase of Greenfield projects, there will be extensive GHG emission due to land reclamation. In such a scenario the natural protection of forest cover (higher capacity CO2 absorption with less water/ soil moisture requirement) should be made mandatory as corporate social responsibility for the steel plant peripheral development. Steel Industry is a centre of development of new township. The future township should have guidelines of sustainable habitat.
The steel sector can guide the development of green technology in the country to address climate change issue, as it uses all proven technology and the management covers all economic sector commitments. Today we are in the knowledge base society, and network communication has facilitated dissemination of information. National Action Plan for climate change has laid emphasis on strategic knowledge platform. In the context of complexity of technology, social needs of regulatory system, it is essential that the specialist of different field share their knowledge on a strategic knowledge platform. The steel sector can play a lead role.
The international community can provide (a) financial assistance to eliminate financial barriers, (b) technology transfer for providing cheaper domestically produced technology options and (c) capacity-building assistance to enable India to leverage on its vast intellectual capacity to emerge as a world leader in efficient iron & steel production.
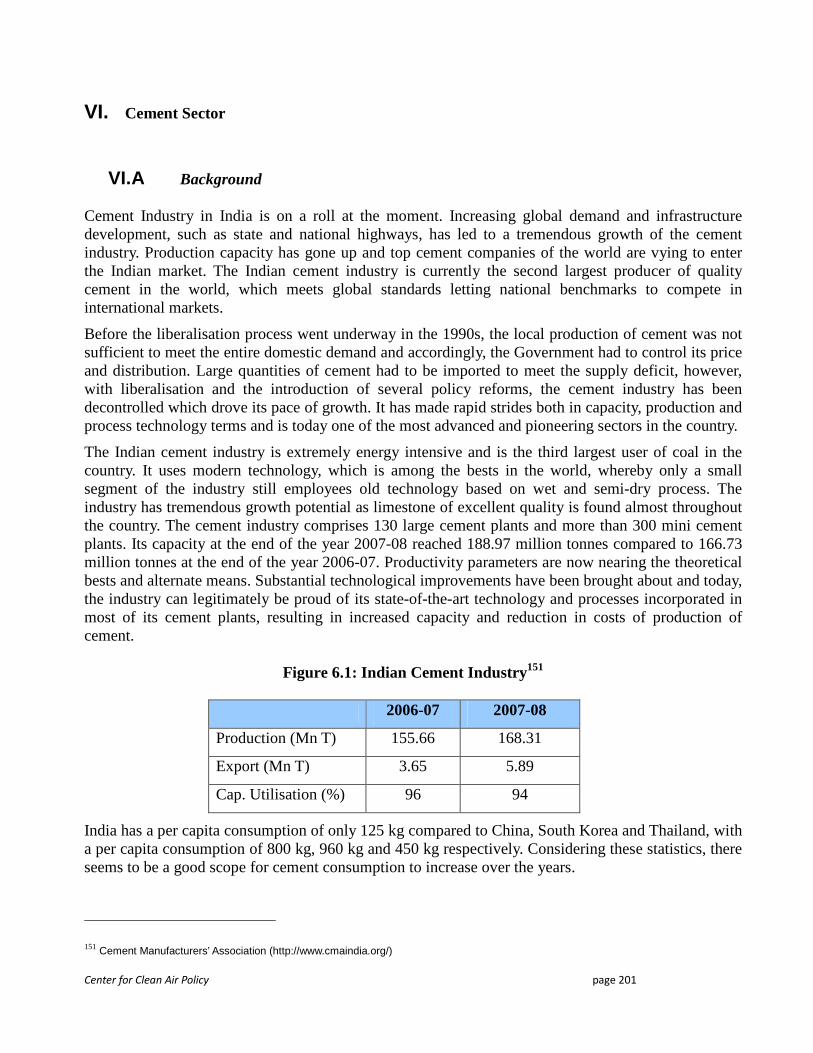
Center for Clean Air Policy page 201
VI. Cement Sector
VI.A Background
Cement Industry in India is on a roll at the moment. Increasing global demand and infrastructure development, such as state and national highways, has led to a tremendous growth of the cement industry. Production capacity has gone up and top cement companies of the world are vying to enter the Indian market. The Indian cement industry is currently the second largest producer of quality cement in the world, which meets global standards letting national benchmarks to compete in international markets.
Before the liberalisation process went underway in the 1990s, the local production of cement was not sufficient to meet the entire domestic demand and accordingly, the Government had to control its price and distribution. Large quantities of cement had to be imported to meet the supply deficit, however, with liberalisation and the introduction of several policy reforms, the cement industry has been decontrolled which drove its pace of growth. It has made rapid strides both in capacity, production and process technology terms and is today one of the most advanced and pioneering sectors in the country.
The Indian cement industry is extremely energy intensive and is the third largest user of coal in the country. It uses modern technology, which is among the bests in the world, whereby only a small segment of the industry still employees old technology based on wet and semi-dry process. The industry has tremendous growth potential as limestone of excellent quality is found almost throughout the country. The cement industry comprises 130 large cement plants and more than 300 mini cement plants. Its capacity at the end of the year 2007-08 reached 188.97 million tonnes compared to 166.73 million tonnes at the end of the year 2006-07. Productivity parameters are now nearing the theoretical bests and alternate means. Substantial technological improvements have been brought about and today, the industry can legitimately be proud of its state-of-the-art technology and processes incorporated in most of its cement plants, resulting in increased capacity and reduction in costs of production of cement.
Figure 6.1: Indian Cement Industry151
2006-07 2007-08
Production (Mn T) 155.66 168.31
Export (Mn T) 3.65 5.89
Cap. Utilisation (%) 96 94
India has a per capita consumption of only 125 kg compared to China, South Korea and Thailand, with a per capita consumption of 800 kg, 960 kg and 450 kg respectively. Considering these statistics, there seems to be a good scope for cement consumption to increase over the years.
151 Cement Manufacturers’ Association (http://www.cmaindia.org/)
Center for Clean Air Policy page 202
VI.A.1 Industry Characteristics
The Indian cement industry has the following characteristics:
• Cyclical Industry: Cement industry is highly cyclical in nature and depends largely on the economic growth of the country. Being a cyclical industry it goes through phases of ups and downs and accordingly, companies’ realizations are affected. Even in a downturn, companies those are cost effective, will sustain profitability. There is a high degree of correlation between the GDP growth and the growth in cement consumption. This can be gauged from the fact that after experiencing robust growth from 1994 to 1996, the sector was one of the worst affected due to economic slowdown from 1997 to 1999. The industry registered an impressive growth during the years 1999 and 2000, mainly due to demand from the housing sector, which currently accounts a 60% of the cement consumption. However, cement prices have firmed up during the past few years (post FY02) due to improvement in the demand-supply position, increasing consolidation in the industry and the government’s thrust on infrastructure development.
• Majority of industry is still fragmented: The Indian cement industry has been characterised by a high degree of fragmentation. Currently, the number of players in the domestic industry is over 50. As on March 31, 2006 there were 130 large plants, accounting for approximately 80% of the total capacity and 365 white and mini plants in the country, accounting for the rest. The top 4 companies account for almost 40% of the total domestic capacity, while the remaining is distributed among the large and mini plants in the industry.
• Highly capital & energy intensive: Cement production is highly energy and capital intensive. The energy consumption by the cement industry is estimated at about 2% of the global primary energy consumption and almost 5% of the total global industrial energy consumption [WEC, 1995]. Cement plants are capital intensive and require a investment of over Rs. 3,500 per tonne of cement, which can be translated into Rs. 3,500 millions for a 1 mtpa plant. The market for cement is of very high bulk volume, but the value of the product itself is relatively low (50/tonne).
• Heavy dependence on 3 sectors viz. coal, power and transport
The main advantage of the mini-cement plant concept is the lower capital costs per tonne of capacity compared to large plants. Against the requirement of Rs. 3500+ per tonne of capacity of large plants, capital costs for mini-cement plants come to about Rs. 1,400-1,600 per tonne. This reduces to a large extent the fixed cost per tonne of cement produced.
VI.A.2 Production and Capacity
The growth of the cement industry in India has taken place mostly around the limestone deposits and its proximity to these contributes considerably to pushing down the costs of transportation of heavy limestone. Proximity to coal deposits also constitutes another important factor in cement manufacturing. Nearly 68% of the coal required by the cement industry during FY2005 was transported by rail; the remaining 32% per cent was moved by road.
Figure 6.2: Cement Production and Consumption Trend152
152 Industry and media reports
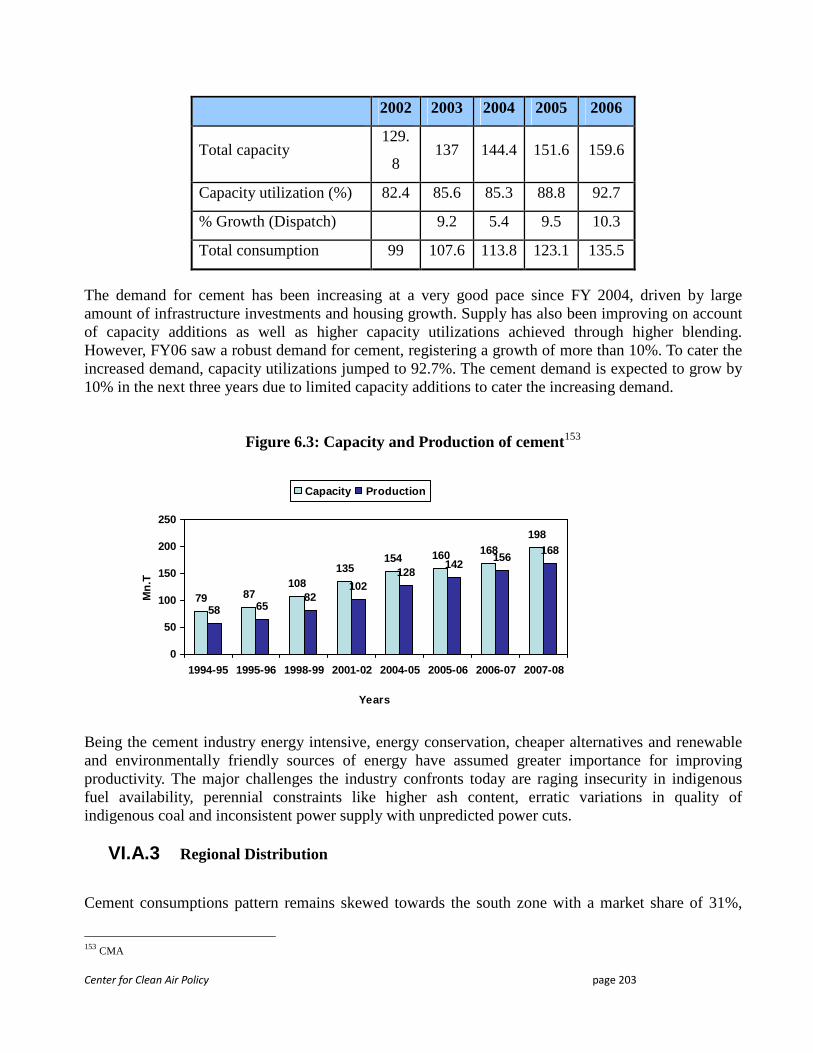
Center for Clean Air Policy page 203
The demand for cement has been increasing at a very good pace since FY 2004, driven by large amount of infrastructure investments and housing growth. Supply has also been improving on account of capacity additions as well as higher capacity utilizations achieved through higher blending. However, FY06 saw a robust demand for cement, registering a growth of more than 10%. To cater the increased demand, capacity utilizations jumped to 92.7%. The cement demand is expected to grow by 10% in the next three years due to limited capacity additions to cater the increasing demand.
Figure 6.3: Capacity and Production of cement153
Being the cement industry energy intensive, energy conservation, cheaper alternatives and renewable and environmentally friendly sources of energy have assumed greater importance for improving productivity. The major challenges the industry confronts today are raging insecurity in indigenous fuel availability, perennial constraints like higher ash content, erratic variations in quality of indigenous coal and inconsistent power supply with unpredicted power cuts.
VI.A.3 Regional Distribution
Cement consumptions pattern remains skewed towards the south zone with a market share of 31%,
153 CMA
2002 2003 2004 2005 2006
Total capacity 129.
8 137 144.4 151.6 159.6
Capacity utilization (%) 82.4 85.6 85.3 88.8 92.7
% Growth (Dispatch) 9.2 5.4 9.5 10.3
Total consumption 99 107.6 113.8 123.1 135.5
79 87108
135154 160 168
198
58 6582
102128
142156
168
0
50
100
150
200
250
1994-95 1995-96 1998-99 2001-02 2004-05 2005-06 2006-07 2007-08
Years
Mn.
T
Capacity Production
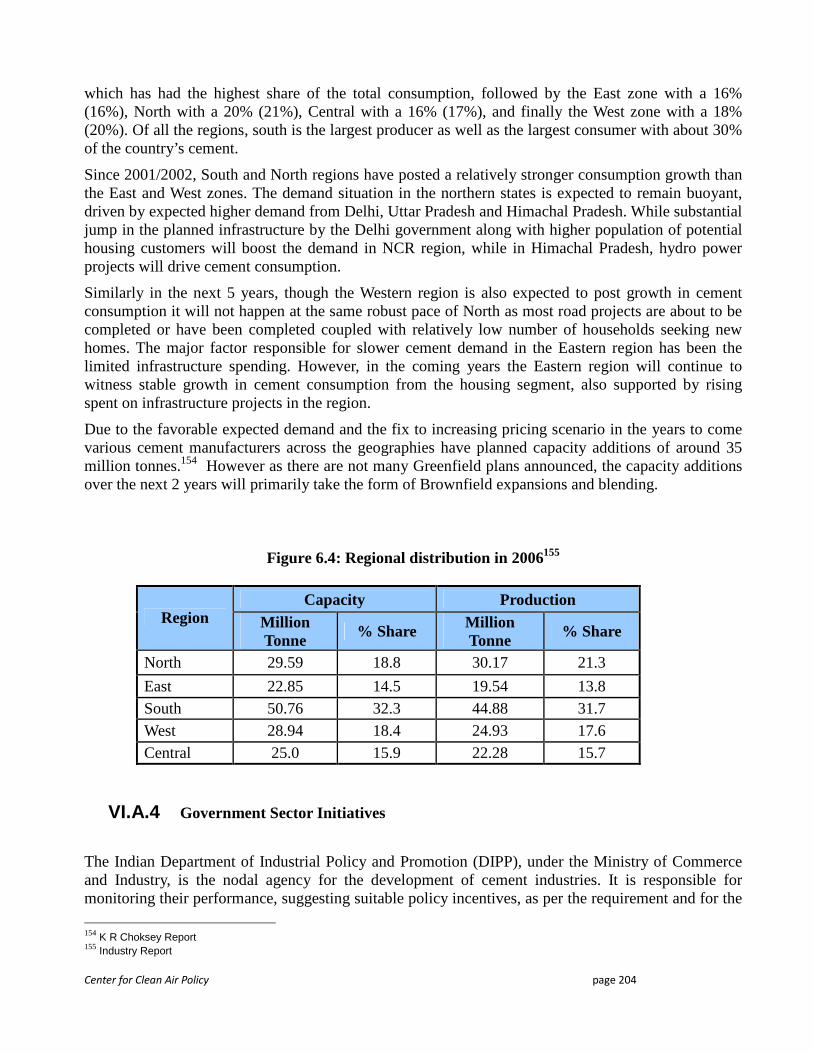
Center for Clean Air Policy page 204
which has had the highest share of the total consumption, followed by the East zone with a 16% (16%), North with a 20% (21%), Central with a 16% (17%), and finally the West zone with a 18% (20%). Of all the regions, south is the largest producer as well as the largest consumer with about 30% of the country’s cement.
Since 2001/2002, South and North regions have posted a relatively stronger consumption growth than the East and West zones. The demand situation in the northern states is expected to remain buoyant, driven by expected higher demand from Delhi, Uttar Pradesh and Himachal Pradesh. While substantial jump in the planned infrastructure by the Delhi government along with higher population of potential housing customers will boost the demand in NCR region, while in Himachal Pradesh, hydro power projects will drive cement consumption.
Similarly in the next 5 years, though the Western region is also expected to post growth in cement consumption it will not happen at the same robust pace of North as most road projects are about to be completed or have been completed coupled with relatively low number of households seeking new homes. The major factor responsible for slower cement demand in the Eastern region has been the limited infrastructure spending. However, in the coming years the Eastern region will continue to witness stable growth in cement consumption from the housing segment, also supported by rising spent on infrastructure projects in the region.
Due to the favorable expected demand and the fix to increasing pricing scenario in the years to come various cement manufacturers across the geographies have planned capacity additions of around 35 million tonnes.154 However as there are not many Greenfield plans announced, the capacity additions over the next 2 years will primarily take the form of Brownfield expansions and blending.
Figure 6.4: Regional distribution in 2006155
Capacity Production Region Million
Tonne % Share
Million Tonne
% Share
North 29.59 18.8 30.17 21.3
East 22.85 14.5 19.54 13.8 South 50.76 32.3 44.88 31.7 West 28.94 18.4 24.93 17.6 Central 25.0 15.9 22.28 15.7
VI.A.4 Government Sector Initiatives
The Indian Department of Industrial Policy and Promotion (DIPP), under the Ministry of Commerce and Industry, is the nodal agency for the development of cement industries. It is responsible for monitoring their performance, suggesting suitable policy incentives, as per the requirement and for the
154 K R Choksey Report 155 Industry Report
Center for Clean Air Policy page 205
formulation and implementation of promotional and developmental measures for growth of the entire industrial sector. It is also involved in framing and administering overall industrial and foreign direct investment (FDI) policies. It plays an active role in investment promotion and advising prospective investors about various policies and procedures. The industry faces a number of constraints in terms of high cost of power; high railway tariff; high incidence of State and Central levies and duties; lack of private and public investment in infrastructure projects; low quality coal and inadequate growth of related infrastructure like sea and rail transport, ports and bulk terminals. To overcome such obstacles and utilize excess capacity available with the cement industry, the Government has identified the following thrust areas for increasing its demand: (i) Housing development programmes; (ii) Promotion of concrete highways and roads; (iii) Use of ready-mix concrete in large infrastructure projects; and (iv) Construction of concrete roads in rural areas under Prime Ministers Gram Sadak Yojana. The Department has been undertaking several measures like setting up of institutes/councils for enhanced development of the industry. For instance, the National Council for Cement and Building Materials (NCB) has been constituted as an apex body dedicated to continuous research, technology development and transfer, educational as well as scientific, technological and industrial services for the cement, related building materials and construction industries. NCB carries on its activities through its units located at Ballabhgarh, Delhi, Hyderabad, Ahmedabad and Bhubaneswar. NCB's activities are channelised through various programme centres. The Council promotes the development of the cement industry in India by providing funds for developmental projects. The source of funding the activities of the Council is the cess it collects from the cement manufacturers under Cement Cess Rules, 1993. The various projects of this Council are:
• Base Level activities of NCB and R&D projects initiated by it for the development of the cement industry.
• Improvement of the productivity of the industry by reducing cost. • Optimised utilisation of raw materials. • Modernisation of cement plants. • Improvement of environment. • Standardisation and quality control programmes. • Development of bulk supply and distribution of cement. • Training and upgrading of the skill of the personnel in the cement industry. • Development of National Data Bank and information Services.
During 2006-07, the Council received an allocation of Rs.3.5 crore for making expenditure on the above activities. It funded base level activities and 4 R&D projects of NCB. The report of the 11th Plan 'Working Group on Cement Industry' emphasizes the importance of bulk cement transportation, use of ready mix concrete and reduction of taxes and levies on cement. It also seeks regulatory support for creating framework for co-processing of wastes, co-generation of power and enhanced support to R&D activities to align the technology regime with the best of the world.
Center for Clean Air Policy page 206
VI.A.5 End User Profile
Housing accounts for the largest share (over 55%) of the total cement consumption in India. This is largely due to the various financial sops given to this sector in the successive Union Budgets. The Housing sector is followed by the Infrastructure sector (25%) and Commercial Projects (20%).
VI.A.6 Financial Aspects
a) Costs
The cement industry is one of the most energy-intensive sectors within the Indian economy. Clinker production is the most energy intensive step, accounting for nearly 75% of the energy used in cement production. In India, an estimated 90-95% of the thermal energy requirement in cement manufacturing is met by coal. The remaining is met by fuel oil and high-speed diesel oil. Generally, the cement industry in India on an average requires 90-105 units of power in the wet process, and 100-110 units of power in the dry process to produce one tonne of cement.
In cement production, raw materials preparation involves primary and secondary crushing of the quarried material, drying the material (for use in the dry process) or undertaking a further raw grinding through either wet or dry processes, and blending the materials. Clinker production is the most energy-intensive step, accounting for about 80% of the energy used in cement production.
b) Budget Structure
The budget is revised as follows:
• Freight rates on cement remained unchanged but a discount of 40% on incremental bag loading ha been recommended.
• The customs duty on Portland cements has been reduced from 12.5% to nil.
• A slew of incentives to be doled out for the housing sector.
c) Duty Structure
• An ad-valorem rate of excise duty at 12% of the retail sale price if it is more than Rs 190 per bag instead of the flat rate of Rs 600 per tonne announced in the Budget of 2007
• A concessional duty of Rs 350 per tonne of cement sold below Rs.190 per bag of 50 kg
• The government has abolished the custom duty/import duty on cement.
• The government has also lifted the 16% countervailing duty (CVD) and 4% additional custom duty on imported Portland cement.
• The value added tax (VAT) rate on cement is 12.5%.
VI.B Cement Manufacturing Technology
Dry Suspension Preheater and Dry-Precalciner plants as well as few old wet procedures and semi-dry process plants comprehend the current Cement Industry. Till late 70’s, the inefficient wet process technology led the Cement Industry to major shares of production. Since early 80’s the scenario
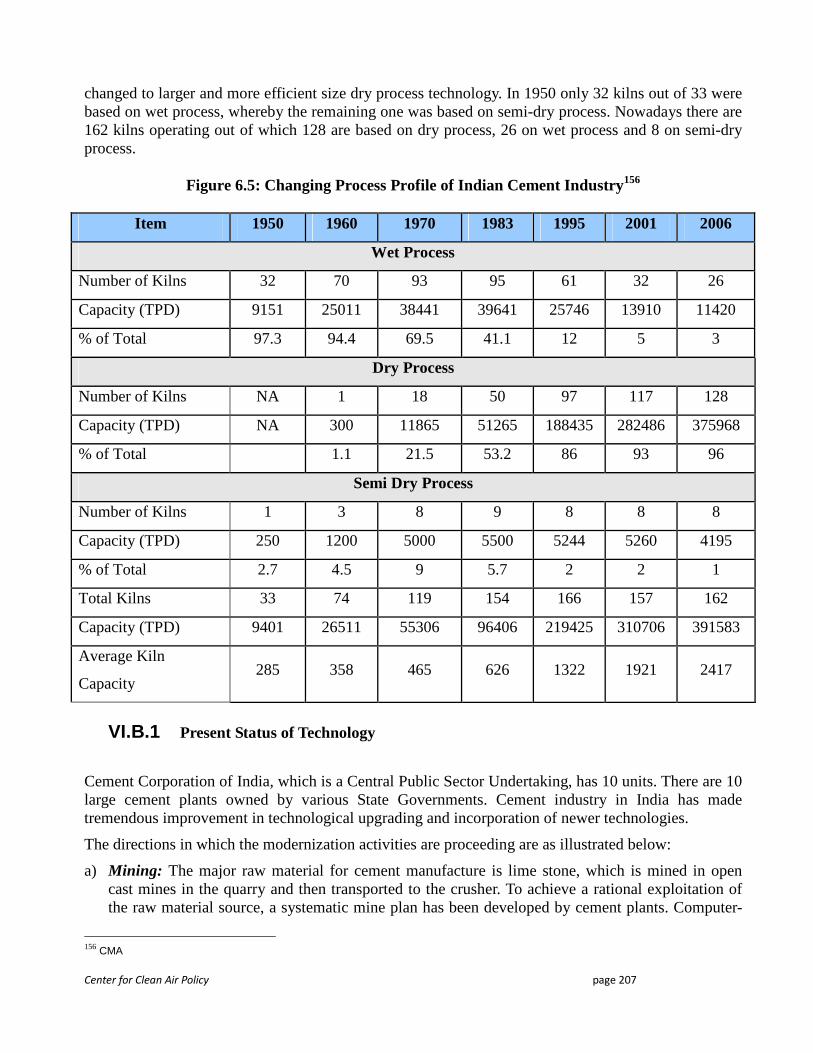
Center for Clean Air Policy page 207
changed to larger and more efficient size dry process technology. In 1950 only 32 kilns out of 33 were based on wet process, whereby the remaining one was based on semi-dry process. Nowadays there are 162 kilns operating out of which 128 are based on dry process, 26 on wet process and 8 on semi-dry process.
Figure 6.5: Changing Process Profile of Indian Cement Industry 156
Item 1950 1960 1970 1983 1995 2001 2006
Wet Process
Number of Kilns 32 70 93 95 61 32 26
Capacity (TPD) 9151 25011 38441 39641 25746 13910 11420
% of Total 97.3 94.4 69.5 41.1 12 5 3
Dry Process
Number of Kilns NA 1 18 50 97 117 128
Capacity (TPD) NA 300 11865 51265 188435 282486 375968
% of Total 1.1 21.5 53.2 86 93 96
Semi Dry Process
Number of Kilns 1 3 8 9 8 8 8
Capacity (TPD) 250 1200 5000 5500 5244 5260 4195
% of Total 2.7 4.5 9 5.7 2 2 1
Total Kilns 33 74 119 154 166 157 162
Capacity (TPD) 9401 26511 55306 96406 219425 310706 391583
Average Kiln
Capacity 285 358 465 626 1322 1921 2417
VI.B.1 Present Status of Technology
Cement Corporation of India, which is a Central Public Sector Undertaking, has 10 units. There are 10 large cement plants owned by various State Governments. Cement industry in India has made tremendous improvement in technological upgrading and incorporation of newer technologies.
The directions in which the modernization activities are proceeding are as illustrated below:
a) Mining: The major raw material for cement manufacture is lime stone, which is mined in open cast mines in the quarry and then transported to the crusher. To achieve a rational exploitation of the raw material source, a systematic mine plan has been developed by cement plants. Computer-
156 CMA
Center for Clean Air Policy page 208
aided techniques for raw material deposit assessment are visualize and applied in number of units, to arrive at proper extraction sequence of mining blocks keeping in view the blending operational requirements.
b) Crushing: Mobile crushers have been put in use in some of the newer plants, keeping in view the split location of limestone deposits and long conveying distances. The mobile crushing plant is stationed at the mine itself and raw material is crushed at the recovery site.
c) Grinding: The crushed limestone is grounded into fine powder in the dry condition. The Vertical Roller Mills (VRM) have given the real breakthrough in the area of grinding and it draws 20-30% less electrical energy compared to the corresponding ball mill system, besides its higher drying capacity. These mills can take larger feed size and therefore be used in single stage crushing. VRMs are now being used in clinker and slag grinding and also as pre-grinder to existing grinding installations. Another innovation that has come with the implementation of high pressure grinding rolls (HPGR) has been broadly adopted by the Indian cement industry. The HPGR is being employed as pre-grinder to upgrade the existing ball mill systems. Different modes of operating HPGR in open circuit, pre-treatment with circulation, pre-treatment with de-agglomeration and recirculation and closed circuit are currently operating. Such installations could reach a boost in capacity up to 200% and save in power consumption to an extent of 30% to 40% compared to ball mills. High efficiency separators are now widely used for products better classification and help increase the mill capacity apart from reducing the specific power consumption.
d) Pyro-processing: Pre-calciner technology has raised the production from the kiln by 2.0 to 2.5 times enabling the use of high ash coals with lower calorific value as well as diverse agricultural and industrial combustible wastes. Systems have been developed to use fuels like lignite and pet coke and various alternate fuels. The advantages of the economy of scale are fully exploited by the cement industry through the pre-calciner technology. Many single kilns capable of producing more than 6000 tpd capacity have already been installed. These are operating with state-of-the-art technology and kiln capacities in the range of 10000-12000 tpd are under installation. Many cement plants have some excess capacity at both upstream and downstream, which could be utilized economically if the kiln output could be increased at rational costs. Many cement plants have progressively increased the specific volumetric loading up to 7-7.5 tpd/m3, ensuring higher output than the one designed originally. The introduction of high efficiency and low pressure-drop-cyclones has led to conversion of conventional 4-stage cyclone pre-heaters to 5-stage and even 6-stage cyclone pre-heaters with enhanced thermal efficiency. The latest development like controlled flow grate clinker cooler system and cross bar cooler guarantee a better clinker distribution, an increase in cooler heat recuperation efficiency, a decrease in clinker exit temperature and reduced maintenance costs. The limitations of the standard straight pipe burner have been overcome by the use of highly flexible multi-channel burner. The multi-channel burner enables easy and sensitive flame shape adjustments. It also raises the entrainment of secondary air. High Alumina refractory bricks, mostly used in the past in pre-heating/precalcining zone, are now being replaced by light weight high strength insulating bricks. The Aluminum-Zirconium-Silicate bricks with coating repellent properties are also used now in transition zones. The new improved refractory bricks makes possible to increase the refractory lining life and reduce the radiation losses in the kiln. Greater use of monolithic refractories in pre-heater, pre-calcinator, cooler, kiln outlet zone etc. is in practice now. Conventional analogue instrumentation is gradually being replaced by digital instrumentation. Motor control by relay sequence is being changed to programmable logic controllers. Multi-loop digital controllers are replacing analogue PID controllers. A variety of
Center for Clean Air Policy page 209
advanced control concepts like adaptive control, self-tuning control, feed forward control, etc. have been, due to the advent of microprocessors, introduced in the Indian cement industry.
VI.B.2 Types of Cement
The types of cement in India have increased over the years with the advancement in research, development, and technology. By a fair estimate, there are around 11 different types of cement that are being produced in India. The production of all these cement varieties is according to the specifications of the BIS. Some of the various types of cement produced in India are:
• Clinker Cement: The production of Clinker Cement requires a lot of energy because it needs to be manufactured at the temperature of around 1400-1450 degree Celsius. The various raw materials required for the production of Clinker Cement are: Iron Ore, Bauxite, Clay, Limestone, Quartz
• Ordinary Portland Cement: Ordinary Portland Cement (OPC) is manufactured in the form of different grades, the most common in India being Grade-53, Grade-43, and Grade-33. OPC is manufactured by burning siliceous materials like limestone at 1400 degree Celsius and thereafter grinding it with gypsum.
• Portland Blast Furnace Slag Cement: The Slag Cement of the Portland Blast Furnace is a type of cement that is hydraulic and is manufactured in a blast furnace where iron ore is reduced to iron. The molten slag which is tapped is quickly drenched with water, dried, and then grounded to a fine powder. This fine powder that is produced is commonly known as the Portland Blast Furnace Slag Cement.
• Portland Pozzolana Cement: Portland Pozzolana Cement is manufactured by blending pozzolanic materials, OPC clinker, and gypsum either grinding them together or separately. Today Portland Pozzolana Cement is widely in demand for industrial and residential buildings, roads, dams, and machine foundations. Pozzolana is an important ingredient in PPC which is commonly used in the form of fly ash, volcanic ash, silica fumes, and calcite clay.
• Rapid Hardening Portland Cement: Rapid Hardening Portland Cement is manufactured by fusing together limestone (which has been finely grounded) and shale, at extremely high temperatures to produce cement clinker. To this cement clinker, gypsum is added in small quantities and then finely grounded to produce Rapid Hardening Portland Cement. It is usually manufactured using the dry process technology. The raw materials required for the manufacture of Rapid Hardening Portland Cement are: Limestone, Shale, Gypsum, Coke.
• Oil Well Cement: Oil Well Cement is manufactured from the clinker of Portland cement and also from cements that have been hydraulically blended. Oil Well Cement can resist high pressure as well as very high temperatures. Oil Well Cement sets very slowly because it has organic ‘retarders’, which prevent it from setting too fast. It is due to all these characteristics that it is used in the building of the oil wells where the pressure is around 20,000 PSI and the temperature is around 500 degrees Fahrenheit. The various raw materials required for the production of Oil Well Cement are: Limestone, Iron Ore, Coke, Iron Scrap.
• White Cement: White Cement is much like the ordinary grey cement except that it is white in color. In order to get this color of the White Cement, its method of production is different from that of the ordinary cement. However, this modification in its production method makes White Cement far more expensive then the ordinary cement.
Center for Clean Air Policy page 210
In India, the different types of cement are manufactured using dry, semi-dry, and wet processes. In the production of Clinker Cement, a lot of energy is required. It is produced by using materials such as limestone, iron oxides, aluminum, and silicon oxides. Among the different kinds of cement produced in India, Portland Pozzolana Cement, Ordinary Portland Cement, and Portland Blast Furnace Slag Cement are the most important because they account for around 99% of the total cement production in India. The share of OPC had decreased from 66.6% in 1999-00 to 31.2% in 2006-07 and the share of PPC has been reached from 22.6% to 60.1%.
VI.B.3 Upgrading of Low Technology Cement Plants
The Industry uses old wet process plants at one end, while at the other end, are the new state-of-the-art technology plants. There is a large number of dry process plants built during the period 1965-90. These plants could not fully modernize or upgrade side by side with advent of newer technologies and had thus remained at intermediate technology level. Also, the level of technology is not same at all the plants built during the same period.
Most of the cement plants in the country were set up in the capacity range of 0.4 to 1.0 mtpa before 1990’s. They were based on state-of-art technology at that time. Since then Cement industry accepted a large number of changes in technology.
The old plants have been operating at low energy efficiency. The Energy Efficiency technologies have been retrofitted in the existing units after reengineering of existing process. The Development of innovative technology is a dynamic process, so there are further scope of improving energy efficiency parameter of the plants and bringing the old plants at par with world-class plants in terms of productivity, energy efficiency and environment friendliness, leading to cost competitiveness.
Globalization leading to innovative methods of improving productivity and efficiencies through continued research is a compelling necessity and Indian cement industry has not fallen short. Some of the achievements are:
• Upgrading by converting wet process plants to semi-dry and full dry process resulting in economies in fuel and power consumption. Wet process capacity, which accounted for 97% in 1950, has been brought down to 3% in 2005. Dry process accounts for 96% and semi-dry process 1% in 2005.
• Establishing captive power facilities to overcome erratic and low quality power supply by various State Electricity Boards while economizing in costs.
• Gainful utilization of hazardous wastes like fly ash from thermal power plants and slag from steel plants for producing blended cements having better properties.
• Adopting split-location grinding operations close to far away markets and source of hazardous industrial wastes like fly ash and slag.
• Countering the myth that cement industry is a polluting industry to almost pollution free situation by employing ESPs, Bag filters etc. Today the industry’s emissions are less than the prescribed standards.
• Using coastal shipping facilities for economizing on transportation where feasible to transport cement/clinker to the markets/grinding units.
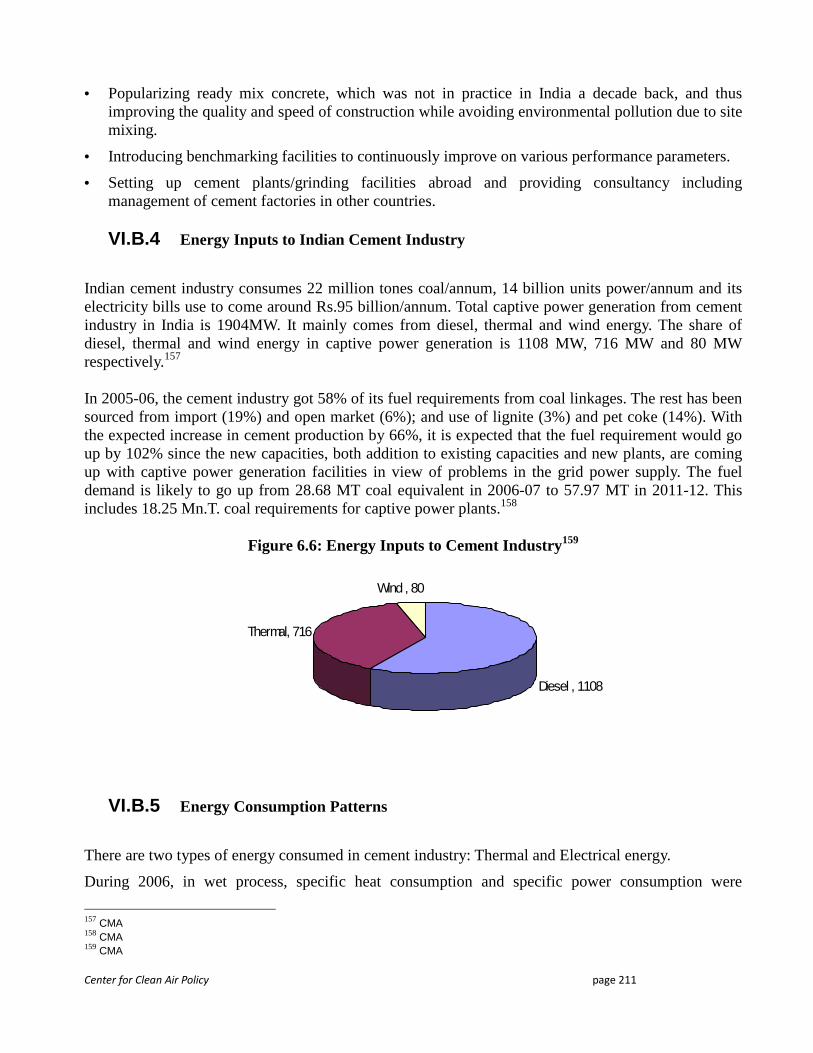
Center for Clean Air Policy page 211
• Popularizing ready mix concrete, which was not in practice in India a decade back, and thus improving the quality and speed of construction while avoiding environmental pollution due to site mixing.
• Introducing benchmarking facilities to continuously improve on various performance parameters.
• Setting up cement plants/grinding facilities abroad and providing consultancy including management of cement factories in other countries.
VI.B.4 Energy Inputs to Indian Cement Industry
Indian cement industry consumes 22 million tones coal/annum, 14 billion units power/annum and its electricity bills use to come around Rs.95 billion/annum. Total captive power generation from cement industry in India is 1904MW. It mainly comes from diesel, thermal and wind energy. The share of diesel, thermal and wind energy in captive power generation is 1108 MW, 716 MW and 80 MW respectively.157 In 2005-06, the cement industry got 58% of its fuel requirements from coal linkages. The rest has been sourced from import (19%) and open market (6%); and use of lignite (3%) and pet coke (14%). With the expected increase in cement production by 66%, it is expected that the fuel requirement would go up by 102% since the new capacities, both addition to existing capacities and new plants, are coming up with captive power generation facilities in view of problems in the grid power supply. The fuel demand is likely to go up from 28.68 MT coal equivalent in 2006-07 to 57.97 MT in 2011-12. This includes 18.25 Mn.T. coal requirements for captive power plants.158
Figure 6.6: Energy Inputs to Cement Industry159
Thermal, 716
Wind , 80
Diesel , 1108
VI.B.5 Energy Consumption Patterns
There are two types of energy consumed in cement industry: Thermal and Electrical energy.
During 2006, in wet process, specific heat consumption and specific power consumption were
157 CMA 158 CMA 159 CMA
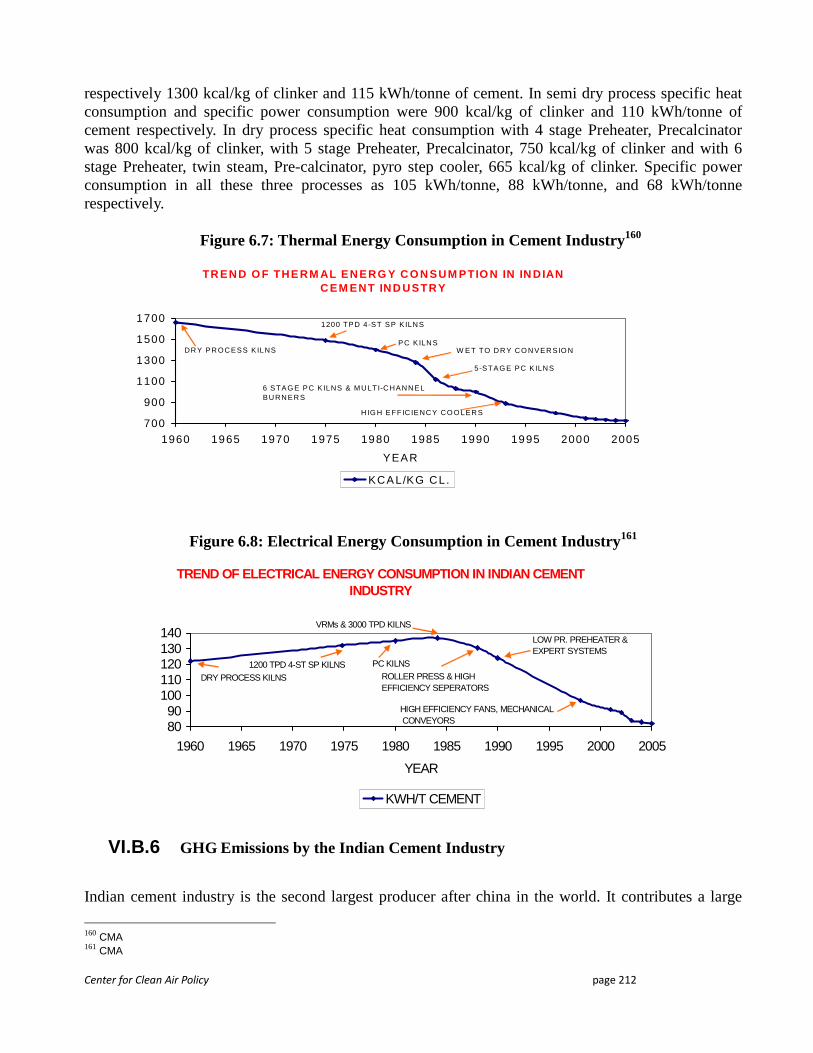
Center for Clean Air Policy page 212
respectively 1300 kcal/kg of clinker and 115 kWh/tonne of cement. In semi dry process specific heat consumption and specific power consumption were 900 kcal/kg of clinker and 110 kWh/tonne of cement respectively. In dry process specific heat consumption with 4 stage Preheater, Precalcinator was 800 kcal/kg of clinker, with 5 stage Preheater, Precalcinator, 750 kcal/kg of clinker and with 6 stage Preheater, twin steam, Pre-calcinator, pyro step cooler, 665 kcal/kg of clinker. Specific power consumption in all these three processes as 105 kWh/tonne, 88 kWh/tonne, and 68 kWh/tonne respectively.
Figure 6.7: Thermal Energy Consumption in Cement Industry160
Figure 6.8: Electrical Energy Consumption in Cement Industry 161
TREND OF ELECTRICAL ENERGY CONSUMPTION IN INDIAN CE MENT INDUSTRY
8090
100110120130140
1960 1965 1970 1975 1980 1985 1990 1995 2000 2005
YEAR
KWH/T CEMENT
DRY PROCESS KILNS1200 TPD 4-ST SP KILNS PC KILNS
VRMs & 3000 TPD KILNS
LOW PR. PREHEATER & EXPERT SYSTEMS
HIGH EFFICIENCY FANS, MECHANICAL CONVEYORS
ROLLER PRESS & HIGH EFFICIENCY SEPERATORS
VI.B.6 GHG Emissions by the Indian Cement Industry
Indian cement industry is the second largest producer after china in the world. It contributes a large
160 CMA 161 CMA
TR END O F THE RM AL EN ERG Y C O N SUM PTIO N IN IN DIAN C EM ENT IND USTRY
700
900
1100
1300
1500
1700
1960 1965 1970 1975 1980 1985 1990 1995 2000 2005
YEAR
KCA L/KG CL.
DR Y PR OC ESS K ILNS
1200 TPD 4-ST SP K ILN S
PC K ILN S
5-STAG E PC K ILN S
W E T TO D R Y C O N VER SIO N
6 STAG E PC K ILNS & M U LTI-C HAN N EL BU RN ER S
H IG H EFFIC IENC Y CO O LER S
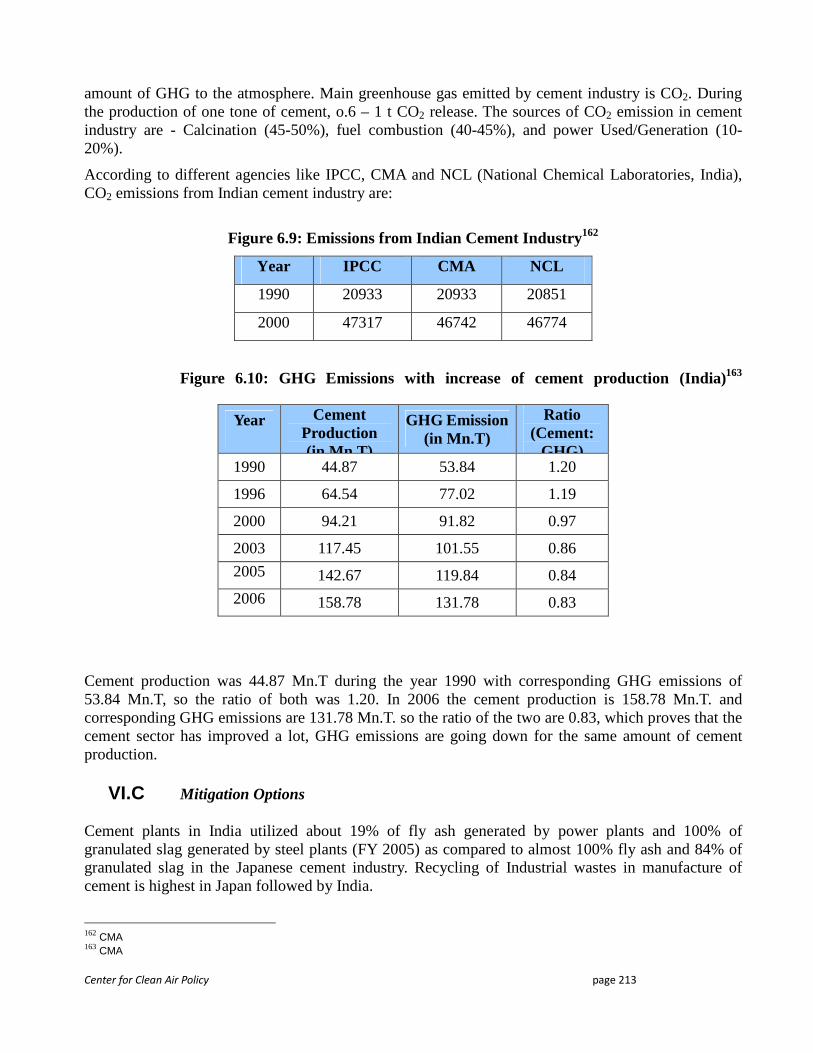
Center for Clean Air Policy page 213
amount of GHG to the atmosphere. Main greenhouse gas emitted by cement industry is CO2. During the production of one tone of cement, o.6 – 1 t CO2 release. The sources of CO2 emission in cement industry are - Calcination (45-50%), fuel combustion (40-45%), and power Used/Generation (10-20%).
According to different agencies like IPCC, CMA and NCL (National Chemical Laboratories, India), CO2 emissions from Indian cement industry are:
Figure 6.9: Emissions from Indian Cement Industry162
Year IPCC CMA NCL
1990 20933 20933 20851
2000 47317 46742 46774
Figure 6.10: GHG Emissions with increase of cement production (India) 163
Cement production was 44.87 Mn.T during the year 1990 with corresponding GHG emissions of 53.84 Mn.T, so the ratio of both was 1.20. In 2006 the cement production is 158.78 Mn.T. and corresponding GHG emissions are 131.78 Mn.T. so the ratio of the two are 0.83, which proves that the cement sector has improved a lot, GHG emissions are going down for the same amount of cement production.
VI.C Mitigation Options
Cement plants in India utilized about 19% of fly ash generated by power plants and 100% of granulated slag generated by steel plants (FY 2005) as compared to almost 100% fly ash and 84% of granulated slag in the Japanese cement industry. Recycling of Industrial wastes in manufacture of cement is highest in Japan followed by India.
162 CMA 163 CMA
Year
Cement Production (in Mn.T)
GHG Emission (in Mn.T)
Ratio (Cement:
GHG) 1990 44.87 53.84 1.20
1996 64.54 77.02 1.19
2000 94.21 91.82 0.97
2003 117.45 101.55 0.86
2005
142.67 119.84 0.84
2006
158.78 131.78 0.83
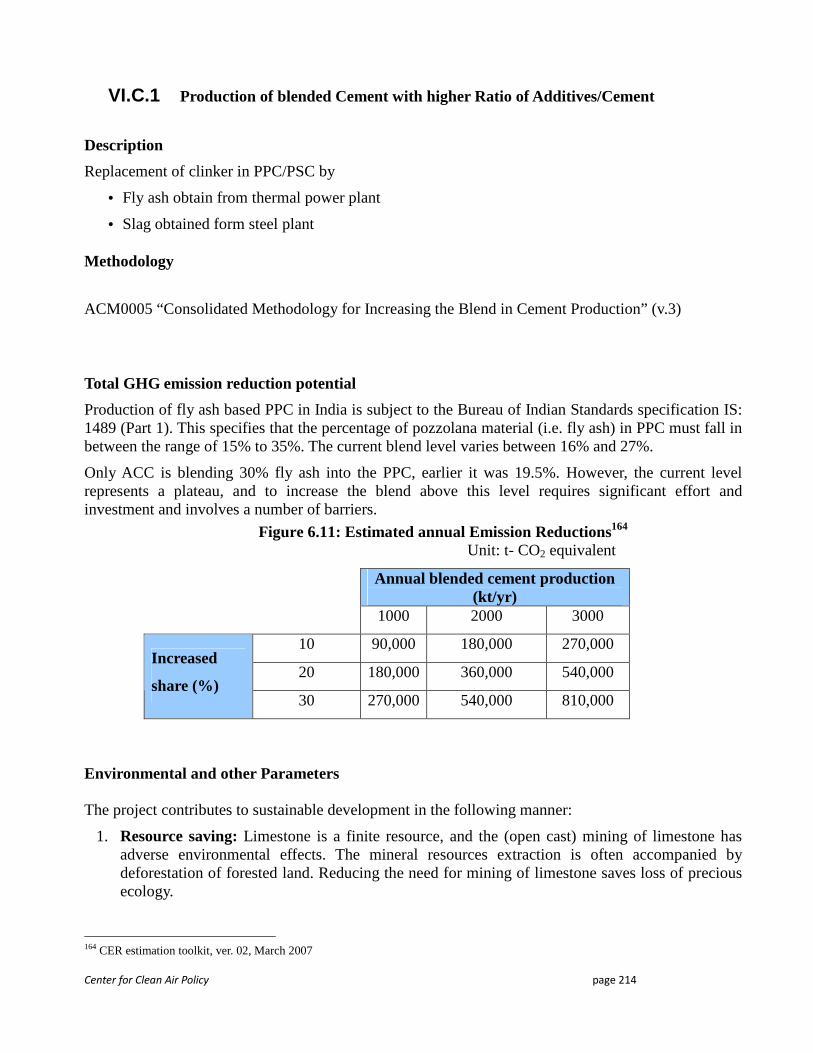
Center for Clean Air Policy page 214
VI.C.1 Production of blended Cement with higher Ratio of Additives/Cement
Description
Replacement of clinker in PPC/PSC by
• Fly ash obtain from thermal power plant
• Slag obtained form steel plant
Methodology
ACM0005 “Consolidated Methodology for Increasing the Blend in Cement Production” (v.3)
Total GHG emission reduction potential
Production of fly ash based PPC in India is subject to the Bureau of Indian Standards specification IS: 1489 (Part 1). This specifies that the percentage of pozzolana material (i.e. fly ash) in PPC must fall in between the range of 15% to 35%. The current blend level varies between 16% and 27%.
Only ACC is blending 30% fly ash into the PPC, earlier it was 19.5%. However, the current level represents a plateau, and to increase the blend above this level requires significant effort and investment and involves a number of barriers.
Figure 6.11: Estimated annual Emission Reductions164 Unit: t- CO2 equivalent
Annual blended cement production (kt/yr)
1000 2000 3000
10 90,000 180,000 270,000
20 180,000 360,000 540,000 Increased
share (%) 30 270,000 540,000 810,000
Environmental and other Parameters
The project contributes to sustainable development in the following manner:
1. Resource saving: Limestone is a finite resource, and the (open cast) mining of limestone has adverse environmental effects. The mineral resources extraction is often accompanied by deforestation of forested land. Reducing the need for mining of limestone saves loss of precious ecology.
164 CER estimation toolkit, ver. 02, March 2007
Center for Clean Air Policy page 215
2. Disposal of fly ash: Fly ash is a by-product of electricity generation by the thermal power plants, and is a product for which disposal is difficult in the region.
3. Energy Saving: Clinker production is highly energy intensive. Reducing clinker production conserves energy and releases power for supply to power stressed areas.
4. Reduced environmental load: Clinker production has associated environmental pollution impacts that would be avoided through fly ash utilization.
Investment and Marginal Abatement Costs
Since fly ash is a by-product, the initial cost of fly ash is very less than the Portland cement. For the cement producer, the cost of fly ash mainly depends upon the cost of its transportation from the thermal power plant. There are some other costs such as handling of the fly ash and possibly with any special operations required to ensure proper quality control of the material. In nearby areas to power stations, producing high quality of fly ash, there will be cost benefits associated with the use of fly ash in the production of blended cement. Thus, by use of suitable technologies, fly ash cement of equivalent quality to that of conventional cement could be produced at a lower cost. Thus, there is some instant economical benefit potential in using fly ash in cement.
The disposal of fly ash in landfills is costly for the power generating company. If a large amount of fly ash is used by the cement industry, this disposal costs would be reduced by a corresponding amount. Also, it is well-known that the suitable use of fly ash in cement improves the durability of cement, translating into increased service life of cement structures, resulting in significant savings in repair and replacement costs. Therefore, there are potential indirect economical benefits.
Barriers to Adoption of Blended Cement with higher Ratio of Additives/Cement
Producing blended cement which has a higher ratio of additives to cement has some obstacles which need to be overcome before it can be adopted as a viable mitigation option. Technology poses the biggest barrier to its adoption. The technical barriers and other problems with this mitigation option are discussed in detail below:
a) Technical Barriers Cement Strength is reduced with increasing blend of fly ash so it is difficult to increase the percentage of fly ash in PPC to the expected levels whilst maintaining the quality of the cement. Increasing the fly-ash content would reduce the early strength. It should be noted that it turns harder to obtain fly ash content as the blend level increases. The quality and hydraulic potential of clinker, the fineness of high fly ash PPC and the distribution of fly ash components in coarse fractions of cement act as a barrier to increase the fly ash blend. It is absolutely vital that the quality of PPC is maintained, otherwise its reputation and hence sales will suffer. Maintaining the quality of the cement while increasing the blending of fly ash additives represents a major technical barrier to the implementation of the project activity. BIS issued guidelines to use designated quality of fly ash, also the quantity of fly ash has been modified to a use of a minimum of 15% and a maximum 35%. Quality must suitably match the BIS quality requirement during the use of various percentages of fly ash on trial basis. Cement industry should be carried out extensively in house R&D, not only for manufacturing blend cement but with blend cement with higher blend percentage. Also training of the existing staff should be carried out for blended cement production. The fly ash contained un-burnt coal particles in terms of loss on ignition. This considered a negative quality constraint, which had an impact on colour of cement along with
Center for Clean Air Policy page 216
floating coal particles. It’s a critical parameter for production of PPC cement. The next parameter was the fineness of the fly ash to be used. Fine fly ash is needed for the project. Thus, using the fly ash available in the region could have affected the cement quality.
b) Financial or Economic Barriers At initial stage a huge amount of money is needed to invest into transportation, storage and handling of fly ash. As there was significant market uncertainty (due to customer perceptions on PPC) at the start of the project, it is challenging to take a business risk of introducing fly ash blended cement. This challenge is significantly experiencing severe financial crunch on account of its business losses.
c) Market Acceptability Barrier
In India, There is a general perception among the customers that the quality of cement reduced with the increasing percentage of fly ash, therefore they will tend not to purchase such cement and it is undesirable to increase the blending of fly ash. Furthermore there is the potential that PPC acceptance is particularly low in some government agencies – the Central Public Works Department has imposed a ban on the use of blended cements in bridges and other concrete works and constructions. Moreover, there is the potential that the brand name could be negatively impacted by the blend increase. The majority of the barriers identified in this regard are lack of knowledge of consumers and lack of initiative on the part of both manufacturers and other agencies in promoting blended cements Domestic Policy Options for Blended Cement with higher Ratio of Additives/Cement
VI.C.2 Switch to less Carbon Intensive Fuel in Kiln
Coal continues to be the main fuel for the Indian cement industry and will remain so in the near future as well. The industry is mainly using coal from various coalfields in the country. It is also procuring coal through open market and direct imports. Cement plants are also using lignite from deposits in Gujarat and Rajasthan. Use of hazardous and refuse derived combustibles and municipal solid waste as fuel is common in countries like Canada, EU, Japan and Korea, but regulations do not yet permit such use in India.
Description
Projects that include switching from more carbon intensive to less carbon intensive fossil fuel; e.g. shifting for Coal to Natural Gas or application of waste derived alternative fuels; like: • Gaseous alternative fuels (like coke oven gas, refinery gas, pyrolisis gas, landfill gas) • Liquid alternative fuels (like Halogen free spend solvents, mineral oils, distillation residues,
hydraulic oils, insulating oils) • Solid alternative fuels (waste wood, dried sewage sludge, plastic, agriculture residues, tyres,
petroleum coke, tar) • The following fuels are considered to have good potential in the present context of Indian
economics to either partially or fully substitute coal in cement manufacture in the coming years: • Pet coke • Lignite • Natural gas • Waste derived fuels (including used rubber tyres)
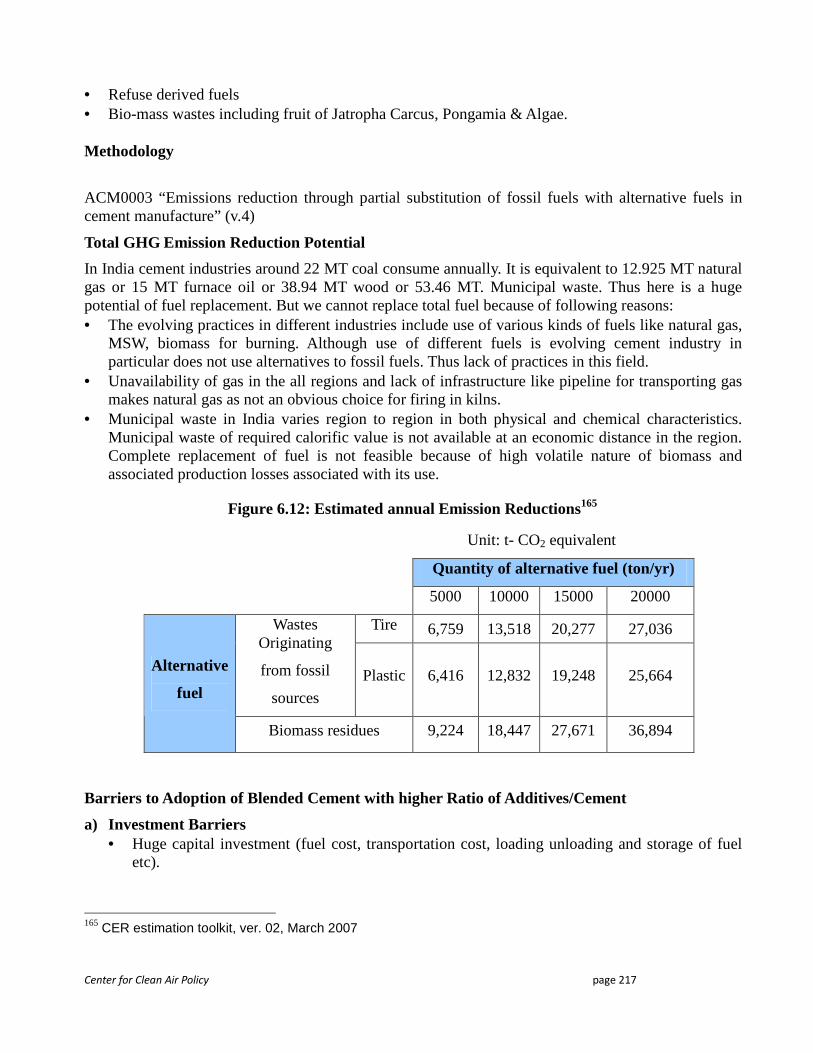
Center for Clean Air Policy page 217
• Refuse derived fuels • Bio-mass wastes including fruit of Jatropha Carcus, Pongamia & Algae.
Methodology
ACM0003 “Emissions reduction through partial substitution of fossil fuels with alternative fuels in cement manufacture” (v.4)
Total GHG Emission Reduction Potential
In India cement industries around 22 MT coal consume annually. It is equivalent to 12.925 MT natural gas or 15 MT furnace oil or 38.94 MT wood or 53.46 MT. Municipal waste. Thus here is a huge potential of fuel replacement. But we cannot replace total fuel because of following reasons: • The evolving practices in different industries include use of various kinds of fuels like natural gas,
MSW, biomass for burning. Although use of different fuels is evolving cement industry in particular does not use alternatives to fossil fuels. Thus lack of practices in this field.
• Unavailability of gas in the all regions and lack of infrastructure like pipeline for transporting gas makes natural gas as not an obvious choice for firing in kilns.
• Municipal waste in India varies region to region in both physical and chemical characteristics. Municipal waste of required calorific value is not available at an economic distance in the region. Complete replacement of fuel is not feasible because of high volatile nature of biomass and associated production losses associated with its use.
Figure 6.12: Estimated annual Emission Reductions165
Unit: t- CO2 equivalent
Quantity of alternative fuel (ton/yr)
5000 10000 15000 20000
Tire 6,759 13,518 20,277 27,036 Wastes Originating
from fossil
sources
Plastic 6,416 12,832 19,248 25,664 Alternative
fuel
Biomass residues 9,224 18,447 27,671 36,894
Barriers to Adoption of Blended Cement with higher Ratio of Additives/Cement
a) Investment Barriers • Huge capital investment (fuel cost, transportation cost, loading unloading and storage of fuel
etc).
165 CER estimation toolkit, ver. 02, March 2007
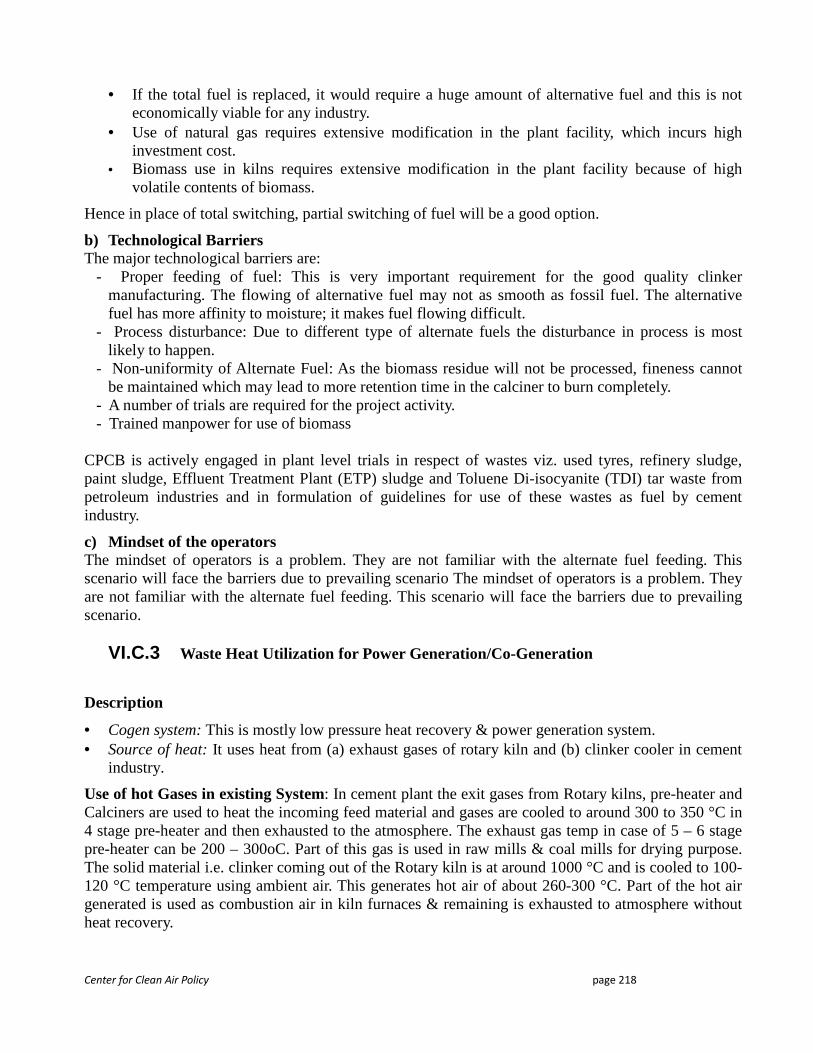
Center for Clean Air Policy page 218
• If the total fuel is replaced, it would require a huge amount of alternative fuel and this is not economically viable for any industry.
• Use of natural gas requires extensive modification in the plant facility, which incurs high investment cost.
• Biomass use in kilns requires extensive modification in the plant facility because of high volatile contents of biomass.
Hence in place of total switching, partial switching of fuel will be a good option.
b) Technological Barriers The major technological barriers are:
- Proper feeding of fuel: This is very important requirement for the good quality clinker manufacturing. The flowing of alternative fuel may not as smooth as fossil fuel. The alternative fuel has more affinity to moisture; it makes fuel flowing difficult.
- Process disturbance: Due to different type of alternate fuels the disturbance in process is most likely to happen.
- Non-uniformity of Alternate Fuel: As the biomass residue will not be processed, fineness cannot be maintained which may lead to more retention time in the calciner to burn completely.
- A number of trials are required for the project activity. - Trained manpower for use of biomass
CPCB is actively engaged in plant level trials in respect of wastes viz. used tyres, refinery sludge, paint sludge, Effluent Treatment Plant (ETP) sludge and Toluene Di-isocyanite (TDI) tar waste from petroleum industries and in formulation of guidelines for use of these wastes as fuel by cement industry.
c) Mindset of the operators The mindset of operators is a problem. They are not familiar with the alternate fuel feeding. This scenario will face the barriers due to prevailing scenario The mindset of operators is a problem. They are not familiar with the alternate fuel feeding. This scenario will face the barriers due to prevailing scenario.
VI.C.3 Waste Heat Utilization for Power Generation/Co-Generation
Description
• Cogen system: This is mostly low pressure heat recovery & power generation system. • Source of heat: It uses heat from (a) exhaust gases of rotary kiln and (b) clinker cooler in cement
industry.
Use of hot Gases in existing System: In cement plant the exit gases from Rotary kilns, pre-heater and Calciners are used to heat the incoming feed material and gases are cooled to around 300 to 350 °C in 4 stage pre-heater and then exhausted to the atmosphere. The exhaust gas temp in case of 5 – 6 stage pre-heater can be 200 – 300oC. Part of this gas is used in raw mills & coal mills for drying purpose. The solid material i.e. clinker coming out of the Rotary kiln is at around 1000 °C and is cooled to 100-120 °C temperature using ambient air. This generates hot air of about 260-300 °C. Part of the hot air generated is used as combustion air in kiln furnaces & remaining is exhausted to atmosphere without heat recovery.
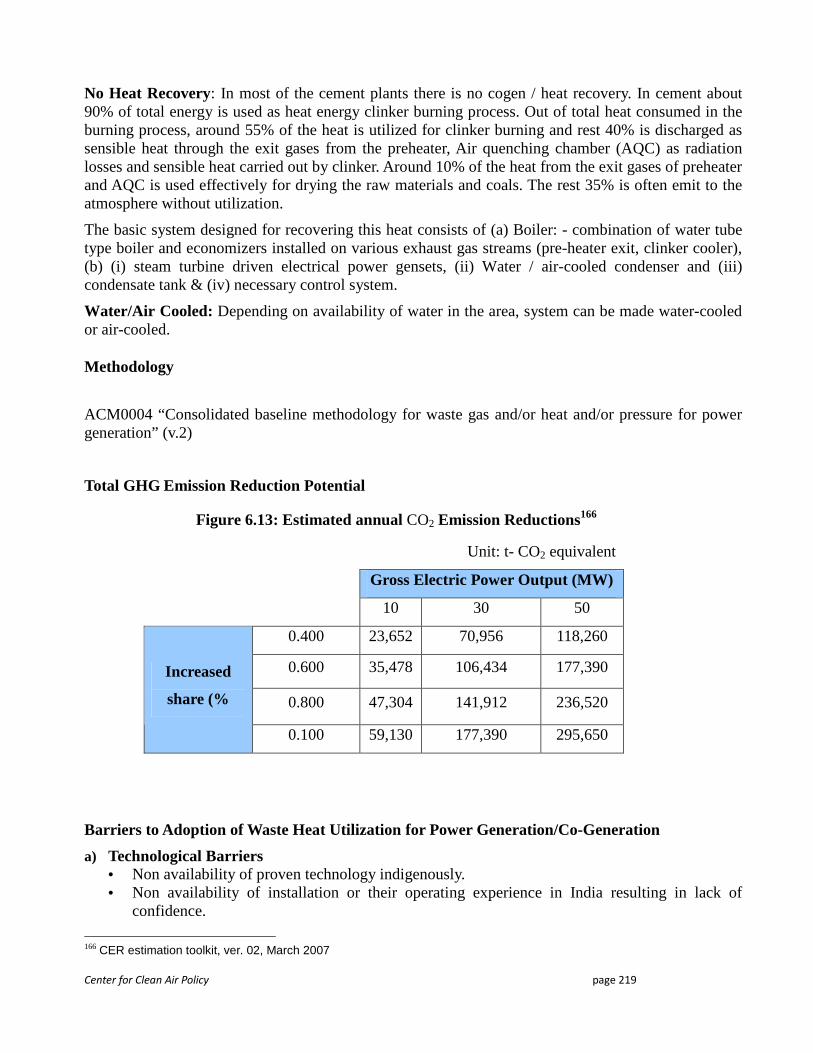
Center for Clean Air Policy page 219
No Heat Recovery: In most of the cement plants there is no cogen / heat recovery. In cement about 90% of total energy is used as heat energy clinker burning process. Out of total heat consumed in the burning process, around 55% of the heat is utilized for clinker burning and rest 40% is discharged as sensible heat through the exit gases from the preheater, Air quenching chamber (AQC) as radiation losses and sensible heat carried out by clinker. Around 10% of the heat from the exit gases of preheater and AQC is used effectively for drying the raw materials and coals. The rest 35% is often emit to the atmosphere without utilization.
The basic system designed for recovering this heat consists of (a) Boiler: - combination of water tube type boiler and economizers installed on various exhaust gas streams (pre-heater exit, clinker cooler), (b) (i) steam turbine driven electrical power gensets, (ii) Water / air-cooled condenser and (iii) condensate tank & (iv) necessary control system.
Water/Air Cooled: Depending on availability of water in the area, system can be made water-cooled or air-cooled.
Methodology
ACM0004 “Consolidated baseline methodology for waste gas and/or heat and/or pressure for power generation” (v.2)
Total GHG Emission Reduction Potential
Figure 6.13: Estimated annual CO2 Emission Reductions166
Unit: t- CO2 equivalent
Gross Electric Power Output (MW)
10 30 50
0.400 23,652 70,956 118,260
0.600 35,478 106,434 177,390
0.800 47,304 141,912 236,520
Increased
share (%
0.100 59,130 177,390 295,650
Barriers to Adoption of Waste Heat Utilization for Power Generation/Co-Generation
a) Technological Barriers • Non availability of proven technology indigenously. • Non availability of installation or their operating experience in India resulting in lack of
confidence.
166 CER estimation toolkit, ver. 02, March 2007
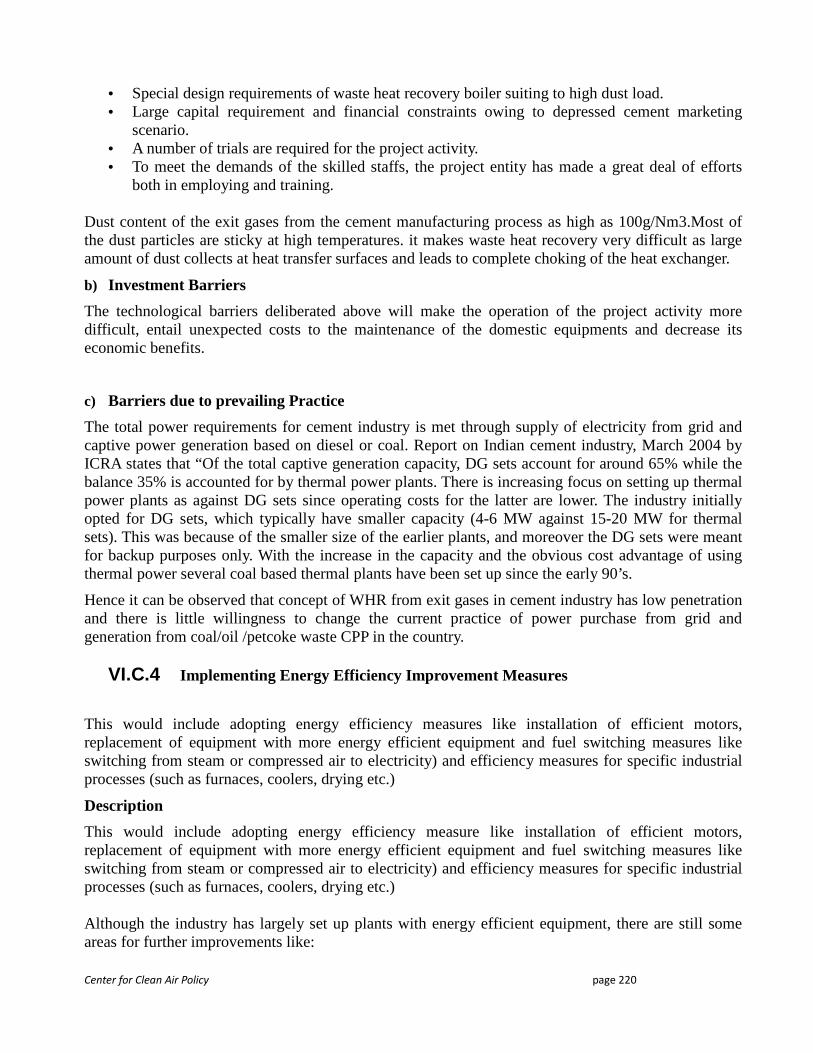
Center for Clean Air Policy page 220
• Special design requirements of waste heat recovery boiler suiting to high dust load. • Large capital requirement and financial constraints owing to depressed cement marketing
scenario. • A number of trials are required for the project activity. • To meet the demands of the skilled staffs, the project entity has made a great deal of efforts
both in employing and training.
Dust content of the exit gases from the cement manufacturing process as high as 100g/Nm3.Most of the dust particles are sticky at high temperatures. it makes waste heat recovery very difficult as large amount of dust collects at heat transfer surfaces and leads to complete choking of the heat exchanger.
b) Investment Barriers
The technological barriers deliberated above will make the operation of the project activity more difficult, entail unexpected costs to the maintenance of the domestic equipments and decrease its economic benefits.
c) Barriers due to prevailing Practice
The total power requirements for cement industry is met through supply of electricity from grid and captive power generation based on diesel or coal. Report on Indian cement industry, March 2004 by ICRA states that “Of the total captive generation capacity, DG sets account for around 65% while the balance 35% is accounted for by thermal power plants. There is increasing focus on setting up thermal power plants as against DG sets since operating costs for the latter are lower. The industry initially opted for DG sets, which typically have smaller capacity (4-6 MW against 15-20 MW for thermal sets). This was because of the smaller size of the earlier plants, and moreover the DG sets were meant for backup purposes only. With the increase in the capacity and the obvious cost advantage of using thermal power several coal based thermal plants have been set up since the early 90’s.
Hence it can be observed that concept of WHR from exit gases in cement industry has low penetration and there is little willingness to change the current practice of power purchase from grid and generation from coal/oil /petcoke waste CPP in the country.
VI.C.4 Implementing Energy Efficiency Improvement Measures
This would include adopting energy efficiency measures like installation of efficient motors, replacement of equipment with more energy efficient equipment and fuel switching measures like switching from steam or compressed air to electricity) and efficiency measures for specific industrial processes (such as furnaces, coolers, drying etc.)
Description
This would include adopting energy efficiency measure like installation of efficient motors, replacement of equipment with more energy efficient equipment and fuel switching measures like switching from steam or compressed air to electricity) and efficiency measures for specific industrial processes (such as furnaces, coolers, drying etc.) Although the industry has largely set up plants with energy efficient equipment, there are still some areas for further improvements like:

Center for Clean Air Policy page 221
• Appropriate pre-blending facilities for raw materials • Fully automatic process control and monitoring facilities including auto samplers and controls. • Appropriate co-processing technologies for use of hazardous and non hazardous wastes • Interactive standard software expert packages for process and operation control with technical
consultancy back-up • Energy efficient equipment for auxiliary/minor operations • Mechanized cement loading operations, palletization/shrink wrapping • Bulk loading and transportation, pneumatic cement transport • Low NOx/SO2 combustion systems and precalciners • Standards for making composite cement so that all the fly ash and other industrial wastes viz. slag
are fully used. • Co-generation of power through cost-effective waste heat recovery system (only one
demonstration unit in operation) • Horizontal roller mills (Horo Mills) for raw material and cement grinding • Advanced computerized kiln control system based on artificial intelligence Methodologies Various methodologies are available at UNFCCC for different types of projects.
Total GHG Emission Reduction Potential
Tables show the Energy Efficiency Measures in Dry and Wet Process Cement Plants. The estimated savings and payback periods are averages for indication, based on the average performance of the U.S. cement industry (e.g. clinker to cement ratio). The actual savings and payback period may vary by project based on the specific conditions in the individual plant.
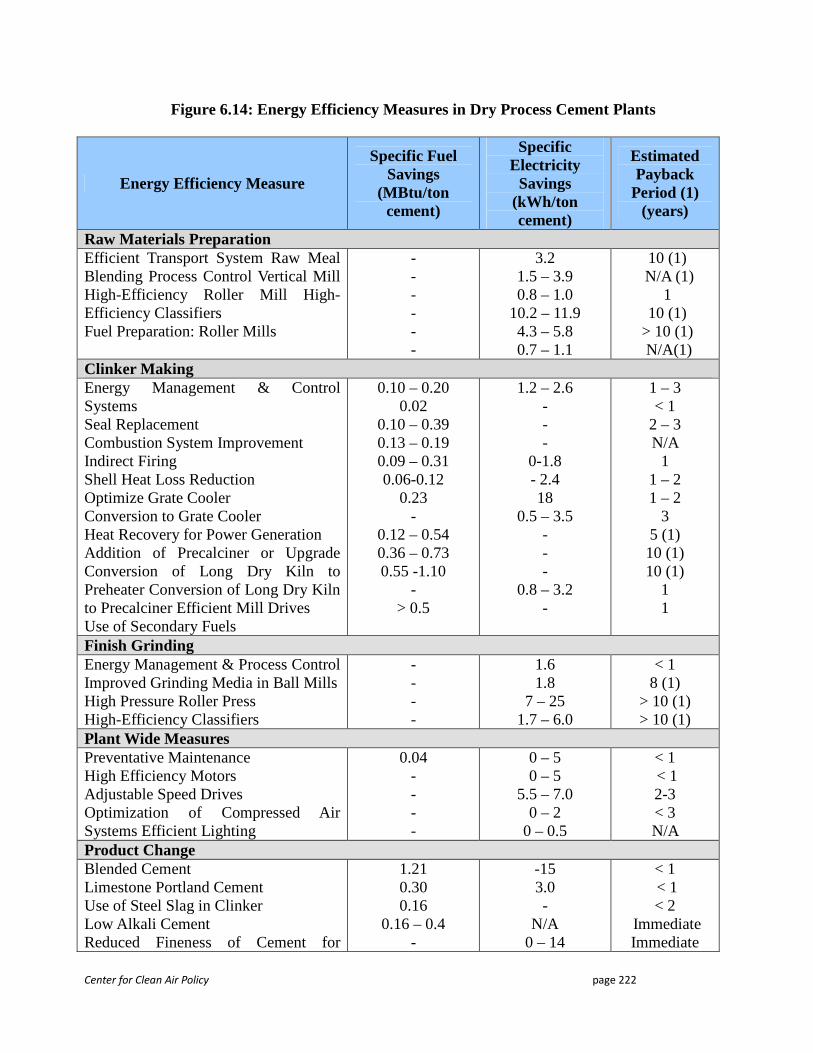
Center for Clean Air Policy page 222
Figure 6.14: Energy Efficiency Measures in Dry Process Cement Plants
Energy Efficiency Measure
Specific Fuel Savings
(MBtu/ton cement)
Specific Electricity
Savings (kWh/ton cement)
Estimated Payback
Period (1) (years)
Raw Materials Preparation Efficient Transport System Raw Meal Blending Process Control Vertical Mill High-Efficiency Roller Mill High-Efficiency Classifiers Fuel Preparation: Roller Mills
- - - - - -
3.2 1.5 – 3.9 0.8 – 1.0
10.2 – 11.9 4.3 – 5.8 0.7 – 1.1
10 (1) N/A (1)
1 10 (1)
> 10 (1) N/A(1)
Clinker Making Energy Management & Control Systems Seal Replacement Combustion System Improvement Indirect Firing Shell Heat Loss Reduction Optimize Grate Cooler Conversion to Grate Cooler Heat Recovery for Power Generation Addition of Precalciner or Upgrade Conversion of Long Dry Kiln to Preheater Conversion of Long Dry Kiln to Precalciner Efficient Mill Drives Use of Secondary Fuels
0.10 – 0.20 0.02
0.10 – 0.39 0.13 – 0.19 0.09 – 0.31 0.06-0.12
0.23 -
0.12 – 0.54 0.36 – 0.73 0.55 -1.10
- > 0.5
1.2 – 2.6 - - -
0-1.8 - 2.4 18
0.5 – 3.5 - - -
0.8 – 3.2 -
1 – 3 < 1
2 – 3 N/A
1 1 – 2 1 – 2
3 5 (1) 10 (1) 10 (1)
1 1
Finish Grinding Energy Management & Process Control Improved Grinding Media in Ball Mills High Pressure Roller Press High-Efficiency Classifiers
- - - -
1.6 1.8
7 – 25 1.7 – 6.0
< 1 8 (1)
> 10 (1) > 10 (1)
Plant Wide Measures Preventative Maintenance High Efficiency Motors Adjustable Speed Drives Optimization of Compressed Air Systems Efficient Lighting
0.04 - - - -
0 – 5 0 – 5
5.5 – 7.0 0 – 2
0 – 0.5
< 1 < 1 2-3 < 3 N/A
Product Change Blended Cement Limestone Portland Cement Use of Steel Slag in Clinker Low Alkali Cement Reduced Fineness of Cement for
1.21 0.30 0.16
0.16 – 0.4 -
-15 3.0 -
N/A 0 – 14
< 1 < 1 < 2
Immediate Immediate
Center for Clean Air Policy page 223
Selected Uses Notes: Payback periods are calculated on the basis of energy savings alone. In reality this investment may be driven by other considerations than energy efficiency (e.g. productivity, product quality), and will happen as part of the normal business cycle or expansion project. Under these conditions the measure will have a lower payback period depending on plant-specific conditions. * Estimated short and long time periods are given by energy saving parameters, considering short time accomplishment as the periods up to 3 years shown in the above figure.
VI.C.5 Energy Management
The industry’s average consumption in 2005-06 was 725 kcal/kg clinker thermal energy and 82 kWh/t cement electrical energy. It is expected that the industry’s average thermal energy consumption by the end of Year 2011-12 will come down to about 710 kcal/kg clinker and the average electrical energy consumption will come down to 78 kWh/t cement.
The best thermal and electrical energy consumption presently achieved in India is 667 kcal/kg clinker and 68 kWh/t cement which are comparable to the best figures of 650 kcal/kg clinker and 65 kWh/t cement in a developed country like Japan.
Existing Policies for the Benchmarking Process, Operation and Management Control Practice by Indian Cement Industry
Adoption of modern technology alone is not adequate for achieving excellence. The experience in most developed countries has shown that transparency in operation, regular information exchange and comparative assessment of performance among plants or group of plants serve as a catalyst for performance improvement. Keeping this principle in view, the CMA (in collaboration with an International Consultancy Agency) had embarked upon a project on benchmarking for performance enhancement of the cement industry in energy conservation, pollution control, productivity improvement and material conservation. The trial model developed initially with participation of 8 plants of large capacity distributed evenly throughout the country has taken into account three primary factors in performance assessment for benchmarking and rating, namely, Technology Level, Process and Operational Parameters and Control and Management Practice. The benchmarking exercise revealed interesting features and helped plants to improve their performance.
A revised model developed indigenously by CMA is now introduced and is operating with participation of 22 plants.
The objectives of benchmarking exercise carried out jointly by CMA & NCB are: • Best practice identification in technology, management or control – monitoring • Assessment of gaps in technology/management • Investment sensitivity assessment • Selection of optimum technology/management at minimum cost and maximum benefit • Least cost strategies for CO2 emission reduction
CMA Benchmarking Exercise: • Improve productivity • Reduce Energy Consumption • Increase profitability • Compares your plant with similar others
Center for Clean Air Policy page 224
• It regularly tracks and reports to participating plants their individual performance with respect to the “Average” and “Best” Performer in respective affinity groups.
• An affinity Group for any particular major equipment or auxiliary includes the same type of equipment, providing thereby a comparison between the likes only.
VI.D Other Supporting Domestic Policy Options for the Cement Industry
There are some other domestic policy options that supports to cement industry:
VI.D.1 Domestic Policy Options for Blended Cement with higher Ratio of
Additives/Cement
a) Financial Incentives (taxes, appropriations) The government can play a role by taking strategic initiatives like increasing the concession on excise duty on blended cements, or providing sales tax exemption benefits to producers of blended cement. Key benefits accruing to the country from this move would include greater pollution control (because of the effective use of waste material like slag) and preservation of the valuable limestone reserve of the country. Besides, it would also help in improving the construction quality in the country. With a view to motivate Indian cement industry to produce blended cement, FICCI has suggested that there is need for a change the excise duty structure to include a special classification for blended cements; a differentially lower excise duty and lower VAT rate for blended cements (versus non blended variants) containing a minimum level of 25% of fly ash / 50% of blast furnace slag respectively; and provision of capital subsidy for setting up facilities for manufacturing blended cement and fly- ash classifiers.
b) Research and Development (R&D) Cement industry should be carried out extensive in house R&D for not only manufacturing blend cement but with blend cement with higher blend percentage. Also training of the existing staff should be carried out for blended cement production.
c) Awareness Programme This includes educating the consumers on the usage of blended cements through seminars, technical workshops at national / regional levels and through small meetings at the local level, and increasing awareness among the general public through advertisements, electronic media, newspapers etc.
d) Categorization of Blended Cements Categorization of blended cements like 30, 40, 50 and 60 Mpa grade so that customers can choose as per their needs. Promotion of PPC and PSC usage in large construction projects is to be augmented.
e) Construction Codes of Central/State Governments modified to allow use of PPC and slag Presently, OPC is used in the Government/ Public Sector for most construction activities. The performance requirements of most constructions could be met by using PPC/ Slag cement. With a view to promote use of PPC and Slag cement in order to conserve non-renewable resources and efficient resource utilization, the Construction codes of Central/ State Governments and their entities should be appropriately modified to allow use of PPC and slag.
Center for Clean Air Policy page 225
VI.D.2 Domestic Policy Options for Fuel Switch to Lesser Carbon intensive Fuel in Kiln
For this purpose following policies will be needed:
• Extension programs to facilitate the general use of new (Biomass/less carbon intensive) energy technologies
• R&D in new energy (less carbon intensive) technologies
• To provide adequate incentives to local entrepreneurs for the production of biomass energy conversion systems
• Training of skilled manpower for the maintenance of new energy conversion systems.
• To develop skilled manpower and providing basic engineering infrastructure for the local production of components and spare parts for biomass and other less carbon intensive fuels.
• Pet coke has been successfully utilized by some cement plants, mainly in Gujarat, Rajasthan and MP, thereby substituting main fossil and conventional fuel coal up to 100% in some plants. Pet coke from petroleum refineries is an alternative fuel for the cement industry. Currently, the availability of pet coke is only 4 Mn.T. from the refineries in Gujarat and Panipat. Additional requirement of pet coke has to be imported from middle-east countries.
VI.D.3 Domestic Policy Options for Waste Heat Recovery Utilization
With a view to commercially harness new resources and waste heat generated in the production process, the following initiatives should be taken:
• Setting up a pilot project under public private partnership for use of algae growth as fuel through carbon dioxide fertilization. Ministry of Non Conventional Energy could be requested to coordinate and assist.
• Incentive setting up of plants for cogeneration using waste heat recovery in production process. The incentive could include capital subsidy and tax exemption
The Ministry of Environment & Forests (MoEF) should formulate guidelines for:
• Implementing the principle of ‘Polluter to Pay’ for disposal of wastes.
• Treatment, storage & disposal facilities for cost effective co processing of combustible industrial wastes in cement kilns as an alternative to incineration.
• Restricting land filling of hazardous and toxic combustible wastes having potential for co-processing in cement kilns.
Cement plants in India utilized about 19% of fly ash generated by power plants and 100% of granulated slag generated by steel plants (FY 2005) as compared to almost 100% fly ash and 84% of granulated slag in the Japanese cement industry. Recycling of Industrial wastes in manufacture of cement is highest in Japan followed by India.
The BIS should develop quality standards so as to allow manufacture of composite cement using various sorts of waste products, in line with the international practices.
Center for Clean Air Policy page 226
VI.D.4 Policy Options for Energy Efficiency Improvement Measures
Duty free import of pollution control and energy efficiency improving equipments should be allowed.
Following policies and programmes will play a vital role to increase energy efficiency in terms of short, medium and long run accomplishment (I: immediately, S: short term, M: medium term, L: long term):
• Good house keeping practices (I)
• Regulation and/or Standards (M)
• Industrial cogeneration (M)
• Fuel switching (S, M, L)
• Fiscal policies like taxes, tax rebates, subsidies etc. (S, M)
• Benchmarking (M)
• Energy audits (M)
• Information dissemination and demonstration (M)
• Research and development. (S, M, L)
• Educational and training programmes (S, M)
• Harnessing carbon market opportunities (S, M)
VI.D.5 Domestic Policy Options for Energy Management Practices
Cement industry is already very efficient and using latest technology. This can be seen by this that Indian Cement industry is the second most efficient in the world. Apart from achieving energy reduction through technological upgrading in plant and machinery, there are a number of softer approaches that need to be adopted to improve the energy performance at the plant level.
• Top management commitment: Top management commitment is very important to ensure that the junior employees participate effectively in various energy management activities. Daily monitoring of section wise energy consumption levels by the section heads and comparison with the set norms can give very positive signals to the operators of the importance being attached by the management to energy consumption. Deviation from the set targets should be analyzed thoroughly and grey areas located so that corrective actions can be initiated.
• Energy Management Cell: There should be an energy management cell with full time energy manager responsible for overseeing its functioning. Apart from the regular activities of the EMC with regard to regular reporting and monitoring, the EMC must also be made responsible for imparting training to the junior plant personnel on energy management, initiating regular energy audits, and initiating and monitoring implementation of the recommendations of the energy audit.
• Targets and budgets: Importance of having realistic short term and long term targets for reducing energy consumption was stressed. Separate budgets must be earmarked on an annual basis for modernization of plant and machinery and for smaller incremental improvements.
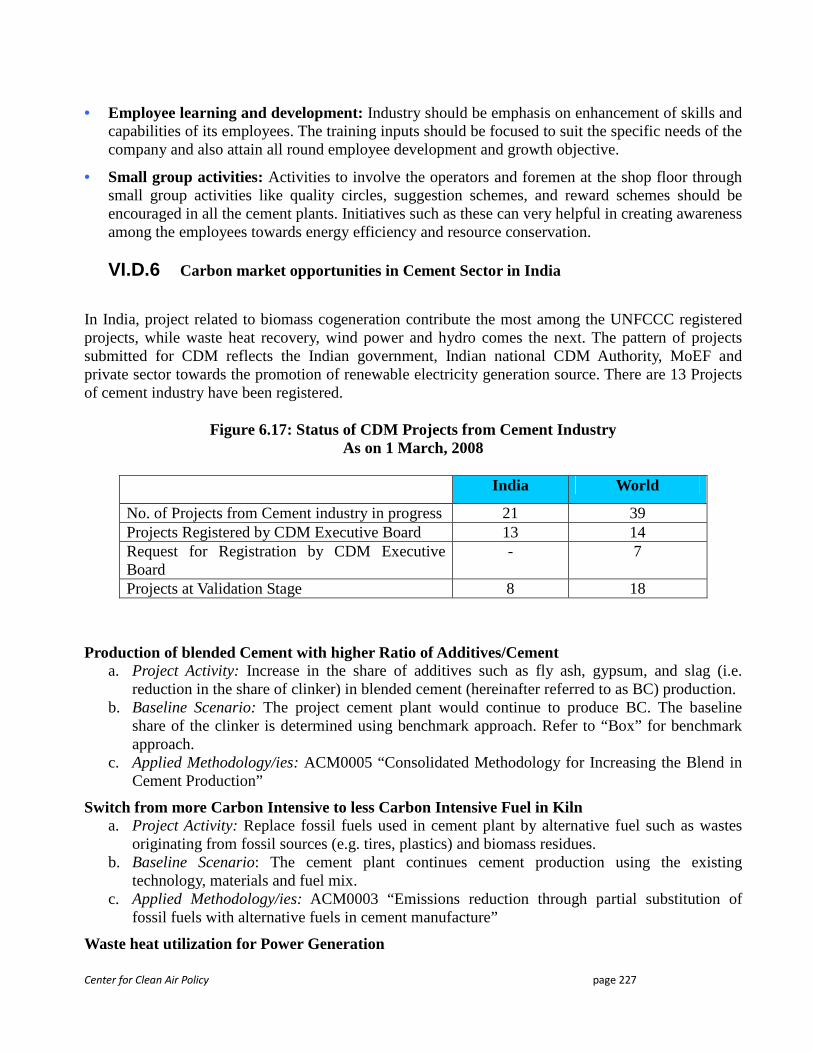
Center for Clean Air Policy page 227
• Employee learning and development: Industry should be emphasis on enhancement of skills and
capabilities of its employees. The training inputs should be focused to suit the specific needs of the company and also attain all round employee development and growth objective.
• Small group activities: Activities to involve the operators and foremen at the shop floor through small group activities like quality circles, suggestion schemes, and reward schemes should be encouraged in all the cement plants. Initiatives such as these can very helpful in creating awareness among the employees towards energy efficiency and resource conservation.
VI.D.6 Carbon market opportunities in Cement Sector in India
In India, project related to biomass cogeneration contribute the most among the UNFCCC registered projects, while waste heat recovery, wind power and hydro comes the next. The pattern of projects submitted for CDM reflects the Indian government, Indian national CDM Authority, MoEF and private sector towards the promotion of renewable electricity generation source. There are 13 Projects of cement industry have been registered.
Figure 6.17: Status of CDM Projects from Cement Industry
As on 1 March, 2008
India World
No. of Projects from Cement industry in progress 21 39 Projects Registered by CDM Executive Board 13 14 Request for Registration by CDM Executive Board
- 7
Projects at Validation Stage 8 18
Production of blended Cement with higher Ratio of Additives/Cement
a. Project Activity: Increase in the share of additives such as fly ash, gypsum, and slag (i.e. reduction in the share of clinker) in blended cement (hereinafter referred to as BC) production.
b. Baseline Scenario: The project cement plant would continue to produce BC. The baseline share of the clinker is determined using benchmark approach. Refer to “Box” for benchmark approach.
c. Applied Methodology/ies: ACM0005 “Consolidated Methodology for Increasing the Blend in Cement Production”
Switch from more Carbon Intensive to less Carbon Intensive Fuel in Kiln a. Project Activity: Replace fossil fuels used in cement plant by alternative fuel such as wastes
originating from fossil sources (e.g. tires, plastics) and biomass residues. b. Baseline Scenario: The cement plant continues cement production using the existing
technology, materials and fuel mix. c. Applied Methodology/ies: ACM0003 “Emissions reduction through partial substitution of
fossil fuels with alternative fuels in cement manufacture”
Waste heat utilization for Power Generation
Center for Clean Air Policy page 228
a. Project Activity: Introducing a waste heat recovery and an electricity generation system at an industrial plant.
b. Baseline Scenario: Purchase of grid electricity (the generation of power in grid-connected power plants).
c. Applied Methodology/ies: ACM0004 “Consolidated baseline methodology for waste gas and/or heat and/or pressure for power generation”
VI.D.7 Key Players to be involved
The following key players will be involved in the implementation of mitigation options and their corresponding policies in the cement sector-
• Ministry of Commerce & Industry • Department of industrial policy & promotion (DIPP) • Bureau of energy efficiency • Ministry of Environment & Forests • Ministry of New and Renewable energy • State departments Environment & forests • Bureau of Indian Standard • Ministry of Road Transport & Highways • Ministry of Health • Indian Bureau of Mines (Ministry of Mines) • Factories inspectorate (Ministry of labour) • District Administration and Local Bodies • Industry associations • Central pollution Control Board
VI.D.8 Other Policy Options
There are other supporting policies, which when adopted can help in reduction of GHG emissions from the Indian cement sector:
a) ISO Accreditation: Presently 76 cement plants have ISO-9000 (Quality Management System) certification, 38 plants ISO-14000 (Environmental Management System) certification and 15 plants ISO-18000 (Occupational health and Safety Management System) certification. More and more cement plants are seeking these quality certifications. All large plants should have ISO 9000 (Quality Management System) and ISO 14000 (Environmental Management System) Certification by the end of the XI Plan.
b) Human Resource Development and Training: The importance of human resource development cannot be over-emphasized. A large body of trained man-power and specialists already exists in the country, with experience in the fields of mill design, manufacturing and installation, commissioning and operation. This vast resource has to be drawn upon for bridging the current technology gaps through an elaborate process of training as well as exposure to the operation of modern plants. Greater stress has to be put on the development of skills for computer aided design, development of mathematical models and software for specific automation and control applications and development of state-of-the-art equipment
Center for Clean Air Policy page 229
through research and development efforts as well as through technology acquisition through foreign collaborations.
c) Research and Development: Research and development is required to upgrade the cement industry. Some thrust areas are:
• Increase blending of fly ash in cement. • Improving the performance of size reduction operations. • Evaluation of technologies for co-generation of power from waste heat. • Adaptation of low NOx & low SO2 technologies • Development of cements and binders based on nano-technology.
In 2005-06, the R&D expenditure was only 0.08% of sales turnover of the cement industry. This was substantially lower compared to about 0.23% in Japan in 2001. Though the Government collects Cement Cess for R&D purposes from cement manufacturers, only a partial amount from the collections is allocated for R&D activities.
Nano Technology: Application of nano-technology to cement and concrete should constitute a major thrust area of R&D for development of eco-friendly, high performance cement/binders and concrete with improved durability characteristics.
d) Technology Transfer: There is a need to evolve appropriate mechanisms for transfer of technologies to the industry whether developed indigenously or imported. Possibility of securing financial support under various schemes, existing or initiated in the XI Plan needs to be explored. There is a need for assessment of technologies proposed to be imported by the cement plants with a view to assimilate and adapt these. National Council for Cement and Building materials (NCB) is ideally placed to act as a nodal agency for this purpose.
e) Utilization of Cement Cess: Total Cement Cess collected should be kept in a separate account and fully used for:
• R&D covering productivity, energy, environments, wastes utilization, alternate fuels, quality, application of nano-technology etc.
• Capability building for testing and utilization of hazardous wastes and adoption of state-of-the-art technologies.
• Skill upgrading and institutional capability building for HRD to meet the changing scenario, including setting up of a national level training institute & upgrading of Regional Training Centres (RTCs.)
f) Afforestation/Reforestation Projects in Mining Areas: The cement industry has been indicted for its bad mining practices. The Indian cement industry spends as little as 4% of its turnover on the cost of its raw material, limestone. Since all limestone mines are captive mines of cement plants, and mining regulations are poor, the cement industry is not investing in mine management. In fact, the overall sector score for mining is only 24% efficiency, compared to 50% scores in areas in which the sector has done well, such as technology and energy use. Regulations on the location of mines are poorly implemented -- many mines are located close to wildlife sanctuaries and reserve forests. The GRP survey found that 44% of the mines it assessed were located in ecologically sensitive areas. Mines have also depleted groundwater and led to acute water shortages in some areas, resulting in local communities protesting against the sector. Aforestation/Reforestation projects can be developed in these mining areas. Every Large cement plant has its own captive mines. These captive mines along with spaces in
Center for Clean Air Policy page 230
plant can be taken up. This project can be better handled with large groups having 4-5 cement plants. Definitely there will be a need of huge investment. Carbon market mechanisms can play a vital role for this project.
g) Export/Import: India exported 9.19 Mn.T. cement and clinker in 2005-06. With appropriate interventions, the annual exports could be doubled during the XI Plan. Lack of infrastructure facilities, both for movement of cement from landlocked units and at Ports, is a deterrent to exports. There is no dedicated berth for handling cement at any of the Indian Ports. The best loading rate of cement at Indian Port is 2,500 tonnes/day, which is far below the international levels of 12,000 – 15,000 tonnes/day.
h) Government needs to facilitate setting up of at least a terminal each on the east and west coast for exports. Cement manufacturers should be encouraged to explore the possibilities of markets and consultancy business in Asia, Europe, Africa, etc.
i) Though export of cement is limited, concerted efforts are required to protect the existing export markets in view of increasing competition from China. In this regard following steps are required:
• Reduction of taxes and levies. • Making available power and other inputs at international prices. • Reducing port and bunker charges. • Including cement and clinker in the focused products for the purposes of exports. • Cement and clinker should be included for preferential treatment in FTA with Bangladesh.
j) Bulk Transportation: While the world over 70% of cement is transported in bulk, it accounts for only 5% in India. Modernization of construction industry is heavily dependent on easy availability of cement in bulk and Ready Mix Concrete (RMC) plants near the consumption centres. Transportation of cement in bulk is devoid of seepage and pilferage. It is environment friendly, and ensures easy availability of cement in large volumes and consistency in quality. It needs lesser storage space and enhances the shelf-life of cement.
With the advent of mega infrastructure projects, large housing complexes, shopping malls and other large construction activities, transport of cement in bulk provides huge advantages to construction industry.
Bulk cement transportation in specialized tankers viz., railway wagons, trucks or ships provide business opportunity to railways, truck and cargo operators. Public/Private partnership would help in attracting huge investments. Railways could be the major beneficiary due to fast turn around time. The potential of coastal transportation of cement in bulk is under exploited.
There are only two rail bulk cement terminals (Kalamboli & Bangalore) and three port based bulk cement terminals (Mumbai, Surat and New Mangalore). Non-availability of land near railway goods sheds on long-term lease is a major limitation in setting up bulk cement terminals.
- Railways should provide land near railway goods sheds on long-term lease to cement companies for setting up cement bulk terminals.
- Govt. should permit setting up of port based bulk terminals for bulk transportation of cement.
- Cost of setting up of a bulk cement terminal of 1 Mn.T. capacity is around Rs. 80 crores. Since the payback period is long, a rebate in excise duty for a specified period should be given for cement despatched from cement plants to the bulk terminals.
Center for Clean Air Policy page 231
- The State Governments are authorized to grant environmental clearances to the stand alone grinding units. For the purposes of environmental clearances, port based/inland bulk handling terminals should be treated at par with the stand alone grinding units and State Governments should be authorised in this regard.
VI.E Conclusions
The cement industry is energy intensive and released high CO2 emissions per tonne of cement produced; the biggest challenge today for the Indian cement industry was sustainability. The best energy consumption achieved by the cement plants in India is comparable to the best in the world. This should not lead to complacency. We should focus on adopting the best practices in the world since we have the capacity and capability to do so.
Latest state-of-the-art dry process plants in the country had energy consumption levels comparable to the world standards. However, a large number of plants installed before nineties were operating at relatively high-energy consumption levels and there was a need for their modernization to bring their energy consumption levels on par with global standards. While mentioning the efforts made by the cement industry by installing 80 MW of wind energy facility in the coastal region, the need for integrating alternate and renewable energy into the system was emphasised.
CO2 emissions, depletion of natural resources, and generation of construction and demolition waste have brought the cement industry under increasing scrutiny of environmentally concerned stakeholders. The industry has realized that energy efficiency and resource conservation are essential elements of success in today’s competitive business environment. Emerging CO2 management regulations require innovation of new technology and business models, and consumers tend to favour those products and services, which are designed to protect the environment. Thus, the cement industry has already undertaken initiatives for sustainability, but the transformation of its production and business practices needs time for implementation. There is need for government organization; private parties and industry associations have to work together.
The Indian cement industry has employed state of the art technology and equipments. The energy consumption per unit of cement production is close to the world leaders. The industry has also been first to use fly ash blending on large scale. This has resulted in several CDM projects not getting approved due to the logic of common practices. There are several small plants, which are not efficient, but their cumulative output is quite low. By modernising its plants, the industry has lowered its energy needs and thus increased the energy efficiency in cement kilns.
There are four measures by which the cement industry may save direct CO2 emissions in the immediate future:
• Producing blended cement with higher ratio of additives
• Reduction of clinker/cement ratio (introduction of useful industrial by-products)
• Increase in the use of waste as alternative fuel
• Improvement of energy efficiency
Cement industry has made tremendous strides in technological upgrading and assimilation of latest technology. At present ninety three per cent of the total capacity in the industry is based on modern and environment-friendly dry process technology and only seven per cent of the capacity is based on old wet and semi-dry process technology. There is tremendous scope for waste heat recovery in
Center for Clean Air Policy page 232
cement plants and thereby reduction in emission level. One project for co-generation of power utilizing waste heat in an Indian cement plant is being implemented with Japanese assistance under Green Aid Plan. The induction of advanced technology has helped the industry immensely to conserve energy and fuel and to save materials substantially. India is also producing different varieties of cement like Ordinary Portland Cement (OPC), Portland Pozzolana Cement (PPC), Portland Blast Furnace Slag Cement (PBFS), Oil Well Cement, Rapid Hardening Portland Cement, Sulphate Resisting Portland Cement, White Cement etc. Productions of these varieties of cement conform to the BIS Specifications. It is worth mentioning that some cement plants have set up dedicated jetties for promoting bulk transportation and export.
There are still several possibilities of reducing the GHG emissions by using extra blending, use of alternate biomass/msw fuel and employing energy efficiency measures. The report has documented these opportunities and the barriers corresponding to each potential. Although most large size plants have there the GHG emissions per ton of cement comparable to the best in the world, there is room for further improvements. The industry should promote with these four principals: Replace, Reduce, Reuse and Recycle.
The industry needs to further concentrate on modernization and upgrading of technology, optimization of operations and increased application of automation and information technology. This will help to reduce the cost of production through saving of energy and enhancement of productivity and to create clean environment by reducing the emission levels. Government’s efforts on thrust areas like faster implementation of infrastructure and irrigation projects, pushing housing development programmes, promotion of concrete highways and other roads, particularly concrete roads in rural areas have resulted in enhanced level of consumption of cement and thereby helped them cement industry.
Center for Clean Air Policy page 233
VII. Cross Measure and Cross Sector Analysis
VII.A Cross Measure and Cross Sector Background
The policy options that have been proposed in the sector chapters have been arrived at by implicitly assuming that each sector operates as an independent entity. However, this is not the case in real life as from the economics perspective each sector interacts with other in nonlinear dynamic ways which can be hard to accurately establish. The policy options for a sector have bearings on other sectors which cannot be ignored; and analysing that relationship can be used to have a converging, complementary structure to the policies which would be aligned with the India’s developmental plans.
The Government of India plans to achieve a GDP (gross domestic product) growth rate of 10% in the Eleventh Five Year Plan and maintain an average growth of about 8% in the next 15 years (Planning Commission 2002). Given the plans for rapid economic growth, it is evident that the country’s requirements for energy and supporting infrastructure would increase rapidly as well. In view of the rising energy prices and other geo-political considerations regarding energy imports, it is important to identify and adopt policies and measures that enhance energy security and help reduce the final energy requirements of the economy. The simple fact that the major sectors are all interlinked under the lens of economy makes it imperative to analyse the nature of such cross interactions and hence an integrated assessment of all the technological options available to the economy is therefore crucial to examine possible energy pathways and their impacts in terms of costs, infrastructure requirements, and fuel-mix patterns over time.
VII.B Tracking the GHG Emissions Inventory
As a starting point it is worth analysing the cross relationship by tracking the contribution of each sector in the National GHG emissions inventory. To ascertain the priority order for the GHG emission reductions, it is important to analyse the past GHG emission by sources. The growth of a developing economy is highly dependent on the growth on its energy consumption. Because of the possibility of inter-fuel substitution in end-use applications, the optimal long-term energy supply requirements of a country necessitate examination of all energy resources available both indigenously and globally and consequently, the examination of emissions through all energy resources.
The parties to the United Nations Framework Convention on Climate Change Convention (UNFCCC) are required to report to the convention on a regular basis a comprehensive and comparable inventory of anthropogenic greenhouse gases and the steps taken to protect the climate. Towards the fulfilment of its obligations, India submitted its initial national communication to the UNFCCC in June 2004. An assessment of the current and projected trends of GHG emission from India indicates that though Indian emissions grew at the rate of 4 per cent per annum during 1990 and 2000 period and are projected to grow further to meet the national developmental needs, the absolute level of GHG emissions in 2020 will be below 5 per cent of global emissions and the per capita emissions will still be low compared to most of the developed countries as well as the global average. A further break-up of the emissions with the sources is illustrated in the figure below.
The total amount of GHGs emitted in India, was around 1228 million tonnes, which accounted for about 3 per cent of the total global emissions, and of which 63 per cent was emitted as CO2, 33 per cent as CH4, and the rest 4 per cent as N2O. The GHG emissions in the years 1990, 1994 and 2000 increased from 988 to 1228 to 1484 million tonnes respectively and the compounded annual growth rate of these emissions between 1990 and 2000 has been 4.2 per cent. Emissions from the industrial
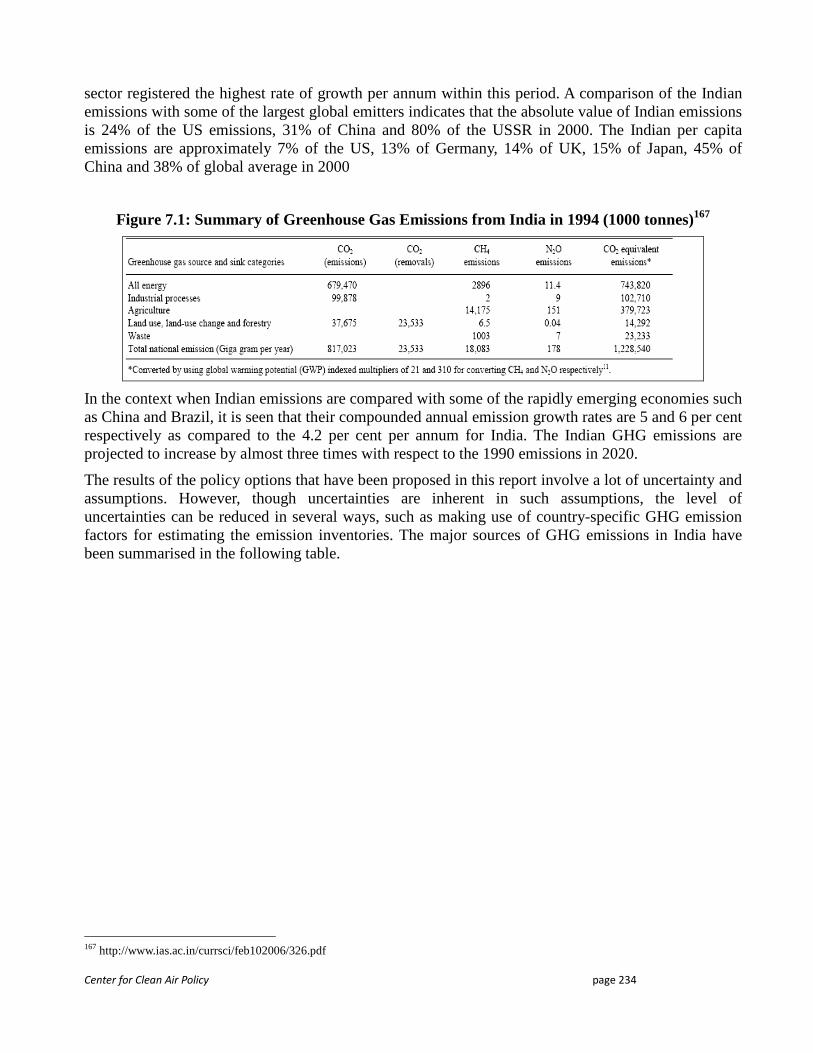
Center for Clean Air Policy page 234
sector registered the highest rate of growth per annum within this period. A comparison of the Indian emissions with some of the largest global emitters indicates that the absolute value of Indian emissions is 24% of the US emissions, 31% of China and 80% of the USSR in 2000. The Indian per capita emissions are approximately 7% of the US, 13% of Germany, 14% of UK, 15% of Japan, 45% of China and 38% of global average in 2000
Figure 7.1: Summary of Greenhouse Gas Emissions from India in 1994 (1000 tonnes)167
In the context when Indian emissions are compared with some of the rapidly emerging economies such as China and Brazil, it is seen that their compounded annual emission growth rates are 5 and 6 per cent respectively as compared to the 4.2 per cent per annum for India. The Indian GHG emissions are projected to increase by almost three times with respect to the 1990 emissions in 2020.
The results of the policy options that have been proposed in this report involve a lot of uncertainty and assumptions. However, though uncertainties are inherent in such assumptions, the level of uncertainties can be reduced in several ways, such as making use of country-specific GHG emission factors for estimating the emission inventories. The major sources of GHG emissions in India have been summarised in the following table.
167 http://www.ias.ac.in/currsci/feb102006/326.pdf
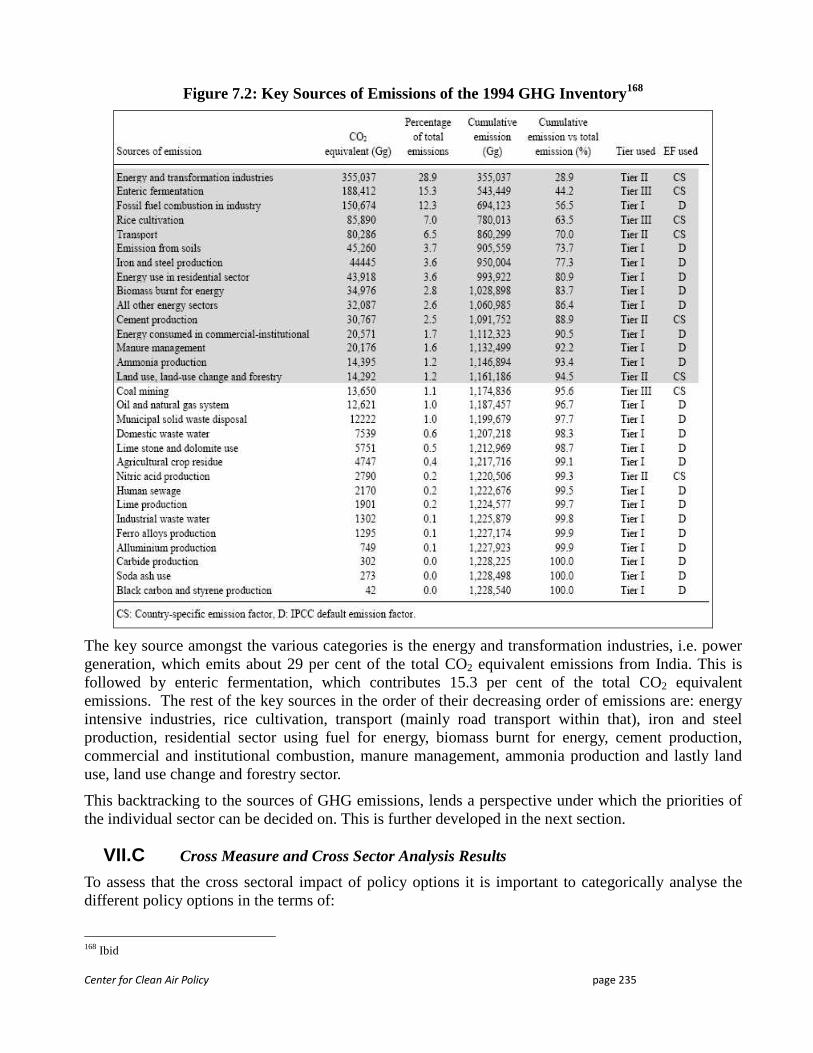
Center for Clean Air Policy page 235
Figure 7.2: Key Sources of Emissions of the 1994 GHG Inventory168
The key source amongst the various categories is the energy and transformation industries, i.e. power generation, which emits about 29 per cent of the total CO2 equivalent emissions from India. This is followed by enteric fermentation, which contributes 15.3 per cent of the total CO2 equivalent emissions. The rest of the key sources in the order of their decreasing order of emissions are: energy intensive industries, rice cultivation, transport (mainly road transport within that), iron and steel production, residential sector using fuel for energy, biomass burnt for energy, cement production, commercial and institutional combustion, manure management, ammonia production and lastly land use, land use change and forestry sector.
This backtracking to the sources of GHG emissions, lends a perspective under which the priorities of the individual sector can be decided on. This is further developed in the next section.
VII.C Cross Measure and Cross Sector Analysis Results
To assess that the cross sectoral impact of policy options it is important to categorically analyse the different policy options in the terms of:
168 Ibid
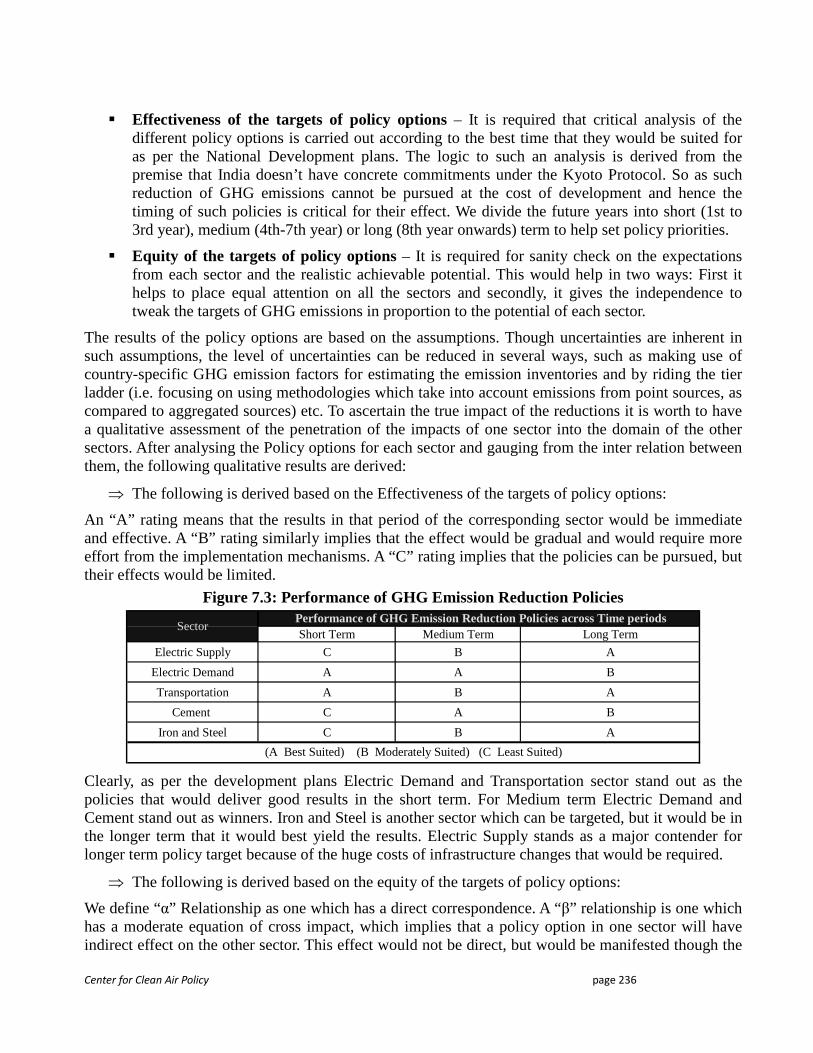
Center for Clean Air Policy page 236
� Effectiveness of the targets of policy options – It is required that critical analysis of the different policy options is carried out according to the best time that they would be suited for as per the National Development plans. The logic to such an analysis is derived from the premise that India doesn’t have concrete commitments under the Kyoto Protocol. So as such reduction of GHG emissions cannot be pursued at the cost of development and hence the timing of such policies is critical for their effect. We divide the future years into short (1st to 3rd year), medium (4th-7th year) or long (8th year onwards) term to help set policy priorities.
� Equity of the targets of policy options – It is required for sanity check on the expectations from each sector and the realistic achievable potential. This would help in two ways: First it helps to place equal attention on all the sectors and secondly, it gives the independence to tweak the targets of GHG emissions in proportion to the potential of each sector.
The results of the policy options are based on the assumptions. Though uncertainties are inherent in such assumptions, the level of uncertainties can be reduced in several ways, such as making use of country-specific GHG emission factors for estimating the emission inventories and by riding the tier ladder (i.e. focusing on using methodologies which take into account emissions from point sources, as compared to aggregated sources) etc. To ascertain the true impact of the reductions it is worth to have a qualitative assessment of the penetration of the impacts of one sector into the domain of the other sectors. After analysing the Policy options for each sector and gauging from the inter relation between them, the following qualitative results are derived:
⇒ The following is derived based on the Effectiveness of the targets of policy options:
An “A” rating means that the results in that period of the corresponding sector would be immediate and effective. A “B” rating similarly implies that the effect would be gradual and would require more effort from the implementation mechanisms. A “C” rating implies that the policies can be pursued, but their effects would be limited.
Figure 7.3: Performance of GHG Emission Reduction Policies
Short Term Medium Term Long Term
Electric Supply C B A
Electric Demand A A B
Transportation A B A
Cement C A B
Iron and Steel C B A
Performance of GHG Emission Reduction Policies across Time periods
(A Best Suited) (B Moderately Suited) (C Least Suited)
Sector
Clearly, as per the development plans Electric Demand and Transportation sector stand out as the policies that would deliver good results in the short term. For Medium term Electric Demand and Cement stand out as winners. Iron and Steel is another sector which can be targeted, but it would be in the longer term that it would best yield the results. Electric Supply stands as a major contender for longer term policy target because of the huge costs of infrastructure changes that would be required.
⇒ The following is derived based on the equity of the targets of policy options:
We define “α” Relationship as one which has a direct correspondence. A “β” relationship is one which has a moderate equation of cross impact, which implies that a policy option in one sector will have indirect effect on the other sector. This effect would not be direct, but would be manifested though the
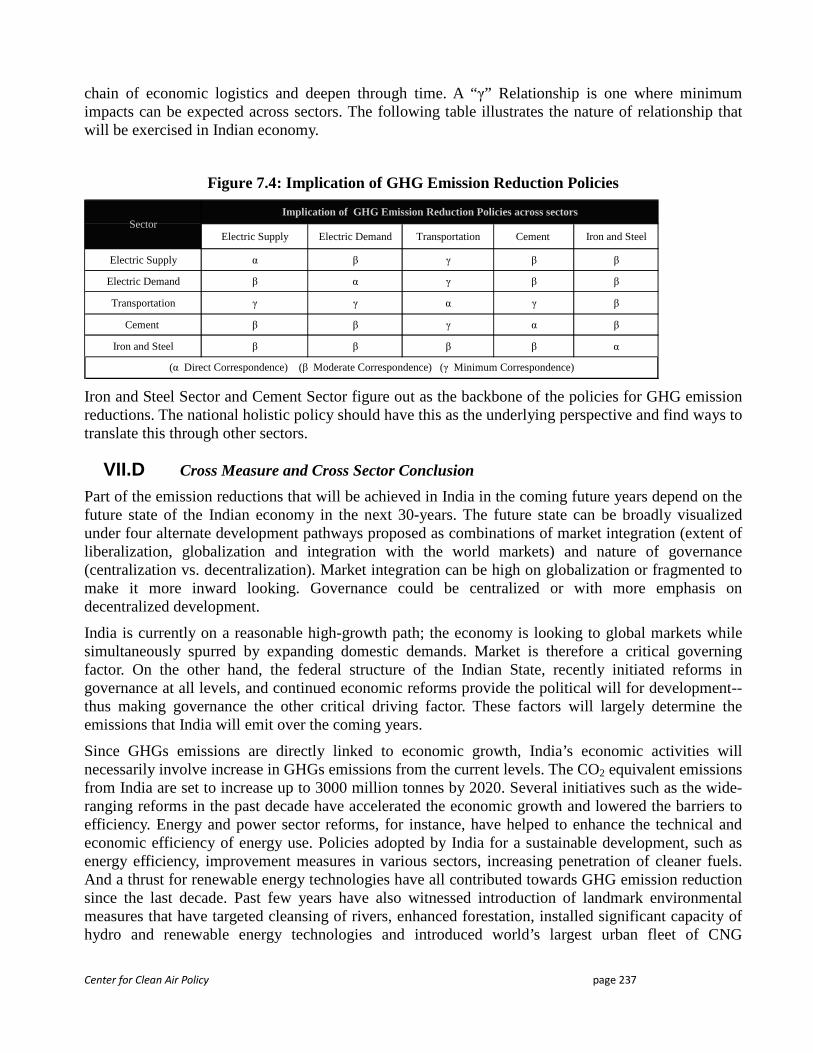
Center for Clean Air Policy page 237
chain of economic logistics and deepen through time. A “γ” Relationship is one where minimum impacts can be expected across sectors. The following table illustrates the nature of relationship that will be exercised in Indian economy.
Figure 7.4: Implication of GHG Emission Reduction Policies
Electric Supply Electric Demand Transportation Cement Iron and Steel
Electric Supply α β γ β β
Electric Demand β α γ β β
Transportation γ γ α γ β
Cement β β γ α β
Iron and Steel β β β β α
SectorImplication of GHG Emission Reduction Policies across sectors
(α Direct Correspondence) (β Moderate Correspondence) (γ Minimum Correspondence)
Iron and Steel Sector and Cement Sector figure out as the backbone of the policies for GHG emission reductions. The national holistic policy should have this as the underlying perspective and find ways to translate this through other sectors.
VII.D Cross Measure and Cross Sector Conclusion
Part of the emission reductions that will be achieved in India in the coming future years depend on the future state of the Indian economy in the next 30-years. The future state can be broadly visualized under four alternate development pathways proposed as combinations of market integration (extent of liberalization, globalization and integration with the world markets) and nature of governance (centralization vs. decentralization). Market integration can be high on globalization or fragmented to make it more inward looking. Governance could be centralized or with more emphasis on decentralized development.
India is currently on a reasonable high-growth path; the economy is looking to global markets while simultaneously spurred by expanding domestic demands. Market is therefore a critical governing factor. On the other hand, the federal structure of the Indian State, recently initiated reforms in governance at all levels, and continued economic reforms provide the political will for development--thus making governance the other critical driving factor. These factors will largely determine the emissions that India will emit over the coming years.
Since GHGs emissions are directly linked to economic growth, India’s economic activities will necessarily involve increase in GHGs emissions from the current levels. The CO2 equivalent emissions from India are set to increase up to 3000 million tonnes by 2020. Several initiatives such as the wide-ranging reforms in the past decade have accelerated the economic growth and lowered the barriers to efficiency. Energy and power sector reforms, for instance, have helped to enhance the technical and economic efficiency of energy use. Policies adopted by India for a sustainable development, such as energy efficiency, improvement measures in various sectors, increasing penetration of cleaner fuels. And a thrust for renewable energy technologies have all contributed towards GHG emission reduction since the last decade. Past few years have also witnessed introduction of landmark environmental measures that have targeted cleansing of rivers, enhanced forestation, installed significant capacity of hydro and renewable energy technologies and introduced world’s largest urban fleet of CNG
Center for Clean Air Policy page 238
(compressed natural gas) vehicles in Delhi. The Indian government has simultaneously introduced clean coal technologies like coal washing and introduced the use of cleaner and lesser carbon intensive fuel, like introducing auto LPG and setting up of Motor Spirit-Ethanol blending projects in selected states. These and similar measures, affirmed by the democratic and legislative processes, have been implemented by committing additional resources as well as by realigning new investments. These pro-active actions, by consciously factoring in India’s commitment to UNFCCC, have realigned economic development to a more climate-friendly path. And with the proposed polices India stand a greater chance to establish its role in International Polices Arena.
Center for Clean Air Policy page 239
VIII. Implications for International Negotiations and Policies
VIII.A Introduction
Climate change is now commonly identified as one of the most urgent and critical global issues by a growing number of countries. This is certainly the case with India, where climate change has been identified as a key policy concern for a majority of operations and the Government is willing to take initiatives through a number of emission reduction programs. India, along with Brazil, Russia, and China will play a key role in shaping future international climate change agreements. The developed countries have repeatedly stated that meaningful participation of India, Brazil, Russia and China will be a prerequisite for a commitment to an international climate change agreement.
Greenhouse gas (GHG) emissions are largely a function of energy use, both at the supply side and demand side, which in turn is driven by population growth and economic development. India is experiencing rapid growth in energy consumption, population, and economic development. Given that international GHG policy is articulated in terms of emission reduction targets with respect to a base year, India will have the most to lose if they are constrained to national emission goals structurally similar to those that were negotiated by the industrial countries. However, given the emission trading provisions of the Kyoto Protocol – the Clean Development Mechanism (CDM) and Joint Implementation (JI) – India (and especially Russia) also stand to gain from payments from industrial countries for carbon credits, and thus there are strong incentives to participate in GHG mitigation.
The policy options that have been proposed in this report, share one common objective: the goal of realising the path of a low carbon economy growth for India, by reducing/limiting its GHG emissions. The instruments through which the mitigation options would be manifested would vary both in nature and in time but they are all designed with this broad common perspective. However, the issue of climate change that concerns this world, demands a global level participation from the countries and hence the dynamics of national policies will be affected by the international policies and vice versa, in ways far greater than for any other issue. Given the pivotal role of India and other emerging economies in shaping international policy and the market for carbon credits, it is important to understand and evaluate the framework under which these national level polices might be placed amidst international policies.
VIII.B Existing International Policy on Climate Change
Under the Kyoto Protocol, Annex I parties agreed to reduce overall emissions of six greenhouse gases (GHG) by an average of 5.2 per cent below 1990 levels between 2008 and 2012 (the first commitment period). Despite the 2012 period approaching close the architecture of the global climate regime for the post-2012 period is far from certain, with a number of possible policy frameworks under development and discussion. Negotiations on the future regime have taken on increased seriousness, a result of the Bali Action Plan agreed to at the 13th Conference of the Parties to the UNFCCC (COP 13) in Indonesia. For post-2012 climate regimes, domestic carbon goals of the countries will be used to inform the international negotiation process over the next future years and thus it makes strategic sense to analyse the alignment of the proposed policies for India, in the current International Policy Structure and the subsequent possibilities that arise out of such international negotiations.
Center for Clean Air Policy page 240
VIII.C Possible International Frameworks and Their Implications
Initiatives taken and policies framed in India (and other emerging economies) for GHG reductions will be one of the leading determinants for framing international policies for GHG reductions in future, particularly after 2020. No international policy for GHG reduction may provides the anticipated results without integrating or considering India’s policies of corresponding abatement option. The various international negotiations and the permutations and combinations of domestic interests of the various countries, invariably give rise to the possible policy scenarios that might happen in the near future. These possible international policy scenarios are not necessarily exclusive of each other; they might have areas which are overlapping and yet each might include different elements that could be a part of the new climate framework. Various combinations of such elements that characterize the future scenario can be considered possible paths forward. These scenarios are representations of possible policy architectures that could be discussed in international negotiations; and they represent plausible alternative futures. However it should be noted that they are neither forecasts nor predictions and obviously, they are also not intended to be definitive pictures of the future. Such an analysis nevertheless, aims to help position India, under the basis of the proposed policies for a post-2012 regime. While the characterization of the policy scenarios is inevitably speculative, they do provide a framework for examining questions about the future, and can be to formulate plans in an uncertain world. Through this one can scope out potential economic, environmental and social impacts of different scenarios, with a specific focus on Policy options. The scenarios are as shown in the following five framework sections. In the following sections the various International Policy scenarios that might happen are briefly analysed and also how they will affect India’s domestic policy options and vice versa.
VIII.C.1 Framework I (Second Modified Phase of Kyoto)
Extended and Modified Phase of Kyoto: In this, a second phase of commitment gets in picture with the same basis as the existing targets & approach of the Kyoto Protocol while adding elements aimed at enlisting participation by the United States and major emerging economies. Efforts will be made to address the present shortcomings of Kyoto which have prevented a holistic participation from all countries.
Implications of Framework I: Under this scenario invariably India will have to link its domestic plans with the international trajectory. Till now, India has shown good leadership in CDM projects under Kyoto Protocol but moving forward when there will be certain modifications to the current scheme of things, it is not certain how the popularity of CDM projects in India be maintained. However, one thing can be said with certainty that financial incentives to the emerging economies (including India) would continue to be manifested through instruments which might or might not be similar to CDM. The debate of whether India is a developing country with its per capita emissions being really low will have to be sorted out amidst the fact that total emissions of India cannot be ignored. Whether India will have to do reduce its emissions unwillingly is not clear, but through the proposed policies (in this report) India will have its national commitment perspective in place; and as a consequence it will be in a better position to manoeuvre its terms through the International Policies.
Center for Clean Air Policy page 241
VIII.C.2 Framework II (Back to Square one)
Back to Square one: Under this scenario a new start is required with fresh assumptions and constraints. Essentially a bottom up approach is adopted where, countries, in cooperation with other nations wherever appropriate, will develop climate policies and plans that are suited to their national circumstances, and enter into various international cooperation efforts (e.g., energy efficiency, carbon emissions from energy use, adaptation, emissions trading systems).The essential difference is that it is more of a mutually benefiting approach with the common global perspective in the background. This would mean hassle free cooperation from different countries and the UNFCCC will still keep playing an active role, reviewing and reporting on countries’ actions and their effectiveness in meeting broader climate change targets.
Implications of Framework II: This international possibility is likely to give more incentives to the policy options that have been discussed. India can build a common set of goals which would be aligned through UNFCC and have international incentives to carry out those. This will result in huge programs and initiatives across the country and a balanced approach would be a prerequisite.
With this, the policies adopted in India for coal based generation to reduce GHG reduction would be one of the main factors to drive international policies, and also negotiations among regions in this direction. For example, as a long term policy measure adopted in India to move towards IGCC with CCS technology for coal and gas based power generation would set course of policy measures and other push in this direction, such as: This policy measure will provide significant push to early development of this technology on commercial scale in the international markets, though handling of captured carbon would be the main obstacle in the adoption of this policy.
High CapEx burden, as a result of this policy measure would require country specific international policies to distribute the impact of cost to allow significant adoption of this policy worldwide. Cost reduction measures such as; subsidies from multilateral agencies to emerging economies, zero tax on entire chain of equipment procurement, construction and commissioning of plant would be required. Post implementation benefits would be required as international policies for developing world to reduce the high operating cost of this measure, such as a minimum floor price for reduced carbon emission per ton, minimum committed volume procurement each year, etc. Developed countries, as a policy measure will commit an assured minimum allocation each year towards the low cost development of this technology. This can be quite expensive and may be unachievable.
VIII.C.3 Framework III (An ‘Equity’ Approach)
An ‘Equity’ Approach: Developed countries act first to undertake emission reductions, but all nations agree to bring per capita emissions to a level that is equal for all countries, based on a negotiated “safe” global target in a given period. It is left to the individual countries as to how they would speed up to achieve their share of goal within that period. The negotiations for that period would however, be tricky.
Implications of Framework III : This scenario gives India the flexibility to critically assess its development needs vis-à-vis the need for the low carbon growth. However, with these proposed policies, India can surely impress the role it will play by going over the specified commitment- of course, not without getting direct financial incentives and mechanisms for technology transfer. The domestic policy options of India will place it in a stronger position and a possible influential say in the international policies. As such this would involve significant commitments from UNFCC in terms of fund and unfortunately the incentives from carbon market mechanisms may partly become redundant.
Center for Clean Air Policy page 242
However, it is not a favourable situation that India would want to be in, as this would make the implementation of the policy options more or less mandatory as opposed to the flexible voluntary implementation.
VIII.C.4 Framework IV (Imposing a Uniform Tax on GHG Emissions)
Imposing a Uniform Tax on GHG Emissions: Under this scenario a tax on GHG emissions would drive emission reductions in an effort to meet an agreed-to long-term target. There would be an international mechanism for negotiating a tax level and adjusting the carbon price to meet set GHG emission reduction targets. The GHG tax would be collected at the national level, and a portion of the tax paid by developed countries would be used for adaptation in emerging economies.
Implications of Framework IV: This scenario might not be well suited for the GHG emission reduction scheme would best be suited for Transportation sector, where tax on gasoline can be implemented. Other than that, carbon tax can also be put on coal plants. However, since that will increase the price of electricity at the generation side, it might be debatable. In any case, it is not believed to be coming for the next ten twelve years at least. From India’s perspective this option would not be ideal as it will take its toll on the development plans.
VIII.C.5 Framework V (No Formal Multilateral Agreement Reached)
No Formal Multilateral Agreement Reached: This is the most pessimistic scenario and it is hardly possible that it will happen. Under this scenario, the international efforts to address climate change stall and national governments deal with the challenges of climate change in a relatively uncoordinated manner. International assistance, in such a scenario will become non existent.
Implications of Framework V: Since this would leave on a nation to evolve out the emission reduction plans, the policy options on the domestic front would have to be analysed on the basis of the cost of undertaking emission reductions which will depend mainly on three factors:
• the size of the emission reduction required relative to reference scenario;
• the ease of substitutability between fuels; and
• the importance of fossil fuels in the Indian economy.
As such it’s likely that the high cost involving GHG emission reduction schemes would take a backseat, like the option of switching the vehicles or bringing IGCC option; whereas the low cost initiatives on the energy demand side would be more seriously pursued. Later on, when significant concrete picture would evolve in International Policies Arena, India can change the priorities.
VIII.D Implications for International Negotiations Conclusion
It is abundantly clear that these policies key driving factors for India’s stand on the International Policies Arena and iteratively, the international polices would drive a change in domestic policy options as well. Although India appears to be taking a defensive position in relation to climate change in the international arena; there have been a large number of measures that have been initiated since 1990 within India and these measures collectively are likely to lead to a decoupling of greenhouse gas emissions from energy development and possibly even economic growth. Nevertheless, the government is likely to adopt a cautious position in international negotiations in order to avoid taking on legally binding quantitative commitments and because of their position that the onus lies on the developed countries to take action.
Center for Clean Air Policy page 243
IX. Conclusions
This report presents the results of Phase II: Policy and Implementation Strategy Analysis for India, as a part of an ongoing Centre for Clean Air Policy (CCAP) project in four emerging economies to aid post 2012 climate negotiations. For the purpose of this report, electricity supply, electricity demand, transport, cement and iron and steel sectors in India were analyzed. Greenhouse gas (GHG) mitigation measures for each selected sector were identified, and possible savings, costs, barriers, technology penetration, co-benefits and other parameters were evaluated for each mitigation option. Each sector included in the report presents unique challenges and barriers to the adoption of lesser carbon intensive technologies. In order to surpass these barriers, a suite of potential policy options have been formulated for each sector. For each of these suggested policy options, detailed implementation pathways, key stakeholders, potential barriers and way to overcome these barriers have been provided. The findings presented in this report could be of immense use to policymakers while formulating strategies to help India become a lower carbon intensive economy.
Integrated gasification combined cycle (IGCC) based on domestic coal with carbon capture and sequestration (CCS) has been evaluated as a mitigation option in the Indian electricity supply sector. Since IGCC and CCS technologies are separate with a unique set of challenges facing both, the barriers and policies for the technologies have been provided separately. IGCC with CCS faces many challenges including low technological maturity, high initial capital costs, and lack of an international monitoring and verification framework. Government grant support for demonstration projects, public private partnerships for commercial IGCC projects, central body to facilitate R&D, preferential tariffs, allowing IGCC power to be used to fulfill state obligation to purchase renewable power, national level CCS task force, tax incentives for demonstration and commercial projects, identifying geological storage potential in India, and company level R&D programs have been suggested as policy options for advancing the technology.
Energy efficiency coupled with other demand side management options can reduce the end-user demand and hence reduce the electricity demand-supply gap in India. The mitigation measures explored in the electricity demand sector include energy demand savings from products and equipment, and energy efficiency in the Indian buildings sector. Implementation of energy efficiency measures in these sectors faces constraints like low awareness, high costs of energy efficient equipment, investment, financing and resource constraints, and inadequate benchmarking in buildings. Formulating and implementing minimum efficiency standards for notified equipment, appliances and buildings, increasing consumer awareness, tax/ duty exemptions for energy efficient Products and Equipment based on levels of efficiency, establishing building codes, building Labelling, tax incentives, and dividing India into multiple time zones to reduce energy consumption in buildings – are some of the policies that can help bring about a market transformation in the favour of energy efficiency in these sectors .
Immense potential for emission reductions exist in the Indian transportation sector. Increased use of biofuels and electric vehicles has been suggested as two major mitigation options for the transportation sector in India. The use of these options faces technological, infrastructural, and investment barriers like the dependence on availability of cyclical feedstock, inadequate number of feeding stations, low public awareness of the features of electric cars, and high costs. Policy measures to overcome these barriers include recommendations to strengthen the national biofuels policy, quality control for fuel
Center for Clean Air Policy page 244
blending, developing financing mechanism for plantation and extraction, phasing out of subsidy on gasoline and diesel, international cooperation for technology and financial aid. For electric vehicles, the policy measures include R&D, empowered battery handling rules, charging station support and government procurement of electric vehicles.
For the highly energy intensive cement sector, production of blended cement with high ratio of additives/cement, switch to less carbon intensive fuels in kiln, waste heat utilization for power generation, energy efficiency improvement measures and energy management practices in cement plants are some mitigation options that have been considered for the purposes of this report. The adoption of these mitigation measures faces technical, investment and market acceptability constraints. The policies suggested for implementation are financial incentives (taxes, rebates, subsidies), company level R&D, awareness programs, pilot project under public private partnership, Incentives for cogeneration plants, developing quality standards for manufacture using waste products, human resource development and training, utilization of cement cess and the harnessing of carbon market opportunities.
The Iron and steel sector in India can become less carbon intensive by adopting modern technologies and processes. Technical challenges, incompatibility with Indian coal, availability of technology, and lack of sufficient R&D are the main barriers faced to adoption of modern technologies. Suggested policy options include strengthening National steel policy, strategic training, R&D to facilitate pending technical issues, direct government subsidies and grants from national/international funds.
Suggested policies also face certain barriers to their implementation. Some of the common cross – sectoral constraints are infrastructural, or that the sector environment is not ready to immediately embrace new and costlier technologies. Stakeholder consultation and awareness campaigns can help facilitate the policy implementation. The Indian government released the ‘National Action Plan on Climate change’ in 2008, with eight national missions including mission on energy efficiency and sustainable habitat. Aligning the policies suggested in this report as a part of the various missions in the National action plan may also be a route for quick and effective implementation.
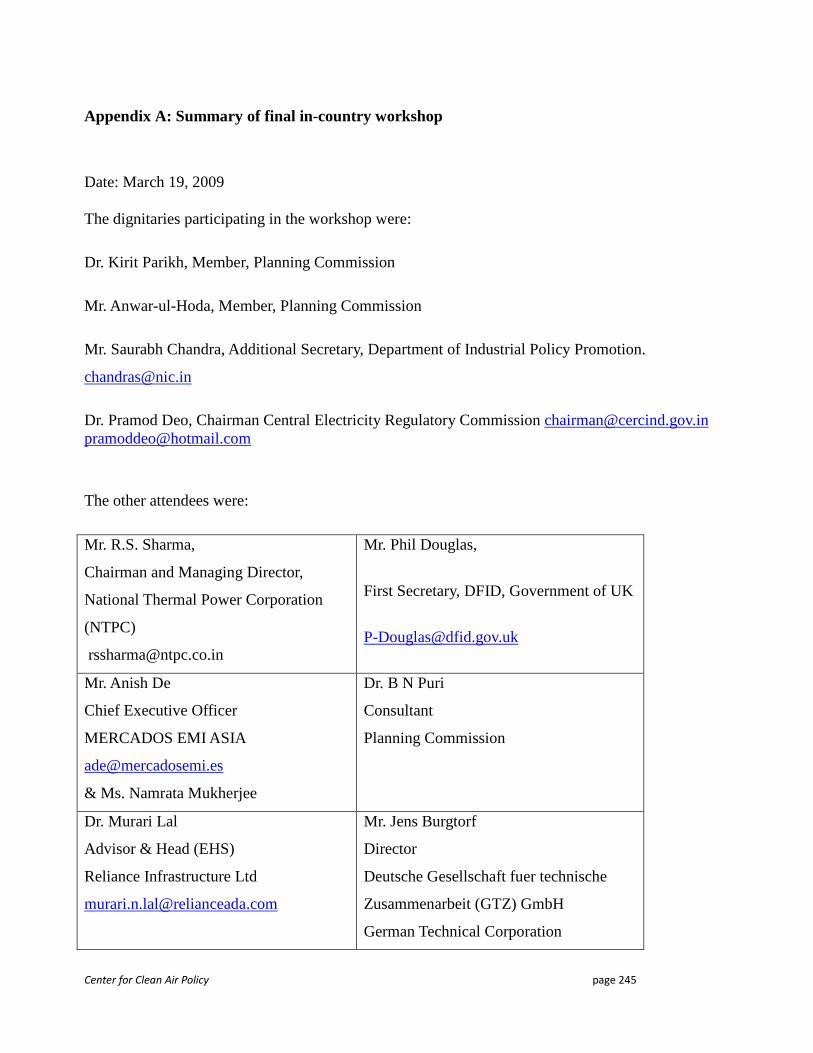
Center for Clean Air Policy page 245
Appendix A: Summary of final in-country workshop
Date: March 19, 2009 The dignitaries participating in the workshop were:
Dr. Kirit Parikh, Member, Planning Commission
Mr. Anwar-ul-Hoda, Member, Planning Commission
Mr. Saurabh Chandra, Additional Secretary, Department of Industrial Policy Promotion.
Dr. Pramod Deo, Chairman Central Electricity Regulatory Commission [email protected] [email protected]
The other attendees were:
Mr. R.S. Sharma,
Chairman and Managing Director,
National Thermal Power Corporation
(NTPC)
Mr. Phil Douglas,
First Secretary, DFID, Government of UK
Mr. Anish De
Chief Executive Officer
MERCADOS EMI ASIA
& Ms. Namrata Mukherjee
Dr. B N Puri
Consultant
Planning Commission
Dr. Murari Lal
Advisor & Head (EHS)
Reliance Infrastructure Ltd
Mr. Jens Burgtorf
Director
Deutsche Gesellschaft fuer technische
Zusammenarbeit (GTZ) GmbH
German Technical Corporation
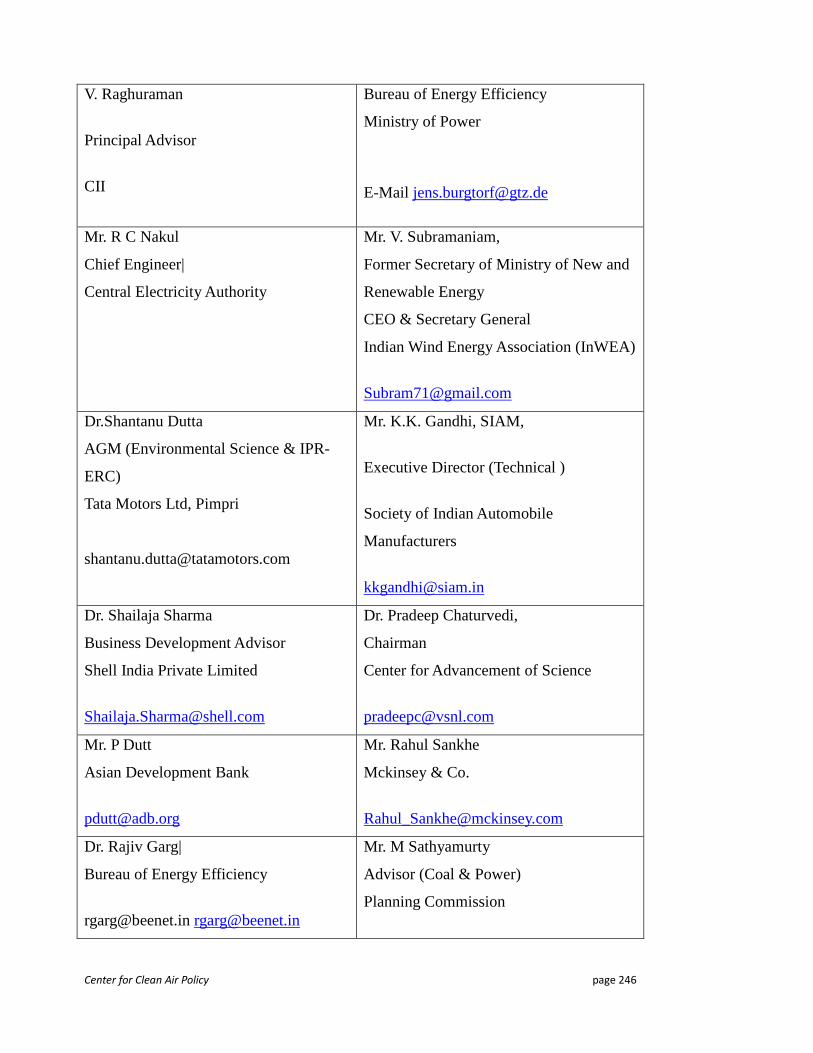
Center for Clean Air Policy page 246
V. Raghuraman
Principal Advisor
CII
Bureau of Energy Efficiency
Ministry of Power
E-Mail [email protected]
Mr. R C Nakul
Chief Engineer|
Central Electricity Authority
Mr. V. Subramaniam,
Former Secretary of Ministry of New and
Renewable Energy
CEO & Secretary General
Indian Wind Energy Association (InWEA)
Dr.Shantanu Dutta
AGM (Environmental Science & IPR-
ERC)
Tata Motors Ltd, Pimpri
Mr. K.K. Gandhi, SIAM,
Executive Director (Technical )
Society of Indian Automobile
Manufacturers
Dr. Shailaja Sharma
Business Development Advisor
Shell India Private Limited
Dr. Pradeep Chaturvedi,
Chairman
Center for Advancement of Science
Mr. P Dutt
Asian Development Bank
Mr. Rahul Sankhe
Mckinsey & Co.
Dr. Rajiv Garg|
Bureau of Energy Efficiency
[email protected] [email protected]
Mr. M Sathyamurty
Advisor (Coal & Power)
Planning Commission
Center for Clean Air Policy page 247
The participation of delegates from various organizations was as follows:
IL&FS Ecosmart – representatives
Dr. H V Allcott: [email protected]
Green Power International
ESG Environmental Services India
Urjavaran Foundation, Ms. Varsha Chande
Session 1: Opening Session Dr Jyoti Parikh, Executive Director IRADe: Welcome note – Dr Parikh, Executive Director, IRADe welcomed all the speakers cordially and briefed participants about the key themes that were to be discussed during the workshop. The discussions were to be centered on policy options for Low Carbon Technologies in India in the following sectors: Electricity demand, Electricity Supply, Transportation and Bio-fuels, Industries (cement and steel). Dr Parikh thanked CCAP and project partners, ICF International. She also commented on how the assessment of low carbon technology was acquiring a new dimension covering all industrial sectors with a new meaning. Mr. Matthew Ogonowski, Senior Policy Analyst, CCAP: Purpose of the project – Mr. Ogonowski gave a brief introduction on the Center for Clean Air Policy (CCAP), a climate change and air quality policy think tank headquartered in Washington DC with several other global offices. He described their work, which includes efforts in: (1) all major climate change-related activities, including mitigation and adaptation in both developed and emerging economies (2) policy development, financial analysis and capacity building support for actions by the latter group of countries, (3) development and elaboration of the EU carbon trading scheme, (4) evaluating and enabling sector-wide mitigation of GHG mitigation options in energy-intensive industries in China, Mexico, Brazil Indonesia and India, and (5) development of policy proposals to assist countries and international climate negotiators with reducing emissions from deforestation and forest degradation (REDD). Commenting on the scope of low-carbon technologies in India and other countries, he cited the example of Carbon Capture and Storage (CCS). He stated that CCS is a higher cost technology, one whose implementation will require financial and other assistance from developed countries and international agencies. He emphasized that one of the aims of the current project was to assist India in developing strategies for policy implementation and identifying its technology and capacity building needs, and that effective climate change policy will require a broad cooperative partnership between developed and emerging economies. Under this framework, once technology and financing needs are identified, these can then be taken to the UNFCCC for broader international consideration.
Center for Clean Air Policy page 248
Presenter: R.S. Sharma, Chairman and Managing Director, National Thermal Power Corporation (NTPC) – Mr. Sharma presented on Low Carbon Implementation and Policy Issues for the Power Sector. The main points of his presentation discussed the challenges and opportunities in implementation of different low carbon technologies. The critical issues, according to Sharma, were the increasing use of carbon intensive technologies and the challenges in increasing the energy efficiency of these technologies. Hence, both the developed and emerging economies should work together to overcome these challenges. He hopes that the UN conference on climate change in Copenhagen (2009) will bring solution to some of these challenges and set the speed for the low carbon technologies. Mr. Sharma stated that Climate Change negotiations were going through many challenges, and NTPC feels that a greater thrust must be placed on Energy Efficiency improvement. Coal is and will continue to be the mainstay in Indian power generation, and 1,400 GW of coal based capacity is to be added globally to meet energy needs. There is need for efficiency improvement, and efficiency will improve with advanced coal technologies, such as supercritical power-generation technology. For the application of Integrated Gasification Combined Cycle (IGCC) to Indian conditions where local coal has high ash, several challenges still and significant research and development (R&D) still needs to be done to optimize the gasifier technology. For IGCC, the key technical issues involve high auxiliary power consumption, gas cleanup and gasifier technology. The amount of investment needed to commercialize this technology in India remains a constraint. Mr. Sharma suggested that it would be difficult for NTPC to keep funding this expenditure internally and government support is needed. NTPC is trying to partner with international agencies in the development of IGCC in India. NTPC, which has the largest share of Indian electricity generation, has been working towards making the shift to the low carbon economy through efforts for higher efficiency coal power plants and better resource management. Existing efficiency of most of the NTPC plants is around 30% with CO2 emissions of approximately 1,100 gm/unit. Now with increased efficiency the emission has come down to 800 gm of CO2/unit of electricity generated. Key improvements in driving the improved emissions rate are better achievement of heat rate and construction of high capacity power plants with higher efficiency. NTPC has 11 power plants in the pipeline under the Ultra Mega Power Plant scheme (2 in advanced and 9 in early stage of construction). NTPC’s current generation portfolio includes 82% share of coal. The company will be seeking to diversify its portfolio to include more renewable and other fuels, e.g., hydro, nuclear and gas. NTPC believes that Carbon Capture and Storage is a very costly technology. The per MW cost of a CCS compliant power station will be almost double that of a power plant under normal operating conditions. Since the net efficiency will be lower, this will also increase coal costs. Investment costs are the main barrier, but associated environmental risks also represent a challenge. More thrust should be placed on CO2 utilization like enhanced oil recovery. NTPC proposes a technology centre for CCS. NTPC is working on a few undisclosed projects regarding utilization and is expected to publicly disclose them in the next few months. Renovation and Modernization (R&M) in Indian power plants has to be increased and there must be stronger incentives to undertake R&M activities. NTPC is undertaking R&D activities for 100-200 MW power plants using IGCC technology.
Center for Clean Air Policy page 249
In summary, the barriers in transitioning to a low carbon technology include high investment cost, absence of reliable and mature technology and an absence of favorable regulatory framework. NTPC suggests the following incentives to overcome these barriers: improved tariff calculation methodology, support for adequate natural gas supply at affordable price, easy and affordable access to low carbon technology, facilitating land acquisition in case of wind power plants and afforestation. NTPC also believes that there must be greater cooperation between developing and developed countries and that the Copenhagen COP/MOP might turn out to be an important milestone in laying the future foundations for this partnership. Chair: Dr. Kirit Parikh, Member, National Planning Commission, India said that irrespective of who pays for it, the transition to a low carbon economy is inevitable for India. He also emphasized the importance of creating incentives and commercializing the initiatives which have been taken up by independent power producers. He further stated that it is equally crucial to incorporate and internalize views of a broad range of stakeholders. Mr. Parikh indicated that programs like energy efficiency labeling, are a good start for India and implementation of these labeling programs across different sectors could be developed. He indicated that there is a need to understand the views of different stakeholders and get a full understanding of policy options to arrive at the strongest international climate change negotiations. According to Mr. Parikh, the epicenter of the success to low carbon economy lies with the policies which incentivizes consumers, industry sector and government action alike. Session 2: Power and Electricity Demand Following ICF’s presentations on Electricity Demand and Electricity Supply by Amit Khare, Vipul Mathur and Ritika Goel summarizing the key findings and recommendations contained in the previous chapters of this report, other panelists presented on power supply and different aspects of energy demand. Presenter: Mr. N. Murari Lal, Advisor and (Head Environment, Health and Safety), Reliance Energy Limited (REL) - Mr. Lal provided an account of all the major REL power plant projects along with the associated emissions form these plants. He described the different actions and initiatives taken at REL to address the environmental issues related to the power generation. The presentation compared the status of Indian power generation with other countries. He said that Reliance has plans for capacity expansion and has a vision to emerge as major player like NTPC presently in Indian Power Generation market. Without significant changes in policy the power sector in India is expected to produce 775 million metric tons of CO2 emissions per year by the year 2015 (as compared with 1,000 million metric tons per year now produced by power generation in the entire European Union). Mr. Lal described CCS as a new and controversial technology. Auxiliary power consumption, in his view, was a big issue and CCS plants needed 10-40% more energy than those without CCS. The adoption of advanced technology such as carbon capture and sequestration has to be made economically attractive. The dynamic factors that influence technology adoption and diffusion include the commercial availability of the technology, regulatory policy and framework, business cycles, industry structure, and corporate strategy. The regulatory and legal frameworks that may affect adoption include underground injection regulation, relevant international and national laws, treaties

Center for Clean Air Policy page 250
and guidelines, property rights, and liability concerns. CCS needs a regulatory and legal framework, and there has to be agreements that address property rights and liability concerns. Reliance Power/ Reliance Infrastructure Ltd. understand that CCS technology is still in R&D mode and commercial viability of the technology is yet to be ascertained. The introduction of technologies for capturing and storing CO2 also has to be critically evaluated for risks and the hazards it might pose. In closing, Mr. Lal spoke about the collaboration of REL with DEFRA on technical design of its Ultra Mega Power Plant to make it a CCS ready power plant sot that REL could retrofit the plant for CO2 capture when the technology becomes available and costs are lower. Mr. Jans Burgtorf, GTZ outlined the energy efficiency initiatives currently being undertaken by Bureau of Energy Efficiency (BEE). He described the energy efficiency improvements in power plants being supported by GTZ. This program is being implemented jointly with Central Electricity Authority. He further told that analyses of energy efficiency measures are underway for several pilot power projects. 85 Indian power plants are considered for pilot project. Initial results of the study have shown that efficiency has increased by 5%. The plan is to extend the study to 50 additional plants to explore potential the energy efficiency measures. He stated that about the 6 power plants had been piloted for CCS technology in Germany and indicated the opportunity for transfer of technology/knowledge from these pilot plants to India. He encouraged the alternative suggestion that if CCS technology cannot be pursued fully at this point of time, then at the minimum the existing plants can be made ready for CCS. Mr. V. Subramaniam, Former Secretary of Ministry of New and Renewable Energy and Secretary General of Indian Wind Energy Association (InWEA) served as the chair and remarked that there was an ongoing debate between reducing carbon emissions and avoided carbon emissions. The discussions in the previous session dealt with carbon emissions reduction and not really on carbon avoidance by generating electricity from renewable resources. With regard to energy demand, he said that in India the tax incentives for energy efficient buildings are directly associated with waiver of property taxes and there is no other form of tax for buildings at the moment. Property taxes, he explained, are at the discretion of Municipal bodies and hence unless a comprehensive Tax policy (for different states) is evolved, there might be a conflict of interest between states and the Central government in the terms of the tax structure. He also added that the effectiveness of a Time Zones Policy for India has been met with skepticism over the past, and the general opinion about it is expected to remain unchanged for the coming years. He suggested that a Time Zone policy could be a potential medium/long term option as opposed to a short term option. On low carbon power generation, he described the higher auxiliary energy consumption associated with CCS technology and the prospective energy demand and potential challenges of CCS to meet this demand. IGCC, according to him, was a slow moving technology and after being under R&D for almost 3 decades, there are very few plants that have come up. Moreover, the efficiency of the existing IGCC plants varies significantly. So, instead he suggested focusing on nuclear or hybrid of nuclear and gas powered generation. According to him, the latter option could have efficiency of more than 60%, which is much higher than other options discussed in this session. One participant asked participants to consider what it was that India needed further from other
Center for Clean Air Policy page 251
countries to move ahead in the low carbon power generation path. He further suggested if it would be useful to start listing details on possible financing options, requirements on reimbursing upfront cost or any other specific capacity building needs that India needed to move to the low-economy pathway. Another participant raised several questions and concerns: how many years will it take to commercialize CCS; what is the time frame that we are looking at in terms of low carbon power generation; how would the old plants be rewarded for efficiency improvements; aggressive development of LEED accredited buildings in India and that it would be an underestimate to ignore these efforts in the policy analysis; it is important to know the implications (both positive and negative) of the incentives that are being recommended in the reports and that there should be case studies which address the issues related to intellectual property right (IPR) attached to the technology. One of the biggest barriers to the smooth transition and transfer of technology is the IPR attached to the technology or know-how. IPR is a very important and integral part of any technology, more so in the technology transfer issues. He also suggested that Tax incentive policies which work smoothly for developed countries might not always have the desired effects in India. This is because the market dynamics in India are entirely different. He also maintained the view that voluntary programs in building labeling and codes are a good start and that providing incentives at this stage would be underestimating the success that it has already had without external support. He thus stressed that a very cautious approach would be required to bring the transition from a voluntary to a mandatory implementation, without running into the risk of losing the momentum offered by the voluntary implementation. One comment from the floor highlighted the distribution efficiency of energy supply. It was argued that the potential for improving efficiency in the distribution side was immense and the subsequent effects of improvements could be large and meaningful. The participant also noted that since CCS incurs significant energy penalty, it amounts to depleting coal resources much faster. The participant argued that since IGCC have high investment cost, there could be problems absorbing these technologies into the generation mix. Several participants echoed the need to ensure that a broader government procurement policy on energy efficiency technologies be developed and vigorously pursued in short and mid term. One participant recommended the establishment of an Indian R&D center dedicated to CCS studies for India. Several participants concurred with the suggestion and thought this could be feasible. The participant described the ongoing work on GHG abatement cost curves for India’s power sector and acknowledged the growing interest of financial institutions for understanding the full range of abatement options. Several participants suggested that both Carbon capture technologies and Energy Efficiency be pursued equally and as an integrated policy. Session 3: Transportation and Biofuels Following ICF’s presentation on Analysis of Transportation Sector by Shanti K. Ojha on key findings and recommendation of the report, other panelists including Mr. K.K. Gandhi Society of Indian Auto Manufacturers (SIAM), Dr. B.N. Puri (National Planning Commission, India), Shantanu Dutta (Assistant General Manager, Tata Motors); P. Dutt (ADB) and V. Raghuraman (Confederation of Indian Industries) presented their views and thoughts.
Center for Clean Air Policy page 252
Presenter: K.K. Gandhi, SIAM, presented the automobile industry’s perspective on the existing transportation related policies and issues related to climate change. He outlined the different software and hardware required to tackle the climate change issues associated with transportation sector such as infrastructure to make existing fleet of vehicles compatible with 10% ethanol blend, quality assurance of the ethanol blend, awareness among people, support for the research and development on battery operated vehicles and hydrogen fuel vehicles. He identified air pollution, climate change and energy diversification as three main challenges posed before automobile industry. He emphasized the importance of behavioral change in reinstating clean air amidst the growing number of automobiles in the urban India. He focused on three different low carbon fuels: biofuels, electric cars and hydrogen fuel. For each of these fuels, he briefed the workshop on the different pilot projects being undertaken at different levels and their outcome and what it holds for the India’s automobile industry. For instance, SIAM has run pilot project testing the viability of ethanol through two depots- in Karnataka and Utter Pradesh. SIAM also undertook a road test for biodiesel on high end vehicles such as Mercedes-Benz. On more ambitious and technically challenging hydrogen fuel cells, he informed that pilot projects are underway to demonstrate probable mix of hydrogen and CNG. He also mentioned that from April 2009, it would be mandatory practice for automobile manufacturers to display fuel economy against every model they manufacture. Presenter: Shantanu Dutta, Tata Motors presented on Tata’s initiatives to curb GHG emissions from their automobiles and the challenges and drivers behind these initiatives. Tata Motors have been active players in suggesting low carbon technologies and highlighting opportunities for India’s transportation sector. Tata Motors participates in several committees (such as Standing Committee on Emission, Expert Committee on Vehicular Pollution Control, and member of Carbon Disclosure Project) at national and sub-national levels focusing on low carbon transportation policies in India. In the presentation, Mr. Dutta described a three-pronged approach to attaining low carbon transportation in India: infrastructure, technology and public awareness. For each of these segments, Mr. Dutta explained the underlying activities that represent the opportunities for reducing GHG emissions. For example to achieve low carbon vehicle technology, engine technology, accessories technology, weight reduction, aerodynamic drag, air conditioning systems, life cycle assessment are the areas where auto manufacturers should focus on. Similarly on infrastructure front, road conditions, traffic system and regulation, travel demand, land use and transport planning, inspection and maintenance centres, retrofitting facilities are the areas which need improvement. Finally, on the public awareness front, inculcation of eco driving habits and general awareness of vehicular maintenance knowledge are the core towards reducing GHG emissions. According to Mr. Dutta, CNG and LPG are the first steppers into the low carbon transportation followed by biodiesel and ethanol, hybrid, hydrogen and CNG blend, hydrogen engine and finally electric and fuel cell vehicles. In other words, electric vehicles and fuel cells are the most sustainable low carbon transportation technologies. He went on to describe the challenges in employing these options and their role in attaining sustainable development. Cost, quality, time and regulations are the main challenges in low carbon vehicle technology. He felt that improvements in technologies should be supported by better traffic management, effective land use utilization, improvement in road conditions and increase in the fuel availability. He also outlined the need for performing carbon footprint of vehicles and promoting vehicle efficiency labeling as a voluntary initiative. One participant remarked that technology should not be the subject of panic. The transportation issues in India go beyond the state-of-the-art technology. He suggested that one of key issues in the Indian
Center for Clean Air Policy page 253
transportation sector is prevalent vehicle recycling practice. He was of the view that the new or proposed policies might face similar roadblocks as before and the ability to tackle the historical challenges prevalent in the sector might make the future easier. He also suggested prioritizing mitigation options and policy options in terms of cost effectiveness and effectiveness to provide more bang for the buck. Further he suggested focusing the analysis and mitigation / policy options on middle sized cities and not just the mega cities. He suggested that the implementation of GHG control measures and policy options might be much simpler and more effective in middle sized cities than the mega cities and at the current growth pattern of these urban hubs, these cities would develop into mega cities rapidly. Therefore, policy aimed at current middle sized cities could change the way these cities grow into mega cities. Another participant described the different key policies currently in place in the transport sector, and outlined strengths and weaknesses of these policies dedicated to transportation. The current policies underway are envisioned to bring down the energy intensity. With more parameters to be taken into consideration, planning new policies or amending the existing ones is becoming more complex. In India, the transportation intensity relative to other market economies is low. The policies now need to be directed at improving logistic cost, improving pricing mechanism and optimizing inter-modal mix. With the increase in vehicular density, the average lead concentration has also shot-up. Hence, it is not just GHG emissions but other fatal air pollutants that is causing additional problem in cities. In such a situation, the intermodal mix becomes crucial and should be optimized. There are several options, such as trolley buses which are good solutions to curbing pollution, but the resource cost of bringing in such services are typically too high. Hence, the policies should cater to the economic viability of urban transportation and explore the options of privatizing the public transportation sector. He further emphasized the need for more participation from private sector just as has been witnessed with power sector. Another participant highlighted few policy problems such as the prevalent fossil fuel adulteration, environmental problems and sustainability concerns of 1st generation biodiesel plantations. Kerosene is one of the most frequently used adulterator in the gasoline owing to the high price differential. Hence, the participant suggested that it was important to review kerosene pricing. He also suggested that the claimed benefits of biodiesel would not be met by the 1st generation biodiesel and hence Indian policies should promote 2nd /3rd generation biodiesel for positive outcome. Most of the urban centers have limited parking area. The participant suggested that it was important to have proper urban planning that has mapped the urban centers and consequently has differential pricing for parking areas in different parts of the city. He also added that introduction of electric vehicles was a viable option provided that light weighted batteries are easily available. The participant also recommended that it was essential to explore establishing addition driving schools across the nation to improve driving behavior. Finally, the participant noted that facilities for specialized mechanics to maintain the vehicles and the infrastructure plays an equally important role in reducing the GHG emissions as any direct mitigation and policy option. Chairman of the session, Anwar-ul-Hoda, Member, National Planning Commission, India outlined about the agenda of the government actions. He said unlike the private sector which is driven by profits, government sector does not take and envision action in terms of direct and financial profits. Since, government looks at the policies in a holistic approach. He mentioned that the Planning Commission has already been trying to address most, if not all of the issues that had been raised in the session. He agreed that the policies should target promotion of efficient urban transportation, improve
Center for Clean Air Policy page 254
logistics costs and gradually move to electric vehicles. In this context he took the Chinese example of promoting electric two-wheelers and said that India also needs to have the right mix of carrot-and-stick policies to promote electric vehicles and induce the general public to use electric vehicles. Session 4: Steel and Cement sector Presenter: Dr Rajiv Garg, Energy Economist, Bureau of Energy Efficiency (BEE), described the Mission/policies that the BEE has been mandated to pursue under the National Action Plan on Climate Change (NAPCC). Dr Garg discussed the Energy Conservation Act, which is the policy that enables industries to become sensitive to energy use, and therefore more profitable. The approach of the Indian government differs from the strategy of sectoral approach being advocated by some developed countries. India views that energy consumption of industrial units depends upon various factor (1) nature of raw material and the energy medium being used (2) vintage of the industry and their capacity (3) social relevance of the units. The effort of the BEE in the context of NAPCC starts by identifying designated consumers – industries that consume more than 30,000 Metric Ton Oil Equivalent per annum. The cement industry has 40 such designated consumers and the steel industry has 80 designated consumers in India. Once identified as a designated consumer (DC), the DC has to ensure certain norms
(i) Appoint energy Managers, (ii) All DCs have to report yearly to the bureau on energy performance, and
their problems, so that the bureau can understand their constraints, and propose policies to tackle problems of the sector unit wise,
(iii) A detailed energy audit must be carried out every three years for these designated consumers.
The BEE will monitor the specific energy consumption of these DCs and look into technological options that are presently being used by such industries and propose changes and shifts required. BEE will monitor the progress on their suggestion (whether they are being implementing or not, what are the problems etc.) Dr. Garg also briefed participants about a scheme under the NAPCC of the Ministry of Power, - the ‘Perform, Achieve, and Trade’ (PAT) scheme. Under this scheme all designated consumer industries based on their specific energy consumption, vintage, and other parameters will be provided energy consumption targets. They will be required to achieve this target over a 3 year period through 2012. Industries that perform well and exceed their targets are rewarded accordingly and certificates are issued to such industries. The industries which fail to meet the allocated energy consumption targets will have to buy the certificates. These certificates can be traded. The trading mechanism will be a market based approach. Discussing the steel industry in particular, Dr. Garg emphasized that even with the best technologies the existing energy use is still high. For example, he suggested, that global average crude steel production requires 15.88 GJ of energy per ton, while Korea’s consumption is 18-19 GJ/T and whereas for India it is between 24 to 28 GJ/T. Dr. Garg agreed that given the Indian scenario, it is tough to change and lower specific energy use as the coal quality is poor. The nation has to use the natural resources available to them. Dr. Garg expressed that some technologies have a large impact on energy
Center for Clean Air Policy page 255
efficiency, e.g. the dry quenching technology to recover waste heat. Finally he concluded by saying how the policy initiatives of the bureau will cater to the market demand and promotes energy efficiency. Mr. Satyamurthy, Joint adviser, Coal, Planning commission Mr. Satyamurthy highlighted the positive side of Indian industries. He explained using previous data how industries have reduced their energy consumption to save money. This he said was attributed to the growth of service industries that are less energy intensive. Citing examples of major Indian industries like Steel, he illustrated how the energy consumption in the unit “Kg oil equivalent” declined with time. This is particularly cost-cutting effort on fuel consumption which are cost intensive. The energy consumption has also declined significantly in Bhilai steel plant & Tata steel. He showed using figures how since 2000 till 2007, the coke to hot metal ratios (coke rate) have been declining in Indian Iron and steel industries. Concluding session Dr. Pramod Deo, Chairman, Central Electricity Regulation Commission (CERC) described how the Electricity Act 2003 was promoting use of renewable energy generation. He mentioned that the Act has specific requirements, specific targets for generation from renewable energy. On an operational level, he suggested that grid connectivity to power generated from renewable have to be ensured. State governments have purchase obligation for power generated through renewable sources. The target specified for the year 2010 is 5%. 15 states have put in place regulations to 1 to 10% of total power generated through renewable sources. Mr. Phil Douglas, First Secretary, UK DFID, concluded by saying that he was impressed by the opportunities for energy efficiency in India and the potential that they offered. He welcomed Mr. V Subramaniam’s policy of promoting and funding carbon avoidance projects more than funding carbon control technologies and agreed that the low-carbon economy is inevitable. He was also was hopeful about the ‘Feed-in Tariff’ policy for power generation from renewable energy. Mr. Douglas summarized the problem of CCS in India, and agreed that while a promising technology, being energy intensive and costly it cannot be developed in India without adequate financial and R&D support. He emphasized that the UK government stands ready to assist India in its climate and GHG mitigation efforts, and encouraged those present to propose specific areas where DFID could assist Indian policymakers. Mr. Matthew Ogonowski, Senior Policy Analyst, CCAP concluded by reiterating that the chief goal for emerging economies is and will continue to be the eradication of poverty and economic development amidst all the existing financial and technical issues challenges. On the other hand, he noted that the impact of climate change will be felt disproportionately in emerging economies, who will bear a large portion of the impacts. This makes the creation of an integrated strategy for development and climate change policy imperative. He suggested that it was important for countries like India to develop a road map outlining all possible relevant and effective GHG mitigation options, while developed countries need to design appropriate incentives to enable emerging economies to go beyond the important unilateral actions they are already taking. Such expanded efforts by emerging
Center for Clean Air Policy page 256
economies will require significant transfers of technology and resources. Hence, there is a crucial need for commitment from and cooperation between the developing and developed worlds. He emphasized that under the emerging climate regime, emerging economies like India need not go it alone; in fact international assistance might enable India to implement its national climate plan more effectively and to go even farther than currently envisioned. He added that this project has shown that with the proper policies and incentives, technologies like IGCC, CCS and advanced technology for steel production could be adopted and brought forward in India. He also stressed the promise of sector-wide approaches, now seen as a key option for achieving GHG reductions in emerging economies for the future. Under such a framework India could take “no-lose” pledges and commit itself to reduce its energy intensity in key industries; with policies currently under consideration this could produce major benefits for India, including capacity building support and technology transfer, sales of excess GHG reduction credits on carbon markets if India beats the no-lose pledge, and enhanced industrial efficiency and performance. He noted that CCAP plans to analyze the application of sector-wide approaches in India for the next stage of its India program. India can begin by defining its specific needs for international assistance. Dr. Kirit Parikh, Member Planning Commission concluded by suggesting that the low carbon economy for India (and the world) was inevitable. He noted the difficulty in establishing a base line until Copenhagen and reiterated the CCAP studies going in China, Brazil and India and how these studies are important for shaping the road map for low carbon economy of these countries.

Center for Clean Air Policy page 257
Since 1985, CCAP has been a recognized world leader in climate and air quality policy and is the only independent, non-profit think-tank working exclusively on those issues at the local, national and international levels. Headquartered in Washington, D.C. CCAP helps policymakers around the world to develop, promote and implement innovative, market-based solutions to major climate, air quality and energy problems that balance both environmental and economic interests. For information about CCAP please visit www.ccap.org.
Center for Clean Air Policy
750 First Street, NE • Suite 940
Washington, DC 20002
Tel: 202.408.9260 • Fax: 202.408.8896