cboe global markets reports 2017 fourth quarter...
TRANSCRIPT

News Release Page 1 of 17
- More -
Cboe Global Markets Reports 2017 Fourth Quarter and Full Year Results
Fourth Quarter and Full Year Highlights
Fourth Quarter and Full-Year Diluted EPS of $2.26 and $3.69, Respectively, Which Includes a One-Time Benefit of $191.5
Million or $1.70 Per Share and $1.78 Per Share, Respectively, From Enactment of Tax Reform
Fourth Quarter and Full-Year Adjusted Combined Diluted EPS of $0.871and $3.571, Respectively
Net Revenue of $265.6 Million for the Quarter, up 86 Percent, Reflects the Bats Acquisition
Net Revenue up 7 Percent for Fourth Quarter and Full-Year Compared to Adjusted Combined Net Revenue for Prior-Year
Periods1
Organic Net Revenue up 8 Percent for the Quarter and 9 Percent for the Year1,2
Record-setting Year for Trading in VIX Futures, VIX Options, and SPX Options Volume
Bats Integration on Track; Realized Cost Synergies of Approximately $25 Million in 2017
Debt Reduction of $75 Million in 4Q17; $400 Million for the Year
CHICAGO, IL – February 9, 2018 - Cboe Global Markets, Inc. (Cboe: CBOE | Nasdaq: CBOE) today reported financial results for the fourth
quarter and full year of 2017.
Consolidated results for the fourth quarter and full year of 2017 include Bats Global Markets, Inc. (Bats), which was acquired by the
company on February 28, 2017.
“2017 was a transformational year for Cboe Global Markets. We made great strides in our integration with Bats Global Markets, while
continuing to deliver value to our customers as well as our shareholders,” said Edward T. Tilly, Cboe Global Markets Chairman and Chief
Executive Officer. “We delivered on our key strategic initiatives and achieved record trading in our highest-margin proprietary products,
including VIX futures and options and SPX options, while continuing to launch new innovative products such as Cboe Bitcoin Futures.
Looking ahead, I believe our strong financial position, proprietary products, diversified revenue mix and expanded global base will
allow us to continue to grow our business and create shareholder value.”
“The fourth quarter marked a strong finish to 2017 on several financial measures, including 8 percent organic growth, EBITDA margin
expansion and year-one acquisition-related synergies that exceeded our target," said Brian Schell, Cboe Global Markets Executive Vice
President and Chief Financial Officer. "In 2017, our strong cash flow generation allowed us to pay down $400 million of our term loan
while continuing to invest in our business and increase our dividend to shareholders. We expect the new tax law changes to favorably
impact our future cash flows and plan to maintain a balanced approach to capital deployment, with a focus on increasing long-term
shareholder value.”
(1)A full reconciliation of our non-GAAP results to our GAAP results is included in the attached tables. See "Non-GAAP Information" in the accompanying financial tables. (2)Organic net revenue excludes the net revenue contribution resulting from the acquisition of Bats to arrive at net revenue for legacy Cboe. See "Non-GAAP Information" in
the accompanying financial tables.
News Release Page 2 of 17
- More -
Consolidated Fourth Quarter Results -Table 1
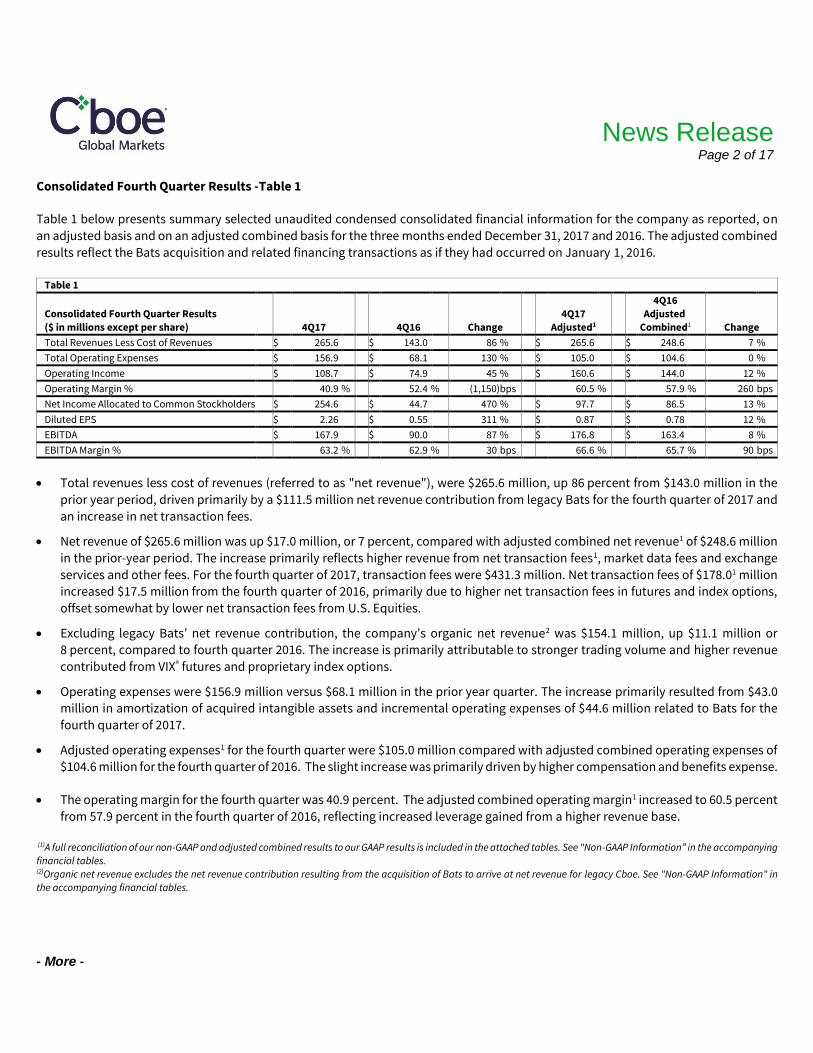
Table 1 below presents summary selected unaudited condensed consolidated financial information for the company as reported, on
an adjusted basis and on an adjusted combined basis for the three months ended December 31, 2017 and 2016. The adjusted combined
results reflect the Bats acquisition and related financing transactions as if they had occurred on January 1, 2016.
Table 1
4Q16
Consolidated Fourth Quarter Results 4Q17 Adjusted
($ in millions except per share) 4Q17 4Q16 Change Adjusted1 Combined1 Change
Total Revenues Less Cost of Revenues $ 265.6 $ 143.0 86 % $ 265.6 $ 248.6 7 %
Total Operating Expenses $ 156.9 $ 68.1 130 % $ 105.0 $ 104.6 0 %
Operating Income $ 108.7 $ 74.9 45 % $ 160.6 $ 144.0 12 %
Operating Margin % 40.9 % 52.4 % (1,150) bps 60.5 % 57.9 % 260 bps
Net Income Allocated to Common Stockholders $ 254.6 $ 44.7 470 % $ 97.7 $ 86.5 13 %
Diluted EPS $ 2.26 $ 0.55 311 % $ 0.87 $ 0.78 12 %
EBITDA $ 167.9 $ 90.0 87 % $ 176.8 $ 163.4 8 %
EBITDA Margin % 63.2 % 62.9 % 30 bps 66.6 % 65.7 % 90 bps
Total revenues less cost of revenues (referred to as "net revenue"), were $265.6 million, up 86 percent from $143.0 million in the
prior year period, driven primarily by a $111.5 million net revenue contribution from legacy Bats for the fourth quarter of 2017 and
an increase in net transaction fees.
Net revenue of $265.6 million was up $17.0 million, or 7 percent, compared with adjusted combined net revenue1 of $248.6 million
in the prior-year period. The increase primarily reflects higher revenue from net transaction fees1, market data fees and exchange
services and other fees. For the fourth quarter of 2017, transaction fees were $431.3 million. Net transaction fees of $178.01 million
increased $17.5 million from the fourth quarter of 2016, primarily due to higher net transaction fees in futures and index options,
offset somewhat by lower net transaction fees from U.S. Equities.
Excluding legacy Bats’ net revenue contribution, the company’s organic net revenue2 was $154.1 million, up $11.1 million or
8 percent, compared to fourth quarter 2016. The increase is primarily attributable to stronger trading volume and higher revenue
contributed from VIX® futures and proprietary index options.
Operating expenses were $156.9 million versus $68.1 million in the prior year quarter. The increase primarily resulted from $43.0
million in amortization of acquired intangible assets and incremental operating expenses of $44.6 million related to Bats for the
fourth quarter of 2017.
Adjusted operating expenses1 for the fourth quarter were $105.0 million compared with adjusted combined operating expenses of
$104.6 million for the fourth quarter of 2016. The slight increase was primarily driven by higher compensation and benefits expense.
The operating margin for the fourth quarter was 40.9 percent. The adjusted combined operating margin1 increased to 60.5 percent
from 57.9 percent in the fourth quarter of 2016, reflecting increased leverage gained from a higher revenue base.
(1)A full reconciliation of our non-GAAP and adjusted combined results to our GAAP results is included in the attached tables. See "Non-GAAP Information” in the accompanying
financial tables. (2)Organic net revenue excludes the net revenue contribution resulting from the acquisition of Bats to arrive at net revenue for legacy Cboe. See "Non-GAAP Information" in
the accompanying financial tables.
News Release Page 3 of 17
- More -
The effective tax rate for the fourth quarter was a tax benefit of 147 percent, which includes the impact of a one-time benefit of
$191.5 million from the re-measurement of the company’s deferred tax positions using the lower corporate tax rate resulting from
the U.S. corporate tax reform legislation passed during the fourth quarter of 2017. Excluding the impact of tax reform and other
non-GAAP adjustments, the adjusted tax rate¹ was 37.0 percent in the fourth quarter of 2017.
Diluted EPS for the fourth quarter of 2017 was $2.26. Adjusted combined diluted EPS1 was $0.87, up 12 percent compared to $0.78
for 2016’s fourth quarter.
Business Segment Information:
Table 2
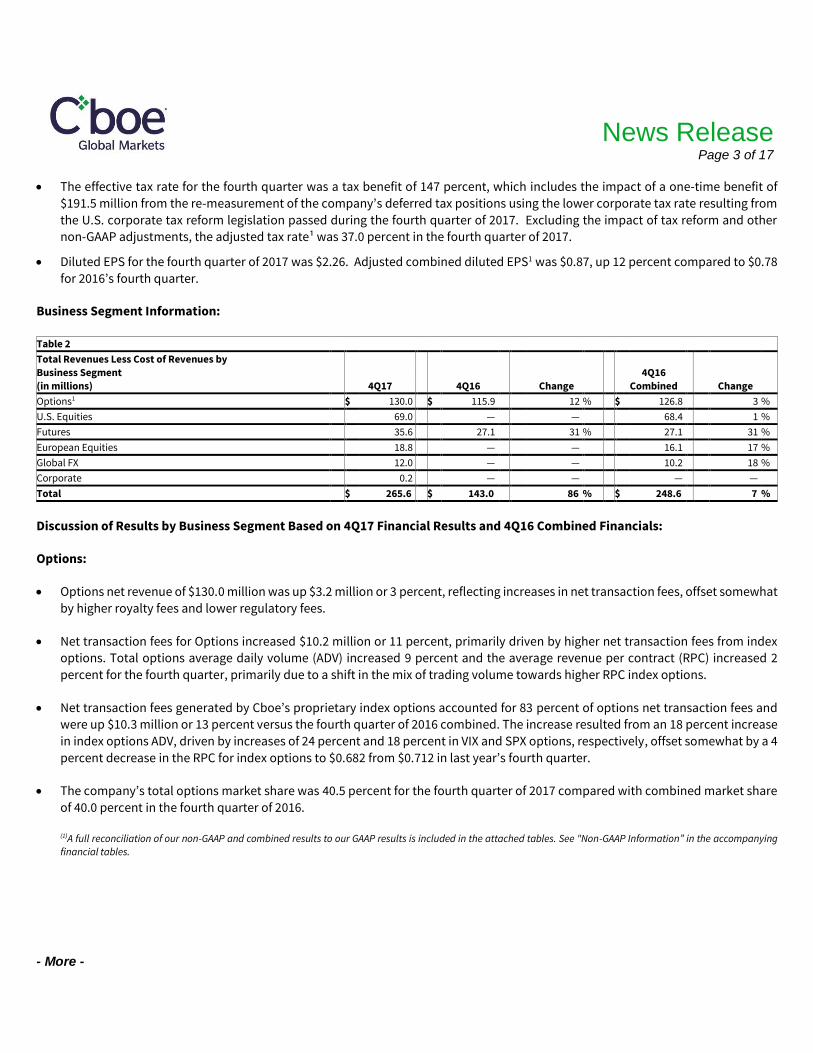
Total Revenues Less Cost of Revenues by
Business Segment 4Q16
(in millions) 4Q17 4Q16 Change Combined Change
Options1 $ 130.0 $ 115.9 12 % $ 126.8 3 %
U.S. Equities 69.0 — — 68.4 1 %
Futures 35.6 27.1 31 % 27.1 31 %
European Equities 18.8 — — 16.1 17 %
Global FX 12.0 — — 10.2 18 %
Corporate 0.2 — — — —
Total $ 265.6 $ 143.0 86 % $ 248.6 7 %
Discussion of Results by Business Segment Based on 4Q17 Financial Results and 4Q16 Combined Financials:
Options:
Options net revenue of $130.0 million was up $3.2 million or 3 percent, reflecting increases in net transaction fees, offset somewhat
by higher royalty fees and lower regulatory fees.
Net transaction fees for Options increased $10.2 million or 11 percent, primarily driven by higher net transaction fees from index
options. Total options average daily volume (ADV) increased 9 percent and the average revenue per contract (RPC) increased 2
percent for the fourth quarter, primarily due to a shift in the mix of trading volume towards higher RPC index options.
Net transaction fees generated by Cboe’s proprietary index options accounted for 83 percent of options net transaction fees and
were up $10.3 million or 13 percent versus the fourth quarter of 2016 combined. The increase resulted from an 18 percent increase
in index options ADV, driven by increases of 24 percent and 18 percent in VIX and SPX options, respectively, offset somewhat by a 4
percent decrease in the RPC for index options to $0.682 from $0.712 in last year’s fourth quarter.
The company’s total options market share was 40.5 percent for the fourth quarter of 2017 compared with combined market share
of 40.0 percent in the fourth quarter of 2016.
(1)A full reconciliation of our non-GAAP and combined results to our GAAP results is included in the attached tables. See "Non-GAAP Information” in the accompanying financial tables.

News Release Page 4 of 17
- More -
U.S. Equities:
U.S. Equities net revenue of $69.0 million was up $0.6 million or 1 percent, reflecting lower net transaction fees offset by an increase
in non-transaction fees.
Net transaction fees for U.S. Equities of $17.4 million decreased by $2.3 million or 12 percent, reflecting weaker market conditions
and tougher comparisons against last year’s fourth quarter. The decrease in net transaction fees resulted from a 10 percent decline
in market volumes and a 1.5 percentage point decline in market share, with net capture up 5 percent to $0.022 per 100 touched
shares.
Cboe’s U.S. Equities business maintained its position as the second-largest market operator during the fourth quarter of 2017, with
market share of 18.5 percent.
Cboe’s U.S. Equities business, the second-largest U.S. market operator for ETF trading, executed 21.7 percent of all ETF volume
during the fourth quarter of 2017 and won 23.6 percent of all new ETF listings during the quarter.
Futures:
Futures net revenue of $35.6 million increased $8.5 million or 31 percent, primarily due to higher transaction fees resulting from a
21 percent increase in VIX futures ADV and a 7 percent increase in RPC. The RPC rose to $1.799 in the fourth quarter of 2017
compared with $1.683 in the fourth quarter of 2016, primarily due to pricing changes implemented in January 2017.
In 2017, trading volume in VIX futures set a new record for the 13th consecutive year with ADV of 294,000 contracts, up 23 percent
compared with 2016.
European Equities:
Net revenue for European Equities increased 17 percent, reflecting growth in both net transaction fees and non-transaction
revenue. In local currency, net revenue grew 10 percent.
For the fourth quarter of 2017, Cboe Europe Equities retained its position as the largest Pan-European stock exchange with 20.3
percent market share.
In 2017, Cboe Europe delivered solutions for a post-MiFID II landscape, including Cboe LIS, a block trading platform, periodic
auctions book and buy-side trade reporting.
Global FX:
Global FX net revenue of $12.0 million rose 18 percent from $10.2 million, primarily due to higher net transaction fees compared
with the fourth quarter of 2016. Average daily notional value (ADNV) traded on the Cboe FX platform was $32.4 billion for the
quarter, up 21 percent from last year’s fourth quarter, driven by record quarterly volume on its London matching engine.
Cboe FX market share increased to 14.9 percent for the fourth quarter and 13.4 percent for the year, setting new all-time highs.
News Release Page 5 of 17
- More -
2018 Fiscal Year Financial Guidance
The company provided the following guidance for the 2018 fiscal year:
Adjusted operating expenses are expected to be in a range of $420 million to $428 million, representing a projected increase of
1 to 3 percent compared to combined adjusted operating expenses of $415.3 million for 2017. The guidance excludes the
amortization of acquired intangible assets of $157 million, which the company plans to include in its non-GAAP reconciliation.¹
Depreciation and amortization expense, which is included in adjusted operating expenses above, is expected to be in the range
of $53 million to $58 million, excluding the amortization of acquired intangible assets of $157 million.
The effective tax rate¹ on adjusted earnings for the year is expected to be in the range of 26.5 percent to 28.5 percent. The tax
rate guidance incorporates the impact of the U.S. corporate tax reform enacted in December of 2017. Significant changes in
trading volume, expenses, federal, state and local tax laws or rates and other items could materially impact this expectation.
Capital expenditures are projected to be in the range of $50 million to $55 million, which include the company’s ongoing
investments in technology, including Cboe’s migration to Bats technology.
(1)Specific quantifications of the amounts that would be required to reconcile the company’s adjusted operating expenses guidance and adjusted effective tax rate guidance are not available. The company believes that there is uncertainty and unpredictability with respect to certain of its GAAP measures, primarily related to acquisition-related
expenses that would be required to reconcile to GAAP operating expenses and GAAP effective tax rate, which preclude the company from providing accurate guidance on
certain forward-looking GAAP to non-GAAP reconciliations. The company believes that providing estimates of the amounts that would be required to reconcile the range of
the company’s adjusted operating expenses and adjusted effective tax rate would imply a degree of precision that would be confusing or misleading to investors for the
reasons identified above.
Capital Management
The company paid cash dividends of $30.6 million, or $0.27 per share, during the fourth quarter of 2017.
At December 31, 2017, the company had net cash and financial investments of $120.2 million, which excludes $70.5 million of cash
collected for Section 31 fees. Long-term debt as of December 31, 2017 was $1.2 billion and reflects a payment of $75 million made
during the fourth quarter towards the company’s term loan.
Earnings Conference Call
Executives of Cboe Global Markets will host a conference call to review its fourth-quarter financial results today, February 9, 2018, at
8:30 a.m. ET/7:30 a.m. CT. The conference call and any accompanying slides will be publicly available via live webcast from the Investor
Relations section of the company’s website at www.cboe.com under Events & Presentations. Participants may also listen via telephone
by dialing (877) 255-4313 from the United States, (866) 450-4696 from Canada or (412) 317-5466 for international callers. Telephone
participants should place calls 10 minutes prior to the start of the call. The webcast will be archived on the company’s website for
replay. A telephone replay of the earnings call also will be available from approximately 11:00 a.m. CT, February 9, 2018, through
11:00 p.m. CT, February 16, 2018, by calling (877) 344-7529 from the U.S., (855) 669-9658 from Canada or (412) 317-0088 for international
callers, using replay code 10115071.

News Release Page 6 of 17
- More -
About Cboe Global Markets
Cboe Global Markets, Inc. (Cboe: CBOE | Nasdaq: CBOE) is one of the world’s largest exchange holding companies, offering cutting-edge
trading and investment solutions to investors around the world. The company is committed to relentless innovation, connecting global
markets with world-class technology, and providing seamless solutions that enhance the customer experience.
Cboe offers trading across a diverse range of products in multiple asset classes and geographies, including options, futures, U.S. and
European equities, exchange-traded products (ETPs), global foreign exchange (FX) and multi-asset volatility products based on the
Cboe Volatility Index (VIX Index), the world’s barometer for equity market volatility.
Cboe’s trading venues include the largest options exchange in the U.S. and the largest stock exchange by value traded in Europe. In
addition, the company is the second-largest stock exchange operator in the U.S. and a leading market globally for ETP trading.
The company is headquartered in Chicago with offices in Kansas City, New York, London, San Francisco, Singapore, Hong Kong and
Ecuador. For more information, visit www.cboe.com.
Cautionary Statements Regarding Forward-Looking Information
This press release contains forward-looking statements within the meaning of the Private Securities Litigation Reform Act of 1995 that involve a number of risks and
uncertainties. You can identify these statements by forward-looking words such as “may,” “might,” “should,” “expect,” “plan,” “anticipate,” “believe,” “estimate,”
“predict,” “potential” or “continue,” and the negative of these terms and other comparable terminology. All statements that reflect our expectations, assumptions or
projections about the future other than statements of historical fact are forward-looking statements. These forward-looking statements, which are subject to known and
unknown risks, uncertainties and assumptions about us, may include projections of our future financial performance based on our growth strategies and anticipated trends in our business. These statements are only predictions based on our current expectations and projections about future events. There are important factors that
could cause our actual results, level of activity, performance or achievements to differ materially from those expressed or implied by the forward-looking statements.
We operate in a very competitive and rapidly changing environment. New risks and uncertainties emerge from time to time, and it is not possible to predict all risks and
uncertainties, nor can we assess the impact of all factors on our business or the extent to which any factor, or combination of factors, may cause actual results to differ
materially from those contained in any forward-looking statements.
Some factors that could cause actual results to differ include: the loss of our right to exclusively list and trade certain index options and futures products; economic,
political and market conditions; compliance with legal and regulatory obligations; price competition and consolidation in our industry; decreases in trading volumes,
market data fees or a shift in the mix of products traded on our exchanges; legislative or regulatory changes; increasing competition by foreign and domestic entities; our
dependence on and exposure to risk from third parties; our index providers’ ability to maintain the quality and integrity of their indexes and to perform under our
agreements; our ability to operate our business without violating the intellectual property rights of others and the costs associated with protecting our intellectual property rights; our ability to attract and retain skilled management and other personnel, including those experienced with post-acquisition integration; our ability to
accommodate trading volume and transaction traffic, including significant increases, without failure or degradation of performance of our systems; our ability to protect
our systems and communication networks from security risks, including cyber-attacks and unauthorized disclosure of confidential information; challenges to our use of
open source software code; our ability to meet our compliance obligations, including managing potential conflicts between our regulatory responsibilities and our for-
profit status; damage to our reputation; the ability of our compliance and risk management methods to effectively monitor and manage our risks; our ability to manage our growth and strategic acquisitions or alliances effectively; unanticipated difficulties or expenditures relating to the acquisition of Bats Global Markets, Inc., including,
without limitation, difficulties that result in the failure to realize expected synergies, accretion, efficiencies and cost savings from the acquisition within the expected time
period (if at all), whether in connection with integration, migrating trading platforms, broadening distribution of product offerings or otherwise; restrictions imposed by
our debt obligations; our ability to maintain an investment grade credit rating; potential difficulties in our migration of trading platforms and our ability to retain
employees as a result of the acquisition; and the accuracy of our estimates and expectations. More detailed information about factors that may affect our actual results to differ may be found in our filings with the SEC, including in our Annual Report on Form 10-K for the year ended December 31, 2016 and other filings made from time to
time with the SEC.
We do not undertake, and we expressly disclaim, any duty to update any forward-looking statement whether as a result of new information, future events or otherwise,
except as required by law. Readers are cautioned not to place undue reliance on these forward-looking statements, which speak only as of the date hereof.

News Release Page 7 of 17
- More -
The condensed consolidated statements of income and balance sheets are unaudited and subject to reclassification.
Cboe Media Contacts: Analyst Contact:
Suzanne Cosgrove Hannah Randall Stacie Fleming Debbie Koopman
(312) 786-7123 (646) 856-8809 44-20-7012-8950 (312) 786-7136
[email protected] [email protected] [email protected] [email protected]
CBOE-F
Trademarks:
Cboe®, Bats®, BZX®, BYX®, EDGX®, EDGA®, Cboe Volatility Index® and VIX® are registered trademarks and Cboe Global MarketsSM and SPXSM
are service marks of Cboe Global Markets, Inc. and its subsidiaries. All other trademarks and service marks are the property of their
respective owners.

News Release Page 8 of 17
- More -
Cboe Global Markets, Inc.
Combined Key Performance Statistics by Business Segment1
4Q 2017 3Q 2017 2Q 2017 1Q 2017 4Q 2016
Options (ADV in thousands)
Total industry ADV 17,347 16,182 16,676 16,558 16,195
Total company Options ADV 7,029 6,751 7,035 6,852 6,477
Multiply-listed options 4,971 4,685 5,188 4,914 4,736
Index options 2,058 2,066 1,847 1,938 1,741
Total Options Market Share 40.5 % 41.7 % 42.2 % 41.4 % 40.0 %
Total Options RPC: $ 0.239 $ 0.247 $ 0.225 $ 0.243 $ 0.234
Multiply-listed options $ 0.056 $ 0.061 $ 0.058 $ 0.059 $ 0.059
Index options $ 0.682 $ 0.669 $ 0.694 $ 0.708 $ 0.712
U.S. Equities
Total industry ADV (shares in billions) 6.4 6.1 6.9 6.8 7.1
Market share % 18.5 % 19.2 % 19.2 % 19.2 % 20.0 %
Net capture (per 100 touched shares) $ 0.022 $ 0.022 $ 0.023 $ 0.023 $ 0.021
Futures
ADV (in thousands) 285 331 307 255 236
RPC $ 1.799 $ 1.752 $ 1.762 $ 1.814 $ 1.683
European Equities
Total industry ADNV (Euros - in billions) € 43.8 € 41.1 € 48.6 € 45.5 € 44.6
Market share % 20.3 % 21.1 % 21.3 % 21.5 % 21.9 %
Net capture (bps) 0.177 0.168 0.162 0.169 0.160
Global FX
Market share % 14.9 % 12.9 % 12.9 % 12.9 % 11.6 %
ADNV ($ in billions) $ 32.4 $ 29.0 $ 27.9 $ 28.8 $ 26.7
Net revenue (per one million shares traded) $ 2.57 $ 2.63 $ 2.65 $ 2.57 $ 2.65
1For informational purposes, the operating statistics for these periods are presented on a combined basis to reflect information pertaining to Bats Global Markets, Inc.
which was acquired by Cboe Global Markets, Inc. on February 28, 2017.
ADV = average daily volume; ADNV = average daily notional value
RPC, average revenue per contract, for options and futures represents total net transaction fees recognized for the period divided by total contracts traded during the
period.
U.S. Equities, "net capture per 100 touched shares" refers to annual transaction fees less liquidity payments and routing and clearing costs divided by the product of one-
hundredth ADV of touched shares on BZX, BYX, EDGX and EDGA and the number of trading days.
European Equities, "net capture per matched notional value" refers to transaction fees less liquidity payments in British pounds divided by the product of ADNV in British pounds of shares matched on Cboe Europe Equities and the number of trading days.
Global FX, "net capture per one million dollars traded" refers to net transaction fees divided by the product of one-thousandth of ADNV traded on the Cboe FX market
and the number of trading days, divided by two, which represents the buyer and seller that are both charged on the transaction. Market Share represents Cboe FX volume
divided by the total volume of publicly reporting spot FX venues (Cboe FX, NEX, Reuters/FXall, and FastMatch).
Average transaction fees per contract can be affected by various factors, including exchange fee rates, volume-based discounts and transaction mix by contract type and product type.

News Release Page 9 of 17
- More -
Cboe Global Markets, Inc. and Subsidiaries
Consolidated Statements of Income (Unaudited)
Three and Twelve Months Ended December 31, 2017 and 2016
Three Months Ended December 31, Twelve Months Ended December 31,
(in millions, except per share amounts) 2017 2016 2017 2016
Revenue:
Transaction fees $ 431.3 $ 131.0 $ 1,564.9 $ 509.3
Access fees 29.2 13.0 106.8 52.4
Exchange services and other fees 19.5 12.1 74.8 46.3
Market data fees 47.2 8.7 164.5 33.2
Regulatory fees 86.4 20.9 291.5 48.3
Other revenue 7.1 5.1 26.6 13.6
Total Revenues 620.7 190.8 2,229.1 703.1
Cost of Revenue
Liquidity payments 243.6 12.6 849.7 35.8
Routing and clearing 9.7 3.2 37.6 11.1
Section 31 fees 79.5 11.8 260.0 11.8
Royalty fees 22.3 20.2 86.2 78.0
Total Cost of Revenue 355.1 47.8 1,233.5 136.7
Revenues Less Cost of Revenues 265.6 143.0 995.6 566.4
Operating Expenses:
Compensation and benefits 53.2 29.3 201.4 113.2
Depreciation and amortization 55.9 10.0 192.2 44.4
Technology support services 11.2 5.5 42.1 22.5
Professional fees and outside services 17.1 12.9 66.0 53.9
Travel and promotional expenses 5.2 3.4 17.2 11.0
Facilities costs 2.6 1.5 10.3 5.7
Acquisition-related costs 9.0 4.2 84.4 12.8
Change in contingent consideration (0.1) - 1.0 - Other expenses 2.8 1.3 9.1 4.7
Total Operating Expenses 156.9 68.1 623.7 268.2
Operating Income 108.7 74.9 371.9 298.2
Other Income/(Expense):
Interest expense, net (10.4) (5.5) (41.3) (5.7)
Other (expense)/ income 5.8 5.5 3.8 14.1
Total Other Income (4.6) - (37.5) 8.4
Income Before Income (Benefit) Taxes 104.1 74.9 334.4 306.6
Income tax (benefit) provision (153.0) 29.8 (66.2) 120.9
Net Income 257.1 45.1 400.6 185.7
Net income attributable to noncontrolling interests 0.3 0.3 1.1 1.1
Net Income Excluding Noncontrolling Interests 257.4 45.4 401.7 186.8
Change in redemption value of noncontrolling interests (0.3) (0.5) (1.1) (1.1)
Net income allocated to participating securities (2.5) (0.2) (3.9) (0.8)
Net Income Allocated to Common Stockholders $ 254.6 $ 44.7 $ 396.7 $ 184.9
Net Income Per Share Allocated to Common Stockholders:
Basic earnings per share $ 2.27 $ 0.55 $ 3.70 $ 2.27
Diluted earnings per share 2.26 0.55 3.69 2.27
Weighted average shares used in computing income per share:
Basic 112.3 81.3 107.2 81.4
Diluted 112.6 81.3 107.5 81.4

News Release Page 10 of 17
- More -
Cboe Global Markets, Inc. and Subsidiaries
Condensed Consolidated Balance Sheets (Unaudited)
December 31, 2017 and 2016
December 31, December 31,
(in millions) 2017 2016
Assets
Current Assets:
Cash and cash equivalents $ 143.5 $ 97.3
Financial investments 47.3 —
Accounts receivable, net 217.3 76.7
Income taxes receivable 17.2 53.7
Other current assets 11.4 7.4
Total Current Assets 436.7 235.1
Investments 82.7 72.9
Land 4.9 4.9
Property and equipment, net 73.9 55.9
Goodwill 2,707.4 26.5
Intangible assets, net 1,902.6 8.7
Other assets, net 57.5 72.7
Total $ 5,265.7 $ 476.7
Liabilities, Redeemable Noncontrolling Interests and Stockholders’ Equity
Current Liabilities:
Accounts payable and accrued liabilities $ 153.8 $ 82.4
Section 31 fees payable 105.6 4.4
Deferred revenue 15.4 3.1
Income taxes payable 2.6 —
Contingent consideration liability 56.6 —
Total Current Liabilities 334.0 89.9
Long-term debt 1,237.9 —
Income tax liability 78.8 52.1
Deferred income taxes 488.2 —
Other non-current liabilities 6.8 4.2
Total Liabilities 2,145.7 146.2
Redeemable Noncontrolling Interests 9.4 12.6
Stockholders’ Equity:
Preferred stock — —
Common stock 1.2 0.9
Treasury stock at cost (558.3) (532.2)
Additional paid-in-capital 2,623.7 139.2
Retained earnings 993.3 710.8
Accumulated other comprehensive income (loss), net 50.7 (0.8)
Total Stockholders’ Equity 3,110.6 317.9
Total $ 5,265.7 $ 476.7

News Release Page 11 of 17
- More -
Non-GAAP Information
In addition to disclosing results determined in accordance with GAAP, Cboe Global Markets has disclosed certain non-GAAP measures
of operating performance. These measures are not in accordance with, or a substitute for, GAAP, and may be different from or
inconsistent with non-GAAP financial measures used by other companies. The non-GAAP measures provided in this press release
include net transaction fees, adjusted operating expenses, adjusted operating income, organic net revenue, adjusted operating margin,
adjusted net income allocated to common stockholders and adjusted diluted earnings per share, adjusted tax rate, EBITDA, EBITDA
margin, adjusted EBITDA and adjusted EBITDA margin. The non-GAAP measures provided in this press release also include combined
company financial measures that are discussed in further detail below under the sub-section "Combined Reconciliations."
Management believes that the non-GAAP financial measures presented in this press release, including adjusted net revenue, organic
net revenue and adjusted operating expenses, provide additional and comparative information to assess trends in our core operations
and a means to evaluate period-to-period comparisons. Non-GAAP financial measures disclosed by management are provided as
additional information to investors in order to provide them with an alternative method for assessing our financial condition and
operating results.
Organic net revenue: Is a non-GAAP financial measure that excludes or has otherwise been adjusted for the impact of our acquisition of
Bats. Management believes the organic net revenue growth measure provides users with supplemental information regarding the
company’s ongoing revenue performance and trends by presenting revenue growth excluding the impact of the Bats acquisition.
Amortization expense of acquired intangible assets: We amortize intangible assets acquired in connection with various acquisitions.
Amortization of intangible assets is inconsistent in amount and frequency and is significantly affected by the timing and size of our
acquisitions. As such, if intangible asset amortization is included in performance measures, it is more difficult to assess the day-to-day
operating performance of the businesses, the relative operating performance of the businesses between periods and the earnings
power of the company. Therefore, we believe performance measures excluding intangible asset amortization expense provide investors
with an additional basis for comparison across accounting periods.
Acquisition-related expenses: From time to time, we have pursued small bolt-on acquisitions and in 2017 completed a larger
transformative acquisition, which have resulted in expenses which would not otherwise have been incurred in the normal course of the
company’s business operations. These expenses include integration costs, as well as legal, due diligence and other third party
transaction costs. The frequency and the amount of such expenses vary significantly based on the size, timing and complexity of the
transaction. Accordingly, we exclude these costs for purposes of calculating non-GAAP measures which provide an additional analysis
of Cboe’s ongoing operating performance or comparisons in Cboe’s performance between periods.
Other significant items: We have excluded certain other charges that are the result of other non-comparable events to measure
operating performance. For 2017, other significant items primarily included interest and other borrowing costs incurred prior to the
close of the Bats transaction and accelerated stock-based compensation that was incurred due to a change in the vesting schedule for
equity award grants.
Organic Net Revenue Reconciliation
Three Months Ended Twelve Months Ended
Table 3 December 31, December 31,
(in millions) 2017 2016 2017 2016
Reconciliation of Revenue Less Cost of Revenue to Organic Net Revenue
Revenue less cost of revenue (net revenue) $ 265.6 $ 143.0 $ 995.6 $ 566.4
Recent acquisitions:
Bats revenue less cost of revenue (111.5) — (378.2) —
Organic net revenue $ 154.1 $ 143.0 $ 617.4 $ 566.4

News Release Page 12 of 17
- More -
Reconciliation of GAAP and non-GAAP Information The information below shows the reconciliation of each financial measure from GAAP to non-GAAP. The non-GAAP financial measures exclude the impact of those items detailed below and are referred to as adjusted financial measures. Three Months Ended Twelve Months Ended
Table 4 December 31, December 31,
(in millions, except per share amounts) 2017 2016 2017 2016
Reconciliation of Net Income Allocated to Common Stockholders to Non-GAAP (As shown on Table 1)
Net income allocated to common stockholders $ 254.6 $ 44.7 $ 396.7 $ 184.9
Non-GAAP adjustments
Compensation and benefits (1) — 0.2 9.1 1.5
Acquisition-related expenses (2) 9.0 4.2 84.4 13.5
Amortization of acquired intangible assets (3) 43.0 0.3 142.6 1.2
Assessment of computer-based lease taxes for prior period use — — — 0.3
Change in contingent consideration (0.1) — 1.0 —
Debt issuance costs — — 5.2 —
Provision for uncollectable convertible notes receivable — — 3.8 —
Change in redemption value of noncontrolling interests 0.3 0.5 1.1 1.1
Interest and other borrowing costs (4) — 5.5 — 5.7
Less: Legal settlement (5) — — — (5.5)
Less: Gain on settlement of contingent consideration — — — (1.4)
Total Non-GAAP adjustments 52.2 10.7 247.2 16.4
Income tax expense related to the items above (19.2) (3.9) (92.3) (5.7)
Re-measurement of deferred tax assets and liabilities as a result of corporate rate increase in Illinois — — 7.4 —
Effect of tax reform law (191.5) — (191.5) —
Uncertain tax position related to research and development credits — — — 1.7
Net income allocated to participating securities - effect on reconciling items 1.6 — 0.5 —
Adjusted net income allocated to common stockholders $ 97.7 $ 51.5 $ 368.0 $ 197.3
Reconciliation of Diluted EPS to Non-GAAP
Diluted earnings per common share $ 2.26 $ 0.55 $ 3.69 $ 2.27
Per share impact of non-GAAP adjustments noted above (1.39) 0.08 (0.27) 0.15
Adjusted diluted earnings per common share $ 0.87 $ 0.63 $ 3.42 $ 2.42
Reconciliation of Operating Margin to Non-GAAP
Revenue less cost of revenue $ 265.6 $ 143.0 $ 995.6 $ 566.4
Non-GAAP adjustments noted above — — — —
Adjusted revenue less cost of revenue $ 265.6 $ 143.0 $ 995.6 $ 566.4
Operating expenses $ 156.9 $ 68.1 $ 623.7 $ 268.2
Non-GAAP adjustments noted above 51.9 4.7 237.1 16.5
Adjusted operating expenses $ 105.0 $ 63.4 $ 386.6 $ 251.7
Operating income $ 108.7 $ 74.9 $ 371.9 $ 298.2
Non-GAAP adjustments noted above 51.9 4.7 237.1 16.5
Adjusted operating income $ 160.6 $ 79.6 $ 609.0 $ 314.7
Adjusted operating margin (6) 60.5 % 55.7 % 61.2 % 55.6 %
Reconciliation of Income Tax Rate to Non-GAAP
Income before income taxes 104.1 74.9 334.4 306.6
Non-GAAP adjustments noted above 52.2 10.7 247.2 16.4
Adjusted income before income taxes $ 156.3 $ 85.6 $ 581.6 $ 323.0
Income tax (benefit) expense (153.0) 29.8 (66.2) 120.9
Non-GAAP adjustments noted above 210.7 3.9 276.4 4.0
Adjusted income tax (benefit) expense $ 57.7 $ 33.7 $ 210.2 $ 124.9
Adjusted income tax rate 37.0 % 39.4 % 36.3 % 38.7 %
(1) For the fourth quarter of 2016, this amount includes $0.2 million for accelerated stock-based compensation expenses. For the year ended December 31, 2017, this amount includes $9.1
million for accelerated stock-based compensation expense. For the year ended December 31, 2016, this amount includes $0.9 million for accelerated stock-based compensation expenses and
$0.6 million in additional bonus accrual resulting from legal settlement income.
(2) This amount includes professional fees and outside services, severance, and other costs related to the company’s acquisition of Bats.
(3) This amount represents the amortization of acquired intangible assets for Bats.
(4) This amount represents interest and other borrowing costs incurred prior to the close of the Bats acquisition.
(5) Settlement received for attorney fees and expenses relating to a litigation matter, reported in investment and other income.
(6) Adjusted operating margin represents adjusted operating income divided by adjusted revenue less cost of revenue.

News Release Page 13 of 17
- More -
EBITDA Reconciliations
EBITDA (earnings before interest, income taxes, depreciation and amortization) is a widely used non-GAAP financial measure of operating performance. EBITDA margin
represents EBITDA divided by revenues less cost of revenues (net revenue). It is presented as supplemental information that the company believes is useful to investors
to evaluate its results because it excludes certain items that are not directly related to the company’s core operating performance. EBITDA is calculated by adding back
to net income interest expense, income tax expense, depreciation and amortization. EBITDA should not be considered as substitutes either for net income, as an indicator of the company’s operating performance, or for cash flow, as a measure of the company’s liquidity. In addition, because EBITDA may not be calculated identically by all
companies, the presentation here may not be comparable to other similarly titled measures of other companies. EBITDA margin represents EBITDA divided by net
revenue.
Table 5
Three Months Ended Twelve Months Ended
(in millions) December 31, December 31,
Reconciliation of Net Income Allocated to Common Stockholders to EBITDA and Adjusted EBITDA (Per
Table 1) 2017 2016 2017 2016
Net income allocated to common stockholders $ 254.6 $ 44.7 $ 396.7 $ 184.9 Interest 10.4 5.5 41.3 5.7
Income tax provision (153.0) 29.8 (66.2) 120.9 Depreciation and amortization 55.9 10.0 192.2 44.4
EBITDA $ 167.9 $ 90.0 $ 564.0 $ 355.9
EBITDA Margin¹ 63.2 % 62.9 % 56.6 % 62.8 %
Non-GAAP adjustments not included in above line items
Compensation and benefits (accelerated stock-based compensation) — 0.2 9.1 1.5 Acquisition-related expenses 9.0 4.2 84.4 13.5
Provision for uncollectable convertible notes receivable — — 3.8 — Less: Legal settlement — — — (5.5)
Less: Gain on settlement of contingent consideration — — — (1.4) Other (0.1) — 1.0 0.3
Adjusted EBITDA $ 176.8 $ 94.4 $ 662.3 $ 364.3
Adjusted EBITDA Margin¹ 66.6 % 66.0 % 66.5 % 64.3 %
Three Months Ended Twelve Months Ended
(in millions) December 31, December 31,
Reconciliation of Combined Net Income Allocated to Common Stockholders to EBITDA and Adjusted
EBITDA (Per Table 1) 2017 2 2016 2017 2016
Combined revenues less cost of revenues $ 248.6 $ 1,067.5 $ 1,002.8
Combined net income allocated to common stockholders $ 60.3 $ 267.2 $ 230.8
Interest 12.1 45.4 44.1
Income tax provision 35.3 159.2 147.3
Depreciation and amortization 55.7 222.4 226.8
Combined EBITDA $ 163.4 $ 694.2 $ 649.0
Combined EBITDA Margin¹ 65.7 % 65.0 % 64.7 %
Non-GAAP adjustments not included in above line items
Compensation and benefits (accelerated stock-based compensation) 0.2 9.1 0.9
Acquisition-related expenses — — —
Provision for uncollectable convertible notes receivable — 3.8 —
Less: Legal settlement — — (5.5)
Less: Gain on settlement of contingent consideration — — (1.4)
Other (0.2) 1.4 7.2
Adjusted Combined EBITDA $ 163.4 $ 708.5 $ 650.2
Adjusted Combined EBITDA Margin¹ 65.7 % 66.4 % 64.8 %
¹EBITDA margin represents the respective EBITDA divided by the respective net revenue as shown in the non-GAAP reconciliations provided. 2Combined results for the three months ended December 31, 2017 are the same as the financial results reported as the company was operating as a combined entity for
the entire quarter.

News Release Page 14 of 17
- More -
Combined Reconciliations
The non-GAAP unaudited combined financial measures have been prepared by recording combined adjustments to the historical
consolidated financial statements of Cboe Global Markets. The combined financial measures for the three months ended December 31,
2016 and twelve months ended December 31, 2016 and 2017, have been prepared as if the Bats acquisition closed on January 1, 2016.
Due to the transformative nature of the Bats acquisition, the company believes that providing a discussion of its results and operations
on a non-GAAP combined basis provides management and investors an additional perspective on the company’s financial and
operational performance and trends.
These combined financial measures are not necessarily indicative of the financial position or results of operations that would have
occurred had the transactions been effected on the assumed dates. Additionally, future results may vary significantly from the results
reflected in the combined financial measures.
Options Net Revenue - Three Months Ended December 31, 2016 - Table 6
Combined
(in millions) Cboe Historical Bats Historical (Per Table 2)
Total net revenue $ 115.9 $ 10.9 $ 126.8
Note: There are no reconciliations applicable for the other segments.
Transaction Net Revenue –Three Months Ended December 31, 2017 and 2016 - Table 7
Three Months Ended December 31,
2017 2016
Transaction fees $ 431.3 $ 441.7 Liquidity payments (243.6) (271.3)
Routing and clearing (9.7) (9.9)
Net transaction fees $ 178.0 $ 160.5

News Release Page 15 of 17
- More -
Adjusted Combined Income Statement Reconciliation - Twelve months ended December 31, 2017 - Table 8
Cboe Bats Combined Foot- Non-GAAP Foot- Adjusted
(in millions, except per share amounts) Historical Historical¹ Adjustments note Combined Adjustments note Combined
Revenues $ 2,229.1 $ 272.9 $ 2,502.0 $ 2,502.0
Cost of revenues 1,233.5 201.0 1,434.5 1,434.5
Net revenue:
Net transaction fees $ 677.6 $ 27.8 $ 705.4 $ 705.4
Access fees 106.8 11.9 118.7 118.7
Exchange services and other fees 74.8 5.0 79.8 79.8
Market data fees 164.5 25.7 190.2 190.2
Regulatory fees 31.5 0.5 32.0 32.0
Royalty fees (86.2) — (86.2) (86.2)
Other 26.6 1.0 27.6 27.6
Revenues less cost of revenues $ 995.6 $ 71.9 $ 1,067.5 $ 1,067.5
Operating expenses:
Compensation and benefits $ 201.4 $ 16.1 $ 217.5 (9.1) $ 208.4
Depreciation and amortization 192.2 6.7 23.5 (1) 222.4 (169.8) (4) 52.6
Technology support services 42.1 4.0 46.1 46.1
Professional fees and outside services 66.0 27.2 (23.4) (2) 69.8 69.8
Travel and promotional expenses 17.2 0.6 17.8 17.8
Facilities costs 10.3 0.6 10.9 10.9
Acquisition related costs 84.4 — (84.4) (2) — —
Change in contingent consideration 1.0 0.2 1.2 (1.2) —
Other expenses 9.1 0.8 9.9 (0.2) 9.7
Total operating expenses $ 623.7 $ 56.2 $ (84.3) $ 595.6 $ (180.3) $ 415.3
Operating income $ 371.9 $ 15.7 $ 84.3 $ 471.9 $ 180.3 $ 652.2
Operating margin (5) 37.4 % 21.8 % 44.2 % 61.1 %
Non-operating (expense)/income $ (37.5) $ (17.7) $ 13.6 (3) $ (41.6) $ 3.8 $ (37.8)
Income (loss) before income tax provision $ 334.4 $ (2.0) $ 97.9 $ 430.3 $ 184.1 $ 614.4
Income tax (benefit) provision $ (66.2) $ (1.8) $ 227.2 $ 159.2 $ 53.6 $ 212.8
Net income allocated to participating securities $ (3.9) $ — $ (3.9) $ (3.9)
Net income allocated to common stockholders $ 396.7 $ (0.2) $ (129.3) $ 267.2 $ 130.5 $ 397.7
Diluted EPS $ 3.52 $ 2.37 $ 3.57
Total non-transaction revenue (6) $ 404.2 $ 44.1 $ 448.3 $ 448.3
Total non-transaction revenue as a percent of revenues less cost of revenues (7) 40.6 % 61.3 % 42.0 % 42.0 %
¹Bats historical activity for 2017 reflects activity for the period beginning January 1, 2017 through February 28, 2017.
(1) Reflects adjustments to reduce Bats historical amortization of acquired intangibles by $4.5 million and increase amortization of acquired intangibles by $28.0 million.
(2) Reflects adjustments to remove acquisition costs as if the acquisition had occurred on January 1, 2016.
(3) Reflects net other income of $13.6 million resulting from Bats historical interest expense and loss of extinguishment of debt.
(4) Reflects adjustment of amortization of purchased intangibles totaling $169.8 million.
(5) Operating margin represents operating income divided by revenue less cost of revenue.
(6) Total non-transaction revenue represents the sum of access fees, exchange services and other fees, market data fees, regulatory fees (net of Section 31 fees) and other
revenue
(7) The percentage of non-transaction revenue represents total non-transaction revenue divided by revenue less cost of revenue.
News Release Page 16 of 17
- More -
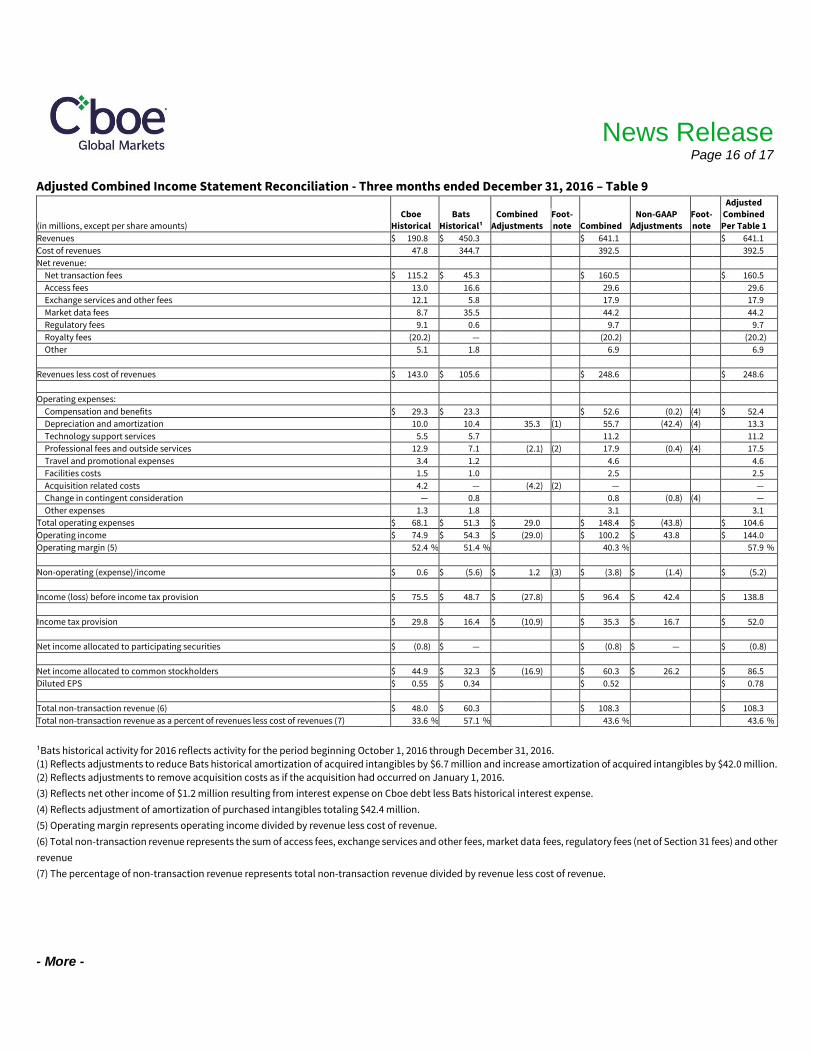
Adjusted Combined Income Statement Reconciliation - Three months ended December 31, 2016 – Table 9
Adjusted
Cboe Bats Combined Foot- Non-GAAP Foot- Combined
(in millions, except per share amounts) Historical Historical¹ Adjustments note Combined Adjustments note Per Table 1
Revenues $ 190.8 $ 450.3 $ 641.1 $ 641.1
Cost of revenues 47.8 344.7 392.5 392.5
Net revenue:
Net transaction fees $ 115.2 $ 45.3 $ 160.5 $ 160.5
Access fees 13.0 16.6 29.6 29.6
Exchange services and other fees 12.1 5.8 17.9 17.9
Market data fees 8.7 35.5 44.2 44.2
Regulatory fees 9.1 0.6 9.7 9.7
Royalty fees (20.2) — (20.2) (20.2)
Other 5.1 1.8 6.9 6.9
Revenues less cost of revenues $ 143.0 $ 105.6 $ 248.6 $ 248.6
Operating expenses:
Compensation and benefits $ 29.3 $ 23.3 $ 52.6 (0.2) (4) $ 52.4
Depreciation and amortization 10.0 10.4 35.3 (1) 55.7 (42.4) (4) 13.3
Technology support services 5.5 5.7 11.2 11.2
Professional fees and outside services 12.9 7.1 (2.1) (2) 17.9 (0.4) (4) 17.5
Travel and promotional expenses 3.4 1.2 4.6 4.6
Facilities costs 1.5 1.0 2.5 2.5
Acquisition related costs 4.2 — (4.2) (2) — —
Change in contingent consideration — 0.8 0.8 (0.8) (4) —
Other expenses 1.3 1.8 3.1 3.1
Total operating expenses $ 68.1 $ 51.3 $ 29.0 $ 148.4 $ (43.8) $ 104.6
Operating income $ 74.9 $ 54.3 $ (29.0) $ 100.2 $ 43.8 $ 144.0
Operating margin (5) 52.4 % 51.4 % 40.3 % 57.9 %
Non-operating (expense)/income $ 0.6 $ (5.6) $ 1.2 (3) $ (3.8) $ (1.4) $ (5.2)
Income (loss) before income tax provision $ 75.5 $ 48.7 $ (27.8) $ 96.4 $ 42.4 $ 138.8
Income tax provision $ 29.8 $ 16.4 $ (10.9) $ 35.3 $ 16.7 $ 52.0
Net income allocated to participating securities $ (0.8) $ — $ (0.8) $ — $ (0.8)
Net income allocated to common stockholders $ 44.9 $ 32.3 $ (16.9) $ 60.3 $ 26.2 $ 86.5
Diluted EPS $ 0.55 $ 0.34 $ 0.52 $ 0.78
Total non-transaction revenue (6) $ 48.0 $ 60.3 $ 108.3 $ 108.3
Total non-transaction revenue as a percent of revenues less cost of revenues (7) 33.6 % 57.1 % 43.6 % 43.6 %
¹Bats historical activity for 2016 reflects activity for the period beginning October 1, 2016 through December 31, 2016.
(1) Reflects adjustments to reduce Bats historical amortization of acquired intangibles by $6.7 million and increase amortization of acquired intangibles by $42.0 million.
(2) Reflects adjustments to remove acquisition costs as if the acquisition had occurred on January 1, 2016.
(3) Reflects net other income of $1.2 million resulting from interest expense on Cboe debt less Bats historical interest expense.
(4) Reflects adjustment of amortization of purchased intangibles totaling $42.4 million.
(5) Operating margin represents operating income divided by revenue less cost of revenue.
(6) Total non-transaction revenue represents the sum of access fees, exchange services and other fees, market data fees, regulatory fees (net of Section 31 fees) and other
revenue
(7) The percentage of non-transaction revenue represents total non-transaction revenue divided by revenue less cost of revenue.

News Release Page 17 of 17
###
Adjusted Combined Income Statement Reconciliation - Twelve months ended December 31, 2016 – Table 10
Cboe Bats Combined Foot- Non-GAAP Foot- Adjusted
(in millions, except per share amounts) Historical Historical¹ Adjustments note Combined Adjustments note Combined
Revenues $ 703.1 $ 1,868.9 $ 2,572.0 $ 2,572.0
Cost of revenues 136.7 1,432.5 1,569.2 1,569.2
Net revenue:
Net transaction fees $ 462.4 $ 191.3 $ 653.7 $ 653.7
Access fees 52.4 66.9 119.3 119.3
Exchange services and other fees 46.3 23.3 69.6 69.6
Market data fees 33.2 145.8 179.0 179.0
Regulatory fees 36.5 2.3 38.8 38.8
Royalty fees (78.0) — (78.0) (78.0)
Other 13.6 6.8 20.4 20.4
Revenues less cost of revenues $ 566.4 $ 436.4 $ 1,002.8 $ 1,002.8
Operating expenses:
Compensation and benefits $ 113.2 $ 92.0 $ 205.2 (1.3) $ 203.9
Depreciation and amortization 44.4 41.6 140.8 (1) 226.8 (169.6) (4) 57.2
Technology support services 22.5 23.1 45.6 (0.3) 45.3
Professional fees and outside services 53.9 30.5 (5.5) (2) 78.9 (5.6) 73.3
Travel and promotional expenses 11.0 5.4 16.4 16.4
Facilities costs 5.7 4.2 9.9 9.9
Acquisition related costs 12.8 — (12.8) (2) — —
Change in contingent consideration — 3.0 3.0 (3.0) —
Other expenses 4.7 6.0 10.7 0.9 11.6
Total operating expenses $ 268.2 $ 205.8 $ 122.5 $ 596.5 $ (178.9) $ 417.6
Operating income $ 298.2 $ 230.6 $ (122.5) $ 406.3 $ 178.9 $ 585.2
Operating margin (5) 52.6 % 52.8 % 40.5 % 58.4 %
Non-operating (expense)/income $ 8.4 $ (52.9) $ 16.5 (3) $ (28.0) $ (8.1) $ (36.1)
Income (loss) before income tax provision $ 306.6 $ 177.7 $ (106.0) $ 378.9 $ 170.8 $ 549.7
Income tax provision $ 120.9 $ 69.7 $ (43.3) $ 147.3 $ 65.4 $ 212.7
Net income allocated to participating securities $ (0.8) $ — $ (0.8) 1.4 $ 0.6
Net income allocated to common stockholders $ 184.9 $ 108.0 $ (62.7) $ 230.2 $ 106.8 $ 337.6
Diluted EPS $ 1.05 $ 0.63 $ 2.06 0.46 $ 3.00
Total non-transaction revenue (6) $ 182.0 $ 245.1 $ 427.1 $ 427.1
Total non-transaction revenue as a percent of revenues less cost of revenues (7) 32.1 % 56.2 % 42.6 % 42.6 %
¹Bats historical activity for 2016 reflects activity for the period beginning January 1, 2016 through December 31, 2016.
(1) Reflects adjustments to reduce Bats historical amortization of acquired intangibles by $24.7 million and increase amortization of acquired intangibles by $168.2
million.
(2) Reflects adjustments to remove acquisition costs as if the acquisition had occurred on January 1, 2016.
(3) Reflects net other income of $16.5 million resulting from interest expense on Cboe debt less Bats historical interest expense.
(4) Reflects adjustment of amortization of purchased intangibles totaling $169.6 million.
(5) Operating margin represents operating income divided by revenue less cost of revenue.
(6) Total non-transaction revenue represents the sum of access fees, exchange services and other fees, market data fees, regulatory fees (net of Section 31 fees) and other
revenue
(7) The percentage of non-transaction revenue represents total non-transaction revenue divided by revenue less cost of revenue.