causal effect of health on labor market outcomes: evidence
TRANSCRIPT

Causal effect of health on labor market outcomes: Evidence from a random assignment iron
supplementation intervention
Duncan Thomas, UCLA Elizabeth Frankenberg, UCLA Jed Friedman, The World Bank
Jean-Pierre Habicht, Cornell University Nathan Jones, UCLA
Christopher McKelvey, UCLA Gretel Pelto, Cornell University
Bondan Sikoki, RAND and SurveyMETER James P. Smith, RAND
Cecep Sumantri, SurveyMETER Wayan Suriastini, SurveyMETER
April 2004 Paper presented at the Population Association of America Annual Meetings, Boston, April 2004. Financial support from the National Institutes on Aging (R01-AG20909), Fogarty International Center and the Global Development Network is gratefully acknowledged.

Abstract Iron deficiency is widespread throughout the developing world. We provide new evidence on the effect of iron deficiency on economic and social prosperity of older adults drawing on data from a random assignment treatment-control design intervention. The Work and Iron Status Evaluation is an on-going study following over 17,000 individuals in Central Java, Indonesia. Half the respondents receive a treatment of 120 mg of iron every week for a year; the controls receive a placebo. Compliance is monitored carefully. Results from the first six months of the intervention are presented for adults age 30 through 70 years. Males who were iron deficient prior to the intervention and who are assigned to the treatment are better off in terms of physical health, psycho-social health and economic success. These men are more likely to be working, sleep less, lose less work time to illness, are more energetic, more able to conduct physically arduous activities and their psycho-social health is better. There is evidence that economic productivity of these males also increased. Among iron-deficient males assigned to the treatment who were also self-employed prior to the baseline, hourly earnings rose substantially and so they earned more on a monthly basis. Benefits for women are in the same direction but the effects are more muted. The results provide unambiguous evidence in support of the hypothesis that health has a causal effect on economic prosperity of males during middle and older ages.

1
1. Introduction
There is a strong positive association between health and economic prosperity (Marmot et al,
1997). The association, which is observed in both micro-level and macro-level data, has been
documented for a wide array of health indicators, for many different dimensions of economic prosperity
and across a broad spectrum of demographic, social and economic contexts. However, identifying the
causal underpinnings of these relationships has proven to be extremely difficult. (See Strauss and
Thomas, 1998, Smith, 1999, and Goldman, 2001, for reviews of the literature.)
It seems reasonable to suppose that causality runs in both directions. Many studies have
documented that higher income individuals invest more in human capital, including health. As income
grows, individuals invest in higher quality diets, improved sanitation practices and better health care,
suggesting that higher income leads to better health. Evidence on the relationship between income
innovations and health is more ambiguous. On the one hand, studies suggest some investments in health
and health services are particularly responsive to income innovations while other studies indicate that
health is protected at times of negative income shocks, (Behrman and Deolalikar, 1988; Case, Lubotsky
and Paxson, 2003; Frankenberg and Thomas, 2003; Stillman and Thomas, 2003.) On the other hand,
evidence on the effect of health on economic well-being suggests that declines in health are associated
with reduced labor supply, earnings from work and wealth (Pitt and Rosenzweig, 1986; Thomas and
Strauss, 1998; Smith, 1999). A key stumbling block in this literature has been parsing out that part of the
observed correlation between health and economic prosperity that is due to health causing income, that
which is due to income causing health, and that which is driven by common unobserved characteristics.
Thinking of health as one dimension of human capital, it is plausible that improvements in health
will yield returns in the labor force. If a healthier worker is less susceptible to disease, is more alert and
has more energy, then he or she will probably be a more productive worker and command higher hourly
earnings. Establishing this link is not straightforward. It is, however, very important. If health does
affect economic prosperity then evaluations of health interventions that do not take this into account will
tend to understate their benefits to individuals and to society.

2
This paper presents results from an on-going study which seeks to measure the causal effect of
one dimension of health -- iron deficiency -- on economic and social success broadly defined. Iron
deficiency is widespread through many parts of the developing world. The Work and Iron Status
Evaluation (WISE) randomly assigns a weekly iron supplement to half the subjects with the rest being
given a placebo. Iron supplementation continued for a year; we report results on labor market outcomes
from the first six months of the intervention. Since the social and economic benefits of health
improvements are likely to take time to manifest themselves, we view the evidence presented below as
indicative of the immediate benefits of reducing iron deficiency. As the study progresses, we will
measure the causal effects of health improvements on economic progress over the longer term.
We focus on adults age 30 through 70 at the time of the baseline. Iron supplementation results in
elevated blood iron levels, as measured by hemoglobin, for both males and females in this age group.
These benefits are concentrated among those who are iron deficient prior to the intervention. After six
months of supplementation, there is evidence that iron-deficient older adults who received the treatment
are better off in terms of physical health, psycho-social health and economic success. Relative to the
control group, males who were iron deficient prior to the intervention and received the treatment are more
likely to be working, earn more and lose less work time to illness. These men are also more energetic,
sleep less, they are more able to conduct physically arduous activities and their psycho-social health is
better. The effects for females are generally in the same direction but tend to be more muted. Treated
females who were iron deficient at baseline are more likely to be working, have higher hourly earnings if
they earn income and tend to have better physical and psycho-social health. The results provide
unambiguous evidence in support of the hypothesis that health has a causal effect on economic and social
prosperity of adults during middle and older ages.

3
2. Relationship between health and economic or social prosperity
The literature suggests that income has a causal impact on health and nutrition. Evidence at the
household level indicates that increases in economic resources are invested in improved diet, better
sanitation and health practices, increased use of health services and, possibly, more effective use of these
services. Rising incomes are associated with lower rates of mortality and reduced nutrition deficiencies.
(See Behrman and Deolalikar, 1988; and Strauss and Thomas, 1995, for discussions of the evidence at the
micro level. Ruger, Jamison and Bloom, 2001, summarize the macro literature. See also the 1993 World
Development Report and 1999 World Health Report.) An important body of evidence demonstrates that,
over the long run, there is a positive association between economic prosperity and health of a population
as measured by morbidity, mortality or nutritional status. (See, for example, Preston, 1975; Fogel, 1992,
1994, 1999; Steckel, 1995.) Attained stature of adults in the United States, Europe and in developing
countries today has been combined in creative ways with information on indicators of economic status by
Fogel, his students and his collaborators to yield important insights into the effects of income -- and
income shocks -- on nutritional outcomes.
Nutrition has played a prominent role in the literature linking health and economic prosperity at
least since Liebenstein (1957). Improved nutrition is one of the leading public health accomplishments
cited by the United States Centers for Disease Control and Prevention that contributed to the greatly
improved longevity and quality of life in the United States in the 20th century. This was achieved in part
through food fortification which virtually eliminated rickets, goiter, and pellagra in the United States, and
reduced the incidence of iron deficiency anemia, neural tube defects, and other conditions. In contrast,
malnutrition remains a widespread and debilitating problem throughout many parts of the developing
world. and there is evidence that, along with genotype and environmental influences, diet plays a role in
the etiology of many chronic diseases.
In recent years, substantial strides have been made in understanding the links between nutrition
and health in low-income settings. In earlier decades, it was widely believed that poor nutrition arose
primarily because of inadequate energy or protein, and effort was focussed on increasing energy intakes
among the poor. As it became apparent that protein-energy malnutrition was only one element in
improving the nutritional status of people in low-income settings, the focus shifted towards also
4
understanding the influence of micro-nutrients such as iron, iodine, zinc, calcium and several key vitamins
on health and nutrition. In the research reported here we place the spotlight on one micro-nutrient: iron.
Iron deficiency is thought to be the most common nutritional deficiency in the world today. It is
estimated that over 2 billion people worldwide are iron deficient. The effects of iron deficiency include
reduced immune response, delayed cognitive and physical development, fatigue and reduced work
capacity, and, in extreme situations, death. The vast majority of the literature on iron deficiency has
focussed on women of reproductive age and on young children. However, these are not the only
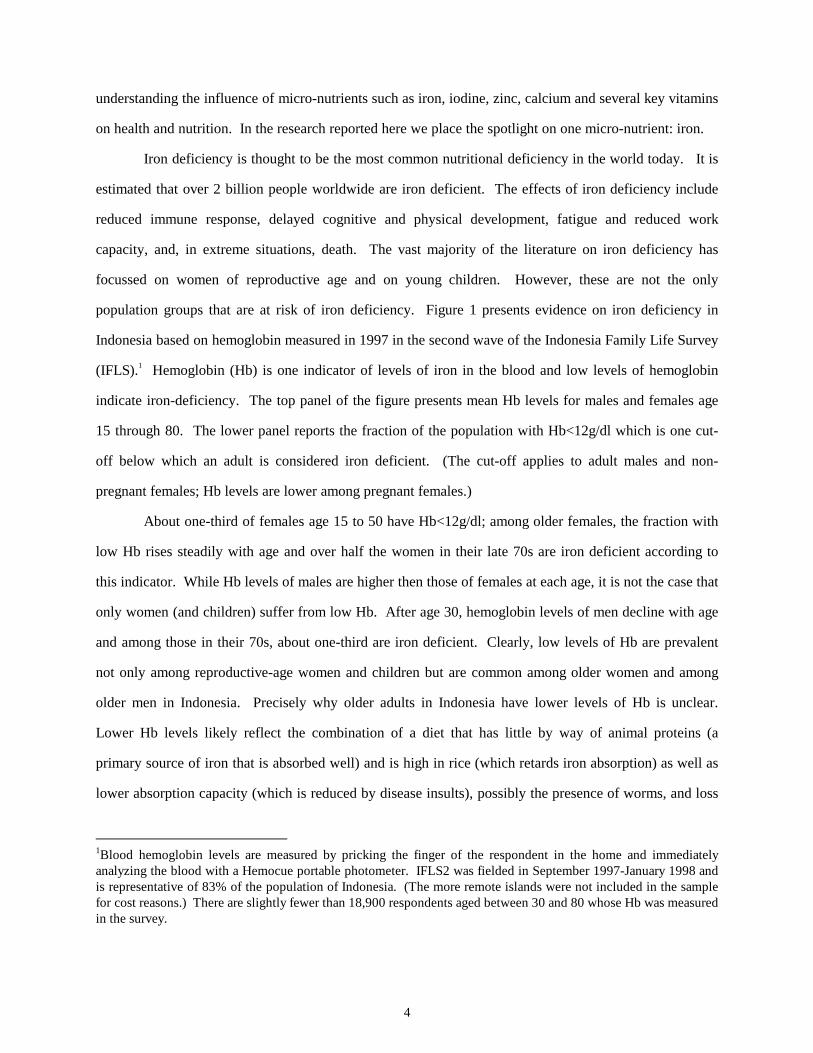
population groups that are at risk of iron deficiency. Figure 1 presents evidence on iron deficiency in
Indonesia based on hemoglobin measured in 1997 in the second wave of the Indonesia Family Life Survey
(IFLS).1 Hemoglobin (Hb) is one indicator of levels of iron in the blood and low levels of hemoglobin
indicate iron-deficiency. The top panel of the figure presents mean Hb levels for males and females age
15 through 80. The lower panel reports the fraction of the population with Hb<12g/dl which is one cut-
off below which an adult is considered iron deficient. (The cut-off applies to adult males and non-
pregnant females; Hb levels are lower among pregnant females.)
About one-third of females age 15 to 50 have Hb<12g/dl; among older females, the fraction with
low Hb rises steadily with age and over half the women in their late 70s are iron deficient according to
this indicator. While Hb levels of males are higher then those of females at each age, it is not the case that
only women (and children) suffer from low Hb. After age 30, hemoglobin levels of men decline with age
and among those in their 70s, about one-third are iron deficient. Clearly, low levels of Hb are prevalent
not only among reproductive-age women and children but are common among older women and among
older men in Indonesia. Precisely why older adults in Indonesia have lower levels of Hb is unclear.
Lower Hb levels likely reflect the combination of a diet that has little by way of animal proteins (a
primary source of iron that is absorbed well) and is high in rice (which retards iron absorption) as well as
lower absorption capacity (which is reduced by disease insults), possibly the presence of worms, and loss
1Blood hemoglobin levels are measured by pricking the finger of the respondent in the home and immediately analyzing the blood with a Hemocue portable photometer. IFLS2 was fielded in September 1997-January 1998 and is representative of 83% of the population of Indonesia. (The more remote islands were not included in the sample for cost reasons.) There are slightly fewer than 18,900 respondents aged between 30 and 80 whose Hb was measured in the survey.

5
of blood.2 Although all ages are included in the WISE study design, the research reported below will
focus on older adults (ages 30 through 70).
There is evidence that iron status and labor market success are positively correlated in low-
income settings (Thomas and Frankenberg, 2002). Using data from the pre-baseline wave of WISE, the
relationship between �n(earnings) and Hb is presented below for adult males. Controlling age (in a
flexible way), there is a positive and significant correlation between Hb and earnings throughout the Hb
distribution (although it is slightly larger at low levels of Hb). While it might be tempting to conclude that
improvements in Hb status will result in higher income and faster economic growth, such a conclusion
would be premature. Not only may causality run in the opposite direction, but the correlation between
earnings and current Hb levels may be confounded by other characteristics that also affect labor market
outcomes. �n(earnings) of males age 30-70 and nutritional status Spline in Hb Hb<12g/dl Hb>=12g/dl Height Education BMI Controls:
�1
�2
�3
�4
�5
[1] Age (splines) 0.092 0.062 . . . (0.034) (0.020) [2] + Height, education, 0.071 0.029 0.012 0.099 . & location (0.032) (0.019) (0.004) (0.006)
[3] + BMI 0.069 0.014 0.013 0.091 0.045 (0.032) (0.019) (0.004) (0.001) (0.008) (Standard errors in parentheses) Source: WISE -04 month wave
2Low Hb may be a reflection of the presence of malaria infections or inflammatory disorders (Asobayire et al, 2002). The study site for this project, which is described in more detail below, was selected because malaria is not present and inflammatory disorders are not thought to be prevalent. Hb levels in the study site mirror those reported for the Indonesian population in IFLS suggesting the estimates for the entire population are not driven by these infections. Vitamins A, B-2, B-6, Folate and B-12 all play a role in hematological formation. Deficiencies in these micronutrients may result in the co-existence of low levels of Hb and high iron stores (Fishman et al, 2000). Transferrin receptors (TfR) indicate levels of iron stores and are little influenced by inflammation, malaria infection or deficiencies in micronutrients other than iron. Dry blood spots collected from all subjects over the age of one in this study are being used to measure TfR. We have successfully implemented protocols for measurement of TfR only recently; results will be reported in future research.

6
In the second row, two standard controls for human capital, height and years of education, are
added to the regression in conjunction with controls for province and urban/rural location. Both education
and height are positively correlated with earnings. There is a large decline in the coefficient on
Hb>12g/dl which is no longer significant. The coefficient on low Hb is reduced by nearly a quarter but
remains significant. The results suggest that part of the correlation between Hb and earnings can be
attributed to other dimensions of human capital particularly at higher levels of Hb. Since height and
education are largely predetermined for adults, it may be that Hb is reflecting the effect of concurrent
variation in nutritional status. To explore this hypothesis, body mass index (BMI, which is weight divided
by height squared) is also added to the regression, recognizing that BMI, like Hb, is potentially correlated
with unobserved characteristics that affect earnings. The results of the extended regression are reported in
the third row. BMI is positively correlated with earnings and the association is apparently unrelated to
low Hb, height or education since the coefficients on those covariates are little changed. Clearly, higher-
earning males tend to be taller, heavier, better educated and eat higher quality diets. A key issue that this
research will address is whether the relationship between Hb and earnings can be given a causal
interpretation.
The decision to design this intervention study around iron was motivated not only by the
prevalence of iron deficiency in low income settings and the evidence suggesting iron status and earnings
are positively related. The decision was also motivated by the fact that there is a very large literature in
health, nutrition and biochemistry which provides a solid scientific foundation for understanding the
biomedical consequences of iron deficiency. (See Haas and Brownlie, 2001, for an excellent review.)
Iron plays an essential role in oxidative energy production. Iron deficient anemia (IDA) -- that is
low levels of hemoglobin (Hb) in combination with abnormal levels of other iron indicators -- is
associated with, inter alia, greater susceptibility to disease, fatigue and reduced child development. In
severe cases, it is associated with elevated infant and maternal mortality. Iron deficiency affects physical
activity through primarily two pathways. First, as hemoglobin levels decline, the maximum amount of
oxygen that the body can use (aerobic capacity) declines. Second, as iron stores are depleted, the amount
of oxygen available to muscles declines, reducing endurance, and the heart works harder to produce the
same amount of activity.

7
Rigorous studies of both animals and humans have demonstrated a causal relationship between
iron deficiency and reduced maximum aerobic capacity (VO2max). For example, studies indicate that
experimentally induced anemia results in about a 30% decline in VO2max whereas iron supplementation
for around 12 weeks produces about a 25% increase in V02max (Celsing et al., 1986; Li et al., 1994;
Woodson et al. 1978). There is also evidence that IDA is associated with reduced endurance at below
maximal work rates. In contrast, iron-deficient (but non-anemic) individuals -- individuals with normal
Hb but depleted iron stores as evidenced by, for example, low transferrin saturation or elevated levels of
transferrin receptor (TfR) -- may also suffer from fatigue, but there is little evidence that for these
individuals iron status has any effect on VO2max or endurance, (Scrimshaw, 1991; Haas and Brownlie,
2001).
Demonstrating that maximal capacity and endurance are impeded by iron deficiency does not
necessarily inform us about the economic consequences of iron deficiency in daily life. Those
consequences may be more closely aligned with energy efficiency which is the amount of physiological
energy required to perform a given task and is usually assessed by indirect calorimetry. Laboratory
studies indicate that iron deficiency impairs energetic efficiency (Zhu and Haas, 1998; Li et al. 1994). Li
and collaborators, for example, conducted a randomized treatment-control study of Chinese female cotton
mill workers. After 12 weeks of iron supplementation, they found a 5% increase in gross and net
energetic efficiencies among the treatments relative to the controls. They also observed a significant
reduction in heart rates and a 17% increase in the production efficiency of women who received the
treatment. There was no increase in work output (which was constrained by the technology of the mill)
but time spent on leisure activities, housework and marketing activities increased among the treated as did
energy expenditure in these activities. A similar finding is reported by Edgerton et al. (1979): iron
supplementation of Sri Lankan female tea plantation workers is associated with increased voluntary
activity. These results are important because they suggest iron deficiency affects how time is allocated by
an individual.
Whereas causal effects of iron status on aerobic capacity and endurance have been extremely
well-documented in both animals and humans, the link with economic and social success is less well
established. Obviously experimental studies that examine the relationship between iron deficiency and

8
work output or productivity are limited to a field setting. The strongest evidence is provided by a
longitudinal study of nearly 400 male rubber tree tappers and weeders in Indonesia (Basta et al., 1979).
Baseline health measures indicated that 45% of the study population was anemic (Hb<13g/dl). It is likely
that hookworm explains a good part of the high levels of anemia (with examination of stools of a 10%
sub-sample indicating that worms were present in 88% of the men). Among the anemic, baseline
productivity (measured by kilograms of latex collected by tappers per day and the area of trenches dug by
weeders) was about 20% lower than the productivity of non-anemic workers. In the experiment, workers
were randomly assigned to one of two groups (irrespective of their anemia status). The treatments were
given a daily iron supplement (100 mg ferrous sulphate) for 60 days; the controls were given a placebo.
Workers received an incentive payment to take the pills as scheduled. At the end of the period, blood
hemoglobin, aerobic capacity (measured by the Harvard step test) and output of those who were initially
anemic, and received the treatment, increased to nearly the levels of the non-anemic workers (whose
biological indicators did not change). Among those in the control group who were anemic, productivity
and blood hemoglobin levels also rose, although the increase was substantially smaller than among those
in the treatment group. (This is attributed by Basta et al. to the effect of the incentive payment, a claim
which is corroborated by a comparison of dietary intakes before and after the experiment: they point out
that, during the experiment, anemics in the control group spent more on leafy greens as well as other
foods which provide higher amounts of iron.)
The results suggest that the output of workers who are IDA can be raised by around 20% through
supplementation. This is a very large effect. An issue that is not addressed in the Basta et al. study is the
possibility of selective attrition. Although the study involved a sample of 156 tappers, the final analytical
sample included only 77 of those workers. If those who attrited from the study were not random with
regard to productivity (and productivity change), then the advantages of the experimental design will be
dissipated.
In fact, two other studies suggest the effects of iron supplementation may be considerably smaller.
Edgerton et al. (1979) report supplementation had small effects on the amount of tea picked by female
pickers in Sri Lanka and Li et al. (1994) found small increases in output of female cotton mill workers in
9
China although, as noted above, energy efficiency among these workers did increase significantly and
technology impeded productivity improvements at the cotton mills.
Implementation of these kinds of focussed studies is not without potential pitfalls. First, if
treatments benefit from the intervention and controls do not, there are reasons to expect attrition to be
selective. Failure to take that into account can unravel the key advantages of an experimental evaluation.
Second, interventions have tended to be targeted at specific individuals. If individuals share the benefits
of the intervention with other household and family members, then the effects of the intervention on the
subjects will be under-estimated because of these spillover effects. This might arise, for example, if tea
pickers or rubber tappers who received a supplement ate less food at home, to make room for other
household members. This raises the more general issue that there may be behavioral responses to health
interventions and that responses of households may be quite complex. Third, it may be difficult to detect
the effects of supplementation in some types of work or institutional settings. As an example, the scope
for Chinese cotton mill workers to increase output is limited by the technology of production and the
speed with which their co-workers operate. The immediate effects of supplementation on work output
among these workers are likely to be muted. However, workers who receive supplementation might reap
the benefits of elevated productivity by moving to other tasks, other factories or other jobs in which case
short-term studies will tend to miss the benefits of supplementation. Of course, if subjects who move (or
change jobs) are not followed then these effects will be missed altogether. The Chinese study also
suggests that focussing on productivity effects may miss an important part of the link between health and
prosperity. In addition to changes in hours worked and type of work, it is possible that healthier workers
will allocate more time to non-work activities including leisure and home production. This will likely
result in increased levels of well-being (and possibly even indirect benefits on productivity through
elevated levels of functioning). Enhanced productivity at home may also provide benefits for the next
generation if, say, parents invest more in their children. WISE is designed to study all of these potential
pathways through which health improvements may affect the well-being of individuals and their families.
10
3. Research design
WISE is an on-going iron supplementation intervention that is being conducted in Central Java,
Indonesia. The study site, Purworejo district, is located slightly east of Yogyakarta on the southern coast
of Java and is home to about one million people. The area is primarily agricultural. Rice, the dominant
crop in the area, is the main crop for around three-quarters of the farmers and there are typically three
harvests per year. Oranges and groundnuts are also widely grown, often in conjunction with rice.
The Community Health and Nutrition Research Laboratory (CHN-RL) at the University of
Gadjah Mada, Yogyakarta, has been conducting a surveillance study of 16,000 households in Purworejo
since 1996. Study households were randomly selected to be representative of the district and have been
interviewed at least once a year since the inception of the surveillance study. For this study, four of the
fifteen kecamatans in Purworejo were excluded (because there is a risk that malaria is present in these
upland, wooded areas and iron supplementation may have a deleterious effect on people infected with
malaria). Seventy of the 148 enumeration areas in the CHN-RL study sample were randomly selected
and, after excluding households that were participating in other, co-incident CHN-RL intensive studies, all
5,570 households living in those enumeration areas were included in the WISE screener survey. Because
surveillance studies do not track respondents who move out of the community, a refreshment sample was
added. Using the household listing from the 2000 Census conducted by the Badan Pusat Statistik,
Indonesia, 80 enumeration areas were randomly selected from the same eleven kecamatans selected from
the CHN-RL rosters. Fifty-five households were randomly selected in each enumeration area for the
WISE screener survey.
The WISE screener survey was conducted during October-December 2001. Questions were asked
about socio-demographics, health and work. Blood was taken using a finger prick to measure hemoglobin
(with the Hemocue photometer). Over 37,000 respondents living in 9,500 households were screened.3
39,435 households were interviewed in the screener; in each of 152 of the listed households, all members from the household had combined with another screener household. Thus, 96.2% of the target households were interviewed. All household members had died in 22 (0.2%) households, 22 households (0.2%) refused to be interviewed, 107 households (1%) were ineligible (because they were not in the original CHN-RL sample or were duplicated households in the Census); 175 households had moved out of the enumeration area (1.8%) and 56 households (0.6%) could not be found in the enumeration area.

11
The WISE study sample was then selected. All screened subjects were pooled and a sample of
individuals was drawn. Once an individual was drawn, the entire household was included in the study
sample. Each individual was assigned a probability weight which reflected the key goals of this study:
measurement of the effect of iron supplementation on economic and social productivity of older adults.
Since the biomedical evidence demonstrates that the benefits of iron supplementation accrue primarily
(and possibly only) to those who are iron deficient, males age 25 through 75 and females age 40 to 75
with low Hb in the screener were over-sampled. Slightly over 17,500 respondents living in 4,300
households were included in the WISE study sample.
Detailed individual and household interviews are being conducted every four months, starting
immediately after the completion of the screener survey. The pre-baseline (-4 month) survey, conducted
between January and April 2002, was followed by the baseline (0 month) survey between May and
September 2002. The iron supplementation was started in August 2002 and will continue for at least 12
months. The start of the intervention is staggered across enumeration areas so that some areas began the
intervention in early October 2002. The first post-intervention (04 month) survey was conducted between
late September and December 2002, the second (08 month) survey was started in January 2003 and was
completed by the end of April, 2003, the third (12 month) post-intervention survey was conducted
between May and August, 2003 and the fourth (16 month) was conducted between September and
December, 2003. The fifth post-intervention survey (20 month) is currently in the field and will be
followed by the sixth (24 month) interview starting in April 2004. Appendix Table 1 summarizes the
study schedule.
CHN-RL has been conducting intervention-based studies in this area since the inception of the
surveillance site. Prior to the beginning of WISE, all respondents were invited to local meetings to
explain the goals of the study, to provide answers to all questions that respondents might have and,
thereby, serve as vehicle to help motivate participation in the study. The meetings were conducted by the
local public health service providers and local community leaders.
Households were randomly assigned to either receive the treatment (120 mg iron tablets for
subjects older than 5 years old or an orange flavored syrup for children age 5 or less) or a placebo (which
is identical in appearance). The decision to assign treatment/control status at the household was motivated

12
by two concerns. First, if iron supplementation yields benefits and household members can observe those
benefits, then it is possible that, if one household member benefits from the pill while another does not,
household members may share their pills. This sort of behavioral response to the intervention has been
observed in several nutrition-based interventions and has contaminated interpretation of those results.
Since randomization is at the household level, this kind of sharing will not affect who receives the
treatment and who receives the placebo. Second, at a more pragmatic level, many of the older
respondents in the study have limited literacy and there was a concern that it may be difficult for the
respondents to keep track of which pills were to be taken by whom. (Study participants are encouraged to
take their pills together at meal time on Friday of each week.) All tablets are identical: they are small and
colored purple (which distinguishes them from other pills that are common in the community). The
tablets are packaged in blister packs of four tablets and distributed to respondents once every four weeks
by a health facilitator who was recruited from the local community. The syrup is distributed in a small
bottle containing four doses. Every four weeks, households are provided with boxes which contain the
tablet and syrup supply for the following four weeks.
A local facilitator was recruited in each of the WISE enumeration areas. Typically the facilitator
lives in the area and is often active in the local community. During the first months of the intervention, the
facilitator visited each household in his or her area two times a week in order to encourage (or remind)
respondents to take the tablets, answer any questions and deal with any problems or side effects. If a
respondent complained about a side effect, a local health professional (usually the bidan desa in the
village) would be called and would visit the respondent. After the first four weeks, the frequency of visits
was reduced to once per week if there were no problems and compliance was high. After 12 weeks, visits
were reduced to bi-weekly for respondents without problems.
At each household visit, the number of pills remaining in the blister pack (and the amount of
syrup remaining) is recorded by the facilitator. Those records are reported to the field supervisor for the
area; the field supervisor visits all households in his or her area who report concerns regarding the study
and also all households whose compliance is low. The health facilitator records are also punched using a
computer-assisted field editing data entry package. The punched data are sent to Yogyakarta and to Los
Angeles weekly and are one of the tools used to monitor compliance. At the end of each four week

13
period, the facilitator provides each household member with a new blister pack of four tablets (or bottle of
syrup) and the old supply is collected and returned to the base in Purworejo. The number of pills
remaining is recorded at that time. All study households were given a 12 month calendar with the day that
the tablet should be taken (Friday) colored purple. These protocols were developed after extensive testing
in two pilot studies which were completed in the study area prior to the intervention.
A plausible explanation for low iron blood levels in the study population may be that helminthe
infections are prevalent. A study by CHNRL in Purworejo suggested that helminthe infections were not
uncommon but worm loads were low among infected individuals. At the time that the intervention began,
we selected 200 adults living in areas that are adjacent to three WISE study enumeration areas and
obtained fecal samples which were inspected for helminthe infections. (These adults are not in the WISE
study sample because of concern that they may refuse to participate in the study. Since helminthe
infections tend to be clustered in communities, measuring worm loads in respondents living close to the
study area should provide a good indicator of the worm loads prevalent in the WISE study sample.)
Those measurements confirmed the earlier CHNRL results: few adults have helminthe infections and,
among those that are infected, worm loads are low.4 Nonetheless, in order to address the possibility that
helminthe infections might retard the absorption of iron into the blood, treatments were given 400mg of
Albendazole within one month of receiving iron tablets and again six months later; placebos were
administered to the control sample. (Pregnant and lactating women were not included in the
administration of the anti-helminthes or their associated placebos.)
All of the blister packs of tablets and syrup (treatment and placebo) were prepared by the
Department of Pharmacy at the University of Gadja Madah. The content of the iron tablets, Albendazole
and the placebo has been measured by an independent laboratory (West Coast Analytical Services,
California) and confirmed to be correct. All tablets and syrup are labelled either "A" or "B". None of the
450 adults between the age of 30 and 70 were selected in each of 4 desas which are adjacent to WISE enumeration areas. Half the adults are male. The average age is 45. No worms were detected in 70% of the fecal samples. 15% contained low worm loads (<100 larvae), 12% had moderate loads (100-1000 larvae) and 3% had heavy loads (>1000 larvae). Three helminthe infections were detected: Trichoris trichiora (in 16% of the sample), hookworm (16%) and Ascaris lumbricoides (6%). The presence of worms and worm loads are unrelated to gender (t statistics=0.05 and 1.44 respectively); presence of worms is not associated with age although, conditional on having worms, there is suggestive evidence that older adults have higher loads. (This effect is not significant.)

14
field staff knows whether A is treatment or control. The assignment is known only to the pharmacist who
prepared the tablets and syrup and two people working on the study (a co-PI based in the United States,
Wayan Suriastini, and the LA-based programmer). In the research reported below, we will refer to
groupX as treatment/control; the assignment of groupX was done by the LA-based programmer after a
coin toss and there is no link from it to the field designation of "A" and "B". The study will remain
double-blind until all fieldwork is completed.
The research reported below compares health and socio-economic indicators for adults measured
in the pre-baseline (-04 month) interview, conducted in early 2002, with indicators measured for the same
people 12 months later in early 2003 (in the 08 month interview). Some results from the 12 and 16 month
interviews are also reported. Tablets are not distributed to subjects who move outside of Purworejo (since
the costs of resupplying pills and monitoring compliance would be prohibitive) and so comparisons of
outcomes is restricted to those subjects who remained in Purworejo through the study period.5
Of the target 4,362 households selected to be included in WISE after the screener had been
completed, 99.6% were re-interviewed in the -04 month pre-baseline survey. Movers (including "split-
offs", that is, household members who move away from the target household) are followed if they remain
in Java, which added 320 households to the WISE study sample. There were 17,000 members living in
the target households at the time of the screener; of those people 96.3% were included in the pre-baseline
survey. Nearly 1,000 new household members were added to the study sample at the time of the pre-
baseline either because new people entered target households or because split-offs were living with new
people.6 There are, therefore, slightly over 18,000 study subjects in WISE.
5Interviews are conducted in the home with pencil and paper. The following day, they are edited with a computer- assisted field editing, CAFE, and data entry package designed for this study. The electronic and hardcopy data are sent from Purworejo to Yogyakarta each week where they are cross-checked. The data are transferred electronically to the United States. On average, electronic data are available approximately two weeks after an interview is completed, which provides opportunities to conduct extensive and intensive monitoring of data quality and survey completeness. While fieldwork for the 08 month was completed by the end of April, 2003, for respondents living in Purworejo, people who have moved out of Purworejo are tracked for several months after the completion of a survey wave and interviewed in their new location. Tracking is limited to respondents who move within Java. Data on movers are not yet complete for the 08 month interview.
6Seven households (0.16%) refused to participate; all household members had died in fewer than 0.1% and 0.1% had moved but were not found in their new location. Eighty people (0.5%) died between the screener and the pre-baseline and 3.9% moved and were not relocated.
15
Attrition from the survey (by the 08 month interview) is reported in Appendix Table 2. It is very
low. Nearly 97% of target respondents were re-interviewed at the 08 month interview. Very few people
have refused to participate in the study and so attrition is largely a reflection of geographic mobility which
is greatest in early adulthood. Thus, among adults age 30 through 70 -- the age group of primary interest
in this paper -- attrition is even lower: less than 2% of subjects were not re-interviewed in the 08 month
wave. Attrition is slightly (but not significantly) higher for men relative to women. While it is comforting
that attrition in the study is low, a critical scientific issue revolves around whether attrition is related to the
intervention. The lower panel of Table 2 demonstrates that the attrition rates for treatments and controls
are not significantly different. Appendix Table 3 presents regressions relating the probability a subject
attrited between the -04 and +08 month interviews to observed characteristics. Results are reported for
men and women separately.
First, if attrition is due primarily to refusal, subjects who receive iron benefit from the supplement
and subjects who receive the placebo do not benefit, it is possible that controls will be more likely to attrit
than treatments. On the other hand, if the treatment results in side-effects, they may be more likely to
attrit. If attrition is due to geographic mobility, and if the treatment results in an increase in productivity,
then treated subjects may be more likely to move in search of new economic opportunities. Treatments
would be more likely to attrit. As shown in the first column of each panel, there is no evidence that
attrition is related to treatment-control status.
Second, respondents with low Hb levels at baseline are more likely to benefit from the treatment
(and they are also less likely to have any side effects). The second column in each panel adds indicator
variables for baseline levels of Hb as well as age and education. Hb at baseline is related to attrition but
this is driven by individuals who had higher Hb at baseline (and therefore unlikely to be affected by the
treatment). Whereas higher Hb males are more likely to not be followed up, the reverse is true for higher
Hb females who are less likely to be followed up.
The final two columns report a regression that includes an interaction between treatment status
and each of the covariates in the second regression. The main effects are reported in the third column and
the interactions in the fourth column. While males who had high Hb at baseline and who received the
treatment are more likely to attrit, this is the only individually significant interaction (of 14). Taken

16
together the interactions are not jointly significant for males or females. (F tests are reported at the foot of
the table.) We conclude that attrition is not a serious concern for interpreting the effects of iron
supplementation on low Hb study sujects.
4. Results
Attention in this paper is focussed on adults age 30 to 70 at the time of the pre-baseline interview
in the first four months of 2002 who have been re-interviewed in the 08 month interview a year later.
Sample characteristics of the 7,600 respondents are reported in Table 1. Around 20% of males and 50%
of females are iron deficient (Hb<12g/dl) at baseline and while this fraction falls slightly during the
twelve month hiatus between the two surveys, the decline is small. Average Hb is not significantly
different in the two wave for males (it declines slightly), and Hb rises a little for females. As will become
clear below, this reflects the combination of two opposing effects. On the one hand, Hb levels declined
(possibly because of the lower rainfall in Purworejo in the second half of 2002). On the other hand, iron
supplementation offset this effect. Clearly supplementing everyone and then relying on changes over time
to measure the effect of supplementation would result in misleading inferences; this underscores the value
of the treatment-control design used in this study.
Compliance
By the time of the 08 month interview, 95% of respondents had been in the intervention for at
least 24 weeks. One measure of compliance is a count of the number of tablets that have been removed
from the used blister packs when they are collected at the end of each 4 week period. This is an upper
bound on the number of pills actually consumed. Results are reported in Table 2. The average subject
has taken 92% of the 24 tablets (or 22 tablets). Compliance is the same for treatments and controls and
slightly higher for female adults. Since iron is stored in the body, the key is that iron deficient subjects
ingest sufficient iron over time to become iron replete. How much iron is needed for a subject to become
replete will depend on the level of iron at baseline, the extent to which iron is absorbed by the subject, and
whether there are mitigating factors such as intestinal blood loss from parasites or ulcers. If a deficient
adult needs 1.2 g of iron to become replete, then taking 16 tablets should be sufficient to become replete

17
(Ekstrom et al, 2002; see also National Academies of Sciences, 2002). 94% of respondents achieved this
level of compliance by the sixth month of the intervention.
The relationship between number of tablets removed from the blister pack and change in Hb is
displayed in Appendix Figure 1. There is a significant increase in Hb among those respondents who have
removed at least 16 tablets and there is no evidence of additional benefit after achieving that level. This is
consistent with predictions from the nutrition biochemistry literature.
Modelling compliance is not straightforward since it involves behavioral choices which are likely
to be individual- and family-specific and possibly location-specific, and those choices may well be related
to unobserved characteristics that affect nutrition and socio-economic success. Moreover, the number of
pills removed from the blister packs is a potentially noisy measure of compliance. We start, therefore,
with measurement of intent-to-treat effects, that is a comparison of outcomes among subjects assigned to
the treatment group relative to outcomes among subjects assigned to the control group. Throughout the
following tables, results are reported separately for males and females.
Intent to treat effects on hemoglobin levels
An advantage of the WISE study design is our ability to sidestep concerns about measurement of
compliance by directly measuring whether the intervention has resulted in higher iron blood levels. Table
3 reports results for one dimension of iron status, Hb, which is a current indicator of iron in the blood.
The first column of the table reports Hb at 08 months for subjects assigned to the treatment, �; controls
are reported in the second column, �. The difference,
�-
�, is reported in the third column. The first panel
reports levels of Hb (in g/dl). For both men and women, Hb of the treatment group is significantly higher
than that of controls after 24 weeks of the intervention. The difference between the treatments and the
controls 12 months earlier (�
--�
- at the -4 month interview) is reported in the fourth column. There is no
difference between the treatments and controls prior to the start of the intervention, which is as it should
be since assignment to treatment and control status was random. The difference-in-difference between
treatments and controls after the intervention, relative to before its start, (�-
�) - (
�
--�
-) is reported in the
fifth column. For both males and females, there has been a significant increase in Hb among treatments,
relative to controls. Estimates adjusted for the age of the subject are reported in the sixth column; the
adjustment makes little difference to the estimated average impact of supplementation.

18
The biomedical evidence suggests that the benefits of iron supplementation should accrue
primarily to those with low Hb prior to the intervention. Estimates of average intent-to-treat effects will,
therefore, provide a downward biased estimate of the benefits of a targeted iron supplementation program.
In column 7, attention is restricted to those subjects whose Hb was low at the pre-baseline interview
(Hb<12.5g/dl); the (adjusted) difference-in-difference in Hb, [(�-
�)-(
�
--�
-) | Hb<12.5g/dl at -4], is reported in the
table. It is 0.4 g/dl for low Hb males -- which is over twice the magnitude of the average effect for all
males -- and 0.2 g/dl for low Hb females which is almost twice the average effect for all female subjects.
Column 7 provides our first estimate of the intent-to-treat effect of iron supplementation on the population
at greatest risk of benefitting from the supplement.7
Column 8 restricts attention to subjects whose Hb was high at the pre-baseline interview
(Hb>12.5g/dl) and reports the (adjusted) difference-in-difference, [(�-
�)-(
�
--�
-) | Hb>12.5g/dl at -4]. It is positive
and significant for males suggesting that blood iron levels do increase with supplementation for them. For
females, the effect is zero. It is possible that there are unobserved changes in the social, economic or
health environment which affects treatments differently from controls. In that case, as long as these
changes did not discriminate between subjects who were low and high Hb at pre-baseline, it is possible to
purge the estimates of contamination due to those unobserved changes by comparing the difference-in-
difference among low Hb subjects with the difference-in-difference among high Hb subjects. That
(adjusted) difference-in-difference-in-difference,
[(�-
�)-(
�
--�
-) | Hb<12.5g/dl at -4] - [(�-
�)-(
�
--�
-) | Hb>12.5g/dl at -4]
is reported in the ninth and final column of the table. It provides a second estimate of the effect of iron
supplementation on low iron subjects which is purged of unobserved heterogeneity due to environmental
change that differentially affects treatments, relative to controls. These effects are significant for males
and females.
The second and third panels of the table focus on iron deficient subjects. The probability a
subject has Hb<11g/dl is reported in the second panel. Over 8% of males and nearly 25% of females fell
7Since Hb is likely to be measured with error, the Hb of those who were measured as having low Hb at pre-baseline is likely to increase simply because of regression to the mean. This effect should not be different for treatments, relative to controls, and so it should be swept out of the estimates by contrasting changes in treatments with changes in controls.

19
below this cut-off at pre-baseline. Around one-quarter of deficient subjects were elevated above the
cutoff during the first 24 weeks of the supplementation. Between 6 and 7% of subjects who were low Hb
at pre-baseline were no longer below the cutoff at the 08 month interview. Hb was below 12g/dl at pre-
baseline for 20% of males and 50% of females; these percentages decline by 3 and 4 percentage points
respectively and about 4% of those with low Hb at pre-baseline had sufficient increases to bring them
above 12g/dl. While the increase in Hb among treatments is significant, comparing the results for the two
cut-off points suggests that during the first 24 weeks of the intervention, proportionately more of those
subjects with Hb below 11 g/dl have moved above that cut-off than those below 12 g/dl. As the
intervention progresses and additional iron is ingested, we will closely monitor whether increase in iron
will emerge at higher levels of pre-baseline blood iron.
Figures 2 and 3 provide a graphical summary of the results. Figure 2 presents non-parametric
estimates of the relationship between Hb at the -04 month interview and Hb at other interviews for males.8
The top left panel in the figure relates Hb at the -04 month interview with Hb at baseline (0 month
interview) for the same male subjects, distinguishing treatments and controls. There are no differences
between the two groups. The lower left panel relates Hb at -04 months and +08 months. The increase in
Hb among low Hb treatments is clear. The lower right-hand panel provides a smoothed estimate of the
difference between treatments and controls with similar levels of Hb at pre-baseline. It is clear that the
benefits of iron supplementation are greatest (2.5 g/dl) for the lowest Hb subjects (Hb=8g/dl); the benefits
are negligible for males with Hb>12g/dl at pre-baseline. Non-parametric estimates for females, presented
in Figure 3, paint a similar picture although the increase in Hb is smaller for females and is concentrated
among females whose pre-baseline Hb is below 10g/dl.
8Locally weighted smoothed scatterplots (LOWESS) estimates (Cleveland, 1988) are reported. Bandwidths are between 10 and 15% and were selected after visual inspection of the estimates.

20
Effects on other indicators of iron in the blood
In addition to Hb, a current indicator of iron in the blood, it is useful to measure iron stores with
either transferrin receptors (TfR) of ferritin. Transferrin serves as the iron transport protein and the
dominating mechanism for iron delivery is the internalisation of the transferrin receptor-differic transferrin
complex. The serum concentrations of serum transferrin receptors correlate with erythropoeitic activity
and tissue iron demands.9 In addition to being an indicator of iron stores, a key advantage of TfR is that it
is not affected by inflammation (in contrast with Hb). However, unlike Hb which can be measured in the
home in a survey setting, measurement of TfR is substantially more complex. Specifically, TfR can be
measured with venous blood and, recent research in nutritional biochemistry has demonstrated that it is
feasible to measure TfR by dissolving blood from a dry blood spot using the ELIZA method (McDade and
Shell-Duncan, 2002).
We have been collecting dry blood spots from each study subject since the beginning of the
project. Blood from a pin prick is placed on a capillary to measure Hb with the Hemocue photometer and
then each respondent is asked to place his or her finger on a disc of filter paper in order to collect the
blood which is then air dried and stored in vacuum packs with desiccants and then frozen. It has turned
out to be extremely difficult to implement the protocols for TfR analysis in a replicable way in the
laboratory that we have developed in Yogyakarta. After extensive testing and after achieving satisfactory
replicability, we began analysis of the dry blood spots in mid 2003. Blood spots collected from all
respondents in the 16 month survey, which is when the intervention was coming to the end, are currently
being analyzed. (Spots that had been collected prior to then had deteriorated sufficiently that they cannot
be analyzed.) Results from analyses of blood spots from nearly 3,000 subjects age 30 through 70 have
been completed thus are are reported in the top panel of Table 4.
9There are two known transferrin receptors; we are measuring so-called Transferrin Receptor 1 and not the recently discovered Transferrin Receptor 2.
21
Since high TfR saturation levels indicate iron deficiency, TfR levels should be lower for
treatments relative to controls. They are. For both males and females, the difference in TfR between
treatments and controls is about -0.4, which is significant. The difference is larger for subjects who had
low Hb levels at baseline but even high Hb who received the treatment have lower TfR at the end of the
intervention. (The difference between high Hb treatmant and control females is not significant.)10
Effects on work capacity
Prior research involving randomized trials in laboratory settings has demonstrated that iron
supplementation results in elevated work capacity among iron deficient subjects. We have sought to
replicate this result with our subjects using a bicycle ergometer. Since the ergocycle needs to remain
stable, it cannot be taken to households. We randomly selected 100 male respondents age 30 through 70
from the WISE study sample and transported them to a physiology laboratory in Yogyakarta in October
2004, at the end of the intervention. At the laboratory, each respondent participated in a timed stationary
bicycle ergometer test in which the subject cycled until exhaustion up to a limit of 18 minutes with
weights increased every six minutes. Each subject was monitored by trained laboratory technicians with
blood pressure, pulse and EKG monitors. It is thus possible to measure work done (energy expended)
and, thereby, work capacity (V02max). The time cycled is reported for low Hb and high Hb treatments and
controls in the lower panel of Table 4. Whereas there are no difference for the high Hb subjects, the low
Hb treatments who received the supplements were able to cycle for 2.7 minutes longer than the controls
who received no supplement. We conclude that we have increased iron blood levels and work capacity
among the treatments who had low levels of Hb at baseline.
10The gap in TfR between treatments and controls is the same for males and females. Between the 8 and 16 month interviews, the difference in Hb levels of males who were treated, relative to controls did not change indicating that treated males were replete by the 8 month interview. This is consistent with the predictions of Ekstrom et al, (2003). (To be precise, the benefits of supplementation in terms of elevated Hb had been fully realised for males by the 8 month interview.) As suggested by Ekstrom et al, that is not true for females. Hb levels for treated females continued to rise and by the 16 month interview, the difference in difference between Hb at the end of the intervention and Hb pre-baseline for low Hb treatments at baseline, relative to similar controls, is the same for males and females. As an additional source of information on iron levels, venous blood was drawn from 450 respondents prior to the intervention and again a year later when the intervention was ending. Our plan is to use the venous blood to measure serum ferritin and total iron binding capacity.

22
Effects on other dimensions of health, economic and social prosperity
Detailed interviews are conducted with respondents every 4 months. The interviews include
detailed questions about consumption (that is purchases and consumption from own production) at the
household level, family farm businesses (including crops grown, input usage including family and non-
family labor, output, sales and profits as well as capital stock), non-farm businesses (in similar detail) and
wealth. All individuals are also interviewed. Adults are asked about earnings and labor supply; health
and health-seeking behaviors including psycho-social health; food intake, time allocation and transfers
with non-co-resident family and friends. In this paper, we focus on individual reports of labor and health
outcomes. Future work will examine other individual-specific outcomes as well as model the more
complicated interactions between family members that are likely to emerge with iron supplementation,
particularly since, in many households with members who are iron deficient, there are other members who
are not iron deficient.
Intent to treat effects on work and earnings
Table 5 presents estimates of intent to treat effects for labor outcomes of men and women.
Difference-in-difference estimates (of the change in each outcome for treatments between -08 and 04
month interviews, relative to the change in outcome for controls) are reported in the first column for
subjects whose Hb was low at pre-baseline. Difference-in-difference estimates for high Hb subjects are in
the second column: those effects are expected to be zero. The third column reports the difference between
the first two columns -- the difference-in-difference-in-difference estimates. If supplementation benefits
high Hb subjects, then the triple differences will understate the gains associated with supplementation.
The columns in the table parallel the last three columns of Table 3.
Among low Hb males, treatments are significantly more likely to be working at the time of the
survey. The effect is estimated to be 3.6% which is large since only 5% of low Hb males in this age
group were not working at the time of the pre-baseline survey. The effect for females is smaller, but since
high Hb females were less likely to be working in the 08 month wave, the difference-in-difference-in-
difference is significant: among treatments, around one-third of low Hb women who were not working at
pre-baseline had started working by the 8 month interview.

23
Relative to their income a year earlier, males and females who had low Hb at pre-baseline and
received the treatment earned significantly more income during the 4 months prior to the 08 month survey
than low Hb controls (at a 10% size of test). Panel 2 of the table reports the effect of supplementation on
the quartic root of earnings for the prior 4 month period.11 For males, the estimate implies that the income
of the treatments was about 20% higher than it would have been without supplementation, which
translates into an additional Rp 100,000 in earnings. (The median low Hb male in the study earned about
Rp 500,000 during the four months prior to baseline.) For females, the effect is substantially more muted
and translates into 6% higher earnings (<Rp 50,000).
As shown in panel 3, hours of work of low Hb subjects were not influenced by the treatment. 12
Thus, the impact on earnings operates primarily through higher hourly earnings and may be interpreted as
indicative of an increase in productivity (panels 4 and 5). A respondent who is paid a wage per unit time
is unlikely to reap the benefits of any productivity increase, at least in the short run. In the longer run, the
person's time wage may be increased or the person may move to a new job. In contrast, for those who are
self-employed there is greater scope for raising hourly earnings which should better reflect productivity.
Thus, if the benefits of the treatment are realized through productivity gains, they should be concentrated
among the self-employed.
Panels 6 and 7 of the table restrict attention to respondents whose primary job was self-employed
in both waves of the survey. (There was very little movement between sectors during the study period.)
Approximately half the males in the sample are self-employed. The estimated effect of the treatment on
both self-employment earnings and hourly self-employment earnings is about twice the magnitude of the
11Earnings for the last month are likely to be a noisy measure of resources in the study site. The majority of households are rural farmers for whom earnings are concentrated around harvest time. Rice is the dominant crop in the area and since there are three rice harvests per year, we have chosen to use income for the prior 4 months. The distribution of earnings is not symmetric and some subjects report non-positive earnings so that it is not possible to use a logarithmic transformation for earnings; a quartic root mimics the logarithmic function reasonably well for positive numbers. The table reports the effect of supplementation on the quartic root of the absolute value of earnings multiplied by sign(earnings).
12For each job, the respondent is asked to report hours of work in the average week in the last month and the number of weeks worked in the month. The questions are repeated for each of the last four months. Hours of work over the last month is the product of hours in the average week and the number of weeks worked, summed over all jobs. Aggregating over the last four months yields hours in the last four months. Estimates of effects of the treatment on hours worked in the last month on low Hb treatments are -0.5 hours for males and 0.8 hours for females.
24
effect on all earnings and significant (at 1% size of test). Thus, during the study period, a low Hb male
who was treated had a 40% increase in hourly earnings relative to a low Hb male control. This is a very
substantial impact. There was essentially no effect on time wage workers. For females, the estimated
effects for self-employment and time wages are the same and because only one-quarter of females are
self-employed, the standard errors are large and none of the estimates is significant.
Intent to treat effects on time allocation
Each respondent in the survey completed a 24 hour time allocation calendar based on recalling
activities during the previous day. Primary and secondary activities were listed for each 15 minute
interval. As shown in the first panel of Table 6, there is no evidence that time spent working was affected
by the treatment. This is consistent with the results for hours of work discussed above. However, low Hb
males who were in the treatment sample slept 20 minutes less than controls. They appear to have
substituted almost all of this time for leisure activities (although the effect of treatment on leisure time is
not significant).
The last panel of the table reports the effect of being assigned to the treatment on the number of
days in the last month that the respondent was unable to work because of health problems. Among low
Hb males, there was a significant decline of 0.8 lost work days.

25
Intent to treat effects on physical health
In Table 7, we turn to self-reported indicators of physical health status. We find no evidence of
any impact of the treatment on general health status. However, respondents were asked about a battery of
activities of daily living. As shown in the first panel, assignment to the treatment group results in a
significant reduction in the number of males who say they are unable to carry a heavy load. Since only
5% of low Hb males report difficulty carrying a heavy load, the estimated effect is very large and suggests
that the treatment enables men to undertake more physically arduous work.
Iron deficiency is associated with fatigue and lower energy efficiency. Low Hb males who were
assigned to the treatment are slightly more likely to report they had more energy than usual and 4% less
likely to report they had less energy than usual (with the latter being significant). Respondents are also
asked about a long battery of morbidities which include headaches, joint pain, fatigue, nausea and
dizziness. In spite of the fact that males reported having increased levels of energy, neither male nor
female treatments reported a change in feeling fatigued relative to the controls. Apparently, specific
questions asking respondents to compare energy levels at the time of the survey with levels in the past are
better able to capture change in energy than general questions about the incidence of fatigue. There is
evidence that, to some extent, male treatments and, to a large extent, female treatments reported
substantially lower incidence of dizzy spells (which afflict about one-third of the females in the study
population). The effect on females is significant.
Intent to treat effects on psycho-social health
If supplementation results in greater levels of energy and increased energy efficiency, thus
enabling a person to achieve more, it seems reasonable to suppose that iron deficiency will be associated
with improvements in psycho-social well-being. This hypothesis is explored in the final table.
Around one in six low-Hb males reported finding their normal tasks an effort at pre-baseline.
This proportion was reduced by about half among those assigned to the treatment indicating, again, that
energy levels have been elevated for this group. Recall, also, that the amount of time males spent sleeping
declined with the treatment. Low Hb males assigned to the treatment also report a 10% reduction in the
probability that he had difficulty sleeping. There is no evidence that women's energy levels have
improved as a result of the treatment although women assigned to the treatment report lower levels of

26
anxiety. Respondents were asked whether they agreed or disagreed with a series of statements about their
lives. One question asked the respondent whether he or she thinks much about the future. The final panel
in the table shows that assignment to the treatment group increases the probability a low-Hb male does not
think about the future. We interpret this as indicating these men are less worried about the future
presumably because they feel better from an economic, physical and psychological point of view.
5. Conclusions
WISE is a treatment-control design iron supplementation study that seeks to pin down the causal
effect of health on economic and social prosperity. The preliminary evidence presented here is based on
the first six months of the iron supplementation intervention. Supplementation has resulted in increases in
iron levels in the blood for older adults who were iron deficient prior to the supplementation. There are
clear economic benefits to low-Hb males who were assigned to the treatment group: they are more likely
to be working, they have higher hourly earnings and, since hours of work do not change, they have higher
monthly incomes. Hb males assigned to the treatment group also lose less work time due to illness, sleep
less and appear to spend more time on leisure activities, they are more energetic, more able to conduct
physically arduous activities and their psycho-social health is improved. While the effects on time
allocation and health status are observed for all low Hb males assigned to the treatment, the effects on
hourly earnings are concentrated almost exclusively among the self-employed. Time wage workers are
not likely to reap immediate benefits from elevated levels of energy and productivity in terms of higher
wages. While there is some evidence that low Hb females assigned to the treatment have higher earnings
and improved levels of health, the benefits to them of iron supplementation are more muted at this point in
the study. This may be because females need greater amounts of iron than males in order to be iron
replete. Overall, we conclude that there is unambiguous evidence nutritional status has a causal effect on
economic and psycho-social success.
Iron deficiency is an important nutritional deficiency. Whereas it is very rare in the developed
world (in part because iron fortified cereals are commonplace), iron deficient anemia is widespread in
many parts of the developing world. Prevalence is particularly high in those areas where rice is the main
staple (since rice retards iron absorption) and where animal protein is not an important component in the

27
diet (since iron from animal sources is better absorbed than from vegetable sources). While iron
supplementation through provision of tablets is standard practice throughout the world for pregnant
women and, in some places, for young children, it is not common for males to receive iron supplements.
Distribution of iron through tablets is likely to be an expensive means of reducing iron deficiency in many
low income settings. However, several recent studies have demonstrated that it is feasible to reduce iron
deficiency in populations at very low cost through simple iron-fortification technologies.
For example, in China, preliminary results from a study of iron-fortified soy sauce indicated
dramatic reductions in iron deficiency (from 50% to 10% in one year among young women). Iron-
fortified fish sauce has been tested in Vietnam where its introduction saw a 33% reduction in anemia
among women over the course of six months. Fortification of salt with both iodine and iron is currently
being tested in South Asia.
The cost of iron fortification is low: it is estimated that the marginal cost of fortifying fish sauce is
about US$6 per person per year. Recall that the earnings over 4 months of low Hb self-employed males
in WISE are predicted to rise by around Rp 100,000 which translates into nearly $40 over a year. Clearly,
for these people, fortification more than pays for itself. Taking into account the physical and psycho-
social health benefits of reduced iron deficiency tilts the balance more in favor of fortifying the food
sources. On the other side of the scale, however, is the fact that food fortification may be a blunt
instrument on two counts. First, around 20% of the Indonesian population is estimated to be iron
deficient; fortification of food for the entire population would cost five times as much as it would to
fortify foods consumed by only the iron deficient. Second, it may take an extended period of time for an
iron-deficient population to become replete because levels of iron in foods that are good candidates for
fortification, such as noodles, are relatively low (Yip, 1998).
Two key open questions remain. First, if the benefits of iron supplementation outweigh the
(negligible) costs, why do iron-deficient people not consume more iron-rich foods or take iron
supplements (which are available for free in health centers throughout Indonesia)? Second, as iron
deficiency is removed as a barrier to making socio-economic progress, are there other critical micro-
nutrients that become binding constraints for people to achieve their full potential?

28
References Asobayire, F.S., P. Adou, L. Davidsson, J. D. Cook, R. F. Hurrell. (2001). Prevalence of iron deficiency
with and without concurrent anemia in population groups with high prevalences of malaria and other infections: a study in Cote d'Ivoire, Am J Clin Nutr, 74(6):776-82
Basta, S. K. Soekirman, and N. Scrimshaw. (1979). "Iron deficiency anemia and productivity of adult males in Indonesia," American Journal of Clinical Nutrition, 32:916-25. Behrman, J., and A.. Deolalikar. (1988). �Health and nutrition,� in H. Chenery and T.N. Srinivasan (eds.)
Handbook of Development Economics, Vol. 1, Amsterdam: North Holland. Case, A., D. Lubotsky, C. Paxson. (2002). "Economic status and health in childhood: The origins of the
gradient", American Economic Review, 92.5: 1308-1334. Celsing, F., E. Blomstrand, B. Werner, P. Pihlstedt, and B. Ekblom. (1986). �Effects of iron deficiency
on endurance and muscle enzyme activity in man,� Med. Sci. Sports Exerc., 18:156-161. Cleveland, W. S. (1980). "Robust locally weighted regression and smoothing scatterplots," Journal of the
American Statistical Association, 74(368):829-36. Ekstrom, E., Z. Hyder, A. Chowdhury, S. Chowdhury, J.P. Habicht, B. Lonnerdal, L Persson. (2002).
"Efficacy and effectiveness of weekly and daily iron supplementation among pregnant women in rural Bangladesh", American Journal of Clinical Nutrition, 76.6:1392-400.
Edgerton, V., G. Gardner, Y. Ohira, K. Gunawardena, and B. Senewiratne. (1979). �Iron-deficiency
anemia and its effect on worker productivity and activity patterns,� British Medical Journal, 2: 1546-9.
Fishman, S.M., P. Christian, K.P. West. (2000). "The role of vitamins in the prevention and control of
anemia." Public Health Nutr, 3(2): 125-150. Fogel, R. (1992). "Second thoughts on the European escape from hunger: Famines, chronic malnutrition
and mortality rates," in S. R. Osmani (ed.), Nutrition and Poverty, World Institute for Development Economics Research Studies in Development Economics, New York: Clarendon Press, pp. 243-86.
Fogel, R. (1994). "Economic growth, population theory and physiology: The bearing of long-term
processes on the making of economic policy," American Economic Review 84(3):369-95. Frankenberg, E. and D. Thomas. (2002). "Health in a time of crisis", mimeo. Goldman, D. and J. P. Smith. (2002). "Can patient self-management help explain the SES health
gradient?", Proceedings of the National Academy of Sciences, 99:10929-34. Goldman, N. (2001). "Social inequalities in health: Disentangling the underlyng mechanisms", in
Weinstein, M., A. Hermalin and M. Stoto, (eds.), Population Health and Aging: Strengthening the dialogue between demography and epidemiology, New York: Annals of the New York Academy of Sciences.

29
Haas, J. E., and T. Brownlie IV. (2001). �Iron deficiency and reduced work capacity: A critical review of the research to determine a causal relationship,� J. Nutr. 131:676S-690S.
Leibenstein, Harvey. (1957). Economic backwardness and economic growth: Studies in the theory of
economic development, New York: Wiley & Sons. Li, R., X. Chen, H. Yan, P. Deurenberg, L. Garby, and J. Hautvast. (1994). �Functional consequences of
iron supplementation in iron-deficient female cotton workers in Beijing, China,� American Journal of Clinical Nutrition, 59:908-13.
Marmot M. G., C. D. Ryff, L. L. Bumpass, M. Shipley, N. F. Marks. (1997). Social Inequalities in Health-
A Major Public Health Problem. Social Science and Medicine 44:901-910. McDade T.W., B. Shell-Duncan. (2002). "Whole blood collected on filter paper provides a minimally
invasive method for assessing human transferrin receptor level", Journal of Nutrition, 132.12:3760-3.
Miech, R. A., and R. M. Hauser. (2001). "Socioeconomic Status (SES) and Health at midlife: A
comparison of educational attainment with occupation-based indicators." Annals of Epidemiology, 11:75-84.
Pitt, Mark M. and Rosenzweig, Mark R. (1986). "Agricultural prices, food consumption and the Health
and productivity of Indonesian farmers," in Inderjit Singh, Lyn Squire and John Strauss, (eds). Agricultural household models: Extensions, applications and policy", pp. 153-82, Baltimore Johns Hopkins Press.
Preston, S. (1975). The changing relation between mortality and the level of economic development",
Population Studies, 29:231-48. Ruger, J. P., D. T. Jamison and D. E. Bloom. (2001). "Health and the economy," in M. H. Merson, R. E.
Black, and A. J. Mills (eds.), International Public Health, Gaithersburg: Aspen, pp. 617-66.. Scrimshaw, N. (1991). �Iron deficiency,� Scientific American, October, 46-51. Smith, J. P. (1999). "Healthy bodies and thick wallets: The dual relation between health and economic
status," Journal of Economic Perspectives, 13(2):145-66. Steckel, R. (1995). "Stature and the Standard of Living," Journal of Economic Literature, 33(4):1903-40. Stillman, S. and D. Thomas. (2003). "The effect of economic crises on nutrition: Evidence from Russia",
mimeo, UCLA. Strauss, J., and D. Thomas. (1995). �Human resources: Empirical modeling of household and family
decisions,� in T. N. Srinivasan and J. Behrman (eds.), Handbook of Development Economics, Vol. 3, North Holland.
Strauss, J., and D. Thomas. (1998). "Health, nutrition and economic development," Journal of Economic
Literature, 36:766-817. Thomas, D. and E. Frankenberg. (2002). "Health, nutrition and economic prosperity: A microeconomic
perspective", Bulletin of the World Health Organization, 80:106-113.

30
Thomas, D., and J. Strauss. (1997). "Health and wages: Evidence on men and women in urban Brazil," Journal of Econometrics, 77:159-85.
Woodson, R. D., R. E. Wills, and C. Lenfant. (1978). �Effect of acute and established anemia on O2
transport at rest, submaximal and maximal work, J. Appl. Physiol. 44:36-43. World Bank. (1993). World Development Report 1993, Oxford: Oxford University Press. World Health Organization. (1999). World Health Report, 1999. Geneva: WHO. Yip, R. (1988). "Iron fortification: Prevention of iron deficient anemia for developing countries",
Proceedings from Forum on Iron Fortification, SUSTAIN Zhu, Y. I., and J. D. Haas. (1998). �Altered metabolic response of iron-depleted nonanemic women
during a 15-km time trial,� J. Appl. Physiol. 84:1768-75.
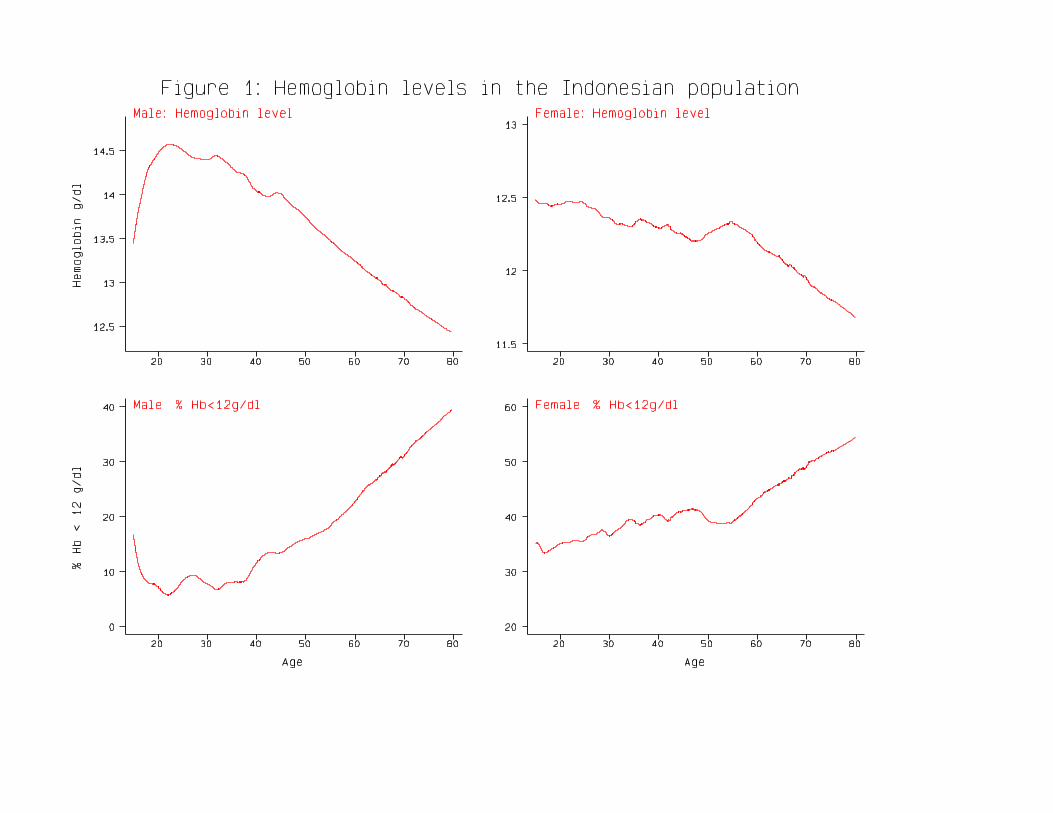
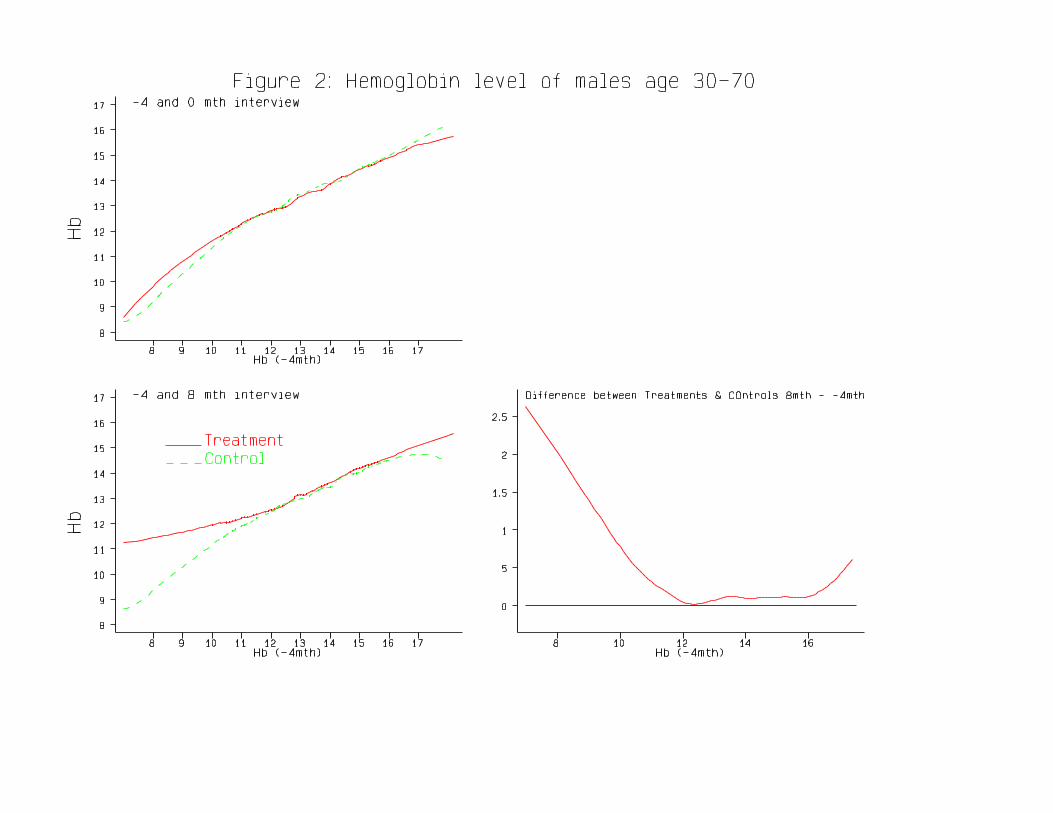

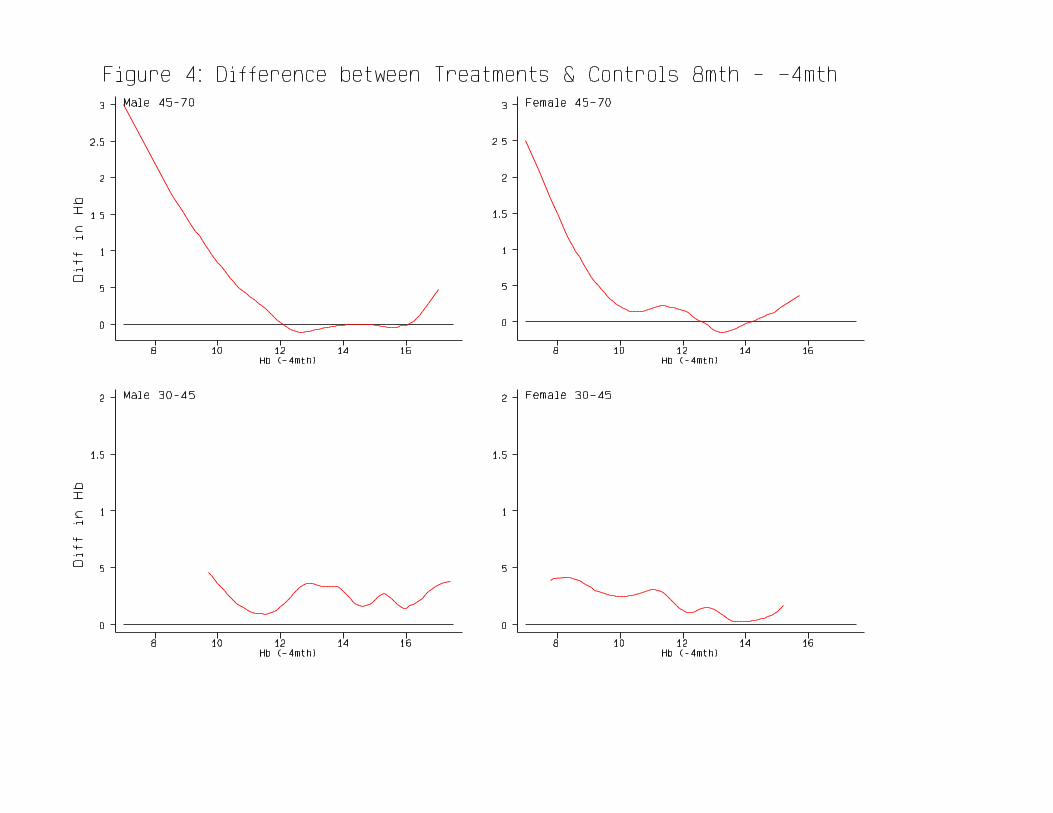
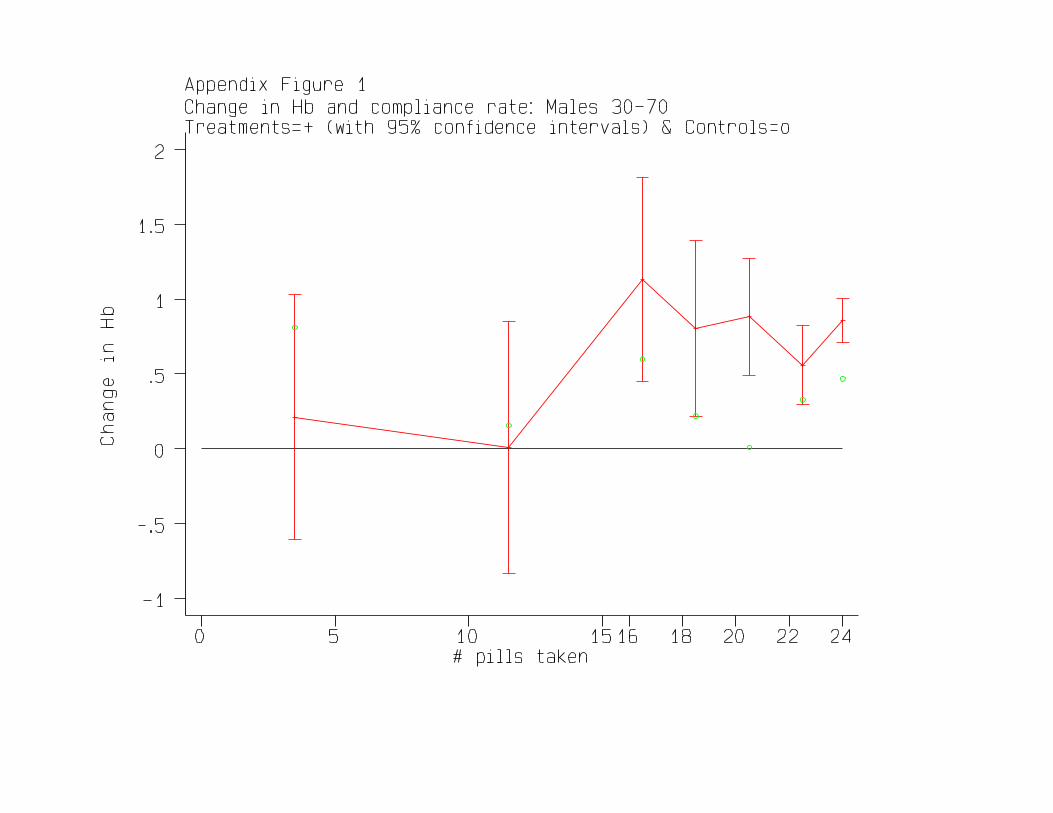
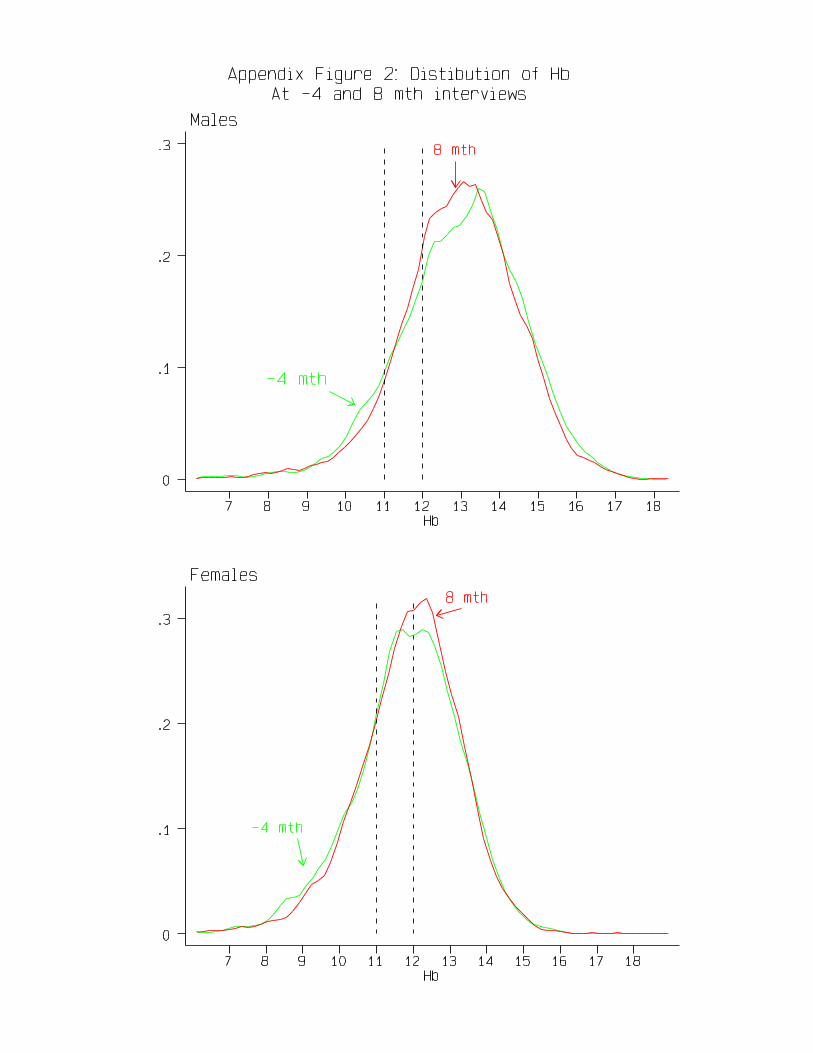
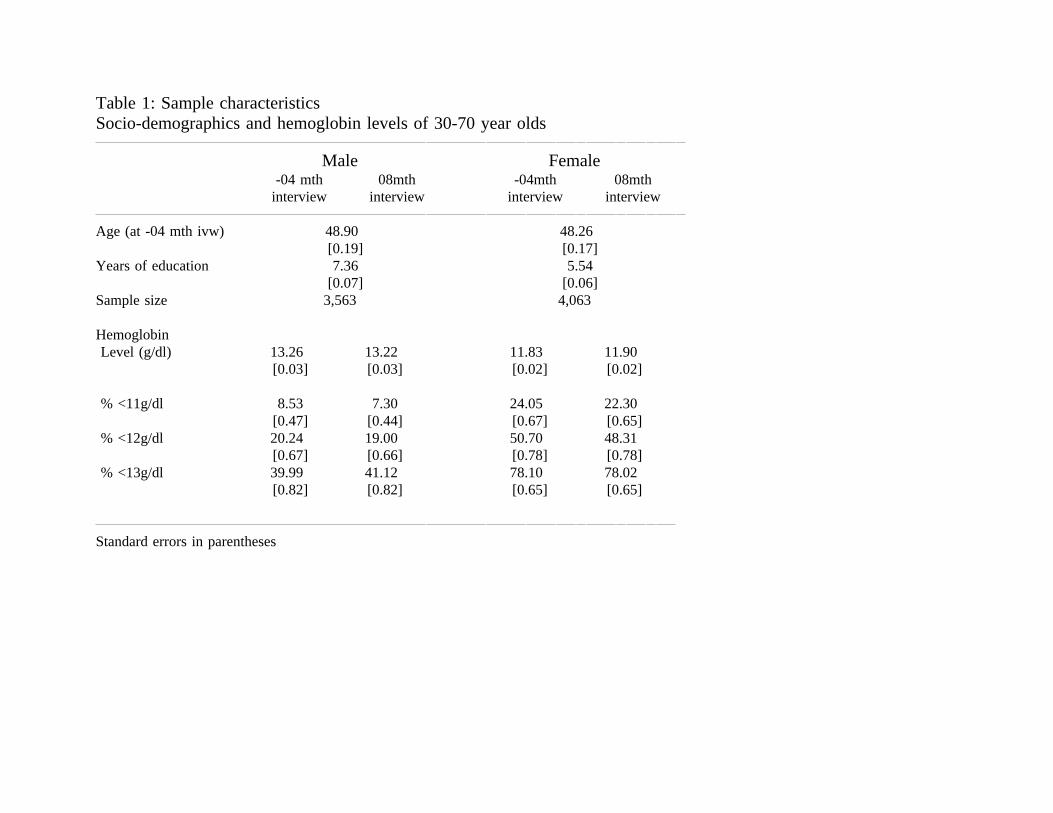
Table 1: Sample characteristicsSocio-demographics and hemoglobin levels of 30-70 year olds
Male Female-04 mth 08mth -04mth 08mth
interview interview interview interview
Age (at -04 mth ivw) 48.90 48.26[0.19] [0.17]
Years of education 7.36 5.54[0.07] [0.06]
Sample size 3,563 4,063
HemoglobinLevel (g/dl) 13.26 13.22 11.83 11.90
[0.03] [0.03] [0.02] [0.02]
% <11g/dl 8.53 7.30 24.05 22.30[0.47] [0.44] [0.67] [0.65]
% <12g/dl 20.24 19.00 50.70 48.31[0.67] [0.66] [0.78] [0.78]
% <13g/dl 39.99 41.12 78.10 78.02[0.82] [0.82] [0.65] [0.65]
Standard errors in parentheses
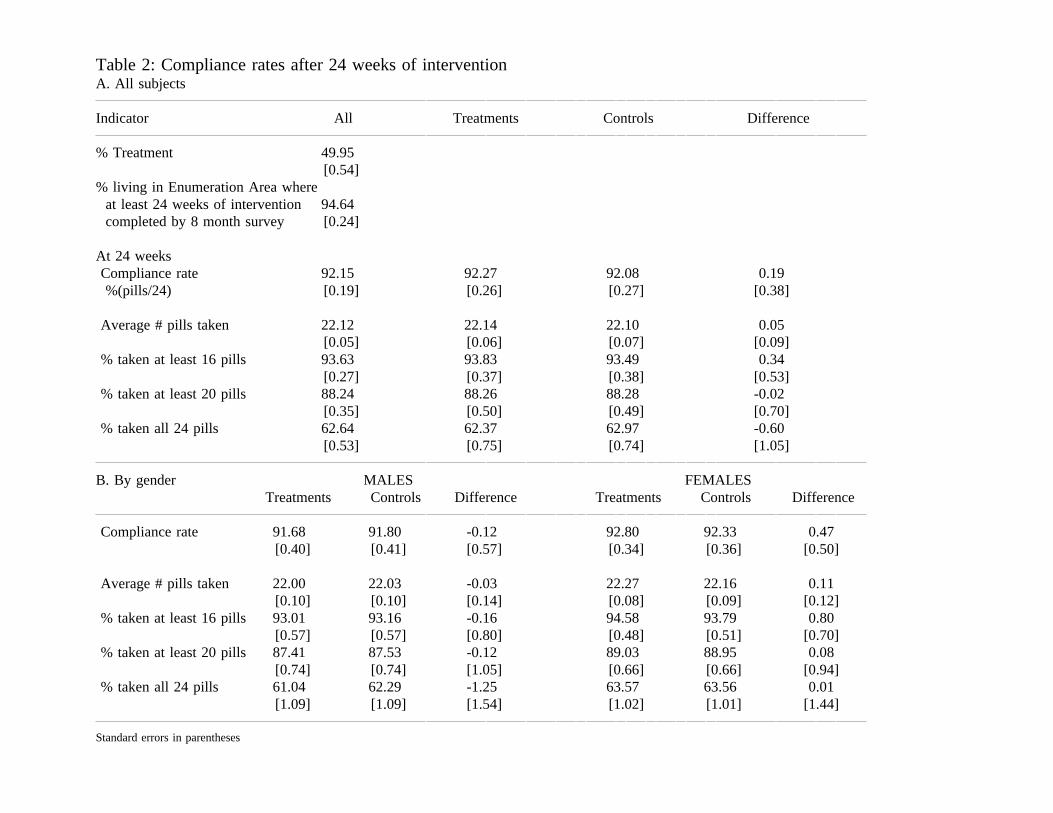
Table 2: Compliance rates after 24 weeks of interventionA. All subjects
Indicator All Treatments Controls Difference
% Treatment 49.95[0.54]
% living in Enumeration Area whereat least 24 weeks of intervention 94.64completed by 8 month survey [0.24]
At 24 weeksCompliance rate 92.15 92.27 92.08 0.19%(pills/24) [0.19] [0.26] [0.27] [0.38]
Average # pills taken 22.12 22.14 22.10 0.05[0.05] [0.06] [0.07] [0.09]
% taken at least 16 pills 93.63 93.83 93.49 0.34[0.27] [0.37] [0.38] [0.53]
% taken at least 20 pills 88.24 88.26 88.28 -0.02[0.35] [0.50] [0.49] [0.70]
% taken all 24 pills 62.64 62.37 62.97 -0.60[0.53] [0.75] [0.74] [1.05]
B. By gender MALES FEMALESTreatments Controls Difference Treatments Controls Difference
Compliance rate 91.68 91.80 -0.12 92.80 92.33 0.47[0.40] [0.41] [0.57] [0.34] [0.36] [0.50]
Average # pills taken 22.00 22.03 -0.03 22.27 22.16 0.11[0.10] [0.10] [0.14] [0.08] [0.09] [0.12]
% taken at least 16 pills 93.01 93.16 -0.16 94.58 93.79 0.80[0.57] [0.57] [0.80] [0.48] [0.51] [0.70]
% taken at least 20 pills 87.41 87.53 -0.12 89.03 88.95 0.08[0.74] [0.74] [1.05] [0.66] [0.66] [0.94]
% taken all 24 pills 61.04 62.29 -1.25 63.57 63.56 0.01[1.09] [1.09] [1.54] [1.02] [1.01] [1.44]
Standard errors in parentheses

Table 3Hemoglobin status: Intent to treat effects
Status at 8 mths -4 mths 8 - (-4)mths Low Hb High Hb Low-HighTreat Control Diff Diff Diff-in Adj Diff @baseline @baseline Hb@base
Indicator Sample -ment T-C T-C Diff -in-diff DinD DinD DinDinD(1) (2) (3) (4) (5) (6) (7) (8) (9)
Hemoglobin Male 13.250 13.127 0.123 -0.059 0.183 0.181 0.399 0.101 0.297[0.040] [0.040] [0.057] [0.059] [0.057] [0.057] [0.109] [0.064] [0.126]
Female 11.974 11.819 0.156 0.040 0.116 0.117 0.203 -0.022 0.225[0.033] [0.033] [0.046] [0.048] [0.048] [0.048] [0.057] [0.081] [0.099]
Hemoglobin <11g/dl Male 0.069 0.078 -0.009 0.009 -0.017 -0.017 -0.066 0.000 -0.066[0.006] [0.006] [0.009] [0.010] [0.011] [0.011] [0.021] [0.012] [0.024]
Female 0.195 0.249 -0.054 -0.012 -0.041 -0.041 -0.072 0.017 -0.089[0.009] [0.009] [0.013] [0.014] [0.016] [0.016] [0.019] [0.027] [0.033]
Hemoglobin <12g/dl Male 0.179 0.206 -0.027 -0.004 -0.023 -0.023 -0.046 -0.013 -0.033[0.009] [0.009] [0.013] [0.014] [0.015] [0.015] [0.030] [0.017] [0.034]
Female 0.461 0.499 -0.038 -0.024 -0.014 -0.014 -0.036 0.020 -0.056[0.011] [0.011] [0.016] [0.016] [0.019] [0.019] [0.022] [0.032] [0.039]
Sample size Male 1,804 1,759 3,563 3,563 3,563 3,563 899 2,664 3,563Female 2,021 2,042 4,063 4,063 4,063 4,063 2,710 1,353 4,063
Notes: Standard errors in parentheses. (3)=(2)-(1); (5)=(4)-(3); (6) adjusts for age (10 year splines); (9)=(8)-(7); Low Hb is Hb<12.5g/dl at baseline; High Hb is Hb>12.5g/dl at baseline)
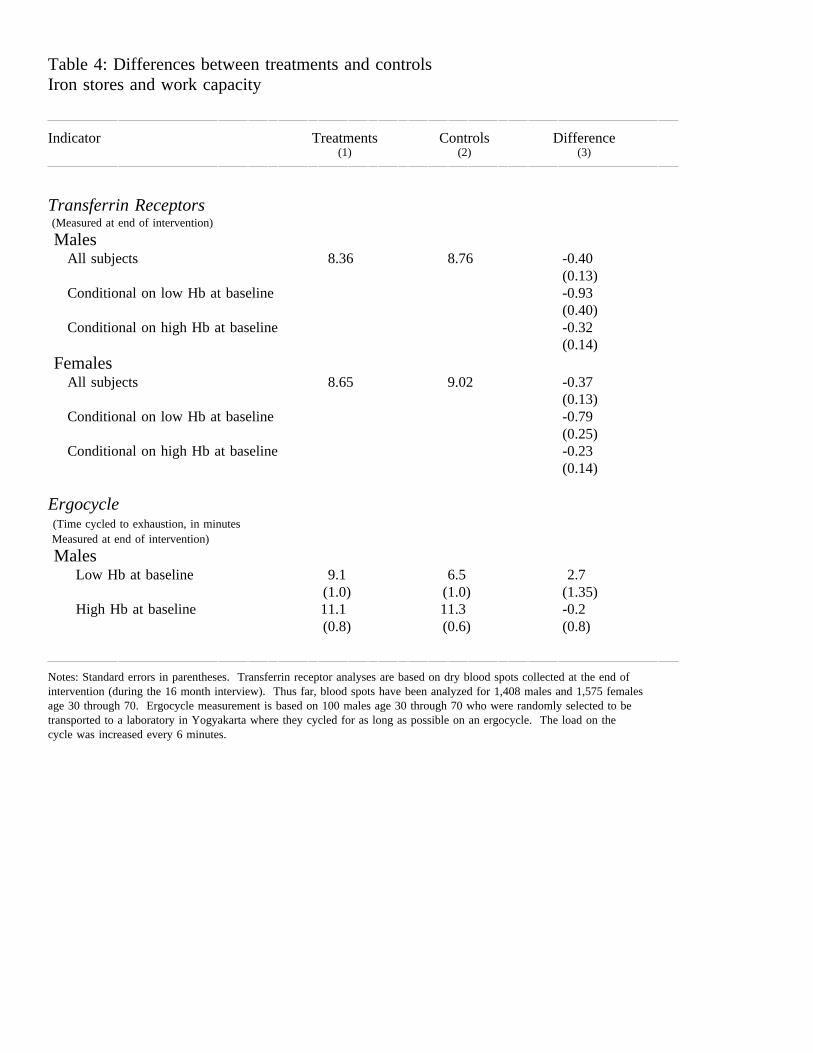
Table 4: Differences between treatments and controlsIron stores and work capacity
Indicator Treatments Controls Difference(1) (2) (3)
Transferrin Receptors(Measured at end of intervention)
MalesAll subjects 8.36 8.76 -0.40
(0.13)Conditional on low Hb at baseline -0.93
(0.40)Conditional on high Hb at baseline -0.32
(0.14)Females
All subjects 8.65 9.02 -0.37(0.13)
Conditional on low Hb at baseline -0.79(0.25)
Conditional on high Hb at baseline -0.23(0.14)
Ergocycle(Time cycled to exhaustion, in minutesMeasured at end of intervention)
MalesLow Hb at baseline 9.1 6.5 2.7
(1.0) (1.0) (1.35)High Hb at baseline 11.1 11.3 -0.2
(0.8) (0.6) (0.8)
Notes: Standard errors in parentheses. Transferrin receptor analyses are based on dry blood spots collected at the end ofintervention (during the 16 month interview). Thus far, blood spots have been analyzed for 1,408 males and 1,575 femalesage 30 through 70. Ergocycle measurement is based on 100 males age 30 through 70 who were randomly selected to betransported to a laboratory in Yogyakarta where they cycled for as long as possible on an ergocycle. The load on thecycle was increased every 6 minutes.

Table 5: Intent to treat effects on subjects stratified by Hb status at baselineWork, earnings and hours of work
Change in Treatments - Change in ControlsIf low Hb If high Hb Low-High Hb@baseline @baseline @baseline
Indicator Sample DinD DinD DinDinD(1) (2) (3)
1. Pr(not working in month Male -0.036 -0.003 -0.033of survey interview) [0.012] [0.007] [0.014]
Female -0.020 0.029 -0.049[0.014] [0.020] [0.024]
2. 4√Earnings (Rp 000) Male 0.576 -0.012 0.582(last 4 months) [0.299] [0.173] [0.346]
Female 0.163 0.033 0.130[0.091] [0.127] [0.156]
3. Hours spent working Male -12.968 -44.185 31.217(last 4 months) [36.368] [21.027] [42.013]
Female 9.644 30.137 -20.493[15.264] [21.425] [26.309]
4. 4√Hrly earnings (Rp 000) Male 0.126 0.007 0.119(last 4 months) [0.066] [0.038] [0.076]
Female 0.034 -0.009 0.043[0.025] [0.035] [0.043]
5. 4√Hrly earnings (Rp 000) Male 0.113 -0.006 0.119conditional on being non zero [0.069] [0.040] [0.080](last 4 months) Female 0.056 -0.021 0.077
[0.026] [0.037] [0.046]
6. 4√Earnings (Rp 000) Male 1.091 -0.386 1.477if self-employed [0.445] [0.285] [0.528](last 4 months) Female 0.177 0.101 0.076
[0.214] [0.305] [0.373]
7. 4√Hrly earnings (Rp 000) Male 0.230 -0.078 0.308if self-employed [0.093] [0.059] [0.110](last 4 months) Female 0.031 -0.036 0.067
[0.052] [0.074] [0.090]
Notes: Standard errors in parentheses. Columns 1, 2 and 3 in this table correspond with Table 3 columns 7, 8 and 9, respectively.See Table 3 for sample sizes for all rows 1 through 3. Estimates in row 4 are based on 3,350 males and 2,999 females;3,102 males and 1,878 females in row 5 and 1,835 males and 746 females in rows 6 and 7.

Table 6: Intent to treat effects on subjects stratified by Hb status at baselineTime allocation
Change in Treatments - Change in ControlsIf low Hb If high Hb Low-High Hb@baseline @baseline @baseline
Indicator Sample DinD DinD DinDinD(1) (2) (3)
During prior day, number of hours spent on
1. Work Male 0.076 -0.083 0.159[0.265] [0.155] [0.307]
Female 0.087 -0.112 0.199[0.151] [0.214] [0.261]
2. Sleep Male -0.343 -0.026 -0.317[0.165] [0.096] [0.191]
Female 0.059 0.231 -0.172[0.079] [0.111] [0.136]
3. Leisure activities Male 0.280 0.042 0.238[0.296] [0.173] [0.342]
Female -0.095 0.145 -0.241[0.168] [0.238] [0.291]
4. Housework Male 0.068 0.021 0.047[0.174] [0.101] [0.201]
Female -0.236 0.151 -0.387[0.161] [0.227] [0.278]
5. Family care Male -0.001 0.012 -0.013[0.107] [0.062] [0.124]
Female -0.080 0.045 -0.125[0.106] [0.150] [0.184]
6. Number of days work lost Male -0.818 0.061 -0.879(in last month) [0.382] [0.223] [0.443]
Female -0.110 -0.163 0.053[0.217] [0.306] [0.375]
Notes: Standard errors in parentheses. See Table 3 for sample sizes.

Table 7: Intent to treat effects on subjects stratified by Hb status at baselinePhysical health: Intent to treat effects
Change in Treatments - Change in ControlsIf low Hb If high Hb Low-High Hb@baseline @baseline @baseline
Indicator Sample DinD DinD DinDinD(1) (2) (3)
1. Pr(Unable carry heavy load) Male -0.032 0.002 -0.034self reported [0.015] [0.008] [0.017]
Female -0.008 -0.018 0.009[0.014] [0.019] [0.023]
2. Pr(Has more energy) Male 0.026 0.001 0.025self reported [0.021] [0.013] [0.025]
Female 0.011 -0.008 0.019[0.012] [0.017] [0.020]
3. Pr(Has less energy) Male -0.032 0.010 -0.041self reported [0.012] [0.007] [0.014]
Female 0.009 -0.009 0.017[0.008] [0.011] [0.014]
4. Pr(Felt fatigued) Male -0.040 -0.050 0.010(in last month) [0.043] [0.025] [0.049]
Female -0.007 -0.013 0.006[0.025] [0.036] [0.044]
5. Pr(Felt dizzy) Male -0.043 -0.023 -0.020(in last month) [0.037] [0.022] [0.043]
Female -0.056 0.016 -0.072[0.024] [0.033] [0.041]
Notes: Standard errors in parentheses; see Table 3 for sample sizes.
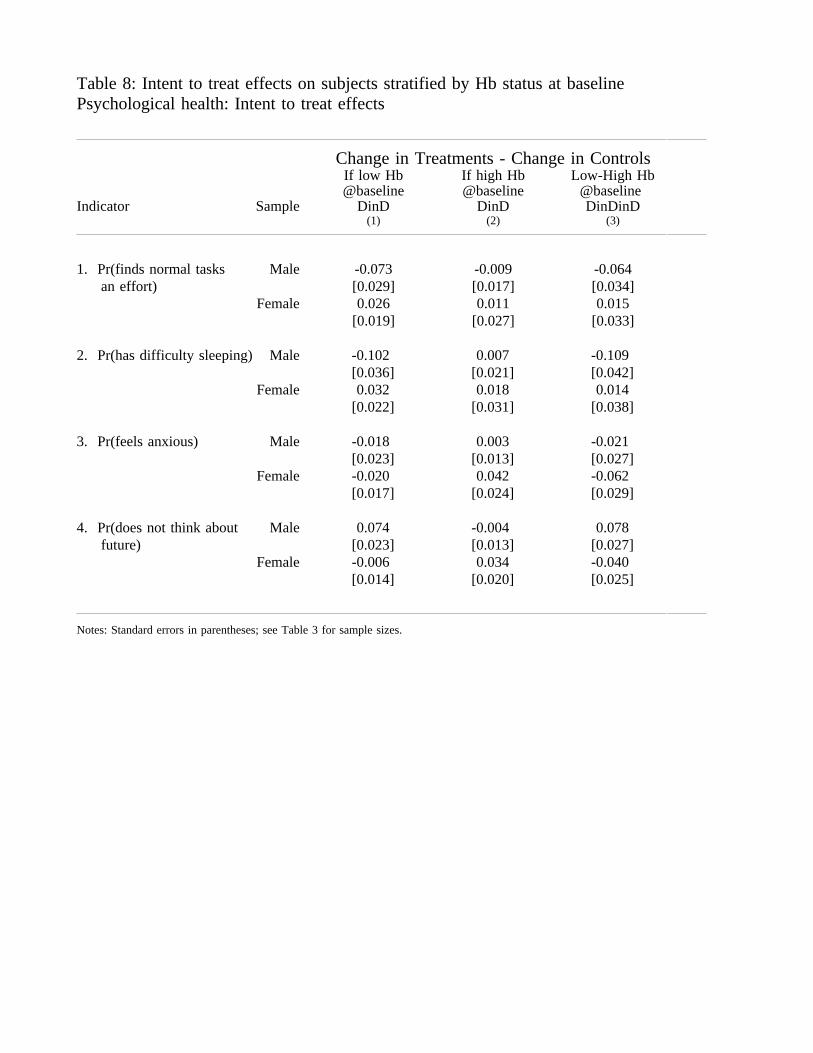
Table 8: Intent to treat effects on subjects stratified by Hb status at baselinePsychological health: Intent to treat effects
Change in Treatments - Change in ControlsIf low Hb If high Hb Low-High Hb@baseline @baseline @baseline
Indicator Sample DinD DinD DinDinD(1) (2) (3)
1. Pr(finds normal tasks Male -0.073 -0.009 -0.064an effort) [0.029] [0.017] [0.034]
Female 0.026 0.011 0.015[0.019] [0.027] [0.033]
2. Pr(has difficulty sleeping) Male -0.102 0.007 -0.109[0.036] [0.021] [0.042]
Female 0.032 0.018 0.014[0.022] [0.031] [0.038]
3. Pr(feels anxious) Male -0.018 0.003 -0.021[0.023] [0.013] [0.027]
Female -0.020 0.042 -0.062[0.017] [0.024] [0.029]
4. Pr(does not think about Male 0.074 -0.004 0.078future) [0.023] [0.013] [0.027]
Female -0.006 0.034 -0.040[0.014] [0.020] [0.025]
Notes: Standard errors in parentheses; see Table 3 for sample sizes.

Appendix Table 1: WISE schedule
Date Surveys Intervention
2001 September ScreenerOctober (-8 mth)
NovemberDecember
2002 January PrebaselineFebruary (-4 mth)
MarchApril
May BaselineJune (0 mth)July
August Fe supplementation
September 1st during intervenOctober (4 mth) Albendazole
NovemberDecember
2003 January 2nd during intervenFebruary (8 mth)
March AlbendazoleApril
May 3rd during intervenJune (12 mth)July
August
September 1st post intervenOctober (16 mth)
NovemberDecember
2004 January 2nd post intervenFebruary (20 mth)
MarchApril
May 3rd post intervenJune (24 mth)July
August

Appendix Table 2: WISE attrition rates from the surveyBetween -04 month and +08 month interview
Number of %subjects attrited
Overall survey attrition
All respondents interviewed at -04 mth interview 18,026
Respondents still alive at 8 mth interview 17,828# respondents interviewed at 8 mth ivw 17,441 3.25%
Subjects age 30-70 interviewed at -04 mth ivw 8,806
30-70 year olds still alive at 8 mth ivw 8,720# 30-70 year olds ivwd at 8 mth ivw 8,547 1.98%
Survey attrition rates for male and female treatments and controls
Male subjects age 30-70 2.24%
Treatments 2.07%Controls 2.42%
Difference 0.35%(standard error) (0.46%)
Female subjects age 30-70 1.75%
Treatments 1.70%Controls 1.78%
Difference 0.08%(standard error) (0.39%)

Appendix Table 3: Relationship between attrition and characteristics of subjects at baselineAdults age 30-70
Males FemalesTreat Adjusted Main Inter Treat Adjusted Main Inter-ment effect -action -ment effect -action
(1) (2) (3) (4) (1) (2) (3) (4)
(1) if treatment -0.45 -0.67 -4.43 -0.16 -0.45 -1.82[0.51] [0.41] [3.04] [0.47] [0.35] [2.64]
(1) if 11<=Hb<12 g/dl 0.91 0.92 -0.07 -0.37 -0.14 -0.48[0.64] [1.10] [1.27] [0.46] [0.67] [0.80]
(1) if 12<=Hb<13 g/dl 0.21 0.49 -0.58 -0.41 -0.31 -0.20[0.40] [0.82] [0.82] [0.43] [0.70] [0.88]
(1) if 13<=Hb<14 g/dl 0.79 0.68 0.19 -0.51 -0.93 0.76[0.48] [0.89] [0.99] [0.53] [0.64] [0.81]
(1) if 14<=Hb<15 g/dl 0.97 1.56 -1.26 -0.42 0.42 -1.64[0.53] [1.00] [1.12] [0.76] [1.48] [1.52]
(1) if 15<=Hb<13 g/dl 1.64 0.15 2.91 -1.34 -1.41 0.33[0.57] [0.77] [1.24] [0.43] [0.61] [0.78]
Age (in years) -0.03 -0.06 -0.06 -0.05 -0.06 -0.06[0.02] [0.03] [0.03] [0.02] [0.03] [0.03]
(1) if 0-6 yrs of educ -0.95 -1.70 1.56 -0.65 -1.01 0.75[0.70] [1.21] [1.44] [0.41] [0.76] [0.88]
(1) if 7-18 yrs of educ -0.61 -1.43 1.68 0.14 -0.28 0.86[0.79] [1.33] [1.65] [0.62] [1.05] [1.27]
Constant 2.42 3.32 5.24 1.79 4.20 4.86 4.86[0.98] [1.38] [1.96] [0.90] [1.26] [1.80]
R2 0.00 0.01 0.01 0.00 0.01 0.01F(all covariates) 0.77 3.42 3.11 0.12 2.78 1.97(p value) (0.38) (0.01) (0.01) (0.73) (0.01) (0.02)
F(treatment effects) 1.79 0.75(p value) (0.08) (0.67)
Notes: Dependent variable is (100) if subject interviewed at -04 months but not interviewed at +04 months. [Standard errors] below coefficient estimates. Columns 3 and 4 presents results from oneregression with main effects (column 3) and all covariates interacted with treatment effect (column 4). Covariates are categorical. Excluded categories are Hb<11g/dl; age>60; education=0 years.

Appendix Table 4A: Indicators of well-being of males age 30-70
All males Low hemoglobin at baseline-4mth 8mth -4 mth 8 mthivw ivw Treatment Control Treatment Control
Pr(not working) 3.70 4.32 4.16 5.43 3.95 7.92[0.32] [0.34] [0.93] [1.08] [0.91] [1.29]
Earnings (Rp000) 1498.73 1412.55 946.54 967.25 936.20 791.17(Last 4 mths) [130.81] [53.25] [107.31] [76.07] [157.10] [93.32]
Hourly earnings (Rp000) 2.06 2.07 1.66 1.44 1.76 1.33(Last 4 mths) [0.15] [0.08] [0.20] [0.12] [0.30] [0.22]
Hours worked 744.07 695.26 687.05 686.31 604.77 631.47(Last 4 mths) [7.11] [7.13] [18.83] [19.70] [17.68] [19.69]
Prior 24 hours, time spent onWork 5.89 5.58 5.82 5.66 5.50 5.27
[0.06] [0.06] [0.17] [0.16] [0.15] [0.16]Sleep 7.40 7.36 7.66 7.50 7.40 7.60
[0.03] [0.03] [0.10] [0.09] [0.09] [0.10]Leisure 9.08 9.62 8.98 9.29 .74 9.74
[0.06] [0.06] [0.16] [0.17] [0.17] [0.16]Housework 1.39 1.29 1.37 1.26 1.35 1.20
[0.04] [0.03] [0.09] [0.09] [0.11] [0.09]Family care 0.41 0.35 0.36 0.26 0.32 0.24
[0.02] [0.02] [0.06] [0.05] [0.08] [0.06]Days work lost (in last mth) 1.42 1.64 1.95 1.60 172.59 220.14
[0.07] [0.08] [0.22] [0.21] [21.30] [27.06]
% have less energy 2.13 1.46 3.06 1.36 1.75 2.94[0.24] [0.20] [0.81] [0.55] [0.62] [0.80]
% unable carry heavy load 3.26 3.48 5.03 4.75 4.17 7.01[0.30] [0.31] [1.02] [1.01] [0.94] [1.22]
% have headache 21.87 20.86 24.73 25.11 21.71 22.40[0.69] [0.68] [2.02] [2.07] [1.93] [1.99]
% feel fatigue 44.50 34.29 49.02 44.34 35.31 35.52[0.83] [0.80] [2.34] [2.37] [2.24] [2.28]
% have dizzy spells 28.78 25.47 32.60 29.41 26.75 28.05[0.76] [0.73] [2.20] [2.17] [2.08] [2.14]
% have difficulty sleeping 25.96 24.85 32.89 24.89 24.33 26.57[0.74] [0.73] [2.21] [2.07] [2.03] [2.14]
% feel anxious 6.57 8.12 5.96 6.85 6.03 9.56[0.43] [0.46] [1.11] [1.21] [1.13] [1.42]
% normal tasks an effort 12.09 11.37 16.56 13.93 10.04 14.69[0.56] [0.54] [1.75] [1.66] [1.42] [1.71]
% not think about future 10.30 4.83 10.94 16.97 7.22 5.43[0.51] [0.36] [1.46] [1.79] [1.21] [1.08]
Notes: Standard errors in parentheses. See Tables 3 and 4 for sample sizes.

Appendix Table 4B: Indicators of well-being of females age 30-70
All females Low hemoglobin at baseline-4mth 8mth -4 mth 8 mthivw ivw Treatment Control Treatment Control
Pr(not working) 17.06 18.85 17.54 16.21 17.99 19.20[0.59] [0.61] [1.04] [0.99] [1.05] [1.06]
Earnings (Rp000) 582.77 595.59 518.57 607.09 569.37 556.53(Last 4 mths) [32.35] [23.91] [37.55] [43.67] [44.69] [35.44]
Hourly earnings (Rp000) 1.23 1.35 1.03 1.35 1.46 1.38(Last 4 mths) [0.08] [0.08] [0.08] [0.20] [0.18] [0.13]
Hours worked 491.18 440.87 479.27 495.35 432.44 438.68(Last 4 mths) [7.56] [7.10] [12.68] [13.14] [12.11] [12.37]
Prior 24 hours, time spent onWork 3.55 3.39 3.52 3.66 3.30 3.34
[0.06] [0.06] [0.10] [0.11] [0.10] [0.10]Sleep 7.67 7.79 7.65 7.69 7.75 7.73
[0.03] [0.03] [0.04] [0.04] [0.04] [0.04]Leisure 8.08 8.62 8.04 7.95 8.65 8.68
[0.06] [0.06] [0.10] [0.10] [0.10] [0.10]Housework 5.82 5.07 5.98 5.74 5.17 5.16
[0.06] [0.06] [0.11] [0.11] [0.10] [0.10]Family care 1.44 1.06 1.57 1.37 1.23 1.13
[0.05] [0.04] [0.08] [0.08] [0.08] [0.07]Days work lost (last mth) 154.96 144.90 158.85 166.86 142.28 170.19
[6.76] [6.29] [11.78] [12.30] [10.33] [12.11]
% have less energy 2.04 2.39 2.02 2.47 2.62 2.76[0.22] [0.24] [0.39] [0.42] [0.44] [0.44]
% unable carry heavy load 10.63 7.19 10.72 11.05 6.52 7.49[0.48] [0.41] [0.85] [0.85] [0.68] [0.71]
% have headache 30.77 28.29 32.41 30.89 28.34 29.89[0.72] [0.71] [1.28] [1.25] [1.23] [1.23]
% feel fatigue 52.14 39.33 52.96 54.72 39.06 41.53[0.78] [0.77] [1.37] [1.34] [1.34] [1.33]
% have dizzy spells 41.83 34.77 43.74 41.21 33.96 36.95[0.77] [0.75] [1.36] [1.33] [1.30] [1.30]
% have difficulty sleeping 33.27 31.45 32.28 37.08 33.16 35.04[0.75] [0.73] [1.31] [1.33] [1.29] [1.29]
% feel anxious 11.29 14.45 11.46 11.09 14.43 15.99[0.50] [0.56] [0.88] [0.85] [1.00] [0.99]
% find normal tasks an effort 15.40 16.76 14.33 16.72 16.99 17.01[0.57] [0.60] [0.96] [1.01] [1.07] [1.02]
% do not think about future 9.89 6.42 9.67 9.96 5.55 6.69[0.47] [0.38] [0.81] [0.81] [0.63] [0.67]
Notes: Standard errors in parentheses. See Tables 3 and 4 for sample sizes.