cathodoluminescence spectral study of alkali feldspar and plagioclase in yamato martian nakhlite...
TRANSCRIPT

Cathodoluminescence spectral study of
alkali feldspar and plagioclase in Yamato
Martian nakhlite meteorites
M. Kayama1, A. Gucsik2, N. Matsuda3, H. Nishido1 and K. Ninagawa4
1Okayama Unversity of Science, RINS, Okayama, Japan
2Max Planck Institute for Chemistry, Mainz, Germany
3Okayama Unversity of Science, ISEI, Tottori, Japan
4Okayama Unversity of Science, Dept. of Applied Physics, Okayama, Japan
NIPR, Tokyo, 07 June 2007

Introduction
1. Detection and Observation of structural defects and impurity trace elements
2. Suggestion about crystal fields responsible for a structural configuration,
which is altered by shock metamorphism
evaluation of shock event in Y000749
CL measurement allows
CL characterization of feldspar minerals in Y000749
and
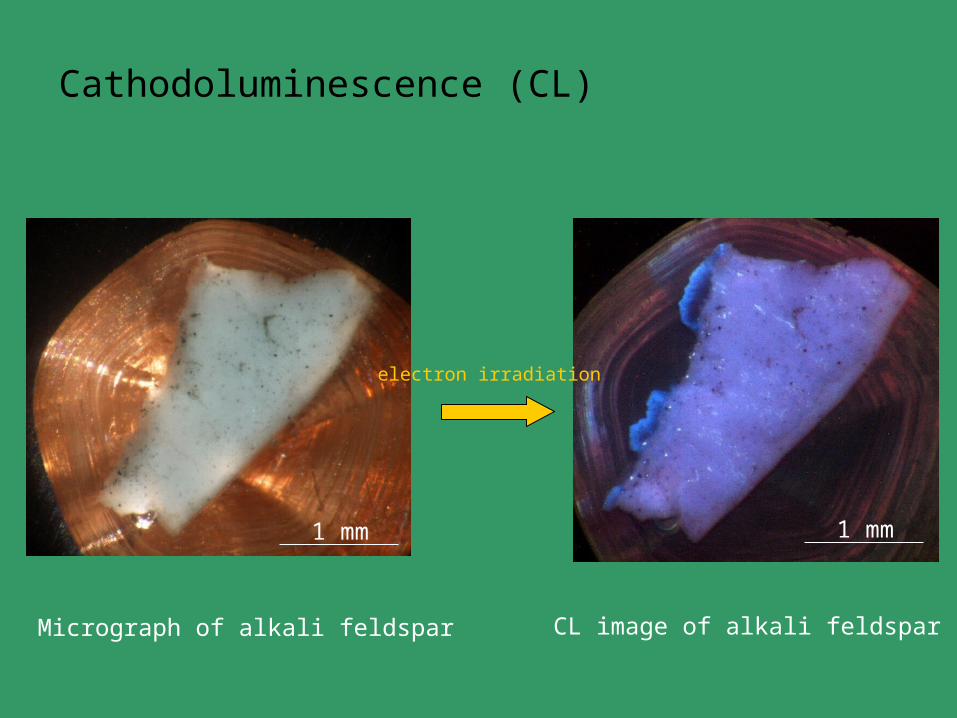
Cathodoluminescence (CL)
electron irradiation
Micrograph of alkali feldspar
1 mm 1 mm
CL image of alkali feldspar

Götze, 1998

Götze, 1998

CL spectral measurements were performed on natural and experimentally shocked oligoclases (An19.7 single crystal shocked between 10.5 GPa and 45 GPa) and plagioclases from the equilibrated ordinary chondrites (Dar al Gani, Tenham) (Kaus and Bischoff, 2000).

In a pioneering study, Sippel and Spencer (1970) observed that the shock metamorphism caused peak shifts from green peak toward the red peak, peak broadening and decrease of luminescence intensity than in the undamaged counterpart in the CL spectra of shock-metamorphosed lunar feldspars. They noted that the distortions or disorder in the crystal field results in crystal field perturbations and these local variations occur broadened distribution of excited state energies due to shock metamorphism.
Terrestrial plagioclase (An85)
Plagioclase from lunar crystalline rocks
Plagioclase from lunar breccia
Maskelynite

Literature Review:
[1] Götze et al., (2000) in: M. Pagel, V.Barbin, P. Blanc, D. Ohnenstetter (Eds.) Cathodoluminescence in Geosciences, Springer, 245-270;
[2] Petrov (1994) Amer. Miner. 79, 221-239;
[3] Marshall (1988), Unwin Hyman, Boston. 146 pp;
[4] Hayward (1998), in: L.J. Cabri, D.J. Vaughan (Eds.) Modern Approaches to Ore and Environmental Mineralogy, Mineralogical Association of Canada Short Course Series, 27, pp. 269-325;
[5] Götze et al., (1999) Amer. Miner. 84, 1027-1032;
[6] Sippel and Spencer (1970), Proc. Apollo 11 Lunar Sci.Conf. 3, 2413-2426;
[7] Ramseyer et al., (1992), Tectonophysics 216, 195-204;
[8] Kaus and Bischoff (2000), Meteoritics Planet. Sci. 35 A 86;
[9] Boggs et al., (2001) Meteoritics Planet. Sci. 36, 783-793.

#1 Measurement
#2 Measurement

A schematic figure showing relationships between crystal field strength [Dq], distance of O-Mn [a], and CL emission [λ] as a function
of the increasing shock pressure [P]

Meteorite
Micrograph of Y000749 CL image of Y000749
Nakhlite
Y000749 (Sub. No. 1-5)
minerals in mesostasis : alkali feldspar, plagioclase and silica minerals

Alkali feldspar and plagioclase
Alkali feldspar (Or80)
Plagioclase (Ab70)
no transformation to maskelynite
BSE image of alkali feldspar BSE image of plagioclase
AFPL
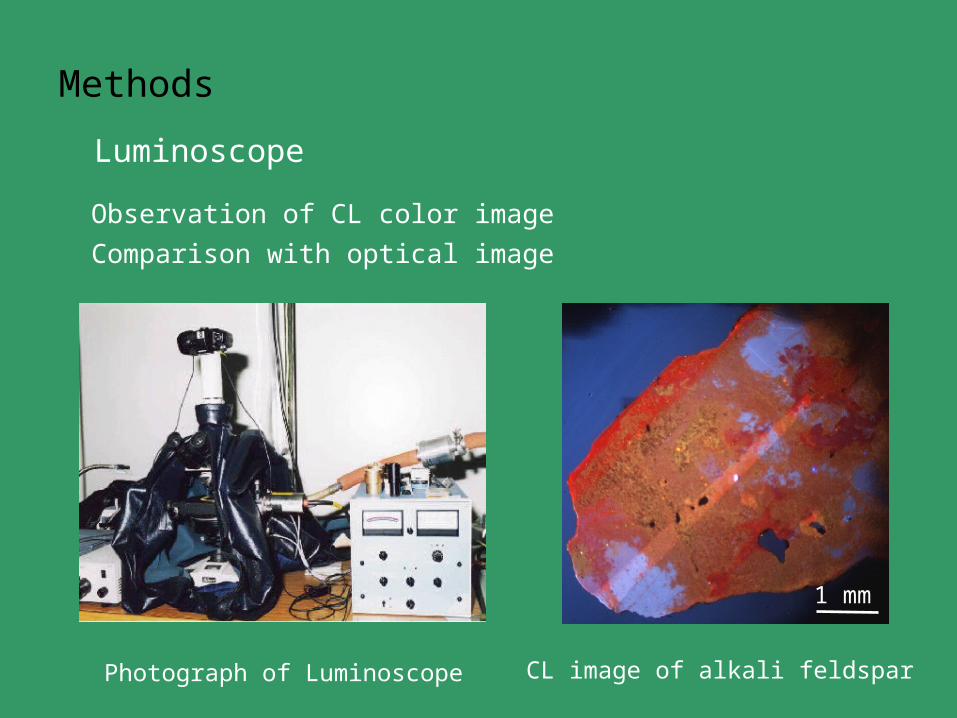
Methods
Luminoscope
Photograph of Luminoscope
1 mm
CL image of alkali feldspar
Observation of CL color image
Comparison with optical image

Methods
Photograph of SEM-CL Schematic diagram of SEM-CL
SEM-CL
Measurement of CL spectra
Observation of CL image with SEM and BSE image
Accelerating voltage: 15 kV
Beam current: 1.0 nA

CL images of alkali feldspar and plagioclase
B C
AFigure
(A) CL color images
of mesostasis
(B) CL image of
alkali feldspar
(C) CL image of
plagioclase
AF
PL

CL spectra of alkali feldspar
CL spectra of alkali feldspar
Peak position
Blue spectral peak
Terrestrial Y000749
400 nm 420 nm
Red spectral peak
Terrestrial Y000749
710 nm 755 nm

CL spectra of plagioclase
CL spectra of plagioclase

CL spectra of plagioclase
CL spectra of plagioclase

CL spectra of plagioclase
Peak position
Yellow spectral peak
Terrestrial Y000749
560 nm 575 nm
Red spectral peak
Terrestrial Y000749
750 nm 780 nm
CL spectra of plagioclase
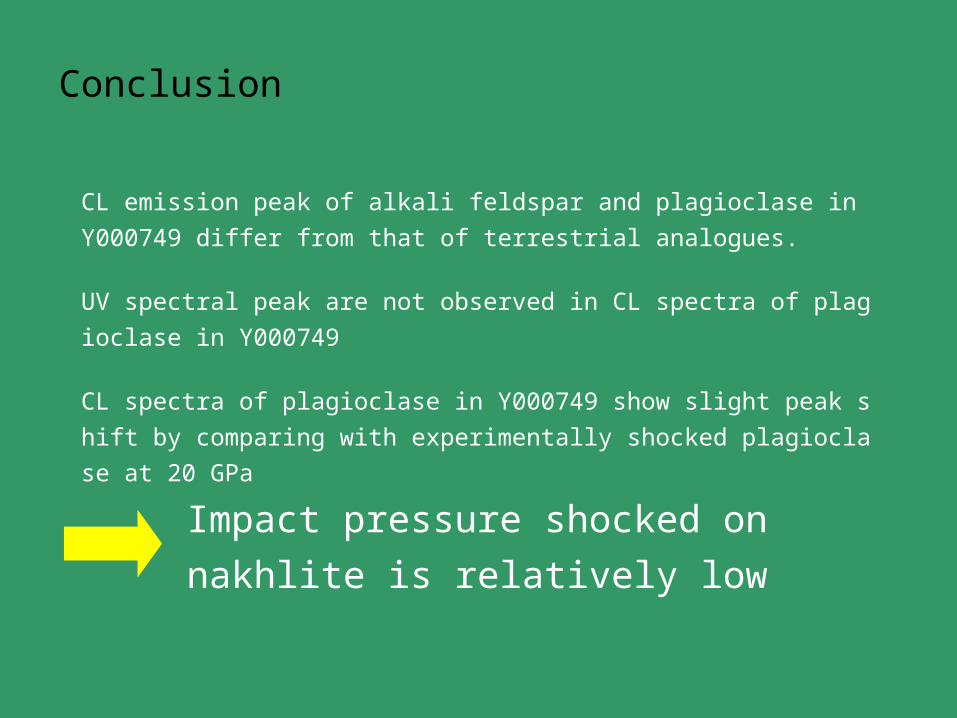
Conclusion
CL emission peak of alkali feldspar and plagioclase in Y000749 differ from t
hat of terrestrial analogues.
UV spectral peak are not observed in CL spectra of plagioclase in Y000749
CL spectra of plagioclase in Y000749 show slight peak shift by comparing
with experimentally shocked plagioclase at 20 GPa
Impact pressure shocked on nakhlite is
relatively low

Thank you very much for your attention