catalyzing investment for energy access: making the case …
TRANSCRIPT
CATALYZING INVESTMENT FOR ENERGY ACCESS:
MAKING THE CASE FOR CHANGE
Pioneering Green Partnerships,Investing in Impact
1 This report is the result of research carried out by the Power for All team in the months of February to April 2021. The document was also enriched by conversations with government officials, private sector, international financial institutions and civil society representatives.
Cover image courtesy of REDAVIA GmbhContents image courtesy of SolarWorks!
CONTENTSAbbreviations ii
Executive Summary 1
1. The Access to Electricity Challenge 7
2. Growth of DRE in Ethiopia and the Region 15
3. Challenges for DRE Expansion 21
3.1. Major Constraints 24
3.2. Intermediate Constraints 28
3.3. Not Currently Constraints 31
4. Transforming Ethiopia’s DRE Investment Climate 33
Appendix 1. Additional Figures 39
Appendix 2. Bibliography 43
iContents
ABBREVIATIONSADELE Access to Distributed Electricity and Lighting in Ethiopia
AfDB African Development Bank
AREAR Annual Report on Exchange Arrangements and Exchange Restrictions
CBE Commercial Bank of Ethiopia
DBE Development Bank of Ethiopia
DFI Development finance institution
DRC Democratic Republic of the Congo
DRE Decentralized renewable energy
EEA Ethiopian Electric Authority
EEP Ethiopian Electric Power
EEU Ethiopian Electric Utility
EIU The Economist Intelligence Unit
ER Exchange Rate
ESMAP Energy Sector Management Assistance Program
FX Foreign Exchange
GD Growth Diagnostics
GIZ German Agency for International Cooperation
GOGLA Global Off-Grid Lighting Association
GTP Growth and Transformation Plan
IEA International Energy Association
IMF International Monetary Fund
IPP Independent power producer
KOSAP Kenya Off-Grid Solar Access Project
MFI Multilateral financial institution
MDCL Market Development Credit Line
MGP Mini-Grid Partnership
MoWIE Ministry of Water, Irrigation and Electricity
NBE National Bank of Ethiopia
NEP National Electrification Program
NES National Electrification Strategy
NGO Non-governmental organization
OWID Our World in Data
PASDEP Plan for Accelerated and Sustained Development to End Poverty
PayGO Pay-as-you-go
REA Rural Electrification Agency
SDG Sustainable Development Goal
SHS Solar home systems
SSA Sub-Saharan Africa
UN United Nations
USD U.S. Dollar
WB World Bank Group
WDI World Development Indicators
WGI World Governance Indicators
ii

2 The six peers were selected to exemplify the distinct situation that different countries in SSA face, both in terms of access to energy and economic and investment environment.
Figure 1.Ethiopia and regional peers included in this report
Nigeria
Democratic Republic of Congo
Ethiopia
Kenya
Rwanda
Tanzania
Zimbabwe
EXECUTIVE SUMMARY
Executive Summary
This report evaluates the business environment for investments in decentralized renewable energy (DRE) in Ethiopia and six regional benchmarking countries2, identifying policy interventions to accelerate electricity access expansion targets.
Although Ethiopia has rapidly developed its power sector and increased access to electricity over the last twenty years, the country still has a long road ahead to meet SDG7, with more than 53% of the population lacking access to electricity services.
To meet the government’s ambitious electricity program – which sets a goal for universal access by 2025 – the government will have to address the financial and policy barriers that currently constrain the expansion of the power sector, and in particular the nascent DRE sector.
The following research examines Ethiopia’s access to electricity challenge, benchmarking the country’s power sector to six regional peers: Democratic Republic of the Congo, Kenya, Nigeria, Rwanda, Tanzania and Zimbabwe (Figures 1 and 2). The “Growth Diagnostic” methodology (Hausmann, Rodrik, Velasco 2008) is used to identify what are the most binding policy barriers to investment in the DRE sector, and distinguish the long-term reforms that are necessary for DRE development and short-term actions that can be rapidly implemented to introduce new dynamism in the country’s energy ecosystem. These recommendations are also of relevance to countries in the region facing similar growth constraints.
1
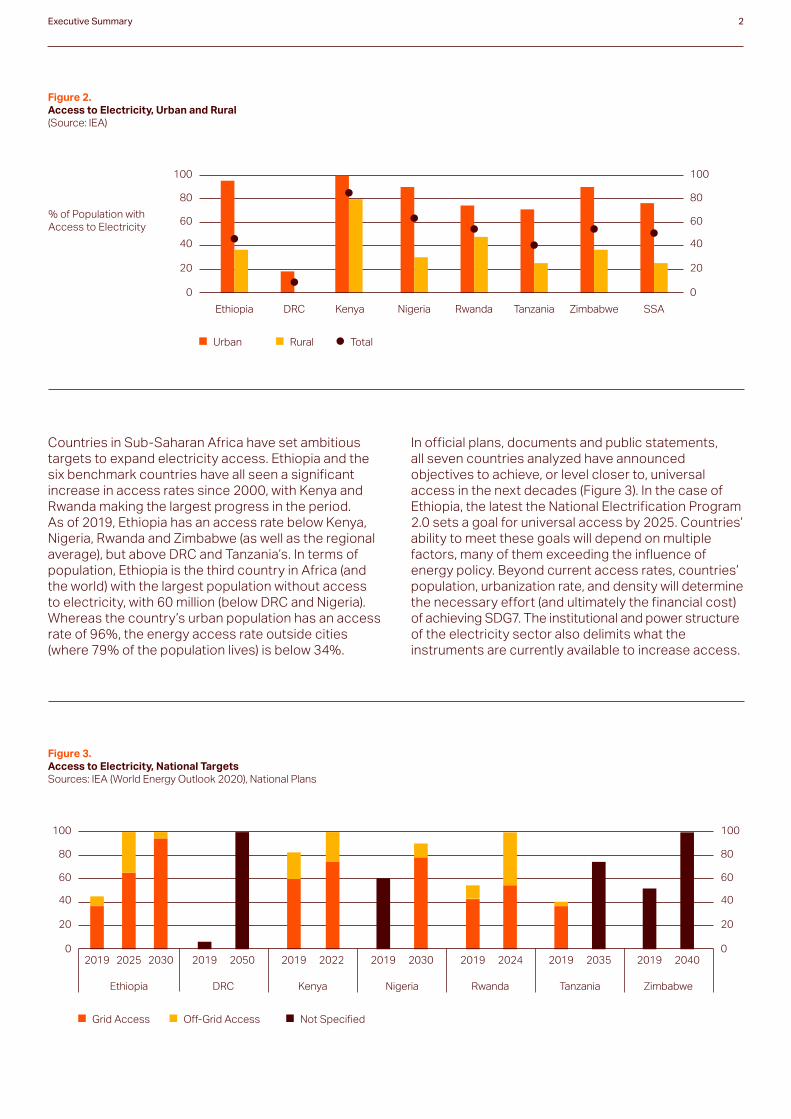
Countries in Sub-Saharan Africa have set ambitious targets to expand electricity access. Ethiopia and the six benchmark countries have all seen a significant increase in access rates since 2000, with Kenya and Rwanda making the largest progress in the period. As of 2019, Ethiopia has an access rate below Kenya, Nigeria, Rwanda and Zimbabwe (as well as the regional average), but above DRC and Tanzania’s. In terms of population, Ethiopia is the third country in Africa (and the world) with the largest population without access to electricity, with 60 million (below DRC and Nigeria). Whereas the country’s urban population has an access rate of 96%, the energy access rate outside cities (where 79% of the population lives) is below 34%.
In official plans, documents and public statements, all seven countries analyzed have announced objectives to achieve, or level closer to, universal access in the next decades (Figure 3). In the case of Ethiopia, the latest the National Electrification Program 2.0 sets a goal for universal access by 2025. Countries’ ability to meet these goals will depend on multiple factors, many of them exceeding the influence of energy policy. Beyond current access rates, countries’ population, urbanization rate, and density will determine the necessary effort (and ultimately the financial cost) of achieving SDG7. The institutional and power structure of the electricity sector also delimits what the instruments are currently available to increase access.
0 0
20 20
40 40
60 60
80 80
100 100
% of Population with Access to Electricity
Figure 2.Access to Electricity, Urban and Rural(Source: IEA)
NigeriaDRCEthiopia Kenya Rwanda Tanzania Zimbabwe SSA
Urban Rural Total
Figure 3.Access to Electricity, National Targets Sources: IEA (World Energy Outlook 2020), National Plans
0 0
20 20
40 40
60 60
80 80
100 100
NigeriaDRCEthiopia
2019 2019 2019 2019 2019 2019 20192050 2022 2030 2024 2035 20402025 2030
Kenya Rwanda Tanzania Zimbabwe
Grid Access Off-Grid Access Not Specified
Executive Summary 2

Figure 4.Sub-Saharan Africa – Off-grid Solar Lighting Products Source: GOGLA
In the last five years, Ethiopia’s performance attracting investment in small solar power systems has improved, although the country has not made the same progress with regards to mini-grid investments.
Ethiopia’s past energy strategies and its current National Electrification Program have incrementally prioritized off-grid energy technology as a means to increase access to energy throughout the country.
The latest strategy explicitly acknowledges the need for both supply- and demand-side interventions to expand the reach of the DRE sector. In Ethiopia, the government has so far been the single key stakeholder behind power sector development – for a long time, limiting options for expansion. However, more recently, the government has shown a clear commitment to crowd-in the private sector. Ethiopia has progressively adapted its regulatory environment for DRE to reduce
uncertainties for foreign and domestic investors. As a result, the country has managed to capture a significant share of the global surge in the off-grid solar market, in particular with regards to Pico and SHS systems (Figure 4). With regards to mini-grids, the country has made scarce progress relative to its regional peers and is only now beginning to adapt its regulatory frameworks to incentivize foreign investment.
0 0
2 4%
4 8%
Mill
ions
6 12%
NigeriaDRCEthiopia Kenya Rwanda Tanzania Zimbabwe
Total Sales (2016 H1/2020 H1) % of population
Executive Summary 3
Image courtesy of SolarNow

Figure 4.Growth Diagnostics Results
A Growth Diagnostics tree for DRE investments identifies “access to foreign exchange” and “regulatory barriers to entry” as the binding constraints to the expansion of off-grid electricity supply in Ethiopia.
To understand better the current needs of electrification policy in Ethiopia, and better prioritize and focus the attention of policymaking, we have adapted the Growth Diagnostics (GD) methodology developed in Hausmann, Rodrik and Velasco (2008) to a context of investment in decentralized renewable energy. The GD methodology allows the analyst to decompose the problem of lack of aggregate investment to its plausible “demand” and “supply” roots; by testing for each branch of a decision tree, the analyst can identify which constraints are the most binding in a particular location. As the analysis shows, the development of the DRE sector is currently held back by firms’ inability to access the foreign exchange they need to complete their investments. This is ultimately the results of the economy’s macroeconomic imbalances and will require major fiscal and exchange rate reforms to be resolved.
Moreover, Ethiopia’s stringent regulatory barriers both to foreign investment but also to vertical integration and licensing in key sectors is also constraining the development of the sector, as it limits the country’s ability to bring in key international actors, and have them set up their businesses in a competitive manner. Other intermediate constraints to the development of the sector is the high degree of currency risk – also driven by the country’s macroeconomic imbalances – an insufficient development of the ICT and banking sectors (which add further difficulties to the provision of both consumer finance and working capital), and informational asymmetry at the level of product quality between firms and consumers (Figure 5). Taxes and import tariffs, human capital, logistics and political stability are not considered at present to be key binding constraints in the development of the sector.
Access to Foreign Exchange
Regulatory Barriers to Entry
Currency Risk
ICT Infrastructure
Financial Intermediation
Information Asymmetry
Taxes and Import Tariffs
Insufficient Human Capital
Logistics
Political Stability
Major Constraints Intermediate Constraints Not Currently Constraints
Executive Summary 4
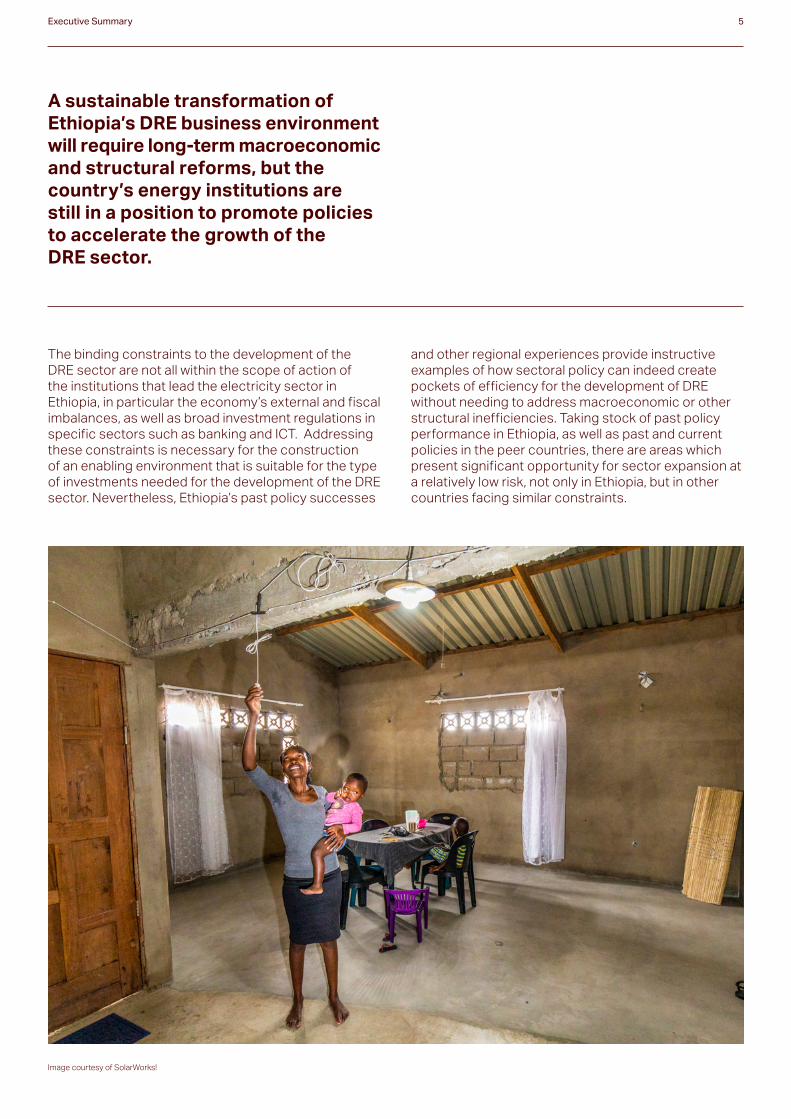
A sustainable transformation of Ethiopia’s DRE business environment will require long-term macroeconomic and structural reforms, but the country’s energy institutions are still in a position to promote policies to accelerate the growth of the DRE sector.
The binding constraints to the development of the DRE sector are not all within the scope of action of the institutions that lead the electricity sector in Ethiopia, in particular the economy’s external and fiscal imbalances, as well as broad investment regulations in specific sectors such as banking and ICT. Addressing these constraints is necessary for the construction of an enabling environment that is suitable for the type of investments needed for the development of the DRE sector. Nevertheless, Ethiopia’s past policy successes
and other regional experiences provide instructive examples of how sectoral policy can indeed create pockets of efficiency for the development of DRE without needing to address macroeconomic or other structural inefficiencies. Taking stock of past policy performance in Ethiopia, as well as past and current policies in the peer countries, there are areas which present significant opportunity for sector expansion at a relatively low risk, not only in Ethiopia, but in other countries facing similar constraints.
Executive Summary 5
Image courtesy of SolarWorks!

01.Expansion of Market Development Credit Line
The MDCL, an energy-specific credit line, has proven to be very successful in alleviating the foreign exchange constraint for firms and increasing the number of participating private sector companies and microfinance institutions (the two direct beneficiaries of the credit) in the market. Expanding the program for it to meet the current demand for Pico and SHS systems, especially in rural areas, will be necessary to strengthen the sector’s performance.
03.Remittance-based Financing
The possibility of using mobile money to provide households with an option to purchase off-grid solar equipment through remittance income can alleviate foreign exchange shortages by providing hard currency. A pilot for a similar project in Rwanda has shown significant potential and should be further explored.
05.Industrial Policy for Local Manufacturing
Given Ethiopia’s comparative advantage for low-skill manufacturing – and recent successful local and regional experiences – the government should continue to explore the possibility of attracting investments for the creation of an exporting manufacturing cluster of off-grid solar products, that can serve other SSA markets, as well as the Ethiopia market in the medium-term.
02.Market-based Incentives for Investment
Regional electricity access expansion programs have increasingly included facilities for result-based financing (RBF) that competitively award incentives to companies according to their financing requirements: Kenya Off-Grid Solar Access Project (KOSAP) approach towards pay-for-delivery, and Nigeria’s minimum tender for mini-grid development, are two of many regional initiatives that Ethiopia and other countries could seek to learn from.
04.Public Information for Sectoral Development
Providing quality public information can be a low-cost instrument to reduce informational asymmetries and uncertainties that can often prevent investments from happening. Regional experience in creating publicly available energy access maps – such as the Nigerian Energy Database – could be domestically replicated.
Executive Summary 6
Image courtesy of Opmeer Reports
The following initiatives have been identified as possibilities to support sector expansion:

10 Executive Summary
01 THE ACCESS TO
ELECTRICITYCHALLENGE

The challenge of ensuring access to affordable and sustainable modern energy is not the same for every country in Sub-Saharan Africa, and the role that DRE will play in it will majorly depend on past policy performance.
It is often reported that Sub-Saharan Africa is the region with the lowest energy access in the world. Despite significant progress since 2000, only 48% of SSA citizens had access to electricity by 2019, according to IEA’s latest estimates (versus a 90% global access rate). This implies that out of the 771 million men and women without access to electricity in the world, 579 million or 75% of them live in SSA. Even within the region, we observe significant heterogeneity across countries. Although nations such as South Africa, Ghana or Kenya have access rates higher than 80%, DRC, South Sudan or Liberia’s energy access rates are at most 15%.
Despite great progress in access rates, energy poverty remains a challenge. This section describes six regional benchmarking countries: Democratic Republic of the Congo, Kenya, Nigeria, Rwanda, Tanzania and Zimbabwe3; and contrasts with Ethiopia’s access to electricity.
The region has experienced a significant increase in access rates since 2000 (Box 1), with Ethiopia performing consistently, and only overtaken by Kenya and Rwanda in the last decade (Figure 1). As of 2019, Ethiopia has an access rate below Kenya, Nigeria, Rwanda and Zimbabwe (as well as the regional average), but above DRC and Tanzania’s.
In terms of population, Ethiopia is the third country in Africa (and the world) with the largest population without access to electricity (below DRC and Nigeria). If instead of access rates, one observes how much power is consumed by country, Ethiopia has the second lowest consumption per capita in the group — amounting to less than a third of the regional average. However, the country has shown rapid growth in the past decade and last five years, behind only Rwanda (Figure 2). It is in this context of low consumption and relatively low access rates that DRE can play a crucial role in expanding access in Ethiopia and help achieve the national electrification targets.
0 0
20 20
40 40
60 60
80 80
100 100
% of Population with Access to Electricity
Figure 1.Access to Electricity in Sub-Saharan Africa(Source: IEA)
NigeriaDRCEthiopia Kenya Rwanda Tanzania Zimbabwe SSA
2000 2010 2019
3 The six peers were selected to exemplify the distinct situation that different countries in SSA face, both in terms of access to energy and economic and investment environment.
The Access To Electricity Challenge 8
Image courtesy of Azuri

Box 1: Ethiopia’s progress in energy access
Ethiopia has rapidly developed its power sector and increased access to electricity over the last twenty years. Since 2004, Ethiopia has experienced an acceleration of economic growth, which has enabled a transformation of its economy and society—and has lifted millions of households out of poverty. The tripling of income per capita over the last twenty years was facilitated by — and also contributed to — the development of the country’s power sector, especially a sustained increase in access to electricity. Since 2004, electricity demand has grown at a yearly average of 7%, substantially above most countries in Sub-Saharan Africa, and access to electricity has gradually started to catch up with the world. Whereas in 1990 less than 0.1% of Ethiopia’s population had any type of access to energy, and 5% had it in 2000, by 2019 nearly half of the population (47%) had access to electricity supply. Although the increase in access was mostly driven by an expansion of the grid (as well as grid supply), close to 11% of Ethiopia’s population currently derives electricity access from off-grid sources, as revealed by the country’s Multi-Tier Energy Access Framework assessment (World Bank).
Figure 2.Electricity Consumption per Capita, Levels and Growth Source: IEA, OWID
-4% 0
0%
-2%
4%
4%
6%
2%
8%
CA
GR
(20
13
-20
18
)
8%
10%
12%
kWh per Capita
Nigeria
DRC
10 100 1000 10000
Ethiopia
KenyaSSA
Rwanda
Tanzania
Zimbabwe
World
The Access To Electricity Challenge 9
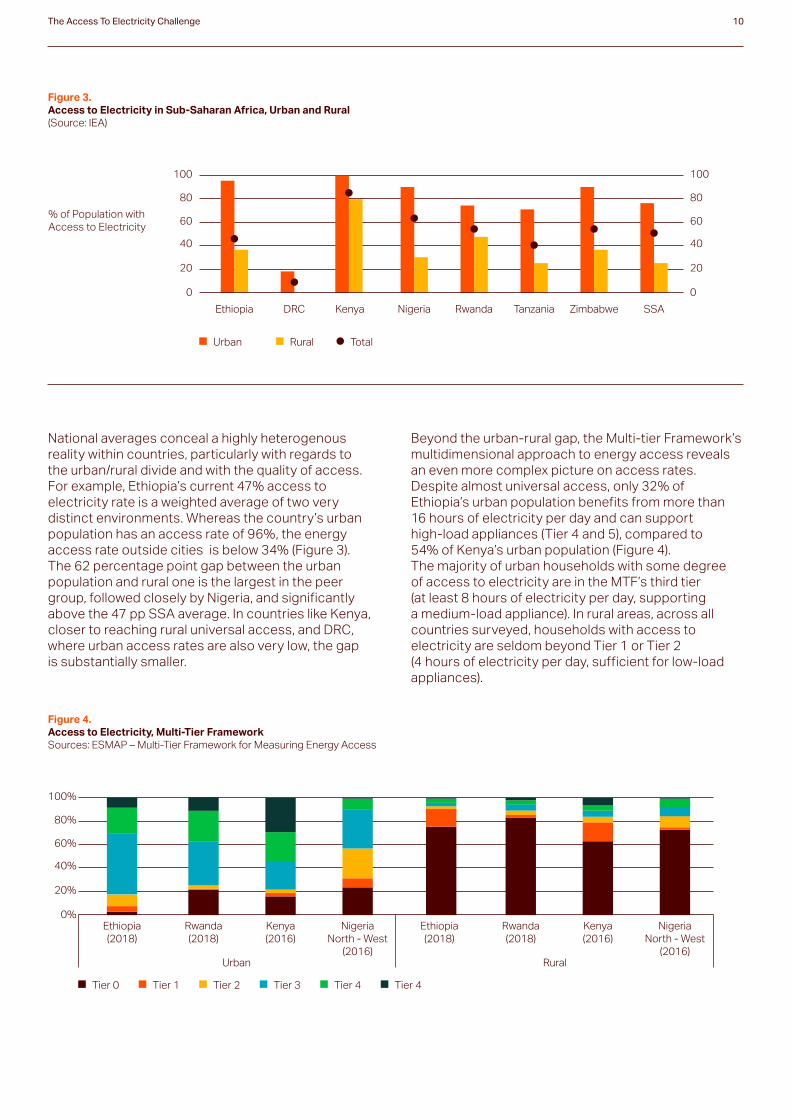
National averages conceal a highly heterogenous reality within countries, particularly with regards to the urban/rural divide and with the quality of access. For example, Ethiopia’s current 47% access to electricity rate is a weighted average of two very distinct environments. Whereas the country’s urban population has an access rate of 96%, the energy access rate outside cities is below 34% (Figure 3). The 62 percentage point gap between the urban population and rural one is the largest in the peer group, followed closely by Nigeria, and significantly above the 47 pp SSA average. In countries like Kenya, closer to reaching rural universal access, and DRC, where urban access rates are also very low, the gap is substantially smaller.
Image courtesy of SolarWorks!
The Access To Electricity Challenge 10
National averages conceal a highly heterogenous reality within countries, particularly with regards to the urban/rural divide and with the quality of access. For example, Ethiopia’s current 47% access to electricity rate is a weighted average of two very distinct environments. Whereas the country’s urban population has an access rate of 96%, the energy access rate outside cities is below 34% (Figure 3). The 62 percentage point gap between the urban population and rural one is the largest in the peer group, followed closely by Nigeria, and significantly above the 47 pp SSA average. In countries like Kenya, closer to reaching rural universal access, and DRC, where urban access rates are also very low, the gap is substantially smaller.
Beyond the urban-rural gap, the Multi-tier Framework’s multidimensional approach to energy access reveals an even more complex picture on access rates. Despite almost universal access, only 32% of Ethiopia’s urban population benefits from more than 16 hours of electricity per day and can support high-load appliances (Tier 4 and 5), compared to 54% of Kenya’s urban population (Figure 4). The majority of urban households with some degree of access to electricity are in the MTF’s third tier (at least 8 hours of electricity per day, supporting a medium-load appliance). In rural areas, across all countries surveyed, households with access to electricity are seldom beyond Tier 1 or Tier 2 (4 hours of electricity per day, sufficient for low-load appliances).
0 0
20 20
40 40
60 60
80 80
100 100
% of Population with Access to Electricity
Figure 3.Access to Electricity in Sub-Saharan Africa, Urban and Rural(Source: IEA)
NigeriaDRCEthiopia Kenya Rwanda Tanzania Zimbabwe SSA
Urban Rural Total
Figure 4.Access to Electricity, Multi-Tier Framework Sources: ESMAP – Multi-Tier Framework for Measuring Energy Access
0%
20%
40%
60%
80%
100%
Urban Rural
Nigeria North - West
(2016)
Rwanda (2018)
Ethiopia (2018)
Kenya (2016)
Nigeria North - West
(2016)
Rwanda (2018)
Ethiopia (2018)
Kenya (2016)
Tier 0 Tier 1 Tier 2 Tier 3 Tier 4 Tier 4

Countries in Sub-Saharan Africa have set ambitious targets to expand electricity access.
The establishment of SDG7 in 2015, an unprecedented economic performance in many countries in the region since the 2000s and the development of less-costly renewable technologies to expand both on-grid and off-grid access have all contributed to the setting of ambitious electricity access targets in many countries in Sub-Saharan Africa. In official plans, documents and public statements, all seven countries analyzed have announced objectives to achieve, or level closer to, universal access in the next decades (Figure 5). These targets vary in their ambition: whereas Kenya seeks to reach universal access by 2022 and Rwanda by 2024, Zimbabwe and DRC have more medium-term targets (2040 and 2050, respectively). In the case of Ethiopia, the latest the National Electrification Program 2.0 sets a goal for universal access at 2025.
Not every country is equally precise on how they plan to reach these goals – through which policies, or how will they finance it – nor on what technological blend universal access will initially be based. Ethiopia’s NEP 2.0 does include an off-grid access rate of 35% by 2025 as an intermediate goal, to be reduced 4% by 2030. The country’s 2025 targets include a higher share in the use of off-grid technologies than Kenya, but a lower one than Rwanda.
The Access To Electricity Challenge 11
Figure 5.Access to Electricity, National Targets Sources: IEA (World Energy Outlook 2020), National Plans
0 0
20 20
40 40
60 60
80 80
100 100
NigeriaDRCEthiopia
2019 2019 2019 2019 2019 2019 20192050 2022 2030 2024 2035 20402025 2030
Kenya Rwanda Tanzania Zimbabwe
Grid Access Off-Grid Access Not Specified

Box 2: Ethiopia’s National Electrification Plan
The formulation of the country’s National Electrification Strategy in 2016 and later the first National Electrification Program in 2017 have anchored the ambitious objectives of the government in a grounded platform for both institutional reform as well as the roll-out of on-grid and off-grid electrification. The country’s latest electrification strategy, the National Electrification Program 2.0 (NEP 2.0), sets ambitious goals for universal access by 2025, based on a combination of new grid connections and distribution of off-grid equipment, as well as further electrification of households relying on off-grid supply. Meeting the objectives of NEP 2.0 will require both the successful completion of grid-connected public hydro projects (as well as new utility-scale geothermal, solar and wind IPPs), a significant extension of the transport and distribution grid, and scaling up off-grid services to an unprecedented level in the country. The current presence of significant financial and policy barriers to investment in the DRE sector highlights the need for multi-stakeholder action to meet the country’s ambitious energy access targets.
The Access To Electricity Challenge 12
The countries included in this study have all set ambitious goals to increase energy access in the next decade. Their ability to meet them will depend on multiple factors, many of them exceeding the influence of energy policy. Beyond current access rates, countries’ population, urbanization rate, and density will determine the necessary effort (and ultimately the financial cost) of achieving SDG7 (Figure A1 in Appendix includes a table summarizing demographic and economic country characteristics). A larger population, a lower urbanization rate or a lower density imply a higher effort in terms of reaching those who are not currently served by the electricity grid. The size of the country’s economy will shape its ability to finance its ambition. Beyond income per capita, a country’s foreign savings – through exports, remittances, aid flows or debt – determine what it can afford in terms of imports, which is indispensable given that most electricity equipment is imported.
The institutional and power structure of the electricity sector delimits what instruments are currently available to increase access. The seven countries have
power sectors not only of different size but also of different composition, which imply a different capacity expand in the short-term supply (Figure 6). For example, Ethiopia’s hydro-dependent power supply requires long-term costly investments for its expansion, whereas conventional generation power sources or other renewable generation (wind, solar) are faster and less costly to scale up in the short-term.
Beyond access, reliability of current supply (exemplified by recurrence of outages) and affordability of tariff structure affect the incentives for DRE expansion. Finally, the institutional structure of the electricity sector sets the framework in which private sector participation in both generation and distribution of grid-based power supply (as well as off-grid) can take place. In this regard, Kenya and Nigeria are the countries that have most advanced in the restructuring and reform of their power sector among comparators (Figure 7)4. Ethiopia’s electricity sector, on the other hand, has only recently begun its restructuring process and opened its doors to private sector participation.
The ability of countries to expand energy access will be determined not only by their economic, geographic and demographic characteristics, but also by the power and institutional structure of their power sectors.
3 The six peers were selected to exemplify the distinct situation that different countries in SSA face, both in terms of access to energy and economic and investment environment.

The Access To Electricity Challenge 13
Figure 6.Electricity Generation, Percentage of Domestic Supply Sources: IEA, National Plans
Figure 7.Power Sector Reform Index Sources: African Development Bank, 2019
0%
0
-20%
20%
20
40%
40
60%
60
80%
80
100%
100
% o
f Do
mes
tic S
upp
ly
Ethiopia
Ethiopia
DRC
DRC
Zimbabwe
Zimbabwe
Nigeria
Nigeria Rwanda
Kenya
Kenya
Tanzania
Tanzania
Coal Oil Natural Gas Biofuels Geothermal Solar/Wind Hydro Net Imports
Regulatory Restructuring Competition Private sector participation
Across the region, government is the single most important stakeholder behind power sector development. In Ethiopia, for example, the Ministry of Water, Irrigation and Electricity (MoWIE) leads all energy development policies in the country, including the dissemination of renewable energy technologies, bio-fuels development, hydropower and dams’ administration. Under MoWIE operate the remaining institutions that are related to the energy sector: Ethiopian Electric Power (EEP) – the sole provider of wholesale electricity, also managing transmission –, Ethiopian Electric Utility (EEU) – focusing on distribution and sales of electricity–, and the regulator, the Ethiopian Energy Authority (EEA).
Image courtesy of Opmeer Reports
The Access To Electricity Challenge 14
However, there is an increasingly clear commitment to crowd-in the private sector. Ethiopia’s Rural Electrification Fund seeks to enable private and cooperative engagement in rural electrification activities. The country’s power sector has been undergoing reform since 2013, which has included the unbundling of the previously vertically integrated Ethiopian Electric Power Corporation into EEP and EEU, the constitution of the country’s regulatory authority EEU and the introduction of key legislation to induce private sector participation. Although the sector is still by all means public-led, private enterprises and DFIs have been increasingly involved in energy development. International financial institutions such as the World Bank Group, United Nations Development Programme, United Nations Environment Programme, as well as French, German, Dutch and African development organizations have been increasingly working with the MoWIE over the past two decades on financing, consultation and technical assistance for generation, transmission and distribution projects. Chinese state-owned enterprises have also been actively involved in the construction and finance of projects such as the Genale Dawa III dam and the Ethiopia-Kenya transmission line. Moreover, the Government of Ethiopia has been conducting an extensive review of its commercial and investment regulations to facilitate private investment. Given current laws (and particularly after the passing of the new investment proclamation 1180/2020), foreign private actors can become Independent Power Producers (IPP) and invest in other stages of the electricity system, although (it appears) there are still no operating IPPs in the market. Ethiopia has recently negotiated with the assistance of the USAID Power Africa initiative the Corbetti and Tule Moye geothermal Projects and the competitively tendered Metahara Solar Project, all of which are still under construction.
Ethiopia has still a long road ahead to meet SDG7 and ensure universal access to electricity. Although the country’s power sector performance over the last twenty years has been outstanding (in terms of infrastructure development, institutional reform, and ultimately energy access outcomes), providing basic electricity supply is still one of Ethiopia’s major economic and social challenges. In particular, rural electrification has often been regarded as one of the main constraints to improving rural livelihoods in the country5. Both consumption per capita and access to electricity levels are still below many of Ethiopia’s regional peers—and certainly most countries with similar income per capita.
This report evaluates the business environment for investments in decentralized renewable energy (DRE) in Ethiopia and six regional benchmarking countries6, identifying policy interventions to accelerate electricity access expansion targets. For Ethiopia to accelerate the achievement of SDG7, the government will need to address the financial and policy barriers that currently constrain the expansion of the DRE sector. The report breaks down the existing gap between national ambition and policy by describing in detail the limitations faced by the sector. The development of DRE in Ethiopia and the six peers is compared in section 2, as well as the regulatory and policy environment to incentivize investment in the sector. The third section uses the “Growth Diagnostics” (Hausmann, Rodrik, Velasco 20087) methodology to identify the most binding constraints in the DRE sector in Ethiopia. The last section discusses both the long-term reforms that will be necessary for a successful enlargement of DRE in Ethiopia, and the short-term actions that can provisionally increase the sector’s dynamism. These recommendations are also of relevance to countries in the region facing similar growth constraints.
5 World Bank, Ethiopia: Priorities for Ending Extreme Poverty and Promoting Shared Prosperity, 2016.6 The six peers were selected to exemplify the distinct situation that different countries in SSA face, both in terms of access to energy and economic and investment environment.7 Ricardo Hausmann, Dani Rodrik, and Andrés Velasco, “Growth Diagnostics,” The Washington Consensus Reconsidered: Towards a New Global Governance, 2008, 324–55. Image courtesy of Oscar Gutierrez
18 Executive Summary
02 GROWTH
OF DRE
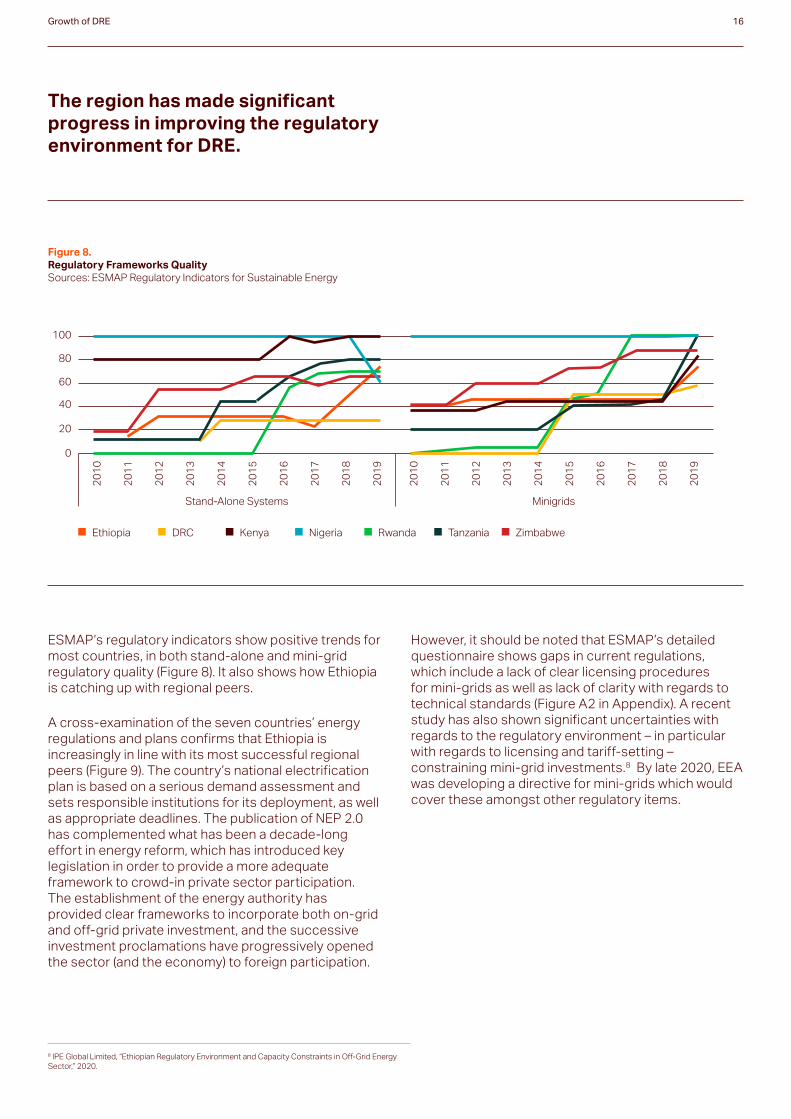
The region has made significant progress in improving the regulatory environment for DRE.
ESMAP’s regulatory indicators show positive trends for most countries, in both stand-alone and mini-grid regulatory quality (Figure 8). It also shows how Ethiopia is catching up with regional peers.
A cross-examination of the seven countries’ energy regulations and plans confirms that Ethiopia is increasingly in line with its most successful regional peers (Figure 9). The country’s national electrification plan is based on a serious demand assessment and sets responsible institutions for its deployment, as well as appropriate deadlines. The publication of NEP 2.0 has complemented what has been a decade-long effort in energy reform, which has introduced key legislation in order to provide a more adequate framework to crowd-in private sector participation. The establishment of the energy authority has provided clear frameworks to incorporate both on-grid and off-grid private investment, and the successive investment proclamations have progressively opened the sector (and the economy) to foreign participation.
However, it should be noted that ESMAP’s detailed questionnaire shows gaps in current regulations, which include a lack of clear licensing procedures for mini-grids as well as lack of clarity with regards to technical standards (Figure A2 in Appendix). A recent study has also shown significant uncertainties with regards to the regulatory environment – in particular with regards to licensing and tariff-setting – constraining mini-grid investments.8 By late 2020, EEA was developing a directive for mini-grids which would cover these amongst other regulatory items.
Growth of DRE 16
Figure 8.Regulatory Frameworks Quality Sources: ESMAP Regulatory Indicators for Sustainable Energy
0
20
40
60
80
100
Stand-Alone Systems Minigrids
20
10
20
10
20
11
20
11
20
12
20
12
20
13
20
13
20
14
20
14
20
15
20
15
20
16
20
16
20
17
20
17
20
18
20
18
20
19
20
19
Ethiopia DRC Kenya Nigeria Rwanda Tanzania Zimbabwe
8 IPE Global Limited, “Ethiopian Regulatory Environment and Capacity Constraints in Off-Grid Energy Sector,” 2020.

Decentralized renewable energy plays a key role in current rural electrification effort. Although access to energy has been a foremost development objective across the region, it is only relatively recently that governments have shifted focus from developing generation and transmission infrastructure to guaranteeing the delivery of electricity services. The Government of Ethiopia, since at least the Plan for Accelerated and Sustained Development to End Poverty (PASDEP, 2005-2010) and through two Growth and Transformation Plans (GTP-I 2005-2010 and GTP-II 2010-2015), has prioritized energy planning. Ethiopia’s GTP-I significantly improved the country’s transmission infrastructure, but last-mile connections were not able to keep the pace with the network expansion. In response, GTP-II in 2010 not only included transmission expansion goals, but also incorporated distribution targets such as increasing access up to 90% by 2020. The NEP has also updated universal access objectives and set a goal for nationwide electricity access by 2025. Only two years after its publication, the government updated the plan and published a NEP 2.0, incorporating new analytics to guide the implementation of the program, which include (1) the country’s first multi-tier framework
energy access survey, and a (2) geo-spatial analysis of the electricity network and its proximity to the population.
In the current government strategy, off-grid access is expected to incorporate 6 million new rural households and cover 35% of the country’s population by 2025 (implying an increase of more than 20 pp in off-grid coverage). The NEP 2.0’s off-grid program acknowledges the need for nationwide outreach and speed to complete the country’s targets and puts under its umbrella the government’s supply-side interventions (improving access to finance for foreign exchange, working capital, and state capacity in the public distribution company) and demand-side interventions (from subsidies to licensing reform). Ethiopia’s NEP 2.0 has been a key programmatic step for the prioritization of off-grid energy technologies as part of the country’s electrification program. Nevertheless, in the gap from planning to action, we can observe that Ethiopia can still do much to capitalise on the region’s newest innovations with regards to efficiently incentivizing expansion of DRE investment.
Growth of DRE 17
Figure 8.Regulatory Frameworks Quality Sources: ESMAP Regulatory Indicators for Sustainable Energy
Electricity Law Electricity Strategy Electrification PlanMini-grid
regulation
Ethiopia
Kenya
Rwanda
Zimbabwe
Tanzania
Nigeria
DRC
Energy Proclamation No. 810/2013; Energy Regulation
No. 447/2019
Energy Act, 2019
Electricity Law, 21/2011
Electricity Act, 2002; Energy Regulatory Act
Rural Energy Act, 2005; Electricity Act, 2008
Electric Power SectorReform Act, 2005; Electricity
Management Services Authority Act, 2015
Electricity Law, 14/011, 2014
National Energy Policy, 2013
National Energy Policy, 2015
Rwanda Energy Policy, 2015; Energy Sector Strategic Plan, 2018
National Energy Policy, 2012
National Energy Policy, 2003
National Energy Policy, 2003 (rev. 2013); National Renewable
Energy and Energy Efficiency Policy, 2015
National Electrification Program 2.0, 2019
National Electrification Strategy, 2018
Rural Electrification Plan, 2016; National Electrification Plan, 2019
Zimbabwe Rural Energy Master Plan, 2015
National Electrification Program Prospectus, 2014; updated by Rural
Energy Agency
Rural Electrification Strategy, 2016
AREAR
Drafted (2020)
Drafted
Yes
Unclear
Yes
Yes

Countries have recently introduced a series of innovative investments to create a better enabling environment for DRE.
Countries have recently introduced a series of innovative investments to create a better enabling environment for DRE. Nigeria’s Rural Electrification Agency, with a strong support from the World Bank, launched in 2018 the Nigeria Electrification Project, targeted to provide an enabling environment for off-grid market growth not only though regulatory reform but also by providing market mechanisms funds both for solar hybrid mini grids (through minimum subsidy tenders) and performance-based grants, and for stand-alone solar systems (through market scale-up and output-based grants). The mini-grid initiative involves a pre-selection of sites and bidding for build-own-operate contracts. SHS grants are meant to crowd-in large market players to a new vibrant market.
Moreover, the Kenya Off-Grid Solar Access Project (KOSAP) has innovated in its provision of result-based financing for solar service providers, which has introduced new dynamism in an already fast-growing market. Although Ethiopia has introduced some innovative incentives to crowd-in the private to DRE (in particular, the Market Development Credit Line), there is room to introduce further policies targeted to both incentivize the establishment of new mini-grids and Pico and SHS providers.
In the last five years, Ethiopia’s performance attracting investment in small solar power systems has greatly improved, and the country is starting to make progress with regards to mini-grid investments. Ethiopia has managed to capture a significant share of the global surge in the off-grid solar market, with an average of over 570 thousand lighting units sold per year over the last years and explaining 14% of off-grid solar volume sales since 2016, or 12% when excluding the country’s best performing semester. This share is moderately above Ethiopia’s share of the regional population, and more than twice the country’s share in the region’s aggregate GDP. Lighting products sales through this period are equivalent to around two units per 100 citizens, higher than most peers, with the exception of Kenya and Rwanda, where 12 and 7 units per 100 citizens were sold in the same period (Figure 10). Although solar lanterns have received the majority of DRE investment in the country, SHS sales have increased more recently, as they have gradually become the focus of government-provided financing. GOGLA estimates that there are around 3 million live Pico units and 400 thousand live SHS in the country.
Growth of DRE 18
Figure 10.Sub-Saharan Africa – Off-grid Solar Lighting Products, Volumes Sold Source: GOGLA
0 0
2 4%
4 8%
Mill
ions
6 12%
NigeriaDRCEthiopia Kenya Rwanda Tanzania Zimbabwe
Total Sales (2016 H1/2020 H1) % of population

With regards to mini-grids, the country has made only scarce progress, with the number of mini-grid units remaining relatively constant over time, and both number of operating units and capacity below peers such as Kenya and Tanzania. Within the scope of NEP 2.0, Ethiopia is indeed pursuing several mini-grid initiatives with development partners, which include Power Africa, United Kingdom’s Foreign Commonwealth and Development Office, and GIZ.
Global funding for DRE has had a large equity and grant component, but debt-to-equity ratios are rising. Global investments in DRE have accompanied the development of new technologies in the sector and the increasing interest of governments, MFIs and NGOs. GOGLA statistics on off-grid solar investment show a steep increase in global investment after 2015, with values close to USD 300 M per year. The initial finance blend in the sector had been relatively equity-intensive, but over the last three years the sector has attained a higher average debt-to-equity ratio. The largest players in the off-grid solar market
are government / DFIs, which have contributed about a third of financing in the sector in the last five years, the majority of which through debt (Figure 11). Impact finance investors constitute the second largest player with another third of investments, with more than two-thirds of their investment placed in debt. For-profit finance is the largest equity provider, whereas other types of investors play a smaller role. Crowdfunding’s role has become a larger finance provider in the sector since 2018, and now constitutes about 7% of global financing, mostly through debt. Wood Mackenzie’s off-grid renewable finance statistics show a similar trend in debt-to-equity ratios, but aggregate investment figures vary, showing a more continuous increase in investments (reaching up to USD 500 M in 2018).9 In the consultancy group’s statistics, energy investment is dominated by private finance (71%), although largest players include both private and public investors. Moreover, 81% of investments is allocated to SHS and Pico PV firms, more than five times the investment in mini-grids.
Growth of DRE 19
Figure 11.Global Off-Grid Solar Investment, by Financing and Investor (2016/20), USD Million Source: GOGLA
Debt Equity Grant
9 Wood Mackenzie, “Strategic Investments in Off-Grid Energy Access. Scaling the Utility of the Future for the Last Mile,” 2019.
Debt Equity
Government/DFI, 404
Impact Financing, 366
Crowdfunding, 75Other/
Unknown, 60Other/
Unknown, 79
Oth
erGovernment /DFI, 57
Strategic Corporates, 115
For Profit Finance, 223 Impact Finance, 150G
ove
rnm
ent/
DFI
, 60
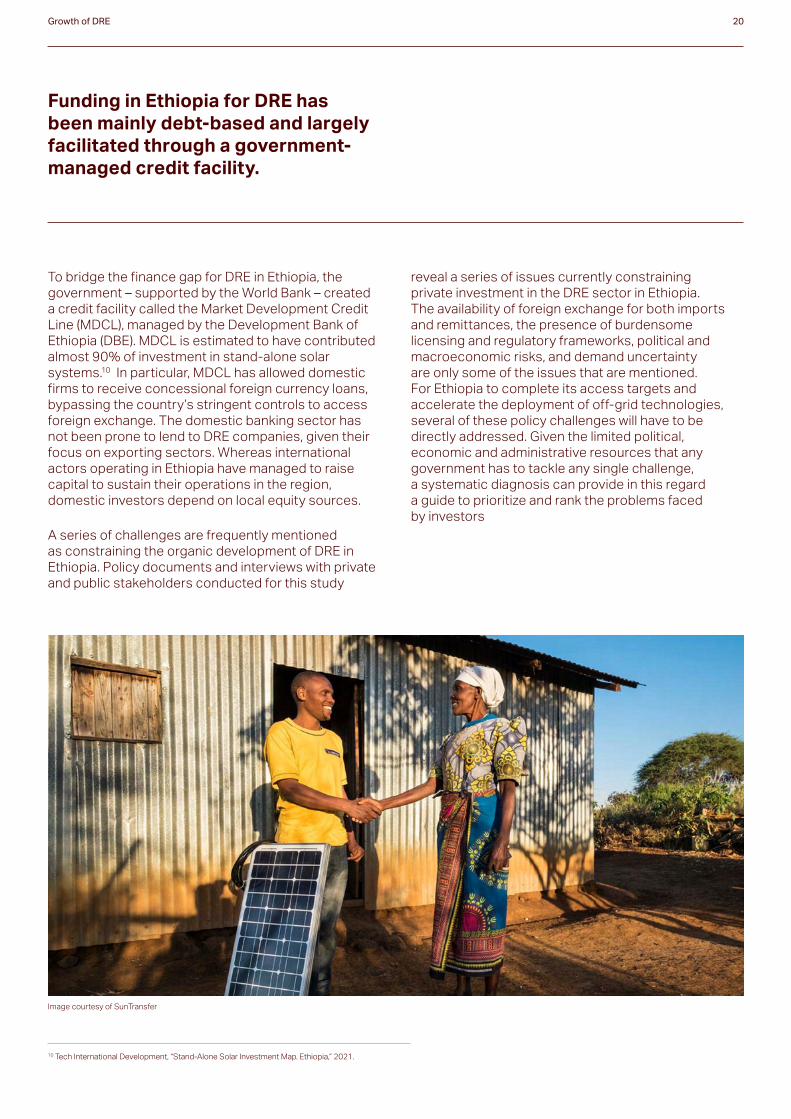
Funding in Ethiopia for DRE has been mainly debt-based and largely facilitated through a government-managed credit facility.
To bridge the finance gap for DRE in Ethiopia, the government – supported by the World Bank – created a credit facility called the Market Development Credit Line (MDCL), managed by the Development Bank of Ethiopia (DBE). MDCL is estimated to have contributed almost 90% of investment in stand-alone solar systems.10 In particular, MDCL has allowed domestic firms to receive concessional foreign currency loans, bypassing the country’s stringent controls to access foreign exchange. The domestic banking sector has not been prone to lend to DRE companies, given their focus on exporting sectors. Whereas international actors operating in Ethiopia have managed to raise capital to sustain their operations in the region, domestic investors depend on local equity sources.
A series of challenges are frequently mentioned as constraining the organic development of DRE in Ethiopia. Policy documents and interviews with private and public stakeholders conducted for this study
reveal a series of issues currently constraining private investment in the DRE sector in Ethiopia. The availability of foreign exchange for both imports and remittances, the presence of burdensome licensing and regulatory frameworks, political and macroeconomic risks, and demand uncertainty are only some of the issues that are mentioned. For Ethiopia to complete its access targets and accelerate the deployment of off-grid technologies, several of these policy challenges will have to be directly addressed. Given the limited political, economic and administrative resources that any government has to tackle any single challenge, a systematic diagnosis can provide in this regard a guide to prioritize and rank the problems faced by investors
Growth of DRE 20
10 Tech International Development, “Stand-Alone Solar Investment Map. Ethiopia,” 2021.
Image courtesy of SunTransfer

24 Executive Summary
03 CHALLENGES
FOR DRE EXPANSION

The “Growth Diagnostics” framework is designed to identify the most binding element of an economic challenge.
Growth Diagnostics (GD) apply a diagnosis methodology to systematically analyze an economic problem based on the type of symptoms that are observed in the data. The methodology was developed in Hausmann, Rodrik and Velasco (2008) and later expanded and applied by DFIs to analyze bottlenecks to growth and private investment in many countries.11
The intuition behind GD is that solving an economic problem cannot rely on global sets of “best practices” but should also identify contextual distortions that lie behind each specific problem. The original GD method provides a heuristic tree that allows the analyst to decompose the problem of lack of aggregate investment to its plausible “demand” and “supply” roots (Figure A3 in Appendix). Aggregate private investment in an economy could be low because the return to investments is low, or because the supply of financing is too costly for that return. If the return is low (or there is little “demand” for that investment), it could be so either because the investment provides little societal value (and that might be derived from the lack of a complementary input such as physical or human capital) or because even though the societal value of the investment is high, there are either government or market failures that prevent the investor from seizing the returnon their investment.
A GD requires the analyst to examine separately each branch of the decision tree and test for diagnostic signals that can provide evidence in one direction or another. In the original framework, accepted signals for a constraint to be considered binding include: (1) the presence of a high shadow or implicit price (such as a high return to human capital if that was to be binding), (2) an improvement / worsening of the problem when the supply of the constraining input is augmented / reduced, (3) the relative success of endeavors that are not dependent on the constraining input (for example, if education is a constraint, firms that depend on low-skill workers should thrive, and (4) and the presence of agents trying to actively bypass the constraint by procuring themselves the missing
input (for example, if public security is an issue of economic importance, one would expect firms to be providing themselves with private services). By testing for each branch of the decision tree, the analyst can identify which constraints are the most binding in a particular location.
A Growth Diagnostics tree for DRE investments can be useful to identify the binding constraint to the expansion of off-grid electricity supply in Ethiopia. Providing off-grid electricity services requires multiple inputs, all of which are complementary and cannot be easily substituted. To understand better the current needs of electrification policy in Ethiopia, and better prioritize and focus the attention of policymaking, it is essential to diagnose which of these inputs are currently binding and preventing a further acceleration in investment. For that, we have adapted the original diagnostic tree to a context of investment in decentralized renewable energy, as exemplified in Figure 12.12 In this tree, under-investment relative to the social optimal can be driven by demand-side and supply-side factors. Supply-side factors are related to a high cost of finance, either due to problems in accessing international finance or domestic financing. As for demand-side factors, a low social return to investment can be driven by the lack of a complementary input (human capital, ICT and logistics infrastructure) and low appropriability of investment can be driven either by market failures (information asymmetry with regards to the perception of quality of products) or by economic inefficiencies caused by government intervention (macroeconomic or sectoral).
Not every branch of the original tree is replicated in our analysis, but only the relevant candidates for the case of DRE. The rest of this section will describe the results of the analysis: possible constraints with be categorized as either “major constraint”, “intermediate constraint” and “not currently a constraint”. A summary of the analysis is provided in Figure 13.
Challenges for DRE expansion 22
11 Hausmann, Rodrik, and Velasco, “Growth Diagnostics”; Ricardo Hausmann, Bailey Klinger, and Rodrigo Wagner, “Doing Growth Diagnostics in Practice: A ‘Mindbook,’” CID Working Paper 177, 2008. 12 Alternatively, Pueyo (2018) developed a more detailed “Green Investment Diagnostics” to understand constraints to grid-connected renewable energy investment in Kenya and Ghana. The author finds using this framework that the constraints to investment in Ghana are “an unreliable off-taker, macroeconomic imbalances, regulatory uncertainty, pressures to keep prices low, as well as insufficient and costly domestic finance” whereas in Kenya it is “low demand, a lack of networking infrastructure and problems of governance and social acceptance, exacerbated by uncertain land property rights and rent-seeking” that prevent an expansion of grid renewables. With regards to the applicability of the author’s diagnostic tree towards Ethiopia’s DRE challenge, as the paper explicitly states, the constraints faced by off-grid investors are not the same in many respects than those faced by grid technologies and require a separate analysis. Cf. Ana Pueyo, “What Constrains Renewable Energy Investment in Sub-Saharan Africa? A Comparison of Kenya and Ghana,” World Development 109 (2018): 85–100.

Challenges for DRE expansion 23
Figure 12.Growth Diagnostics Tree for DRE
Figure 13.Growth Diagnostics Results
Access to International
Finance
Access to Finance
Low Social Return
Infrastructure Challenges
ICT Infrastructure
LogisticsHuman CapitalChallenges
Low Appropiability
Financial Intermediation
Currency Risk
Access to FX
Market Constraints
Information Asymmetry
Taxes and Import Tariffs
Political Stability
Regulatory Barriers to Entry
Currency Risk
Access To FX
Micro Challenges
Macro Challenges
Policy Constraints
High Cost Of Finance
Low Return
Low
In
vest
men
t
Access to Foreign Exchange
Regulatory Barriers to Entry
Currency Risk
ICT Infrastructure
Financial Intermediation
Information Asymmetry
Taxes and Import Tariffs
Insufficient Human Capital
Logistics
Political Stability
Major Constraints Intermediate Constraints Not Currently Constraints
3.1. Major Constraints Access to Foreign Exchange
“The biggest problem is access to currency. Not just importing the gear, but getting the money out.”13
“When Forex gets into our (domestic) account, it gets automatically converted to Birr. How do we pay our international partners? They don’t accept Birr. And managing a retention account is really a headache.” 14
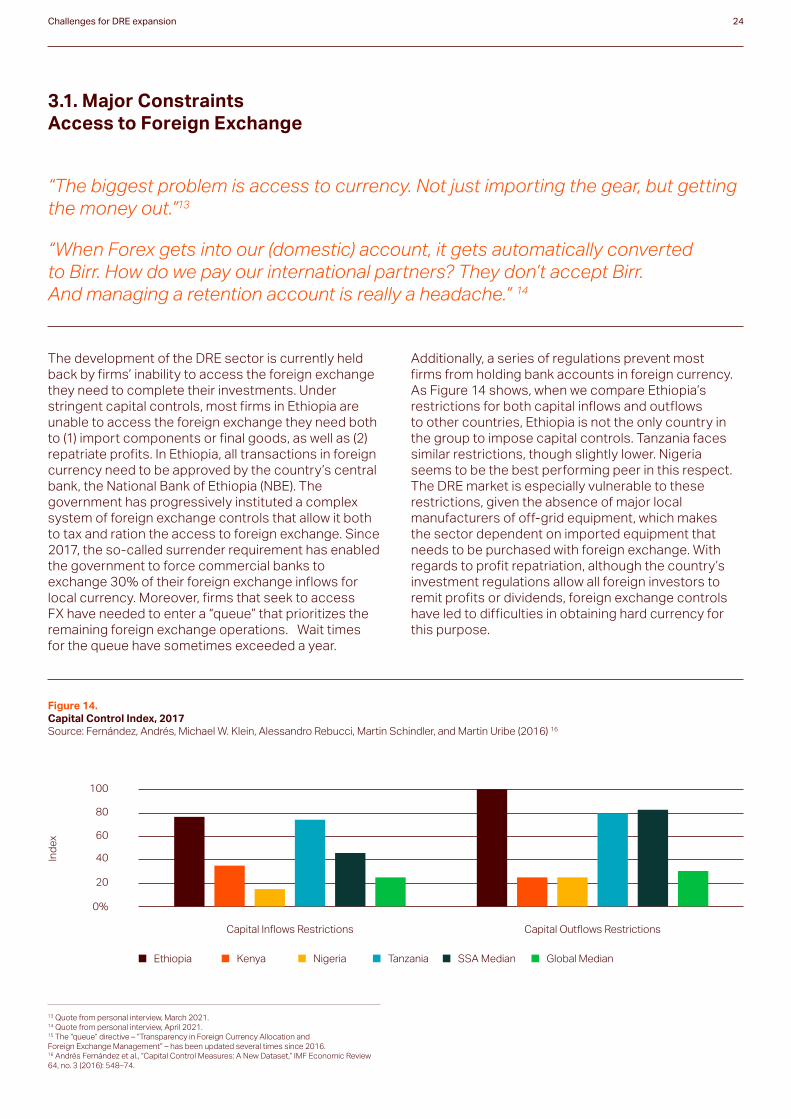
The development of the DRE sector is currently held back by firms’ inability to access the foreign exchange they need to complete their investments. Under stringent capital controls, most firms in Ethiopia are unable to access the foreign exchange they need both to (1) import components or final goods, as well as (2) repatriate profits. In Ethiopia, all transactions in foreign currency need to be approved by the country’s central bank, the National Bank of Ethiopia (NBE). The government has progressively instituted a complex system of foreign exchange controls that allow it both to tax and ration the access to foreign exchange. Since 2017, the so-called surrender requirement has enabled the government to force commercial banks to exchange 30% of their foreign exchange inflows for local currency. Moreover, firms that seek to access FX have needed to enter a “queue” that prioritizes the remaining foreign exchange operations. Wait times for the queue have sometimes exceeded a year.
Additionally, a series of regulations prevent most firms from holding bank accounts in foreign currency. As Figure 14 shows, when we compare Ethiopia’s restrictions for both capital inflows and outflows to other countries, Ethiopia is not the only country in the group to impose capital controls. Tanzania faces similar restrictions, though slightly lower. Nigeria seems to be the best performing peer in this respect. The DRE market is especially vulnerable to these restrictions, given the absence of major local manufacturers of off-grid equipment, which makes the sector dependent on imported equipment that needs to be purchased with foreign exchange. With regards to profit repatriation, although the country’s investment regulations allow all foreign investors to remit profits or dividends, foreign exchange controls have led to difficulties in obtaining hard currency for this purpose.
Challenges for DRE expansion 24
13 Quote from personal interview, March 2021.14 Quote from personal interview, April 2021.15 The “queue” directive – “Transparency in Foreign Currency Allocation and Foreign Exchange Management” – has been updated several times since 2016.16 Andrés Fernández et al., “Capital Control Measures: A New Dataset,” IMF Economic Review 64, no. 3 (2016): 548–74.
Figure 14.Capital Control Index, 2017 Source: Fernández, Andrés, Michael W. Klein, Alessandro Rebucci, Martin Schindler, and Martin Uribe (2016) 16
0%
20
40
60
80
100
Ind
ex
Capital Inflows Restrictions Capital Outflows Restrictions
Ethiopia Kenya Nigeria Tanzania SSA Median Global Median

Firms’ inability to access foreign exchange is ultimately the result of the economy’s macroeconomic imbalances and will require major reforms to be corrected.
The capital outflows restrictions and trade barriers that have prevented the DRE sector from expanding are ultimately merely the government’s response to the country’s macroeconomic imbalances that have intensified over the last decade. Ethiopia was forced to impose strong barriers to access foreign exchange as the country’s public investment-led development model, which had driven its growth acceleration since 2004, found its limit in the early 2010s. The economy’s incapacity to increase exports sufficiently to finance the country’s current account, and the lack of appropriate financing, resulted in persistent external imbalances. As Ethiopia reached a limit in its access to concessional lending in 2015, the country was forced to reduce its imports to cut losses in international reserves without devaluing its currency (Figure 15). Since then, the share of imports in the economy has contracted to a level the country had not seen since the early 1990s. Firms’ current difficulties in accessing
intermediate inputs are often thought to have caused the recent deceleration in GDP growth. Moreover, the relative decrease in imports eventually led to a fall in tax revenues as a share of GDP, which aggravated the country’s fiscal imbalances, in the context of a still ambitious public investment program. Through financial repression and monetary financing, the government has sought to continue financing its high levels of investment, but these policies have led to a crowding-out of the private sector and a sustained increase in inflation. The country’s current Homegrown Economic Reform Program (HER) and its IMF program have as main objectives to address these external and fiscal imbalances by reducing public sector borrowing, implementing exchange rate reform, and introducing regulatory reforms to crowd-in the private sector and transition from a public to a private sector-led economic growth model.17
Challenges for DRE expansion 25
17 International Monetary Fund, “2019 Article IV Consultation and Requests for Three-Year Arrangement under the Extended Credit Facility and an Arrangement under the Extended Fund Facility - Press Release and Staff Report,” IMF Country Report, 2020.
Image courtesy of SolarNow

To address the foreign exchange shortage’s impact on the development of the DRE sector, the government of Ethiopia as early as 2012 – in collaboration with the World Bank – created the Market Development Credit Line, with an initial funding of USD 20 M. The MDCL – managed by the DBE but supervised by MoWIE – was designed to provide necessary funding and foreign currency loans to DRE companies through two windows: (1) retail loans to Ethiopian private sector enterprises and SMEs with guaranteed access to FX for up to two year at 12% interest and (2) wholesale loans to Ethiopian MFIs in local currency for up to six years at 6% interest. The market line was expanded in 2017 with an additional USD 20 M in response to supply shortages, incorporating a USD 4.5 M collateral support facility guaranteeing up to 75% of loans and a new policy to allocate a larger share of funding to SHS (whereas the majority of the first phase had been destined to Pico systems). The MDCL financing was exhausted in 2019 and has led to a new foreign exchange shortage in the sector. The World Bank has currently approved a new program – Access to Distributed Electricity and Lighting in Ethiopia (ADELE) – to replace MDCL.
Challenges for DRE expansion 26
Figure 15.Imports of Goods and Services in Ethiopia Source: WDI
0 0%
5 10%
10 20%
15 30%
20 40%
1996
Bill
ions
2002 2006 2010 2014 20182004 2008 2012 20161998 2000
Imports of Goods and Services % of GDP, RHS
The Market Development Credit Line has provided DRE firms a channel to bypass the economy’s foreign exchange constraint but will have to be scaled for the sector to expand.
Image courtesy of Azuri

3.1 Major Constraints Regulatory Barriers to Entry
“Doing business is not really easy. There is too much administrative hassle, permits needed, certifications, etc. from several agencies. It’s not smooth. Foreign companies face even more limitations; they cannot import and re-sell, only manufacture or assemble locally.”18
Ethiopia has instituted stringent barriers to prevent foreign investors from fully participating in the DRE sector. Although the Government of Ethiopia has been gradually liberalizing its economy over the last three decades and opened its doors to private and foreign investment, a large share of the economy is still closed both to private and foreign participation. With regards to the DRE sector, the Investment Proclamation No. 1180/2020 and the Investment Regulation No. 474/2020 – the key investment legislative pieces in the country – reserves wholesale and retail trade to domestic investors (Ethiopian nationals, Ethiopian Diaspora and Foreign nationals recognized as domestic investors by special legislation). For the DRE sector, this implies that only local companies can obtain a license that allows them to import and distribute small off-grid solar lighting or systems. This legislation creates considerable problems for international players, which have a tight value-chain where retail is key to ensure profitable margins, and ultimately can result in end-use mark-ups, as the manufacturer is forced to raise its price to guarantee profitability. The legislation prevents key international actors from establishing operations in Ethiopia, implying negative externalities in terms of knowledge accumulation in the sector. Ethiopia’s legislation also inhibits investment of foreign companies in local partners, as the country’s regulations see as “foreign-owned” any company that has received foreign direct investment, and hence also closes the door to joint-ventures that could allow Ethiopia to preserve domestic control in the retail sector while also crowding in foreign knowhow and finance.
Additional barriers towards vertical integration have further limited the sector’s capacity to create competitive value chains. Ethiopia’s current business regulations prevent manufacturers in industrial parks from becoming wholesale or retail distributors. This implies that although it has been at many times suggested that content which cannot be imported to do the FX shortage should be locally produced, there are further constraints to develop a profitable
enterprise in producing this equipment. Moreover, not even local companies can also act both as wholesale and retail suppliers. These regulations in practice make the vertical integration that is typical of the value-chain impossible and put constraints on developing the business models that have been successful elsewhere in the continent.
Finally, difficulties obtaining different types of licensing have been observed in practice. Preexisting studies and interviews consistently point to a complicated and lengthy process of licensing, particularly for distribution and sale licenses in the mini-grid sector with EEA, which can take from 6 months up to more than a year. The EEA has drafted a new mini-grid regulation, but it is too early to know whether this will fully address problems. Similarly, pay-as-you-go operators are required to obtain financing licenses from the NBE, as they are considered financial institutions within current regulations. To tackle this challenge, the NBE released in March 2020 a new directive (ONPS/01/2020) that creates a new framework for “digital financial service providers” (fintech). Nevertheless, the directive has had a mixed reception, given its high capital requirements (ETB 50 M) and limits to foreign-ownership. Finally, regional states require additional licensing verification which multiply the number of procedures required by firms operating in the sector, without an evident increase in product quality.
Unfriendly investor legislation is not Ethiopia-specific. Tanzania, one of the worst performers in the World Bank’s Doing Business rankings, has recently adoptive aggressive tax measures and other legislative barriers (including regulation to limit foreign hiring).
Challenges for DRE expansion 27
18 Quote from personal interview, April 2021.
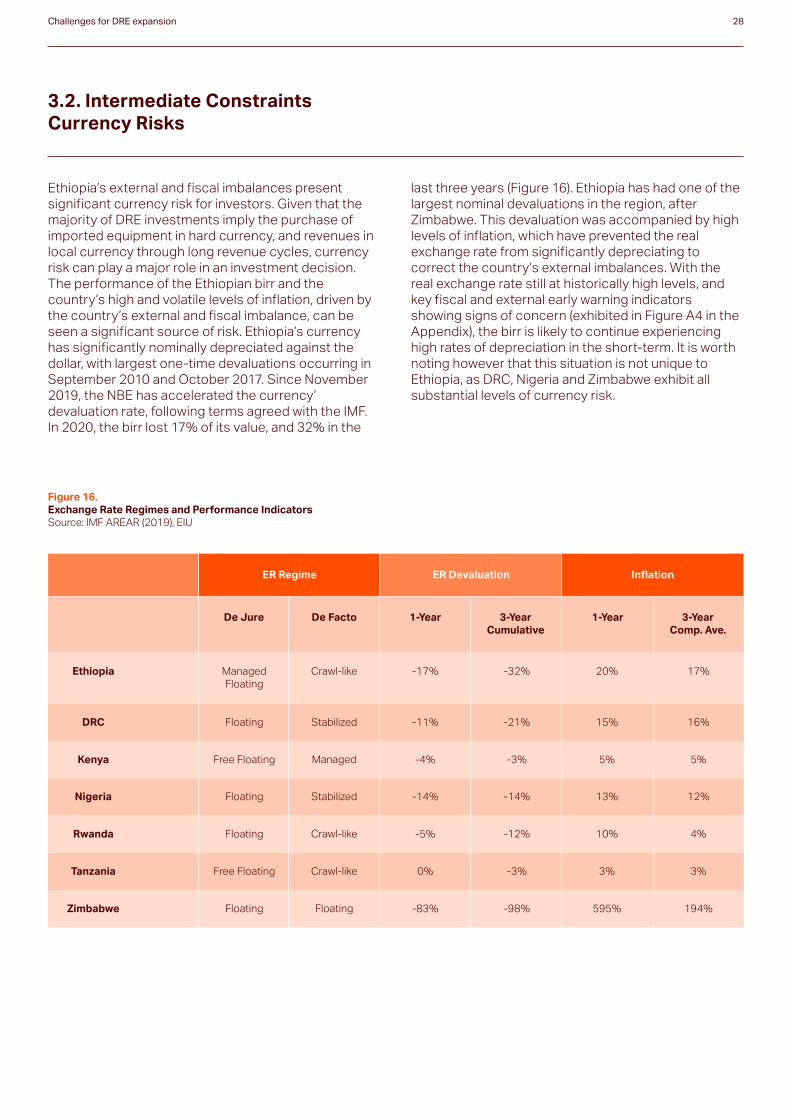
3.2. Intermediate Constraints Currency Risks
Ethiopia’s external and fiscal imbalances present significant currency risk for investors. Given that the majority of DRE investments imply the purchase of imported equipment in hard currency, and revenues in local currency through long revenue cycles, currency risk can play a major role in an investment decision. The performance of the Ethiopian birr and the country’s high and volatile levels of inflation, driven by the country’s external and fiscal imbalance, can be seen a significant source of risk. Ethiopia’s currency has significantly nominally depreciated against the dollar, with largest one-time devaluations occurring in September 2010 and October 2017. Since November 2019, the NBE has accelerated the currency’ devaluation rate, following terms agreed with the IMF. In 2020, the birr lost 17% of its value, and 32% in the
last three years (Figure 16). Ethiopia has had one of the largest nominal devaluations in the region, after Zimbabwe. This devaluation was accompanied by high levels of inflation, which have prevented the real exchange rate from significantly depreciating to correct the country’s external imbalances. With the real exchange rate still at historically high levels, and key fiscal and external early warning indicators showing signs of concern (exhibited in Figure A4 in the Appendix), the birr is likely to continue experiencing high rates of depreciation in the short-term. It is worth noting however that this situation is not unique to Ethiopia, as DRC, Nigeria and Zimbabwe exhibit all substantial levels of currency risk.
Challenges for DRE expansion 28
Figure 16.Exchange Rate Regimes and Performance Indicators Source: IMF AREAR (2019), EIU
ER Regime ER Devaluation Inflation
Ethiopia
De Jure 1-Year 1-YearDe Facto 3-Year Cumulative
3-Year Comp. Ave.
DRC
Nigeria
Tanzania
Kenya
Rwanda
Zimbabwe
Managed Floating
Floating
Floating
Free Floating
Free Floating
Floating
Floating
-17%
-11%
-14%
0%
-4%
-5%
-83%
20%
15%
13%
3%
5%
10%
595%
Crawl-like
Stabilized
Stabilized
Crawl-like
Managed
Crawl-like
Floating
-32%
-21%
-14%
-3%
-3%
-12%
-98%
17%
16%
12%
3%
5%
4%
194%
3.2. Intermediate Constraints ICT Infrastructure
3.2. Intermediate Constraints Financial Intermediation
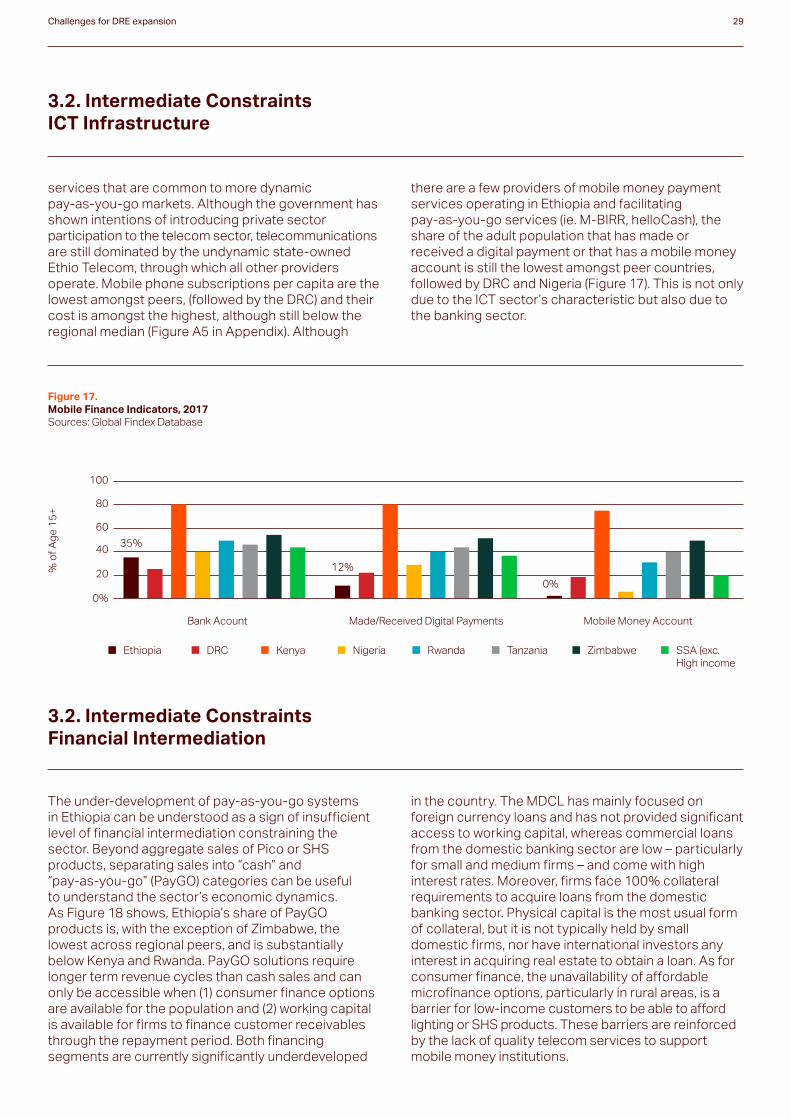
services that are common to more dynamic pay-as-you-go markets. Although the government has shown intentions of introducing private sector participation to the telecom sector, telecommunications are still dominated by the undynamic state-owned Ethio Telecom, through which all other providers operate. Mobile phone subscriptions per capita are the lowest amongst peers, (followed by the DRC) and their cost is amongst the highest, although still below the regional median (Figure A5 in Appendix). Although
there are a few providers of mobile money payment services operating in Ethiopia and facilitating pay-as-you-go services (ie. M-BIRR, helloCash), the share of the adult population that has made or received a digital payment or that has a mobile money account is still the lowest amongst peer countries, followed by DRC and Nigeria (Figure 17). This is not only due to the ICT sector’s characteristic but also due to the banking sector.
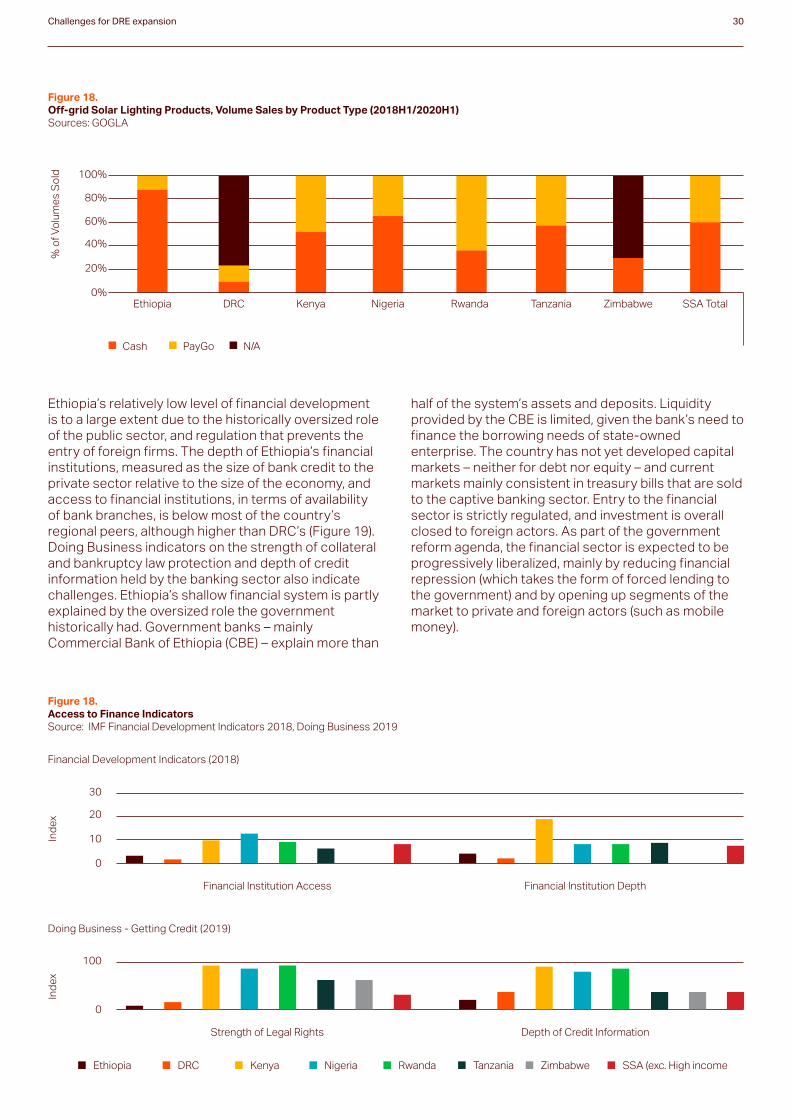
The under-development of pay-as-you-go systems in Ethiopia can be understood as a sign of insufficient level of financial intermediation constraining the sector. Beyond aggregate sales of Pico or SHS products, separating sales into “cash” and “pay-as-you-go” (PayGO) categories can be useful to understand the sector’s economic dynamics. As Figure 18 shows, Ethiopia’s share of PayGO products is, with the exception of Zimbabwe, the lowest across regional peers, and is substantially below Kenya and Rwanda. PayGO solutions require longer term revenue cycles than cash sales and can only be accessible when (1) consumer finance options are available for the population and (2) working capital is available for firms to finance customer receivables through the repayment period. Both financing segments are currently significantly underdeveloped
in the country. The MDCL has mainly focused on foreign currency loans and has not provided significant access to working capital, whereas commercial loans from the domestic banking sector are low – particularly for small and medium firms – and come with high interest rates. Moreover, firms face 100% collateral requirements to acquire loans from the domestic banking sector. Physical capital is the most usual form of collateral, but it is not typically held by small domestic firms, nor have international investors any interest in acquiring real estate to obtain a loan. As for consumer finance, the unavailability of affordable microfinance options, particularly in rural areas, is a barrier for low-income customers to be able to afford lighting or SHS products. These barriers are reinforced by the lack of quality telecom services to support mobile money institutions.
Challenges for DRE expansion 29
Figure 17.Mobile Finance Indicators, 2017 Sources: Global Findex Database
0%
20
4035%
12%
0%
60
80
100
% o
f Ag
e 1
5+
Bank Acount Made/Received Digital Payments Mobile Money Account
Ethiopia DRC Kenya Nigeria Rwanda Tanzania Zimbabwe SSA (exc. High income
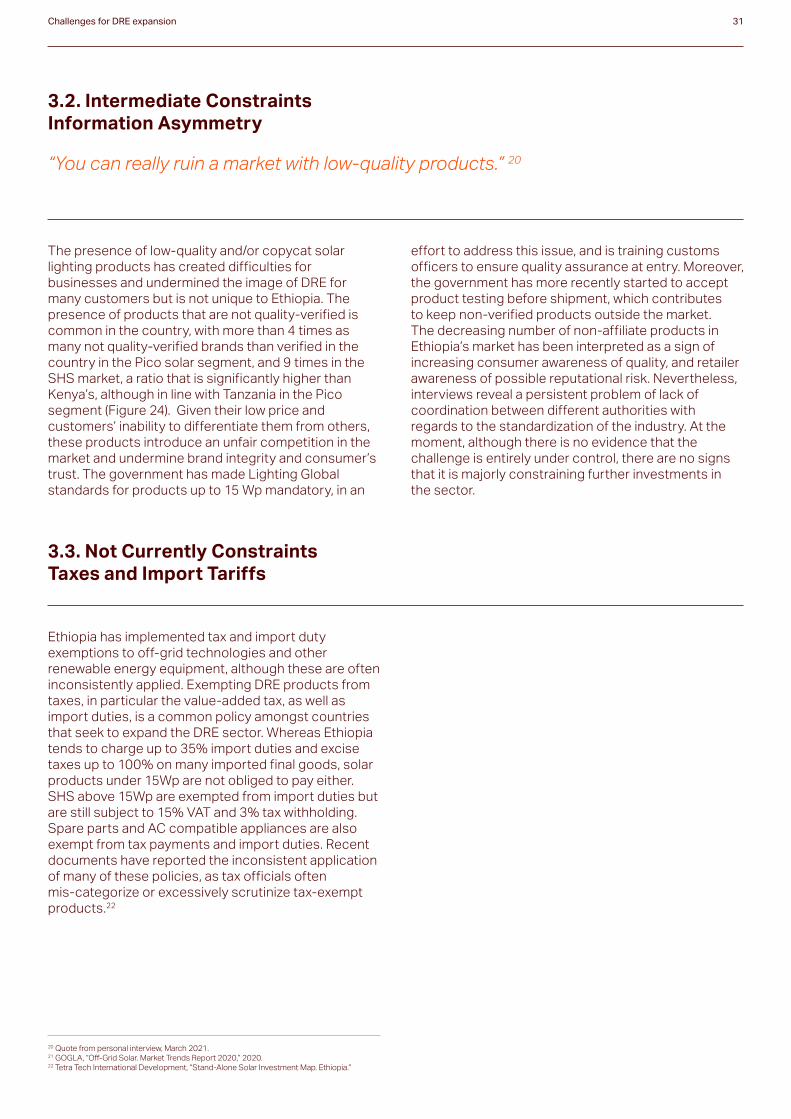
Ethiopia’s relatively low level of financial development is to a large extent due to the historically oversized role of the public sector, and regulation that prevents the entry of foreign firms. The depth of Ethiopia’s financial institutions, measured as the size of bank credit to the private sector relative to the size of the economy, and access to financial institutions, in terms of availability of bank branches, is below most of the country’s regional peers, although higher than DRC’s (Figure 19). Doing Business indicators on the strength of collateral and bankruptcy law protection and depth of credit information held by the banking sector also indicate challenges. Ethiopia’s shallow financial system is partly explained by the oversized role the government historically had. Government banks – mainly Commercial Bank of Ethiopia (CBE) – explain more than
half of the system’s assets and deposits. Liquidity provided by the CBE is limited, given the bank’s need to finance the borrowing needs of state-owned enterprise. The country has not yet developed capital markets – neither for debt nor equity – and current markets mainly consistent in treasury bills that are sold to the captive banking sector. Entry to the financial sector is strictly regulated, and investment is overall closed to foreign actors. As part of the government reform agenda, the financial sector is expected to be progressively liberalized, mainly by reducing financial repression (which takes the form of forced lending to the government) and by opening up segments of the market to private and foreign actors (such as mobile money).
Challenges for DRE expansion 30
Figure 18.Off-grid Solar Lighting Products, Volume Sales by Product Type (2018H1/2020H1)Sources: GOGLA
0%
20%
% o
f Vo
lum
es S
old
40%
60%
80%
100%
NigeriaDRCEthiopia Kenya SSA TotalTanzaniaRwanda Zimbabwe
Cash PayGo N/A
Figure 18.Access to Finance Indicators Source: IMF Financial Development Indicators 2018, Doing Business 2019
0
10
20
30
Financial Development Indicators (2018)
Ind
ex
Financial Institution Access Financial Institution Depth
Ethiopia DRC Kenya Nigeria Rwanda Tanzania Zimbabwe SSA (exc. High income
0
100
Doing Business - Getting Credit (2019)
Ind
ex
Strength of Legal Rights Depth of Credit Information
3.2. Intermediate Constraints Information Asymmetry
3.3. Not Currently Constraints Taxes and Import Tariffs
“You can really ruin a market with low-quality products.” 20
The presence of low-quality and/or copycat solar lighting products has created difficulties for businesses and undermined the image of DRE for many customers but is not unique to Ethiopia. The presence of products that are not quality-verified is common in the country, with more than 4 times as many not quality-verified brands than verified in the country in the Pico solar segment, and 9 times in the SHS market, a ratio that is significantly higher than Kenya’s, although in line with Tanzania in the Pico segment (Figure 24). Given their low price and customers’ inability to differentiate them from others, these products introduce an unfair competition in the market and undermine brand integrity and consumer’s trust. The government has made Lighting Global standards for products up to 15 Wp mandatory, in an
effort to address this issue, and is training customs officers to ensure quality assurance at entry. Moreover, the government has more recently started to accept product testing before shipment, which contributes to keep non-verified products outside the market. The decreasing number of non-affiliate products in Ethiopia’s market has been interpreted as a sign of increasing consumer awareness of quality, and retailer awareness of possible reputational risk. Nevertheless, interviews reveal a persistent problem of lack of coordination between different authorities with regards to the standardization of the industry. At the moment, although there is no evidence that the challenge is entirely under control, there are no signs that it is majorly constraining further investments in the sector.
Ethiopia has implemented tax and import duty exemptions to off-grid technologies and other renewable energy equipment, although these are often inconsistently applied. Exempting DRE products from taxes, in particular the value-added tax, as well as import duties, is a common policy amongst countries that seek to expand the DRE sector. Whereas Ethiopia tends to charge up to 35% import duties and excise taxes up to 100% on many imported final goods, solar products under 15Wp are not obliged to pay either. SHS above 15Wp are exempted from import duties but are still subject to 15% VAT and 3% tax withholding. Spare parts and AC compatible appliances are also exempt from tax payments and import duties. Recent documents have reported the inconsistent application of many of these policies, as tax officials often mis-categorize or excessively scrutinize tax-exempt products.22
Challenges for DRE expansion 31
20 Quote from personal interview, March 2021.21 GOGLA, “Off-Grid Solar. Market Trends Report 2020,” 2020.22 Tetra Tech International Development, “Stand-Alone Solar Investment Map. Ethiopia.”
Insufficient Human Capital
Logistics
Political Stability
The need of skills upgrading to support the development of the off-grid sector is mentioned in recent reports and interviews, but it is unlikely to be currently binding for the sector. Taking DRE to rural communities requires the development of specific human capital or skills related to the design, maintenance and operation of systems. Moreover, successfully expanding the coverage of mini-grids will also require building a new skill set in public institutions
such as EEU. The lack of the required technical training in Ethiopia implies an overall low set of skills in the sector, and the need for companies to pay for their worker’s training.23 However, it is not evident that these skills were available in regional peers or other countries that have undergone similar transformation as Ethiopia, and hence their current stage of development is likely to be not binding at the current stage.
Although Ethiopia’s trade logistics present operational inefficiencies that could be constraining private investment in various sectors, the absence of an efficient logistics ecosystem does not appear to be binding investment in DRE. Given the importance of imported inputs in the DRE value-chain, uncompetitive logistics could constitute an oversized burden for the sector. Ethiopia’s logistic sector has often been characterized as not growing fast enough to meet a rapidly increasing demand. An expanded economy has outgrown the country’s inland transportation infrastructure and the country’s connections to the port of Djibouti. Ethiopia remains below most of its regional peers in the World Bank’s Logistic Performance Indicators, in particular with regards to issues such as the ease of arranging competitively priced international shipments, the quality of transport infrastructure, the quality of logistics services, and the ability of track and trace shipments. Nevertheless, quality of logistics services does not appear at the moment to be currently binding for the sector, as the issues is not considered salient neither in qualitative studies nor interviews.
Contrary to assumptions about development across the region, political instability has not been a binding constraint to the development of the DRE sector in Ethiopia. Political instability in Ethiopia has been high throughout the country’s economic expansion through the last two decades, and hence is unlikely to have
prevented it, according to the World Governance Indicators. Foreign investment flows have not been majorly responsive so far to political changes. Nevertheless, the trend may change due to the rising difficulties of operating across the region, and potentially increasing political uncertainty.
Challenges for DRE expansion 32
23 Overseas Development Institute, “Accelerating Access to Electricity in Africa with off Grid Solar,” 2016.
Image courtesy of Oolu
36 Executive Summary
04 TRANSFORMING ETHIOPIA’S DRE
INVESTMENT CLIMATE
A sustainable transformation of Ethiopia’s DRE investment climate will require long-term macroeconomic and structural reforms that are outside the realm of energy policy.
The binding constraints to the development of the DRE sector that this report has identified are not within the scope of action of the institutions that lead the electricity sector in Ethiopia. Removing the foreign exchange constraint through a correction of external and fiscal imbalances is within the scope of macroeconomic policymakers and cannot be facilitated by MoWIE or EEA. Opening the economy to more private and foreign investment will require not only changing current investment legislation but an unprecedented regulatory transformation in sectors such as banking and ICT, for these sectors to ease access to finance and support more varied digital payments. Addressing these constraints is necessary for the construction of an enabling environment that is suitable for the type of investments needed for the development of the DRE sector.
Nevertheless, the country’s energy institutions can still promote policies to bypass current constraints in the short-term and accelerate the growth of the DRE sector. Ethiopia’s past policy successes and other regional experiences provide instructive examples of how sectoral policy can indeed create pockets of efficiency for the development of DRE without needing to address macroeconomic or other structural challenges. Taking stock of past policy performance in Ethiopia, as well as past and current policies in the peer countries, the following areas present significant opportunity for sector expansion at a relatively low risk, not only in Ethiopia, but in other countries facing similar constraints:
Transforming Ethiopia’s DRE Investment Climate 34
Image courtesy of REDAVIA
01. Expansion/introduction of programs such as the Market Development Credit Line (based on Ethiopia’s experience).
02. Market-based Incentives for Investment (based on experiences in Kenya and Nigeria).
The MDCL, an energy-specific credit line, has proven to be very successful in alleviating the foreign exchange constraint for firms and increasing the number of participating private sector companies and microfinance institutions (the two direct beneficiaries of the credit) in the market. The oversubscription of the credit line, the absence of non-performing loans and the program’s operative performance provide enough evidence of the policy’s success in bypassing the economy’s most binding constraint. Additionally, interviews with private sector companies also indicated that the MDCL is the most efficient temporary fix for the foreign exchange shortage.
Expanding the program for it to meet the current demand for Pico and SHS systems, especially in rural areas, is necessary to maintain the sector’s growth and mitigate the negative effects of COVID-19 by
helping to reactivate the economy. A new MDCL would ideally provide not only hard currency loans but also other types of financing products that are in demand in the market, such as working capital, as well as loan guarantees.
In addition, a new loan program with the World Bank (or any other IFI) would also guarantee valuable technical assistance. It is worth mentioning that, while this particular program is Ethiopia-specific, World Bank credit lines for underserved market segments are not new and have also proven successful in other countries and sectors. For instance, since 2012 the Women Entrepreneurship Development Project (WEDP) has disbursed more than USD 170 million in credit to over 40,000 women-owned enterprises in Ethiopia (most of which had no access to credit before).
Regional electricity access expansion programs have increasingly included facilities for result-based financing (RBF) that competitively award incentives to companies according to their financing requirements. There are two good examples in the region:
a. Kenya Off-Grid Solar Access Project (KOSAP): as part of Kenya’s 2022 universal electrification target the Ministry of Energy, financed by the World Bank, launched KOSAP. It is a result-based financing approach that aims to provide electricity to 1.3 million people (in over 270,000 households) that live in remote, low-density and underserved locations. This project entails substantial private sector participation, in collaboration with the public sector, by providing private companies incentives to sell solar and cooking solutions in specified areas. An interesting feature of the RBF approach is that it pays only upon (successful) delivery, making the private sector take full risk until the end. KOSAP is being implemented in four stages, starting with mini-grids for Community Facilities, Enterprises, and Households (where mini-grids have been estimated to be the least cost alternative), during a 5-year period (2018-2023).
b. Nigeria’s minimum-subsidy tender for mini-grid development, launched in 2019 by the country’s Rural Electrification Agency (REA), is another successful example of a program that has implemented market-based subsidies. The aim, also within the National electrification plan, is to deploy mini-grids at scale. There are 250 sites tendered, and the mini-grid developers compete both in quality (through a technical proposal) and price to build and operate in those sites. The REA only provides subsidies to the best proposers. The grants for the developers are only disbursed after it is verified that all customers have been connected and receive a good service.
The World Bank has recently (March 2021) approved the Access to Distributed Electricity and Lighting in Ethiopia (ADELE) project, a USD 500 M credit facility for both off-grid and urban on-grid electrification which includes both of these components under its umbrella. ADELE will focus on DRE technologies, particularly PV mini-grids, for household and productive use. This program provides a great opportunity the Ethiopia to test results-based financing in the private sector, especially at the deployment stage.
Transforming Ethiopia’s DRE Investment Climate 35
The possibility of using mobile money to provide people with an option to purchase off-grid solar equipment through remittance income has often been brought up in sectoral reports.24 While mobile money is not widely utilized (less than 3% of the population has access to it), remittances can be received in those accounts. Remittances in low income countries are the largest source of external financing. However, according to the World Bank, high and growing, remittances in SSA are the most expensive in the World, due to very high transfer fees. Nonetheless, Ethiopia’s large diaspora can help alleviate the foreign exchange shortage by providing hard currency. Remittances peaked in 2014, representing 3.3% of the national GDP, but are currently less than 1%. These numbers, however, are misleading, as a significant share of remittances in Ethiopia is received through informal channels. This is due, to a great extent, to the overvaluation of the real exchange rate and the gap between the official exchange rate and the illegal parallel exchange rate. The possibility of accessing solar lighting products through remittance inflows can allow households to bypass the foreign exchange shortage without additional cost to the government in terms of foreign exchange. In addition, it will also incentivize the formalization of remittances.
A pilot for remittance-based funding was launched by BBOXX and the Shell Foundation in Rwanda recently, showing significant potential. The idea is that those living abroad, instead of sending money and paying the transfer fees, can directly purchase solar home systems and appliances for local households and family members. There are no fees, and discounts are offered, as high as 33% relative to the regular domestic pay as you go prices. A program like this, which combines energy and appliances, illustrates an excellent mechanism for stimulating demand to achieve faster electrification. Appliance use and finance can be an effective tool, especially in rural areas, to increase productivity, employment and output through productive use of energy.
Transforming Ethiopia’s DRE Investment Climate 36
Image courtesy of Oolu
03. Remittance-based Financing (based on Rwanda’s experience).
24 Power Africa, “Off-Grid Solar Market Assessment. Ethiopia,” 2019.
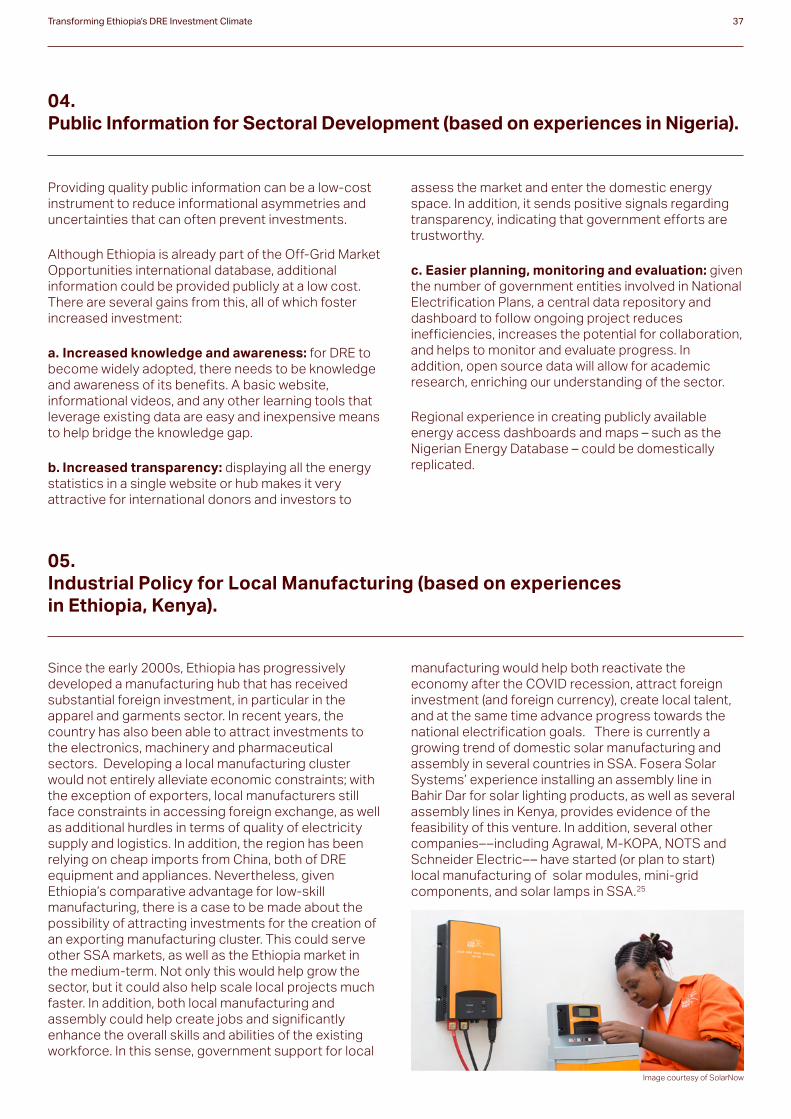
04. Public Information for Sectoral Development (based on experiences in Nigeria).
05. Industrial Policy for Local Manufacturing (based on experiences in Ethiopia, Kenya).
Providing quality public information can be a low-cost instrument to reduce informational asymmetries and uncertainties that can often prevent investments.
Although Ethiopia is already part of the Off-Grid Market Opportunities international database, additional information could be provided publicly at a low cost. There are several gains from this, all of which foster increased investment:
a. Increased knowledge and awareness: for DRE to become widely adopted, there needs to be knowledge and awareness of its benefits. A basic website, informational videos, and any other learning tools that leverage existing data are easy and inexpensive means to help bridge the knowledge gap.
b. Increased transparency: displaying all the energy statistics in a single website or hub makes it very attractive for international donors and investors to
assess the market and enter the domestic energy space. In addition, it sends positive signals regarding transparency, indicating that government efforts are trustworthy.
c. Easier planning, monitoring and evaluation: given the number of government entities involved in National Electrification Plans, a central data repository and dashboard to follow ongoing project reduces inefficiencies, increases the potential for collaboration, and helps to monitor and evaluate progress. In addition, open source data will allow for academic research, enriching our understanding of the sector.
Regional experience in creating publicly available energy access dashboards and maps – such as the Nigerian Energy Database – could be domestically replicated.
Since the early 2000s, Ethiopia has progressively developed a manufacturing hub that has received substantial foreign investment, in particular in the apparel and garments sector. In recent years, the country has also been able to attract investments to the electronics, machinery and pharmaceutical sectors. Developing a local manufacturing cluster would not entirely alleviate economic constraints; with the exception of exporters, local manufacturers still face constraints in accessing foreign exchange, as well as additional hurdles in terms of quality of electricity supply and logistics. In addition, the region has been relying on cheap imports from China, both of DRE equipment and appliances. Nevertheless, given Ethiopia’s comparative advantage for low-skill manufacturing, there is a case to be made about the possibility of attracting investments for the creation of an exporting manufacturing cluster. This could serve other SSA markets, as well as the Ethiopia market in the medium-term. Not only this would help grow the sector, but it could also help scale local projects much faster. In addition, both local manufacturing and assembly could help create jobs and significantly enhance the overall skills and abilities of the existing workforce. In this sense, government support for local
manufacturing would help both reactivate the economy after the COVID recession, attract foreign investment (and foreign currency), create local talent, and at the same time advance progress towards the national electrification goals. There is currently a growing trend of domestic solar manufacturing and assembly in several countries in SSA. Fosera Solar Systems’ experience installing an assembly line in Bahir Dar for solar lighting products, as well as several assembly lines in Kenya, provides evidence of the feasibility of this venture. In addition, several other companies––including Agrawal, M-KOPA, NOTS and Schneider Electric–– have started (or plan to start) local manufacturing of solar modules, mini-grid components, and solar lamps in SSA.25
Transforming Ethiopia’s DRE Investment Climate 37
Image courtesy of SolarNow

APPENDICES

Appendix 01. Additional Figures
Appendices 39
Figure A1.Demographic, Economic and Sectoral Characteristics Source: IMF Financial Development Indicators 2018, Doing Business 2019
25 See https://www.powerforall.org/news-media/articles/local-manufacturing-next-frontier-sdg7
KENCODETH ZWETZARWANGA
Population Density (people per sq. km. of land area)
GDP per capita, 2019 (constant 2000 USD)
Ave. GDP Growth Rate (%, 2014-2019)
Electricity Consumption per Capita (kWh)
Electricity per Capita Growth (2013-2018)
Demographic
Economic
Economic
Populations (M)
Electricity Access (% of Pop.)
Pop. Without Access (M)
Firms with Outages (%)
Urban Population (%)
– Rural
– Rural
– Firms with Generators (%)
Population Growth (%)
– Urban
– Urban
– Outages per Month
112
46.7
59.8
80 (2015)
21
33.5
58.8
49.1
97
603
9.3
83.2
4.4
2.6
96
0.9
8.2
87
8.7
79.1
89.3 (2013)
45
1
47.4
59.5
37
424
5.6
103.5
-2.5
3.2
19
31.7
12.3
53
84.5
8.3
82.8 (2018)
28
78.6
8.2
65.8
90
1,237
5.6
179.9
2.2
2.3
99
0.1
3.8
201
61.6
77.4
77.6 (2014)
51
30.4
68.5
70.7
215
2,374
2.0
157.4
1.9
2.6
91.4
8.8
32.8
13
52.6
6.2
39 (2019)
17
47.7
5.6
33.8
499
901
6.7
55.032
8.4
2.6
76
0.5
2.4
58
39.5
35.0
85.8 (2013)
35
23.1
29.0
43
64
985
6.4
108.7
1.4
3.0
71.5
6.0
8.9
15
53.1
7.0
76.5 (2016)
32
36.2
6.5
62.3
37
1,183
2.9
601.6
-0.9
1.4
8.8
0.5
4.5

Appendices 40
Figure A2.Frameworks for Mini-Grids and Stand-Alone Systems (2019) Source: ESMAP Regulatory Indicators for Sustainable Energy
KENCODETH ZWETZARWANGA
Are minigrids legally allowed to operate in the country?
If yes, is there clear eligibility criteria for subsidies?
Can minigrids be owned and operated by private operators?
Are there clear licensing procedures for minigrid operators and consumers?
Do the regulations differ by size of minigrids?
Are technical standards made publicly available?
Are these safety standards made publicly available?
Are there programs which aim to develop minigrid systems or support the development of minigrids systems?
Are there national programs which aim to develop stand-alone systems or support the development of stand-alone systems?
Do the regulations clarify what will occur when the interconnected grid reaches a minigrid?
Are there technical standards detailing the requirements for minigrids to connect the grid?
Are there safety standards for minigrids (e.g. overcurrent protection, system control, etc.)?
Has the government adopted international quality standards for stand-alone systems?
Are there environmental regulations on the disposal of solar devices and standalone home system products or components?
Are minigrid operators legally allowed to charge a cost-reflective tariff, even if it is different from the national tariff?
Are there publicly funded mechanisms to secure viability gap funding for operators?
Are there duty exemptions and/or capital subsidies for minigrid systems and/or individual components?
Are there specific financing facilities (access to credit etc.) available to support operators?
Are there duty exemptions and/or subsidies to support standalone home systems?
Are there specific financing facilities available to support operators/consumers to develop/ purchase standalone home systems?
Are there legal restrictions that limit the prices standalone home system retailers or service providers can charge?
Existence of National Program
Legal framework for minigrids operation
Standards and quality
Ability to charge cost-reflective tariffsFinancial incentives
Yes
No
Yes
No
No
No
No
Yes
Yes
Yes
No
No
Yes
No
Yes
Yes
Yes
Yes
Yes
Yes
No
Yes
No
Yes
Yes
Yes
No
No
Yes
No
No
No
No
No
Yes
Yes
No
Yes
No
No
No
No
Yes
No
Yes
Yes
Yes
Yes
Yes
Yes
Yes
Yes
Yes
Yes
Yes
Yes
Yes
No
Yes
No
Yes
Yes
No
Yes
Yes
Yes
Yes
Yes
Yes
Yes
Yes
Yes
Yes
Yes
Yes
No
No
Yes
Yes
Yes
Yes
Yes
Yes
No
Yes
Yes
Yes
Yes
Yes
Yes
Yes
Yes
Yes
Yes
Yes
Yes
Yes
No
Yes
Yes
Yes
Yes
Yes
Yes
Yes
Yes
No
Yes
Yes
Yes
Yes
Yes
Yes
Yes
Yes
Yes
Yes
Yes
No
Yes
Yes
Yes
Yes
Yes
Yes
No
Yes
No
Yes
Yes
Yes
Yes
Yes
Yes
Yes
Yes
Yes
Yes
Yes
No
Yes
No
Yes
No
Yes
Yes
No

Appendices 41
Figure A3.Illustrative Growth Diagnostics Tree, as applied to any country, market or sector Source: Hausman, Rodrik and Velasco (2008)
Bad International
Finance
Bad Local Finance
Low Social Return
Low Human Capital
Poor Infrastructure
Low Appropiability
Low Savings
Low Savings
Market Failures
Micro Risks
Macro Risks
Government Failure
High Cost Of Finance
Low Return
Low
In
vest
men
t

Appendices 42
Figure A4.Currency Risk Fundamentals, 2020 Source: Economist Intelligence Unit
Figure A5.Mobile Phones Subscriptions (2019) and Price of 1 GB (2020) Source: World Bank World Development Indicators, Cable.co.uk
KENCODETH ZWETZARWANGA
EIU Currency Risk
Inflation
Loan to Deposit Ratio
Fiscal Balance (% of GDP)
Debt Interest Paid/Exports
Current Account (% of GDP)
Reserves Import Cover (Months)
Current Account minus FDI (% of GDP)
Currency Volatility (2000-2019)
Interest Rate Differential, 2020
CC
20.10
5.50
-5.90
4.90
-6.80
1.40
-4.80
0.49
7.35
CCC
14.60
24.40
-3.00
0.50
-4.10
0.50
-2.30
0.59
5.45
B
5.35
4.40
-8.10
10.00
-4.80
5.40
-3.60
0.14
7.05
CCC
13.20
10.10
-3.72
1.90
-3.94
6.13
-3.34
0.42
4.25
N/A
9.90
10.80
-8.60
5.90
-10.90
4.30
-8.90
0.23
4.35
B
3.29
10.00
-1.00
3.60
-1.40
6.40
-0.40
0.32
6.05
C
595.10
15.00
-4.70
3.00
-1.40
0.10
-0.40
2.87
24.35
0 0
20 1
Mo
bile
Pho
ne
Sub
scrip
tions
US
D
40 2
60 3
80 4
100 5
NigeriaDRCEthiopia Kenya SSA Median
TanzaniaRwanda Zimbabwe
Mobile Phone Subscritions, 2019 (per 100 people) Price of 1 GB, 2020 (USD)
Appendix 02. Bibliography
African Development Bank. “Revisiting Reforms in the Power Sector in Africa,” 2019.
Fernández, Andrés, Michael W. Klein, Alessandro Rebucci, Martin Schindler, and Martin Uribe. “Capital Control Measures: A New Dataset.” IMF Economic Review 64, no. 3 (2016): 548–74.
GOGLA. “Off-Grid Solar. Market Trends Report 2020,” 2020.
Hausmann, Ricardo, Bailey Klinger, and Rodrigo Wagner. “Doing Growth Diagnostics in Practice: A ‘Mindbook,’” CID Working Paper 177, 2008.
Hausmann, Ricardo, Dani Rodrik, and Andrés Velasco. “Growth Diagnostics.” The Washington Consensus Reconsidered: Towards a New Global Governance, 2008, 324–55.
International Monetary Fund. “2019 Article IV Consultation and Requests for Three-Year Arrangement under the Extended Credit Facility and an Arrangement under the Extended Fund Facility - Press Release and Staff Report.” IMF Country Report, 2020.
IPE Global Limited. “Ethiopian Regulatory Environment and Capacity Constraints in Off-Grid Energy Sector,” 2020.
Overseas Development Institute. “Accelerating Access to Electricity in Africa with off Grid Solar,” 2016.
Power Africa. “Off-Grid Solar Market Assessment. Ethiopia,” 2019.
Pueyo, Ana. “What Constrains Renewable Energy Investment in Sub-Saharan Africa? A Comparison of Kenya and Ghana.” World Development 109 (2018): 85–100.
Tetra Tech International Development. “Stand-Alone Solar Investment Map. Ethiopia,” 2021.
Wood Mackenzie. “Strategic Investments in Off-Grid Energy Access. Scaling the Utility of the Future for the Last Mile,” 2019.
World Bank. Ethiopia: Priorities for Ending Extreme Poverty and Promoting Shared Prosperity, 2016.
Appendices 43

Pioneering Green Partnerships,Investing in Impact
For further information about this report and Energise Africa, contact Isona Shibata: [email protected]
powerforall.org energiseafrica.com p4gpartnerships.org