cat risks: uncertainties and optimization - confex · >case study + uryasevportfolio ... >...
TRANSCRIPT

CAT Risks: Uncertainties and
Optimization
Ming Li, Ph.D., P.E., M. ASCE
Tokio Marine Technologies LLC
Presented at
2012 In Focus: Taming Cats in Baltimore, MD.

CONFIDENTIAL
Agenda
+ CAT Model Uncertainties
+ CAT Model Adjustments
+ Heuristic Portfolio Optimization
> Methodology
> Case Study
+ Uryasev Portfolio Optimization
> Algorithm
> Case Study
2

CONFIDENTIAL
CAT Modeling Framework
+ CAT models > science module
> engineering module
> financial module
+ Each module has two sub-
components> Data
> Idealization
+ Each component has uncertainties> Aleatory Uncertainty is related to
variability in the underlying natural phenomena
> Epistemic Uncertainty is related to limited data, measurement error, incomplete knowledge, imperfect models, and subjective judgment

CONFIDENTIAL
Modeling Uncertainties
0
0.02
0.04
0.06
0.08
0.1
0.12
1 10 100 1000 10000
+ Primary Uncertainties> Related to natural hazard
> Simulation Approach
• Uncertainties using probability distribution
• Model extremely complex processes
> Logic Tree Approach
• alternative parameter values or mathematical relationships
• relative weights are assigned to each alternative
+ Secondary uncertainties> Related to vulnerability
> Insufficient data, lacking of data and engineering judgment introduce uncertainties

CONFIDENTIAL
Best Use of CAT Models
+ CAT model losses often vary substantially across vendor
models
+ The most appropriate view is based on multiple CAT
models
> Customize the model to better fit company’s actual experience and
unique exposure
> Minimize large changes due to model changes
> Reduce model risk that results from a reliance on a single vendor
model’s opinion
+ Use of multiple models
> Select best model for different sub-portfolios or perils or region
> Blend multiple models
5

CONFIDENTIAL
CAT Model Blending—Model Evaluation + Simple blend unadjusted outputs
+ Develop blending factor for mean and STDV of loss events and/or event
frequencies
+ Blending factor based on detailed model evaluation:
> Model performance: Loss validation
• Historical loss
• Industry loss
• Company loss
• Stochastic loss
• Industry EP
• Company loss cost
• Key event return period
> Review of Science: Component soundness
• Hazard module
• Vulnerability module
• Financial module
> Model testing: Sensitivity study
• Understanding of notional portfolio behavior
100
1,000
10,000
100,000
100 1,000 10,000 100,000
Actual Loss ($ Millions)
Modele
d L
oss (
$ M
illio
ns)
AIR EQE RMSA B C

CONFIDENTIAL
CAT Model Blending
+ Model blending can be done at different levels
> Blending of Mean loss from multiple EP curves
• Loss Blending: weighting dollars across common probabilities
• Map the event sets regardless of their physical characteristics
• Probability Blending: weighting the probabilities across common threshold
• Introduce more event sets
• Higher volatilities
> Secondary uncertainty change the shape of EP curves
• Take secondary uncertainty (volatility) into account
• Nonlinear effect for adjustment on access of loss reinsurance contracts
> Frequency adjustment
• Long-term view vs near term-view of hurricane rates
• Elevated EQ frequency due to time dependency

CONFIDENTIAL
Model Blending - Mean Loss
+ Blending impact
> Expected losses for the entire EP:
credibility weighted average of the
mean losses. No difference either loss
blending or probability blending
> No impact for Quota Share treaties
either way
> Certain impact to Excess of Loss
treaties:
• For higher return period (lower Exceedance probability), Probability blended EP curve is favorable to reinsurers
• Expected losses between threshold A and B – the area below the Probability blended EP curve(blue) is greater than the Loss blended EP curve(red)
CONFIDENTIAL
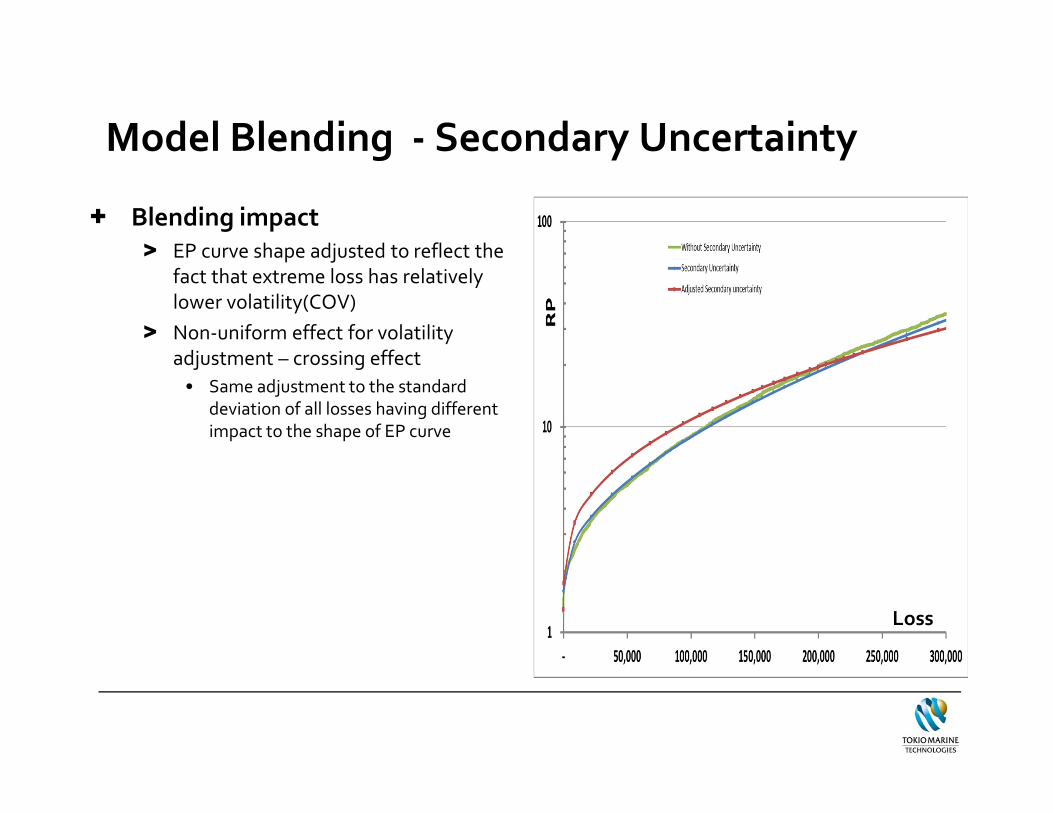
Model Blending - Secondary Uncertainty
+ Blending impact
> EP curve shape adjusted to reflect the
fact that extreme loss has relatively
lower volatility(COV)
> Non-uniform effect for volatility
adjustment – crossing effect
• Same adjustment to the standard deviation of all losses having different impact to the shape of EP curve
Loss

CONFIDENTIAL
Model Blending - Frequency adjustment
+ Simple overall adjustment
> Simple but not recommended since it does not account for event
specific information
+ Credibility blending of near-term and long-term view
> Preferred since it reflects both long and short term views according
to the credibility weights
> More complex to implement
> More volatility and non-uniform affect on AAL and EPs
+ Key events frequency adjustment only
> Account for EQ time dependency
> More effort to identify the key events and the adjustment factor
10

CONFIDENTIAL
Heuristic Portfolio Optimization
+ Premise
> Accounts with insufficient premium to cover cost of capital
> Account of too much concentration
> Internal risk limit guidance unmet
> Inefficient reinsurance program
> other fees or losses rendering cost of writing too high
+ Maximize the portfolio margin subject to the following
constraints:
> TVaR< Given limit
> Minimum bound <account participation < Maximum bound
+ Input data
> Net profit results for each account for all trial
> Lower and upper bounds of participation for each account
11

CONFIDENTIAL
HPO-Implementation
+ Determines a unique optimal portfolio that
> Maximizes portfolio margin
> Subject to capital requirement constraints from shareholders, rating
agencies and regulators and internal risk limit guidance
> Guarantees optimal portfolio is most profitable
+ Approach
> Calculate the Risk Capital TVaR for the portfolio
> Calculate the Co-TVaR and RAROC for all the accounts
> Stratify the accounts into segments by RAROC
> Increase the TVaR by one unit and calculate the incremental Co-TVaR for
each segment
> Calculate the incremental RAROC for each segment
> Sort segments by RAROC in ascending order and increase the best and
reduce the worst
> Repeat till maximum portfolio margin
12

CONFIDENTIAL
HPO Case Study
+ Portfolio of international CAT reinsurer
> FR WS
> NZ EQ
> US CEA
> UK WS
> AU EQ
+ Steps
> Decrease the worst account (NZ EQ)
> Increase the participation of the best
account (US CEA)
> Then Increase UK and reduce NZ
> Continue till optimal
+ Observations
> HPO is intuitive and simple to implement
> Is it global optimal solution? Almost
13
Accounts InitialPart
Initial RAROC OptimalPart
FR WS 1.0 0.077 1.25
NZ EQ 1.0 0.016 0.88
US CEA 1.0 -1.093 1.5
UK WS 1.0 0.113 1.4
AU EQ 1.0 0.0218 1.2
Initial Margin 1.3m Optimal Margin 1.6m

CONFIDENTIAL
Portfolio Optimization Uryasev Algorithm
+ Conditional VaR (CVaR): Algorithms and Applications by
Prof. Uryasev at UFL
+ Easy to optimize real world business strategies
> CVaR usually coincides with TVaR
> Linear programming (LP) can be used
for optimization of very large problems
> Fast and stable algorithm
> Can be applied to non-normal
distribution
> Many real world business constraints
can be translated into CVaR
optimization
Source: Dr. Stan Uryasev, Conditional Value-at-Risk (CVaR):
Algorithms and Applications

CONFIDENTIAL
CVaR Optimization Uryasev Algorithm
+ CVaR minimization
> x=a set of decision vector (line size, growth factor, limits, etc)
> y=random vector (CAT losses of various LOBs)
> f(x,y)=loss function (overall company net profit)
> Minimize CVaR
+ Use of Uryasev Algorithm
> Maximizes portfolio performance measure (i.e. margin) subject to
TVaR constraint
> TVaR constraints can be replaced by a set of linear constraints
> VaR is also optimized (nearly)
> Multiple TVaR constraints
> Transaction cost constraints

CONFIDENTIAL
Uryasev Algorithm-Case Study
+ Optimize CAT reinsurance portfolio growth strategy for the
three years business plan given
> price change assumptions depending on industry loss
+ Project Outline
> Price Change Simulation
> Portfolio Growth Strategies
> Portfolio Statistics Comparison

CONFIDENTIAL
Case Study-Price Change Simulation
+ Price change assumptions depending on
industry loss> US HU: -2% if industry loss<$5b
> US HU: 0% if $5b<industry loss<$10b
+ Current growth strategy> Growth by price change
+ Portfolio > US HU
> US EQ
> EU WS

CONFIDENTIAL
Case Study-Portfolio Stats Comparison
+ No strategy: based on price
change assumptions, net profit
will decrease overall in the next 3
years
+ Current strategy: This strategy
improves the loss ratio for each
major peril. However, it only
slightly improves the overall
RAROC and net profit
+ Uryasev portfolio optimization
strategy: Improves RAROC and
net profit over time