casting feeder design optimization based on feed path...
TRANSCRIPT

Casting Feeder Design Optimization
Based on Feed Path and Temperature Analysis
Submitted in partial fulfillment of the requirements
of the degree of
Master of Technology
by
M. Jagdishwar
(09310911)
Guide:
Prof. B. Ravi
Department of Mechanical Engineering
INDIAN INSTITUTE OF TECHNOLOGY BOMBAY
June 2012


ii
Abstract
Casting processes are widely used to produce complicated metal shapes with little or no
further machining, in a very economical way. Major casting defects, such as shrinkage cavity,
porosity, hot tears etc. occurs during or as a result of solidification phenomenon of the molten
metal. These defects can be minimized by appropriate changes in feeding parameters, such as
feeder location, feeder shape and size, feeder neck shape and size. Selecting the correct set of
parameters that lead to the desired quality and yield, is important but difficult to achieve.
There is a need for computer aided optimal feeder design coupled with solidification
simulation to reduce the number of shop floor trials and obtain enhanced yield and high
quality, in minimal possible time.
In this work a new approach for feeding system evaluation and its optimization is presented.
The feeder design parameters are evaluated using temperature gradient maps generated by
mapping temperature values from part hot spot to the feeder hot spot. Industrial case studies
have been studied to understand the effect of these feeding parameters on temperature
gradients. The feed paths which track the flow of molten metal microscopically during the
process of solidification are generated by Vector Element Method (VEM). The convergence
of these feed paths shows last freezing region thereby indicating shrinkage defect location.
An approach to evaluate and optimize casting feeder design by using feed paths based
method is presented. Further the feed paths are employed to validate the proposed approach
of feeder optimization using statistical Response Surface Method (RSM).
A new approach for feeder shape optimization using subtractive topology based optimization
has been studied and implemented for feeder optimization in a 3-dimensional Visual C#
environment coupled with solidification simulation using AutoCAST-X Solver. An initial
over-designed feeder appended to the casting surface is modeled, which is voxelized and
temperature values are assigned to each voxel using the solver. At each iterations a set of
voxels are removed from the feeder domain based on its temperature value, thereby reducing
the feeder volume, which is remodeled and solved for temperature data and defect analysis
again, till a defect free casting at an optimal feeder size is obtained. An algorithm for the
proposed topology based feeder shape optimization is presented. The above proposed
methodologies have been validated on a bench mark casting.
Key Words: shrinkage defect, directional solidification, feeder design and optimization,
temperature gradients, feed paths, topology optimization, shape optimization.

iii
Table of Contents
Declaration of Academic Integrity i
Abstract ii
Table of Contents iii
List of Figures v
List of Tables vii
1 Introduction 1
1.1 Metal Casting 1
1.2 Casting Feeding System 2
1.3 Casting Solidification Simulation 2
1.4 Feeder Design and Optimization 3
1.5 Organization of the Report 4
2 Literature Survey 5
2.1 Feeder Design 5
2.1.1 Feeder Location and Size 6
2.1.2 Feeder Connectivity and Shape 8
2.2 Solidification Simulation 10
2.2.1 Mathematical Modeling 10
2.2.2 Physics Based Solidification Analysis 11
2.2.3 Geometry Based Approach 11
2.3 Feeder Optimization 12
2.3.1 Feeder Optimization Techniques 14
2.4 Feed Path and Interpretation 19
2.5 Summary of Literature Survey 21
3 Research Problem Definition 23
3.1 Motivation 23
3.2 Goal 24
3.3 Research Objectives 24
3.4 Research Approach 24
3.5 Scope 25

iv
4 Feeder Design Optimization using Feed Path Analysis 26
4.1 Introduction 26
4.2 Feeding Parameters and Evaluation 27
4.2.1 Feeding Parameter: Feeder Location 29
4.2.2 Feeding Parameter: Feeder Shape and Size 31
4.2.3 Feeding Parameter: Feeder Neck 33
4.3 Feed Path Based Feeder Optimization 35
4.4 Optimization Module and Algorithm 36
5 Feeder Size Optimization using Response Surface Method 40
5.1 Introduction to RSM in Feeder Optimization 41
5.2 RSM Technique: Flow Chart 41
5.3 Feeding System Optimization: RSM Technique 42
6 Feeder Shape Optimization using Topology Based Method 48
6.1 Introduction to Topology Based Optimization 48
6.2 Optimal Feeder Design Formulation 49
6.3 Initial Feeder Design and Optimization 50
6.4 Overall Algorithm 51
6.5 Results 52
7 Summary and Future Work 55
7.1 Summary of Work done 55
7.2 Limitations and Future Work 56
References 57
Bibliography 61
Acknowledgement 62

v
List of Figures
Figure Description Page
1.1 Steps in metal Casting 1
2.1 Solidification contraction regimes in liquid, freezing and solid range 5
2.2 Progressive directional solidification 8
2.3 Feeder shapes (a) Top, (b) Side with the connectivity 8
2.4 Commonly used (a) Top and (b) Side feeder shapes 9
2.5 Isothermal contours & temperature gradients 12
2.6 Framework of feeder design and optimization 13
2.7 Performance of various optimization methodologies 15
2.8 Flowchart of automatic optimal feeder design 18
2.9 Vector Element Method for square shape casting 20
4.1 (a) Casting model (b) Solidification temperature contours 27
4.2 Solidification temperature contours for (a) Undersized feeder
(b) Optimized feeder
27
4.3 Temperature map: Initial layout 28
4.4 Temperature map: Initial and revised layout 28
4.5 Part methoding, solidification temperature contours and defect image of
initial layout
30
4.6 Temperature map: Initial layout 30
4.7 Part methoding, solidification temperature contour of revised layout 31
4.8 Temperature map: Initial and revised layout 31
4.9 Part methoding, solidification temperature contour of revised layout, defect
image of initial layout
32
4.10 Temperature map: Initial layout 32
4.11 Part methoding, solidification temperature contour of revised layout 33

vi
4.12 Temperature map: Initial and revised layout 33
4.13 Part methoding, solidification temperature contour of revised layout, defect
image of initial layout
34
4.14 Temperature map: Initial layout 34
4.15 Part methoding, solidification temperature contour of revised layout 35
4.16 Temperature map: Initial and revised layout 35
4.17 Benchmark Part (a) Temperature Contours (VEM), (b) Feed Paths
Contours (VEM), (c) Temperature Contours (FEM), (d) Casting Section
36
4.18 Feeder optimization flow chart 37
4.19 Feed path track starting from part hot spot 38
4.20 (a) Feed path contours (b) Casting section for benchmark casting. 38
5.1 Flow chart for RSM based optimization process 41
5.2 Response surface plot at region I, showing direction of steepest ascent 44
5.3 Path of steepest ascent 44
6.1 Flow chart for topology based feeder optimization method 51
6.2 Iteration steps in topology based feeder optimization method 53

vii
List of Tables
Table Description Page
1.1 Popular casting solidification simulation software 3
2.1 Solidification shrinkage for major cast metals 6
5.1 Central Composite Design points at region I 42
5.2 Analysis of Variance (ANOVA) at region I 43
5.3 Steepest ascent experiments 44
5.4 Central Composite Design points at region II (Unfit Model) 45
5.5 Analysis of Variance (ANOVA) at region II (Unfit Model) 45
5.6 Central Composite Design with axial points at region II 46
5.7 Analysis of Variance (ANOVA) for the second order model at region II 46

1
Chapter 1
Introduction
1.1 Metal Casting
Metal casting is a 5000 years young manufacturing process in which molten metal is poured
in a mould and removed after solidification. These castings are all around us right from
simple rings to complex engine cylinders and are employed in industries varying from
aerospace, medical devices, automobiles, sanitary, electrical machineries, home appliances
etc. Indian casting industry with an annual production of 7.5 MT is the 2nd
largest casting
producers in the world after China. With an approximated count of 4500 SME foundries and
accounting for employing nearly 1 million people, the process is still considered as an art in
itself to produce defect free and sound casting. The successful casting of pre-designed
geometry is heavily dependent on the skill and experience of foundry engineer.
Figure1.1: Steps in metal casting
Casting can produce variety of products, which account for various metal process
combinations with complex geometry and varying weight. Almost all the metals or alloys
which can be easily melted under controlled conditions are castable. It is a near net shape
manufacturing process involving less or no further operations required.
Casting process has a wide range of process parameters depending upon the type of metal
(aluminum alloy, steel, cast iron etc.), mold material (e.g. sand, metal, ceramic etc.), molding
techniques and the methods by which the molten alloy is introduced into the mould cavity
(e.g. gravity, low pressure, high pressure etc.). Some other processes are investment casting,
shell molding, continuous casting, squeeze casting, lost foam casting etc. Sand casting is the
most widely used process, suitable for producing intricate parts in almost every metal that can
2
be melted. Nearly 80% of the components produced by weight are made through sand casting
process only.
1.2 Casting Feeding System
During the process of casting solidification, liquid metal starts solidifying from the mold
boundary till it reaches to certain point/points in the mold-cavity known as hot spot/spots.
This hot spot region is a local temperature maxima, which effectively feeds adjacent regions
in the casting. Since molten metal shrinks in volume during solidification (1-5% by volume)
in the mold cavity, a portion of fresh molten metal should be fed or compensated to make up
for the shrinkage at the hot spot region. However, the fresh molten metal cannot be fed to an
isolated non-solidified metal completely surrounded by solidified metal, due to which
porosity defects such as a cavity and other void regions are formed. The cavity thus formed is
called a shrinkage cavity which is one of the most serious casting defects and accounts for
maximum casting rejections.
The most important aspect of designing a sound and defect free casting is design of perfect
feeding system. Feeding system design includes use of feeders, insulation around a feeder,
provision of chills, and exothermic pads which ease or facilitates molten metal flow,
microscopically, to the hot spot regions. Feeders are applied to the casting to compensate the
solidification shrinkage and providing the directional solidification (from casting to feeders)
so the last solidification points are shifted to the feeders. Therefore suitable design of feeding
system (number, position, size and shape of feeders) is a key for production of sound
castings. Hot spot must be inside the feeder to ensure defect free casting.
1.3 Casting Solidification Simulation
Mathematical modeling of casting processes and its numerical simulation has become a
mature field and a number of computational systems are available specifically for this
purpose as shown in Table 1. In each case, following the analysis, there is a requirement to
examine the results and to make a judgment on whether the system design is satisfactory or
whether it needs to be improved in any way to ensure part integrity. One of the major
objectives of solidification simulation and its analysis is to predict the presence of casting
defects, primarily hot spots i.e. the locations in a casting which solidify last, which leads to

3
Table 1.1: Popular casting solidification simulation software
shrinkage related defects and accounts for maximum casting rejections. Simulation allows the
foundry men to analyze problems in detail, faster, and at an early stage in the design cycle,
thus enabling decisions to be made towards improving design and quality. Therefore, the
costs and the risks associated with the trial and error procedure of experimental castings are
minimized.
1.4 Feeder Design and Optimization
The design of casting feeders should be such that it must solidify at the same time as or later
than the casting, which has to be satisfied by ensuring that the feeder has a modulus that is
sufficiently larger than the casting. The volumetric contraction of the casting must be
compensated by the feeder and thus should have volume greater than the shrinkage volume.
At the same time, overdesigned feeders with large safety margins increase the cost and
reduce yield (ratio of weight of casting to total weight with feeding system). So a
fundamental problem facing foundries is in developing feeder design, which fulfills the need
for supplying additional molten metal to the solidifying region with the minimum volume of
extra metal. Thus, there is a need to study optimal feeder design and its implementation.
There are numerous optimization techniques but selecting and implementing the most
efficient one is a challenge.
Software Method Vendor Web Address
ADSTEFAN FDM Frank Hunt, Hitachi America Ltd,MI,USA www.dm.hap.com
AnyCasting FDM Anycasting Co. Ltd., Seoul Korea www.anycasting.com
AutoCAST GVM Advance Reasoning Technologies, Mumbai, India www.autocast.co.in
CAPCAST FEM EKK, Inc., Michigan, USA www.ekkinc.co
CastCAE FVM CT-Castech, Inc., Kerava, FinLand www.castech.fi
Flow-3D FDM Flow Science, Inc, USA www.flow3d.com
MAGMASOFT FDM Magma GmbH, Aachen, Germany www.magmasoft.com
Mavis Flow FDM Alphacast Software Ltd. Northampton, UK www.alphacast-software.co.uk
NovaFlow FDM Novacast Technologies, Tyringe, Sweden www.novacast.se
ProCAST FEM ESI group, Paris France www.esi-group.com
SoftCAST FDM Oriental Software Pvt Ltd, Bangalore, India www.oriental-software.com
SUTCAST FDM Sutcast Foundry Technologies, Vancouver, Canada www.sutcast.com
Virtual Casting FDM NIIST, Trivandrum, India www.niist.res.in
WINCAST FEM RWP GmbH ,Germany www.rwp-simtec.de
SOLIDCast FDM Finite Solutions, Inc, USA www.finitesolutions.com

4
Coupling numerical simulation with feeding optimization technique is one way of adopting a
more systematic approach towards casting design and its optimization. This coupling enables
visualization of the process of freezing inside a casting and identification of the last freezing
regions or hot spots. This facilitates the placement of feeders and feeding aids in order to
ensure casting soundness while trying to maximize the overall yield without expensive and
time consuming shop floor trails.
1.5 Organization of the Report
The report is organized in seven chapters. The first chapter contains the introduction about
metal casting processes, feeding system, casting solidification simulation and feeder design
optimization. The second chapter covers the literature reviewed on theory of feeder design,
various optimization technique employed for feeder optimization, solidification simulation,
feed paths and there interpretation and topology optimization. The problem definition is
covered in chapter three which includes motivation for the research, objective of project,
research approach and scope of the project. The fourth chapter describes feeder optimization
problem, and introduction of feed path based optimization technique which mainly covers
ideal feed path (temperature gradient maps) and generated feed path by Vector Element
Method (VEM). It also covers major feeding parameters which affect the feeder design
studied through industrial cases. A statistical based Response Surface Method (RSM) is
described and implemented for feeder optimization in chapter five. Sixth chapter focuses on a
subtractive topology based optimization for 3-dimensional feeder shape optimization and in
the last chapter a brief conclusions and future work are presented.

5
Chapter 2
Literature Survey
Literature review of previous and related work, in the proposed area of research has been
carried out and briefly documented in this chapter. Casting feeder design based on
solidification phenomenon is presented first, followed by rules for feeder design, feeder
location and shape selection. Various feeder size optimization techniques, introduction to
feed paths and its capability in field of optimization is presented.
2.1 Feeder Design
The molten metal in the mold cavity occupies considerably more volume than the
solidified castings that are eventually produced. This is for the compensation of volumetric
contraction which metal exhibits. There are three quite different contractions to be dealt
with when cooling from the liquid state to room temperature, as illustrated in the figure 2.1
below.
Figure 2.1: Solidification contraction regimes in liquid, freezing and solid range (Adapted
from Campbell, 2003)

6
Liquid Contraction: This contraction occurs while metal is cooling in liquid state, since
liquid grows in density as it cools. This type of contraction in the liquid state does not pose
a significant problem because most of the superheat of a melt is usually lost during or
quickly after pouring.
Solid Contraction: The solid contraction occurs after the casting has solidified and as it
cools from the solidification temperature to room temperature. The design engineer must
be concerned with this contraction. To ensure that the dimensions of the castings are
correct, the pattern used to produce the given casting is usually made slightly larger than
the casting dimension.
Solidification Contraction: Contraction during solidification occurs at the freezing
point, since density of the solid is greater than density of liquid. This type of contraction is
the root cause of solidification related defects which in turn causes (a) „shrinkage porosity
or cavity‟ and (b) the requirement for „feeding‟, which is the result of failure of feeding to
operate effectively. To compensate solidification contraction extra metal needs to be fed to
the solidifying casting. This extra metal is provided by separate reservoir of metal called
as feeder, since its action is to feed the metal to casting.
Table 2.1: Solidification shrinkage for major cast metals
Metal Melting Point
(C)
Liquid Density
(kg/m3)
Solid Density
(kg/m3)
Shrinkage
(%)
Aluminum 660 2385 2700 7.1
Copper 1084 8000 8960 5.3
Cast Iron 1370 6900 7100 3.0
Cast Steel 1640 7015 7870 5.0
2.1.1 Feeder Location and Size
It is essential to understand the feeding rules as laid by (Campbell, 2004), which gives an
idea for feeder size calculation and its location
The modulus criterion or heat transfer criterion is that the feeder must solidify at the
same time as, or later than the casting. This is satisfied by ensuring that the feeder has a
modulus (volume to surface area ratio) that is sufficiently larger than the casting by a
multiplication factor. The required modulus of the feeder is given by (Jacob et al., 2004)

7
Modulus of feeder (Mf) = (Multiplication factor) * Modulus of casting (Mc)
The multiplication factor mainly depends on the cast metal (for steel is 1.3, ductile iron is
1.15, grey iron is 1.0) (Ravi et al., 1997).
The casting can be separated into different feeding sections (Jong et al., 1991) by dividing
into simpler shapes at different sections called feeding unit. A feeding unit is a group of
casting sections in which modulus decreases progressively from the highest modulus
section to the lowest modulus section. Each feeding unit is isolated from other feeding
units by the low modulus regions in between them. Each feeding unit requires a separate
feeder. In order to ensure proper feeding, a critical modulus gradient needs to be
maintained in all feeding units. The critical gradient is given by (Wu et al., 1992)
where, M1, M2 are the moduli of the connected segments and is the center distance of
connected segments. The feeder has to be located to the section with highest modulus so
as to ensure effective and directional feeding.
The volume criterion states that the feeder must contain sufficient molten metal to
meet the volume contraction requirements of the casting. This is satisfied by ensuring that
the feeder has sufficient volume to feed all the shrinkage. The feeder volume should be at
least equal to the minimum volume given by (Campbell, 2003)
where, β is the “shrinkage factor” of the alloy and ε is the “feeding efficiency” which is
volume fraction of the feeder that is actually available for feeding. The feeding efficiency
depends on the cooling rate of the feeder which in turn is affected by shape of the feeder
and the presence of insulations or exothermic sleeves.
There must be sufficient pressure at all points in the casting to suppress the formation
and growth of porosity.
The pressure gradient requirement states that there should be sufficient pressure
differential to cause the feed metal to flow, and the flow needs to be in the correct
direction.
8
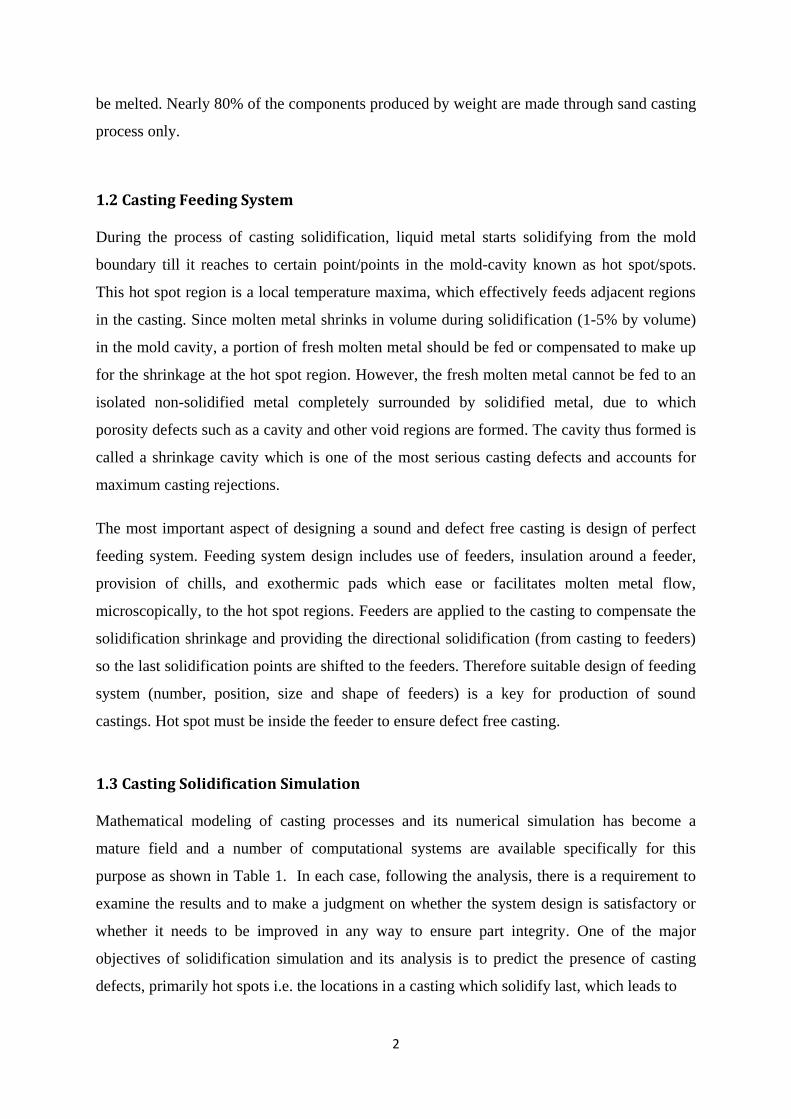
Figure 2.2: Progressive directional solidification
The feed path criterion states that there should be positive feed paths to flow from the
liquid to all parts of the casting it is supposed to feed. In order to meet the feed path
requirement, the principle of directional solidification is followed (Heine et al., 1968). If
the feeder can be placed on the highest modulus section of the casting, with progressively
thinner (lower modulus) sections extending away, then the condition of progressive
solidification towards the feeder can be met. The number and position of feeders should be
designed based on this criterion.
2.1.2 Feeder Connectivity and Shape
Depending on the position and connectivity to the casting, feeders are classified as top and
side. The top feeders are placed above the hot spot, whereas the side feeders are placed at
the side of the hot spot, usually at the parting line. A top feeder is more effective because
of the additional effect of gravity.
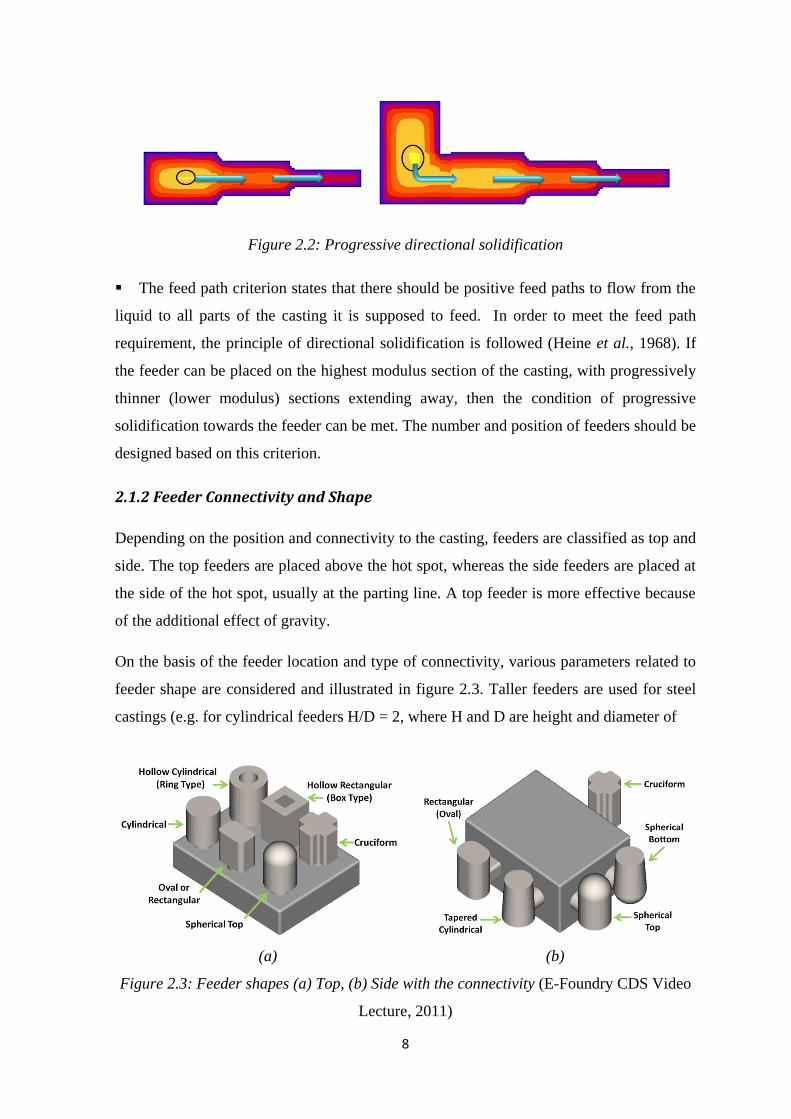
On the basis of the feeder location and type of connectivity, various parameters related to
feeder shape are considered and illustrated in figure 2.3. Taller feeders are used for steel
castings (e.g. for cylindrical feeders H/D = 2, where H and D are height and diameter of
(a) (b)
Figure 2.3: Feeder shapes (a) Top, (b) Side with the connectivity (E-Foundry CDS Video
Lecture, 2011)

9
cylinder, respectively), which exhibit shrinkage pipe, whereas in iron and aluminum
castings, H/D value can be about 1.5 (Tavakoli and Davami, 2008).
Different types of shapes available for feeder, but commonly used feeder shapes are
rectangular, cylindrical, cruciform and spherical top. Efficiency of feeder is characterized
by modulus i.e. volume/heat transfer area. By selecting different feeder shape we can have
different efficiency. Casting yield is depending on volume of feeder so it is necessary to
reduce the volume of feeder.
(a) (b)
Figure 2.4: Commonly used (a) Top and (b) Side feeder shapes (E-Foundry CDS Video
Lecture, 2011)
For small castings, cylindrical feeders are widely used. For larger castings, cylindrical
feeders with spherical bottom (side location) or spherical top (top position, blind type) are
widely used (Ravi, 2007).
After determining the feeder dimension, shape and connection point, feeder neck is
dsigned. Feeder neck (also called as breaker core) is an important parameter, designed in a
way to ensure decreasing modulus towards the casting. This is done to ensure that the neck
should solidify after the casting hotspot and to maintain the flow of liquid metal from the
feeder to casting hotspot.
Modulus of neck (Mn) = (Multiplication factor) * Modulus of casting (Mc)
The multiplication factor is assigned empirically as 1.2 to 1.5 times the casting again
depending on the cast metal. The shape of the feeder-neck depends on the feeder shape,
feeder position and the connected portion of the casting. The most widely used neck
shapes are cylindrical (for top cylindrical feeders) and rectangular (mainly for side

10
feeders). The neck may also be tapered down towards the casting (Ravi, 2010), thereby
gradually reducing the modulus towards the casting.
2.2 Solidification Simulation
The solidification process involves the transformation of the hot liquid metal to solid and
then subsequent cooling of the solid to the room temperature. Solidification of molten
metal after being poured into a mold cavity is an important phase in the casting process
which greatly affects the product quality and yield. During the past two decades,
computer modeling of solidification simulation has been widely used in foundry with an
aim to:
Predict the pattern of solidification, including shrinkage cavities and associated defect
predictions.
Perform over a range of ferrous metals like steel, grey iron, ductile iron, nonferrous
metals like aluminum, copper etc. to precious metals like gold, silver etc.
Simulate solidification in various orientation of casting, with various metal-process
combinations, so that optimal position can be selected.
Provide the choice of the quality level like amount of porosity to tolerate, thereby
producing castings in an acceptable range of quality.
2.2.1 Mathematical Modeling
The field variables are the temperatures at all nodal points varying with time. Thermal
properties like thermal conductivity, density, specific heat are also varying with
temperature and hence the problem becomes non-linear transient in nature. The governing
equation of heat conduction in a moving fluid is given as
(
)
(
)
(
)
(
)
In this expression Q represents the rate of heat generation, u, v, w are the velocities in the
directions x, y, and z respectively. K, ρ, c are thermal conductivity, density and specific
heat respectively. The heat flow should also satisfy boundary conditions, which may be
specified as constant temperature at boundary or as known temperature gradient normal to
the boundary-specifying surface. In solidification of casting, Q is zero.

11
Where, S1 and S2 represent the portions of boundary on which these two boundary
conditions are specified. On application of these boundary conditions the governing
equation reduces to:
where, T and q are temperature and heat flux respectively. Initial condition gives
information of temperature at starting time. Boundary condition in different regions (solid-
liquid interface, casting-mold interface and outer surface of mold) is calculated by using
energy balance.
2.2.2 Physics Based Solidification Analysis
The major approaches used to solve solidification problems are finite difference, finite
element methods. In finite difference method assumption is made that material property
does not vary with temperature and then the transient heat conduction equation becomes
(Kreith, 1980).
(
)
In this method the casting and mold regions are subdivided into small intervals of constant
space and time and the equation is solved by explicit finite difference method
In finite element method, variational approach method and weighted residue method are
used to solve the problem of heat flow. In variational approach method a function is
needed and minimization of this function is equivalent to solving the governing equation
of the problem. In weighted residual method the metal is assumed to be in complete
contact with the mold surface (no air gap is formed) and it is also assumed that metal
property does not vary in a particular element because it is very small. Again the transient
heat conduction equation is shown in above equation. Boundary conditions are same as
discussed in mathematical modeling of solidification analysis. Solving above equation by
weighted residue method gives nodal temperatures at the metal and mold node.

12
2.2.3 Geometry Based Modeling
The other approach of analyzing solidification simulation is based on the geometry of part.
This includes vector element method, which is described below:
Vector Element Method
This method determines feed path and location of hot spot inside the casting, which uses
the direction of the largest thermal gradient at any point inside a casting to move along a
path which leads to a hot spot (a local maxima of temperature with gradients tending to
zero).
Figure 2.5: Isothermal contours & temperature gradients (Ravi, 2010)
Figure 2.5 shows iso-solidification contours for a stepped casting section, where Ti is
temperature associated with a Pi (point on the contour), G is largest temperature gradient
at Pi. Region where gradients tend to zero represent the location of the hot spot Ph. The
path connecting the points Pi to Ph represents the feeding path in reverse. The above
approach for locating hot spots and tracing feed metal flow paths reduces the complexity
of computation by at least an order of magnitude as there is no longer the need to
determine temperature exhaustively at all points inside a casting (Ravi and Srinivasan
1996).
2.3 Feeder Optimization
Feeders are appended to casting at suitable location to provide directional solidification
from the casting through the neck region to the feeder, so as to ensure that the shrinkage
cavity/porosity formed at last solidifying regions are placed inside the feeder.

13
Figure 2.6: Framework of feeder design and optimization (Ravi and Joshi, 2007)
The total volume of feeders should be minimized to improve the casting yield,
productivity and thereby reduce the cost incurred by the foundry men (Ravi and
Srinivasan, 1996). In recent years casting simulation has emerged as a powerful tool in
foundry industry to predict shrinkage defects. Coupling numerical simulation technique
with optimization methods is one way of adopting a more systematic approach towards
casting design and optimization (Xor et al., 2009).
A detailed framework for feeder design and optimization driven by solidification
simulation is presented in a flowchart in figure 2.6, starts with importing CAD model of
casting. A suitable feeder connection point is located closest to the hot spot region.
The following algorithm is used for the connection of feeder.
Identify the faces of the cast part around the hot spot.

14
Neglect bottom-facing faces.
Sort the faces in a list according to their distance from the hot spot.
Choose the nearest face to the hotspot, which satisfy criteria.
Selection criteria to facilitate locating feeder are as follows,
Flatness of the casting face
Orientation of the face, either top or side face.
Wall thickness should be large to prevent damage during fettling
Feeder and neck dimensions are computed by using geometric modulus method. Then a
solid model of feeder is generated by creating its vertices, edges and faces based on
connection points and dimensions. This solid model is attached to part model. In next step
solidification simulation is carried out on model. Feed path and presence of hotspot inside
the casting is checked. If internal defects are present, then feeder design is modified. If not
possible to improve the quality by feeder design alone, then the part design is modified. In
last step by using volume of feeder and neck yield is calculated.
2.3.1 Feeder Optimization Techniques
Numerical Optimization Technique: Casting design is defined by set of parameter like
casting geometry and processing condition. Process parameters and geometric dimensions
allowed to vary within limit are called as design parameters and the remaining parameters
are called as model parameter. Feeder design problem is posed as a numerical
optimization problem to determine design parameter to minimize cost function and satisfy
constraint function. Cost function and set of constraint are defined to quantify the quality
of product.
Numerical optimization or mathematical optimization are optimization problem consisting
of maximizing or minimizing a function by systematically choosing input values from
within an allowed set and computing the value of the function. Over the years many
authors have modeled different numerical equations to represent objective function for
casting optimization. (Haftka and Grandhi, 1980) resolved problems of structural shape
optimization and (Tortorelli et al.,1994) went on applying it in metal casting field. Later it
was introduced for optimizing solidification processes through shape and process

15
parameters modifications. The authors presented the shape sensitivity analysis for the
thermal system and coupled this analysis with non-linear programming to optimize the
design of a sand casting. The geometric modeler used by the author allowed shape
deformation using a mapping technique, thereby facilitating shape optimization.
Morthland et al., (1995) combined FEA of the solidification process with sensitivity
analysis based on the efficient direct differentiation method and numerical optimization to
optimize feeder dimensions and volume. Ebrahimi et al., (1997) applied this approach for
the investment casting and their numerical optimization algorithm used the sensitivities to
calculate the gradient information and upgrade the design until an optimum was found.
Recent development in the field of numerical based optimization was presented by Lin,
(2002). Lin proposed a neural network-based approach for optimization of injection-mold
cooling parameters and designed the injection mold cavity and cooling system model by
using FEM and neural network prediction. The author used „„simulated annealing‟‟
techniques to obtain optimal cooling system parameters.
The research in casting technology has been laboring toward achieving „„near optimal‟‟
solutions while attempting to keep the computational cost as low as possible. Trial and
error methods based on experiments and intuitive and accumulated hands-on experience
are quicker and easier to implement, but they do not necessarily always provide the
optimal solution. Gradient-based methods provide near optimal designs with higher
computational costs. The newly emerging evolutionary computing techniques, however,
may lead us toward the optimal designs and solutions but are computationally very
Figure 2.7: Performance of various optimization methodologies (Ransing, 2006)

16
expensive (Figure 2.7). The availability of skilled foundrymen, computing power, relative
need for higher quality component s, and ease of implementation then influences the
decision making on choosing one of these methods.
Geometric Optimization Technique: In parallel with evolution of numerical
optimization methods, some conventional approaches to solidification analysis and
optimization have been driven by the casting geometry that essentially influences the
sequence of solidification. One of the earliest geometric based optimization efforts was
proposed on the modulus method that had its origin from Chvorinov‟s, (1996) classic rule,
which related solidification time ts of a casting to its modulus. The term modulus pertains
to the ratio of heat content volume V to the heat-transfer area A of the casting.
Wlodawer, (1966) used Chvorinov‟s rule to design the feeders in such a way that the
modulus (M) of the feeder is greater than that of the casting and must increase by 10%
from the casting across the ingate to the feeder for ensuring adequate feeding. He proposed
a relationship between casting, neck and feeder modulus as
Tiryakioglu et al., (2002) pointing to limitations in Chvorinov‟s rule, authors proved that
the modulus includes the effect of both casting shape and size and proposed that the shape
factor (k) separate these two independent factors. Using their own superheat model,
authors found that the solidification time (t) for an optimum-sized feeders in a feeder-
casting combination was only fractionally longer than that of the casting ( a = 51.046 for
Al-12% Si alloy and 1.005 for steel castings).
Roschen et. al., (2004) presented a novel approach to the problem of feeder design by
augmenting genetic algorithms with CAD to optimize the feeder dimensions. Genetic
algorithms based on empirical rules were used as an optimization tool. A 3-dimentional
CAD model of casting is modeled using CAD software. The casting is further divided into
feeding sections and their volume, surface area were calculated. For each feeding section
feeder is designed by using parallel search in the domain of all possible solution and thus a
population of probable solutions are prepared. A fitness function is defined on the basis of

17
population of solutions, and is used in maximization of casting yield. Feeder design is
basically a constrained optimization problem which is transformed into unconstrained
problem by using penalty method. This penalty terms comes whenever constrained is
violated. Further a case study is also presented, in which tapered rectangular feeder is
optimized and results are shown for optimum dimensions of feeder and increase in casting
yield.
Upadhya and Paul (1993) incorporated foundrymen‟s intuitive skills, accumulated
experience, and developed a knowledge-based integrated design system to optimize gating
and feeding system. They applied some empirical heuristics to the discretized solid model
and performed a geometric analysis to determine the natural flow path for liquid metal.
The feeding routine then used a solidification time map to find hot-spots and locate
feeders at these spots to ensure adequate feeding. An expert system for designing of
feeding systems in small and medium size castings of different shapes and sizes was
proposed by Shukri et al., (2005) as well. They proposed a computerized expert system for
designing of feeding that has been developed based on knowledge base built from the
practice of expertise and developed casting technologies.
Topology Optimization Technique: Tavakoli and Davami (2009) proposed
evolutionary topology optimization to improve the feeding system design for sand casting.
In this approach, finite-difference analysis of the solidification process is combined with
the optimization technique. The optimal feeder design is formulated as an evolutionary
topology optimization problem. Initial design for this purpose is over designed feeder
topology. An evolutionary algorithm is performed iteratively on initial design until
stopping criterion is satisfied. In every iterations heat conduction equation is solved and
performance indices of feeder voxels are computed. Voxels having lowest performance
index is removed. Neck optimization is also done by same method with additional criteria
of critical neck contact area.
Two types of stopping criteria for the functioning of the algorithm were proposed namely
global and local criterion. The global criterion is maximization of casting yield and local
criterion is to satisfy constraint of maximum allowable macro shrinkage. Casting of low
alloy carbon steel was considered as the problem case in silica sand for optimization. The
result showed that the directional solidification is preserved during optimization while the

18
casting yield is increased gradually and the final design is free from the macro-shrinkage
defects
Tavakoli and Davami (2008) also presented an approach for automatic optimal feeder
design in casting processes. This approach included following main steps: (1)
initialization, (2) defect prediction, (3) defect distribution and finding suitable location of
the feeder-neck connection, (4) feeder and feeder-neck design, (5) shape optimization of
the added feeder, (6) topology optimization of the added feeder (if it is desired), (7) going
to step 2 and repeat the same procedure until defects in the casting fall below a defined
threshold (or other defined stopping criteria are met). Overall flowchart of the presented
method is shown in figure 2.8 and the subsections are discussed in details.
Initialization: The casting geometry (as cast part) with physical properties and
boundary condition are defined by user.
Figure 2.8: Flowchart of automatic optimal feeder design
(Tavakoli and Davami, 2008)

19
Defect prediction: In this step the defect field in the casting (original casting + added
feeders, if some feeders are added in previous cycles) is determined by solving energy
equation with the macroscopic or microscopic defect prediction methods.
Defect distribution: One of the main steps during feeder design is selection of a
suitable point on the casting surface to connect the feeder-neck. If there is only one major
hot spot inside the casting, selection of the hottest point on the casting surface is
connection point of neck. But when we have two or more isolated hot spots, automatic
selection of feeder-neck connection point is very difficult. For this purpose multiple
feeders, one for each hot spot is needed. If there are several hot spots, with different
solidification times, the feeder can be first designed for the hottest one, followed by
analysis to verify if the same feeder can also feed any other hot spots. Then the feeder is
designed for the next largest hot spots and so on (Ravi, 2005).
Feeder and feeder-neck design: Connection point for feeder neck to the cast surface is
designed by coupling feeder design principle and computer geometric reasoning.
Conceptual design is based on Chvorinov equation for casting solidification time. The
dimensions of the feeder neck are calculated based on feeder modulus and shape.
Feeder shape optimization: Shape of feeder is optimized with a simple gradient search
method. This step has a sub-iteration cycle in which the feeder length scale is modified.
The sub-iteration is exploited so that the feeder volume is minimized and the distributed
defect value at the connection point of feeder-neck become below a specified threshold at
the end of iterations. After each feeder modification, energy equation is solved and
remained defects are determined.
2.4 Feed Path and Interpretation
Feed paths are the microscopic paths in the direction of maximum temperature gradient
from which the molten metal flows to feed the solidifying region of the casting. The
Vector Element Method (VEM) proposed by Ravi and Srinivasan, (1996) which traces the
feed paths from any given point inside the casting to the nearest hot spot, provides a fast
and reliable approach to casting solidification simulation with minimal user inputs. Feed-
paths are usually generated from the part boundary to visualize the direction of
solidification (from early freezing regions to later freezing regions). The point of
convergence of the feed-paths is checked to ensure the location of hot spot inside the

20
casting system. In this method of feed path generation the casting geometry is divided into
a number of segments from a given point and the modulus vector is computed for each
geometric segment. The length of the vector is given by the ratio of volume to heat
transfer surface area of each segment. The resultant of these vectors gives the feed-path at
that point. The computation can be repeated at the new point along the feed-path,
eventually leading to the local hot spot. Multiple feed-paths can be generated starting from
different points along the boundary of the cast part. The profile of these feed-paths
provides a clear insight about the direction of solidification whereas the convergence point
indicates the location of shrinkage related defects.
Figure 2.9: Vector Element Method for square shape casting (Sutaria et al., 2012)
The methodology is illustrated with a square shaped casting shown in figure 2.9. Consider
a point Pi near the part boundary. Divide the part around the point, with equal segment
angle, β. Here a large segment angle (45) is shown to illustrate the concept, so that the
number of segments n is only eight. For each segment, modulus vector is computed using
equation 1 and plotted with dotted arrows.
V
A
(1)
Their vector sum represents the direction of the adjacent point with the highest modulus as
shown by the thick arrow. A pre-defined step is taken along this direction to obtain the
next iteration point Pi+1. The procedure is repeated at point Pi+1 and continued till it
reaches a location where the resultant modulus vector is below a pre-defined lower limit.
This last point Pi+m indicate the local maxima of temperature (hot spot), where
temperature gradient tends to be zero. The locus of the points during the iteration from Pi
to Pi+m represents the feed-path. During solidification, when temperature Ti of the molten

21
metal at point Pi reaches the solidus temperature, feed metal is supplied from point Pi+1 to
compensate solidification shrinkage. Multiple hot spots if present are automatically
discovered by separate points of convergence of the feed paths.
2.5 Summary of Literature Survey
Three types of contractions occur during solidification namely liquid contraction,
solidification contraction and solid contraction.
Feeding system is needed to compensate for volumetric contraction during
solidification and solid contraction.
A casting (along with feeders) should be designed in such a way that, controlled
progressive directional solidification is achieved, so as to minimize solidification
related defects.
Seven feeding rules are important for feeder design which considers essential
requirements of feeding system. Violation of any of the rule can result in bad feeder
design.
Quality and yield of the casting largely depends upon casting feeding system design,
driven by solidification phenomenon.
An approach to optimize the feeder is based on solidification simulation to predict
exact defect location.
The objective of feeding system optimization is to minimize the feeder volume by
achieving directional solidification along the feed path.
In recent years feeder optimization problem is addressed by use of numerical
optimization, topology optimization method, expert based system etc., but these
approaches are very complex and are computationally expensive.
Framework for feeder design and optimization gives guideline about finding suitable
feeder-casting location point to connect feeder on casting surface and also algorithm
for feeder optimization driven by solidification simulation.
Stopping criterion for the optimization technique decides number of iterations that has
to be carried out, to achieve optimal solution and amount of time employed in
obtaining the convergence point.
Feed paths generated by vector element method has proved to predict exact location
for shrinkage defects where the computational time involved is comparatively less.

22
Feed paths can be explored as an optimization tool to achieve an optimal solution for
feeder design with a relatively faster convergence rate.
Evolutionary topology optimization methodology can be employed for automatic
approach for feeding system design, its shape and dimensional optimization.

23
Chapter 3
Research Problem Definition
3.1 Motivation
Manufacturing of defect-free components at low cost and high productivity is important for
the casting industry today. The major challenges that the industry faces are large number of
shop floor trials, high rate of rejection and low casting yield. These can be overcome by
adopting solidification simulation technology integrated with optimization tool.
Solidification of the molten metal after being poured is an important phase in the casting
process which greatly affects the casting quality (produces shrinkage defects) and its yield.
To compensate for the shrinkage during the phase change, the freezing fronts take the
required liquid from adjacent liquid regions. The last freezing regions are the most probable
locations of shrinkage cavities, which need feeders appended at suitable location on the
casting. The total volume of the feeder should be minimized to improve casting yield and
productivity. The design and optimization of the feeder requires intensive human interaction
and numerous trial and error iterations. The assistance of simulation tools for determining the
optimal shapes, sizes and locations of the casting components (feeders) while simultaneously
trying to address the conflicting quality and cost constraints are difficult to achieve.
Although, several optimization methods have successfully been applied in many engineering
problems, but limited work is reported in casting domain. There is a need of an automatic
optimization technique which is reliable, easily accessible and has quick response time so as
to reduce experimental trial and error. The ready availability of computer technology, to
automate the casting design and optimization process makes both economic and engineering
sense. Coupling solidification simulation with optimization tools is one way of adopting a
more systematic approach towards automatic casting design and its optimization.

24
3.2 Goal
Goal of the research is “development of an integrated framework for an automatic feeder
optimization, driven by key parameters (location, dimension and shape) to achieve the
desired quality at the maximum yield and to validate it through bench mark casting.”
3.3 Research Objectives
Study of feed path characteristics and employing it as an optimization tool for feeder size
and shape optimization.
Development of feed path based optimization algorithm for feeder design and its
optimization.
Validation of the feed path based optimization with statistical based RSM method and
also to study sensitivity of the influencing parameters.
Study of subtractive topology based optimization method and its implementation in 3-
dimensional geometry for feeder optimization.
Implementation of the optimization model and validating it using experimental data and
bench mark casting.
3.4 Research Approach
Research approach is divided into following steps to achieve the objective:
Literature review: Feeder design and optimization:
A detailed literature survey on feeding system design and parameters affecting it for
achieving an optimal solution for feeder dimension is done.
Feed path based optimization technique:
Study of feed path generation by Vector Element Method (VEM) and employing it as an
optimization tool for feeder optimization. This methodology is examined for part having
single hot spot that could be addressed through single feeder connected closest to it.
Comparison of feed path based method with statistical based RSM method:
Studying and implementation of statistical based Response Surface Method (RSM) for multi-
variable optimization and verifying the results with the feed path based optimization is
performed.
25
Topology based feeder shape optimization method:
Study of topology based optimization technique and an approach for implementing
subtractive based topology optimization for 3-dimensional feeder shape optimization is
carried out.
Validation of optimization model through experimental data:
Validation of feed path based and topology based optimization analysis through experimental
casting on a benchmark part.
3.5 Scope
Scope for this project is being limited to feeder optimization for castings considering three
different metal-mould combinations which accounts for nearly 90% of all casting produced.
Al-Die casting
Al-Sand casting
This project as of now is focused on casting parts which produces single hot spot in the
geometry, which has to be addressed through single feeder and optimization of the same. The
approach can be easily implemented for 3-dimensional complex geometry, thereby
approaching towards an automatic methodology for feeder design and its optimization.

26
Chapter 4
Feeder Design Optimization using Feed
Path Analysis
4.1 Introduction
In general, casting defects can be eliminated by optimizing and controlling process
parameters, or by making the methods design and thereby part quality more robust to changes
in process parameters. Ideally, both approaches should be combined to aim at zero defects.
This is particularly important in the context of shrinkage related defects, which is perhaps the
most prevalent and critical in most of the ferrous as well as non-ferrous castings. As different
parts of a casting solidify at different instants of time, the volumetric contraction that occurs
during the phase change at any particular location leads to a local vacuum. This is filled by
molten metal flowing from adjacent hotter sections, which are themselves fed by even hotter
sections. In a casting with different wall thicknesses, the direction of solidification is from
thin to thicker to thickest sections. The feed paths are in the reverse direction, from thickest to
thinnest sections, aligned along the maximum temperature gradient, which is in turn
perpendicular to the local solidification front. The hot spot, that solidifies last, feeds the rest
of the casting directly or indirectly, ending up with a shrinkage cavity. In long freezing range
alloys, the defect is distributed in the form of shrinkage porosity around the hot spot.
This defect can be addressed by using an appropriate feeder and other feed aid design to
compensate for the solidification shrinkage occurring at the casting hot spot. Feeders can
have various shapes (as descried in section 2.1.2), cylindrical shaped feeders are being the
most commonly used in foundries, which can have variations like its side being straight or
tapered, bottom being flat or spherical, and the top being open or blind. Other elements of the
feeding system include feeder neck (connection with the part) which is a crucial parameter
which effects the directional solidification from casting to the feeder.

27
In this chapter an approach to evaluate feeding system parameter using temperature gradients
maps is studied. This methodology gives an insight about the effect of feeding parameters
that affect the feeder design and hence are key parameters for feeder optimization. These are
illustrated by presenting some industrial case studies, which are being taken from different
consultants, each dealing with different feeding parameter. Also a methodology for feeder
optimization by using feed paths computed by VEM are studied and illustrated.
4.2 Feeding Parameters and Evaluation
The effect of different parameters of feeding system design on the directional solidification of
castings are studied by mapping the temperature gradients between the hot spots in the
casting to the hot spot in the feeder through lines perpendicular to the isothermal temperature
contours generated by the solidification simulation package. The combination of these
parameters, multiplied by the time taken to simulate and evaluate each combination, gives a
new approach to feeder design and its optimization. The solidification of different regions in
a casting can be visualized by temperature maps in different cross-sections. These
temperature values at any particular instant of time can be generated by casting simulation
programs. Figure: 4.1 and 4.2 shows a stepped casting and the solidification contour in the
vertical section passing through the middle.
(a) (b)
Figure: 4.1 (a) Casting model (b) Solidification temperature contours
(a) (b)
Figure: 4.2 Solidification temperature contours for (a) Undersized feeder
(b) Optimized feeder

28
Figure 4.3: Temperature map: Initial layout
Figure 4.4: Temperature map: Initial and revised layout
The highest temperature (hot spot) is seen in the center of the thickest section. This feeds the
adjacent middle section, which in turn feeds the thinnest section that solidifies first. The
shrinkage occurring at the hot spot can be prevented by connecting a side feeder. The
temperature profiles with undersized and correctly sized side feeders are shown in figure 4.1
and 4.2. While it is clear that the feeder has a bigger hot spot compared to that in the part for
the second layout, this does not guarantee feeding unless sufficient temperature gradients
exist in the intervening region. This can be further evaluated by plotting the temperature at
points along the center line of casting section versus their distance from the hot spot in the
casting.

29
In both the layouts shown above, the hot spot in the feeder is measured from the hot spot in
the casting. The initial layout (figure 4.3, temperatures plotted in black color with a square
marker), positive gradients are seen up to a certain distance from the feeder (solid line), and
the remaining distance exhibits a negative gradient (dashed line). This clearly implies that the
feeder will be unable to feed the hot spot in the casting due to negative temperature gradient
in the middle section. In the revised layout (figure 4.4, temperatures plotted in green color
with circular markers), the gradients are positive throughout, indicating a strong possibility of
proper feeding.
The line connecting the highest temperature values are perpendicular to the isothermal
contour that actually represents the solidification front. This temperature gradient line gives
insight information about directional solidification from the part to the feeder in the cross-
section. The effects of different parameters namely feeder position, its shape & size and neck
dimension in a feeding system are described and evaluated using the temperature gradient
plots on few of the industrial cases which are taken from the consultants.
4.2.1 Feeding Parameter: Feeder Location
Ideally, feeder should be connected to part surface at a point that is closest to the hot spot
inside the casting. The point should be either above the hot spot (for top feeder) or on the side
(for side feeder). There can be multiple constraints such as thin wall thickness, curved
feature, or user specifications may not allow connecting a feeder closest to the hot spot in
casting. Alternative feeder locations can be compared based on the temperature gradients
between the feeder and the casting hot spot. If there is continuous positive temperature
gradient from the hot spot to feeder, then the feeder is expected to work properly.
The effect of feeder location is illustrated with an industrial example of a ductile iron railway
insert produced by Disamatic process. The overall part size is of 80 mm x 75 mm x176 mm,
with an average thickness of about 20 mm and weighing 1.4 kg. The original methods design
had top feeder of diameter 40 mm and height 60 mm. This resulted in a shrinkage cavity as
seen in figure 4.5.

30
Figure 4.5: Part methoding, solidification temperature contour and defect image of
initial layout.
Figure 4.6: Temperature map: Initial layout
The temperature gradient map is generated by plotting the temperature along the center line
from the hot spot in the casting to the feeder. It shows that the feeder is effective for a certain
distance towards the hot spot. There are negative gradients (dashed line) from the hot spot to
the feeder, implying that the feeding is in reverse direction. The hot spot acts like an internal
riser and results in a shrinkage cavity, as observed. To ensure continuous positive gradients,
the feeder is brought closer to the hot spot, to the side of casting and is enlarged to a diameter
of 65 mm and height 90 mm, as shown in figure 4.7. The relocation of the feeder, closest to

31
Figure 4.7: Part methoding, solidification temperature contour of revised layout
Figure 4.8: Temperature map: Initial and revised layouts
the hot spot or thickest casting section and increasing the feeder dimension, thereby reducing
the feeding distance and thus increasing the casting yield. This clearly shows that the feeder
connectivity point is an important parameter for an optimal feeder design.
4.2.2 Feeding parameter: Feeder shape and size
The size and shape of a feeder should ensure that it solidifies later than the hot spot in casting
that it is expected to feed. Spherical feeders have a longer solidification time compared to
cylindrical or oval feeders of the same volume, owing to the difference in cooling surface
32
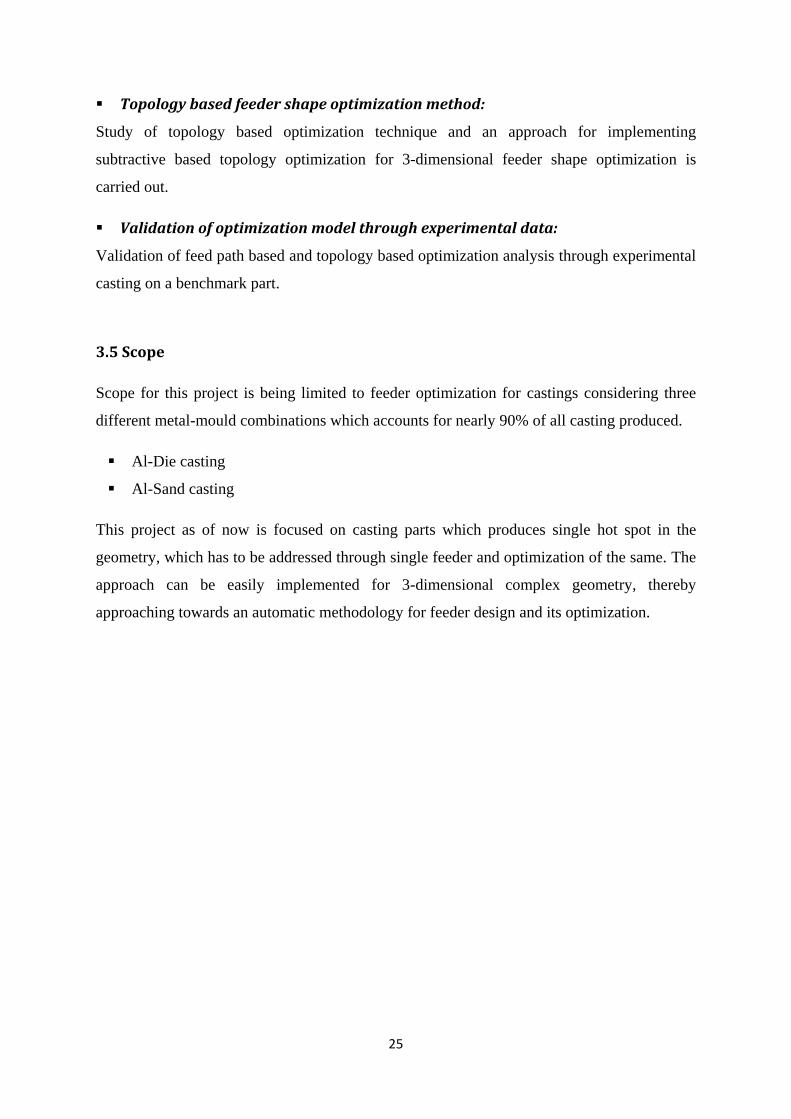
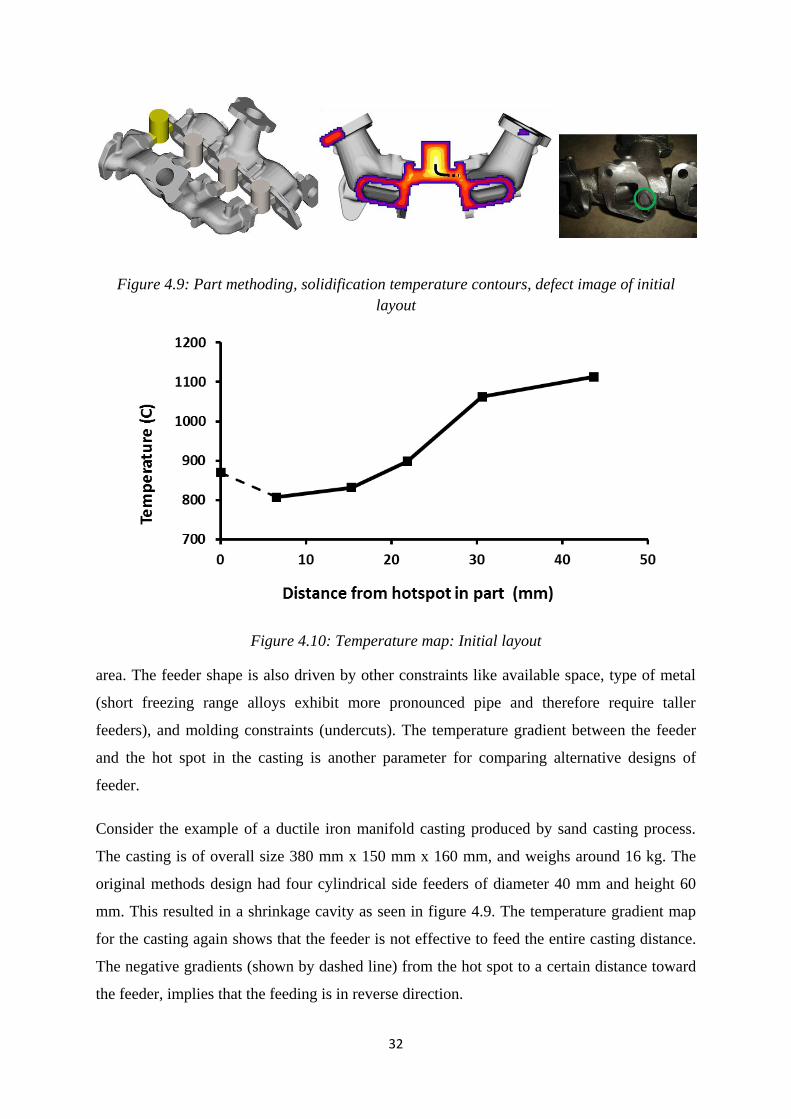
Figure 4.9: Part methoding, solidification temperature contours, defect image of initial
layout
Figure 4.10: Temperature map: Initial layout
area. The feeder shape is also driven by other constraints like available space, type of metal
(short freezing range alloys exhibit more pronounced pipe and therefore require taller
feeders), and molding constraints (undercuts). The temperature gradient between the feeder
and the hot spot in the casting is another parameter for comparing alternative designs of
feeder.
Consider the example of a ductile iron manifold casting produced by sand casting process.
The casting is of overall size 380 mm x 150 mm x 160 mm, and weighs around 16 kg. The
original methods design had four cylindrical side feeders of diameter 40 mm and height 60
mm. This resulted in a shrinkage cavity as seen in figure 4.9. The temperature gradient map
for the casting again shows that the feeder is not effective to feed the entire casting distance.
The negative gradients (shown by dashed line) from the hot spot to a certain distance toward
the feeder, implies that the feeding is in reverse direction.

33
Figure 4.11: Part methoding, solidification temperature contour of revised layout
Figure 4.12: Temperature map: Initial and Revised layouts
The feeder shape was revised and changed with spherical bottom and tapered sides. Its top
diameter was modified to 40 mm, bottom diameter to 55 mm, and height to 60 mm, as shown
in figure 4.11. The corresponding temperature gradients of the revised layout, indicates better
feeding from feeder to part hot spot, and resulting in shrinkage-free casting.
4.2.3 Feeding Parameter: Feeder Neck
The neck is also an important parameter in feeding system design which connects the feeder
to the casting, allowing feed metal to flow through it to the hot spot in the casting. Its
solidification time must be greater than the casting hot spot but should be less than that of the
feeder. An industrial example of a cast iron carrier casting produced by sand casting process
is shown. The casting is of overall size 150 mm diameter, 70 mm height, and weighs 12 kg.
The original methods design had a conical side feeder of top diameter 50 mm, bottom

34
diameter 60 mm and height 105 mm with a square neck of side 35 mm. In this case a feeder
neck design is studied by varying its dimension keeping the feeder dimension constant based
on the temperature gradient maps. The original layout as shown in figure 4.8 resulted in a
shrinkage cavity. The temperature gradient map was generated by plotting temperature values
along the center line of sections from the hot spot in the casting to the feeder. It shows that
the feeder is effective for a certain distance toward the hot spot, covering only half of the total
feeding distance.
Figure 4.13: Part methoding, solidification temperature contours, defect image of intial
layout
Figure 4.14: Temperature map: Initial layout
There are irregular gradients with negative slope (dashed line) from the hot spot to rest of the
distance to the feeder, implying that the feeding is in reverse direction. A shrinkage cavity is
observed at the hot spot, as predicted by the simulation software.
Keeping the feeder dimensions constant; the feeder neck is enlarged to a width of 40 and
depth of 50mm. The corresponding temperature gradients of revised layout indicate better

35
Figure 4.15: Part methoding, solidification temperature contour of revised layout
Figure 4.16: Temperature map: Initial and revised layouts
feeding from feeder to part hot spot. Since cast iron experiences little overall shrinkage
contraction, these gradients are sufficient, resulting in a shrinkage-free casting.
4.3 Feed Path Based Feeder Optimization
The above proposed methodology for identifying the important feeding parameters for feeder
optimization by temperature gradients maps can be automated by computer generation and
interpretation of temperature gradient maps, followed by automatic modification of feeding
system design, and verification by casting simulation. A new approach to evaluate and
optimize casting feeding system design using feed paths computed by Vector Element
Method (VEM) is being proposed. It is actually possible to automatically track the direction
of the feed metal flow from a given point, and to check if a feeder is effective. The

36
convergence of the feed paths provides a clear indication of directional solidification and
location of shrinkage defects. Initial investigation and comparison has found that this method
takes much lesser time than FEM-based simulation, making it more useful for practical
application. The proposed approach is demonstrated by automatically optimizing the feeder
size for a benchmark casting of Al-alloy castings made in sand molds.
Feed paths are usually generated from the part boundary to visualize the direction of
solidification (from early freezing regions to later freezing regions). The point of
convergence of the feed paths indicates the shrinkage defect location and is checked to ensure
it is inside the feeder, implying adequate feeding. A benchmark part with multiple junctions
is designed to illustrate the methodology for feeding system evaluation and optimization is
shown in figure 4.17. Feed paths are first computed for this part without any feeder and the
convergence point of the feed paths indicates a hot spot inside the heavy boss. The results are
compared with the VEM based AutoCAST simulation images, FEM-based solver, ProCAST
images and is further validated with the original casting as shown in figure below.
Figure 4.17: Benchmark part (a) Temperature contours (VEM), (b) Feed paths contours
(VEM), (c) Temperature contours (FEM), (d) Casting section with shrinkage defect
4.4 Optimization Module and Algorithm
Optimization of feeding system involves achieving the desired internal quality (free of
shrinkage defects) at the lowest cost. The quality is ensured by feed paths converging inside

37
the feeder. A smaller feeder gives higher yield, which implies lower melting cost and higher
productivity. The exercise is initiated by connecting a sub-optimal size feeder to the casting
and computing the feed path from the hot spot in the casting. If this feed path reaches inside
the feeder, then the feeder is considered effective. If the feed path stops inside the part itself,
then the feeder is enlarged and feed path computed again. This is continued until the feed
path moves into the feeder. The above methodology is applied to the benchmark part. A
cylindrical top feeder is designed using Chvorinov's equation with diameter of 65mm and
height of 86mm; the neck is designed with a diameter of 35mm and length of 10mm. The
feed paths computed for this part (as shown in figure 4.17) converge inside the part. For
optimizing the feeder design, iterations are performed by changing the feeding size in steps,
maintaining the same aspect ratio (height/diameter) as constant. The modified feeder
diameter is given by , till where, is initial feeder diameter,
is the increment step size, n is the number of iteration and is the maximum
permissible limit of feeder diameter.
Figure 4.18: Feeder optimization flow chart

38
Figure 4.19: Feed path track starting from part hot spot
Figure 4.20: (a) Feed path contours (b) Casting section for benchmark casting with 75 mm
feeder diameter and 100 mm feeder height.
This limit of the feed path or convergence point is driven by either minimum yield criteria
(say, 50% for this casting) or some geometric length constraints of feed path. Considering
and (considering lowest permissible yield as
50%), the feeder dimensions for the second iteration will be and .
In each iteration, feed path is computed from part hot spot and tracked till it stops, as shown
in figure 4.19. The length of the feed path from part hot spot to the stopping point is
computed in each case. In the first two cases corresponding to feeder sizes 65mm and 70mm,
the feed path stops inside the part itself, indicating shrinkage defect in the part itself. In the
case of 75 mm diameter feeder, the feed path stops inside the feeder just above the neck, thus
reaching an optimal feeder design. Feed paths are now computed from all the boundary
points for the part with feeder dimension of 75mm diameter and 100 mm height and result is

39
shown in figure 4.20. They are distinctly converging inside the feeder, indicating feeder
solidifies later as compared to the part. Same is confirmed by doing experiments with Al-
alloy in sand mold. Location of shrinkage porosity as shown in Figure 4.20, closely matches
with the feed-path convergence point. This optimal solution results in 62 % yield.

40
Chapter 5
Feeder Size Optimization using Response
Surface Method
5.1 Introduction to RSM in Feeder Optimization
In statistical design of experiments, the Response Surface Methodology (RSM) is an
important subject which is a collection of mathematical and statistical techniques useful to
formulate a relationship between several variables and one or more responses while the
objective is to optimize (minimize or maximize) the response. RSM is used to build a
function which simulates the behavior of a physical phenomenon on the field of variation of
the influential parameters, starting from a certain number of experiments. The main idea of
RSM is to use a sequence of designed experiments to obtain an optimal response.
As feeding depends upon a number of parameters and it is difficult to estimate the sensitivity
of these parameters, a statistical meta-model based on simulation response, aids in
quantifying the contribution of each feeding parameter on overall feeding. The RSM
technique is applied in feeding system optimization domain as a multi-parameter, multi
response optimization problem. Optimization of feeding system involves achieving the
desired internal quality (free of shrinkage defects) at the lowest cost. The quality is ensured
by feed-paths converging inside the feeder. A smaller feeder gives higher yield, which
implies lower melting cost and higher productivity. Convergence of feed-paths inside feeder
is not sufficient for optimality of feeding parameters. An undue bigger feeder offers high
modulus, causing poor yield. Thus the condition for optimality is a compromise between
feed-path length and feeder modulus.
Response surface methodology is applied to optimize feeding parameters by maximizing the
ratio of feed-path length to feeder modulus. It is sequential search approach where a
parameter and its change for the next iteration is determined using the steepest ascent

41
method. Reduction in computation time during successive iterations is achieved by
generating the feed-paths only from the part hot spot. The results of the system are presented
for a multiple junction benchmark casting of Al-alloy comprising of L, T and + junctions
described in figure 4.17.
5.2 RSM Technique: Flow Chart
Simulation meta-modeling based on the Response Surface Methodology (RSM) is adopted as
a sequential optimization procedure. Box and Wilson (1951) originally developed RSM and
used statistically planned experiments for process optimization. Later, RSM has been widely
used for optimization by simulation (Smith, 1973, Dellino et. al., 2010). In the presented
work, the ratio of feed-path length to feeder modulus is set as response that has to be
maximized, considering effects of two quantitative parameters (feeder diameter and feeder
height). Hence the 2 parameters and a single response factor are modeled here to study the
feeding characteristics on the multiple junction benchmark casting (figure 4.17) to illustrate
the methodology for feeding system optimization.
The exercise is initiated with a current sub-optimal solution defined as region I. The
simulation experiments are designed using Central Composite Design (CCD) in this region
and computation of feed-path length (with part hot spot as starting point) is carried using
VEM. Based upon simulation results mathematical model is developed correlating response
to the design parameters. Far from optimal region, Ist order model aptly describes the
correlation. Problem under consideration is maximization of response; solution is marched in
the direction of steepest ascent, till significant improvement in the response is observed.
Figure 5.1: Flow chart for RSM based optimization process

42
Near optimal region, Ist order model has high lack-of-fit whereas II
nd order model fits
significantly. Optimal solution is determined by computing stationary point of the developed
model, which represents a point of maximum response or a saddle point. The flow chart of
the proposed methodology is shown in the figure 5.1.
5.3 Feeding System Optimization: RSM Technique
The simulation experiments are designed for RSM using Central Composite Design (CCD)
around the sub-optimal solution (region I). Total numbers of design points are F + C, where,
F is 2-factor 2-level full factorial point (4) and C is number of center points (4). Thus, total 8
simulation runs are carried out; coded and un-coded feeding parameters along with simulated
response are given Table 5.1. Ist order linear mathematical model is developed in the form:
where, ε represents the noise or error observed in the response y such that expected response
is (y - ε) and β's are the regression coefficients to be estimated. The surface represented by
, is called a response surface. The least square technique is being used to fit a
model equation containing the input variables by minimizing the residual error measured by
the sum of square deviations between the actual and estimated responses.
Table 5.1: Central Composite Design points at region I
Feeder Variables Coded Variables
Feeder
Dia.- D (mm)
Feeder
Ht.- H (mm) X1 X2
Feed-path
Length- L (mm)
Feeder
Modulus- M (mm)
Response-
L/M (Y)
55 75 -1 -1 13 11.62 1.12
55 85 -1 1 21 11.84 1.77
65 75 1 -1 22 13.36 1.65
65 85 1 1 28 13.64 2.05
60 80 0 0 20 12.63 1.58
60 80 0 0 21 12.98 1.62
60 80 0 0 21 12.81 1.64
60 80 0 0 22 12.68 1.73

43
Table 5.2: Analysis of Variance (ANOVA) at region I
Source of
Variation
Sum of
Squares
Degree of
Freedom Mean Square F-Value P-Value
Regression 0.460 3 0.153 48.17 0.001
Linear 0.444
2 0.029 9.10 0.032
Interaction 0.016
1 0.016 4.92 0.091
Residual Error 0.013 4 0.003
Lack-of-fit 0.00004
1 0.00003 0.01 0.930
Pure Error 0.013
3 0.004
Total 0.472 7
The calculated coefficients or the model equations however need to be tested for statistical
significance and thus Analysis of Variance (ANOVA) is performed as shown in Table 5.2.
P-value is less than 0.05, which indicates that model is significant at 95% confidence level
and F-value of lack-of-fit is 0.01, indicating Ist order linear model fits significantly. Also,
regression coefficient for interaction term is -0.002; hence not considered in the mathematical
model Eq. (1).
Y = -17.03 + 0.24D + 0.19H (1)
Contour plot of response surface is shown in Figure 5.2 along with direction of steepest
ascent having the slope 0.24/0.19. Increase in response y is possible by moving up the
steepest ascent path. Maintaining the slope of the steepest ascent path, feeder diameter/height
is increased in step size of 5/6.5 mm, and simulation trails are performed along the path, till
significant improvement in response is observed as shown in Table 5.3.
The experiments are carried out with increase in feeder dimension keeping the slope
0.24/0.19 constant (obtained from Ist order model). The responses are plotted against the steps
at each feeder dimension configuration. The response factor gradually starts increasing till
trial 3, where feeder diameter is 75 mm and height is 100 mm and then starts decreasing after
trial 3 as shown in figure 5.3. This step or feeder dimension configuration is identified as
region II and to check for optimality, simulation experiments are designed using CCD
scheme in this region.

44
Table 5.3: Steepest ascent experiments
Simulation
Trials
Feeder
Dia.- D ( mm)
Feeder
Ht.- H ( mm)
Feed-path
Length- L (mm)
Feeder
Modulus- M (mm)
Response-
L/M (Y)
Origin 60 80 20 13.64 1.47
Step size 5 6.5 - - -
1 65 86 23 13.67 1.68
2 70 94 30 14.73 2.04
3 75 100 67 15.76 4.25
4 80 106 70 16.80 3.52
Figure 5.2: Response surface plot at region I, showing direction of steepest ascent
Figure 5.3: Path of steepest ascent
Feeder Diameter (mm)
Fe
ed
er
Heig
ht
(mm
)
Direction of
steepest ascent

45
At region II, 8 simulation runs are carried out and the response were recorded (table 5.4) and
a first order model is formulated. During ANOVA of first order model at region II, F-value of
lack-of-fit is found to be 625, which is significantly too high and indicates that the first order
model highly unfits at this region as shown in table 5.5. Now since the first order model
doesn’t fit at the region II, hence a second order model is developed by adding, additional 4
axial points to CCD. Thus, total 12 simulation runs are carried out, coded and un-coded
feeding parameters along with simulated response given in table 5.6.
Table 5.4: Central Composite Design points at region II (Unfit Model)
Feeder Variables Coded Variables
Feeder Dia.-D (mm)
Feeder Height (mm)
X1 X
2 Feed Path
Length (mm) Feeder Modulus
(mm) Response
(Y)
70 95 -1 -1 30 14.78 2.03
70 105 -1 1 66 15.00 4.40
80 95 1 -1 68 16.52 4.12
80 105 1 1 70 16.80 4.17
75 100 0 0 68 15.79 4.31
75 100 0 0 68 15.97 4.26
75 100 0 0 69 16.19 4.26
75 100 0 0 69 16.40 4.20
Table 5.5: Analysis of Variance (ANOVA) at region II (Unfit Model)
Source of
Variation Sum of Squares Degree of
Freedom Mean Square F-Value P-Value
Regression 2.323 2 1.161 2.87 0.418
Linear 2.323
2 1.161 2.87 0.418
Residual Error 2.023 5 0.405
Lack-of-fit 2.019
2 1.009 625.70 0.00
Pure Error 0.004
3 0.002
Total 1.436 7

46
Table 5.6: Central Composite Design with axial points at region II
Feeder Variables Coded Variables
Feeder
Dia.- D ( mm)
Feeder
Ht.- H ( mm) X1 X2
Feed-path
Length- L (mm)
Feeder
Modulus- M (mm)
Response-
L/M (Y)
70 95 -1 -1 30 14.78 2.03
70 105 -1 1 66 15.00 4.40
80 95 1 -1 68 16.52 4.12
80 105 1 1 70 16.80 4.17
75 100 0 0 68 15.79 4.31
75 100 0 0 68 15.97 4.26
75 100 0 0 69 16.19 4.26
75 100 0 0 69 16.40 4.20
65 100 -2 0 29 13.98 2.07
85 100 2 0 76 17.53 4.34
75 110 0 2 69 16.01 4.31
75 90 0 -2 42 15.51 2.71
Table 5.7: Analysis of Variance (ANOVA) for the second order model at region II
Source of
Variation
Sum of
Squares
Degree of
Freedom Mean Square F-Value P-Value
Regression 8.873 5 1.775 44.33 0.001
Linear 6.022
2 1.418 35.43 0.000
Square 1.507
2 0.754 18.82 0.003
Interaction 1.345
1 1.345 33.59 0.001
Residual Error 0.240 6 0.040
Lack-of-fit 0.166
3 0.055 2.24 0.262
Pure Error 0.074
3 0.025
Total 9.113 11

47
ANOVA (Table 5.7) shows that P-value is very close to zero, indicating that model is
significant at 95% confidence level. Smaller F-value ensures that second order model fits the
analysis. Regression analysis gives model as:
Y = -311.9 + 3.914D + 3.214H – 0.023DH – 0.01 D2 – 0.007H
2 (2)
Stationary point giving optimal level of feeder diameter and height is computed using
equation:
(3)
Where, Xs being stationary point, b is the vector of first order regression coefficients and B is
a symmetric matrix whose main-diagonal elements are the pure quadratic coefficients and
off-diagonal elements are one-half the mixed quadratic coefficients.
b =[
] and B = [
]
[
]
[
]
Therefore, [
] [
]
Thus the calculated optimal feeder diameter is 76.809 mm and feeder height is 103.38 mm,
which approximately matches with the result observed in feed path based feeder optimization
methodology as discussed in section 4.4.

48
Chapter 6
Feeder Shape Optimization using Topology
Based Method
6.1 Introduction to Topology Based Optimization
The feeder optimization techniques discussed in the previous chapters shows successful
application and implementation of feed path based optimization technique and verification of
the same using statistical tool of Response Surface Methodology for optimal feeder design.
The feed path based methodology for feeder optimization does not realize automatic feeder
design since they rely on a nearly feasible initial design (number, position and shape of
feeders), also they need some priori defined feeding paths which is not easy in the case of 3D
geometries. To overcome these difficulties, the optimal feeder design is formulated as an
evolutionary topology optimization problem (Xie and Steven 1997). Tavakoli and Davami (
2008) adapted the topology optimization based on the homogenization method, the simple
isotropic material with penalization method (as known as SIMP method) approach to find the
best feeder topology for a prescribed value of the feeder volume. In Tavakoli and Davami
(2007c), a heuristic growth method is suggested to automate the optimal feeder design in the
sand casting process.
In the present study, the optimal feeder design in casting process is formulated under the
context of subtractive topology based optimization problem as described by Xie and Steven
(1997). Topology optimization problems are material distribution problems, for which the
characteristic function, X, is the design parameter. In each point of the design domain, the X
should be either one or zero, indicating material (metal) or void (mold), respectively.
Topology based optimization methods enable designers to find a suitable material layout to
achieve the desired system performance. Topology optimization with homogenization was
originally developed for stiffness design of mechanical structures by Bendsoe and Kikuchi
(1988).

49
The initial design of the presented method is simulated with the multiple junction bench mark
casting (shown in figure 4.17), but with an over-designed feeder as shown in figure 6.2. In
fact this method needs the feeder layout, i.e., the number of feeders and their relative
configuration, as an initial design. The optimization method gradually improves the design by
minimizing the total volume of feeder(s), simultaneously ensuring a defect-free casting.
Consider Y= f (X) as the characteristic function, where Y = 1 inside the (molten) metal (cast
and feeder) and Y= 0 inside the sand mold. As topology of the casting component (without
feeder) is always fixed, we take Y = 1 on casting and feeder region. The optimal feeder
design is defined as indication of the Y field on design space, so that the desired objective of
defect free casting with minimum feeder volume is satisfied.
6.2 Optimal Feeder Design Formulation
The method starts with an initial over-designed feeder dimension i.e., the initial design is
healthy from functionality viewpoints (initial feeder design generates a defect-free casting)
but it is not efficient from consumed material resource point of view (casting yield or feeder
volume).
The initial overestimated feeder design is the feasible feeder design domain and the final
(optimal) design will be a subset of the initial design, which is formed of sufficiently fine
cubic element called voxels. Every voxel has a topology indicator flag, w, where w = 1 inside
the main phase (molten metal) and w = 0 inside the background phase (mold). Therefore w =
1 inside the casting, w = 0 inside the sand mold and w takes either 0 or 1 inside feeder
domain (varies during topology evolution). At the starting point of optimization, we have an
overestimated feeder design and w = 1 inside the feeder domain. The objective of the
topology based optimization technique in optimal feeder design is to find the best distribution
of w inside the feeder domain that produces a sound casting with minimum consumption of
the molten metal. For this purpose, low performance feeder voxels (w = 1) are gradually
removed from the feeder by altering the corresponding topology indicator flag from one (w
→ 1) to zero (w → 0). Since the feeder must be separated from the casting after complete
solidification, the connection area of the feeder-casting which is called as the feeder-neck
should also be taken under consideration. It has being observed that during the successive
iteration a thin separation is being formed between the casting and the feeder which is termed
as „Neck Growth Region‟.

50
6.3 Initial Feeder Design and Optimization
As mentioned in the above section, the initial design of the presented methodology is a
feasible, “over-designed” feeder topology. For this purpose, the casting is placed in a suitable
mold box and then its feeder layout should is defined. The layout contains information about
approximate position and shape of the feeder. The conventional feeder design rules (Carlson
et al., 2002 and Campbell, 2004) could be used to define the feeder layout. This initial layout
of the casting along with the feeder is modeled in a CAD package, converted and saved into a
STL (STereoLithography) file format. The STL file is being imported in AutoCAST–X
solver and VEM based solidification simulation is carried out. After the simulation the
casting and mold details in 0 and 1 format (0 for mold and 1 for the casting) for each voxel is
saved in a binary format. Similarly, the temperature details of the entire casting layout along
with the over-designed feeder for each voxels are stored as binary file format in a particular
predefined layout.
The binary file containing the voxelized temperature details of the casting and mold are read
and are being imported in Visual C# environment and topology based optimization algorithm
is performed iteratively until a stopping criterion is being satisfied.
At each iteration of the procedure, VEM based solidification simulation is being solved
(section 2.2.3) and the temperature details of each voxels are computed. Since the feeder
should be solidified later than the casting (to provide the directional solidification), the
temperature details of each voxels is defined at the end of solidification. After computing the
temperature details of each voxels, the operation of voxel removal is performed for the feeder
separately (without effecting or removing the part voxels). The feeder voxels are removed or
converted to mold voxel (w → 0), depending upon its temperature value. Those feeder voxels
whose temperatures values are relatively lower (say 100 C) are removed or converted to mold
voxel (w → 0) in 1st iteration i.e., 1
st layer of all the outer most voxels of the feeder are
removed, reducing the volume of feeder compared to the previous one. Now, after the 1st
iteration, as the feeder size is reduced, the solidification simulation and defect prediction is
again performed, and the same procedure of voxel removal is continued till the hot spot
region is completely inside the feeder and no hot spot is being observed in the casting region.
This exercise is being applied in the multiple junction bench mark part and is being shown in
the figure 6.2.
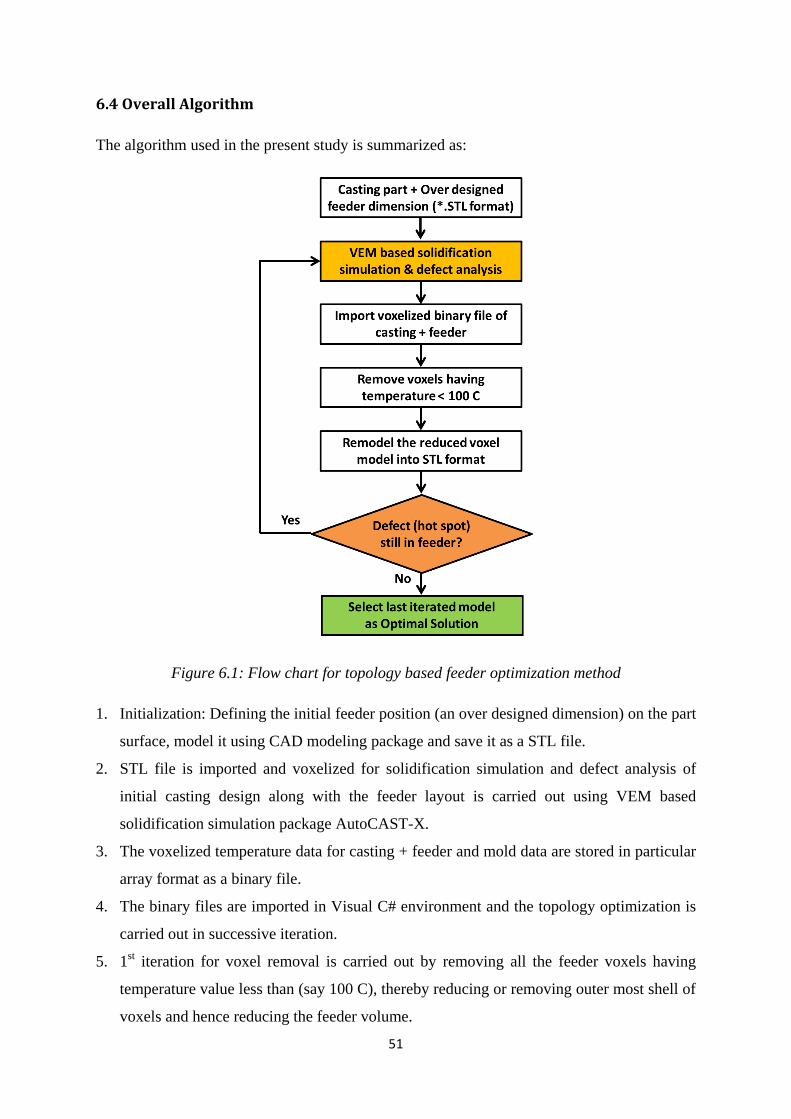
51
6.4 Overall Algorithm
The algorithm used in the present study is summarized as:
Figure 6.1: Flow chart for topology based feeder optimization method
1. Initialization: Defining the initial feeder position (an over designed dimension) on the part
surface, model it using CAD modeling package and save it as a STL file.
2. STL file is imported and voxelized for solidification simulation and defect analysis of
initial casting design along with the feeder layout is carried out using VEM based
solidification simulation package AutoCAST-X.
3. The voxelized temperature data for casting + feeder and mold data are stored in particular
array format as a binary file.
4. The binary files are imported in Visual C# environment and the topology optimization is
carried out in successive iteration.
5. 1st iteration for voxel removal is carried out by removing all the feeder voxels having
temperature value less than (say 100 C), thereby reducing or removing outer most shell of
voxels and hence reducing the feeder volume.
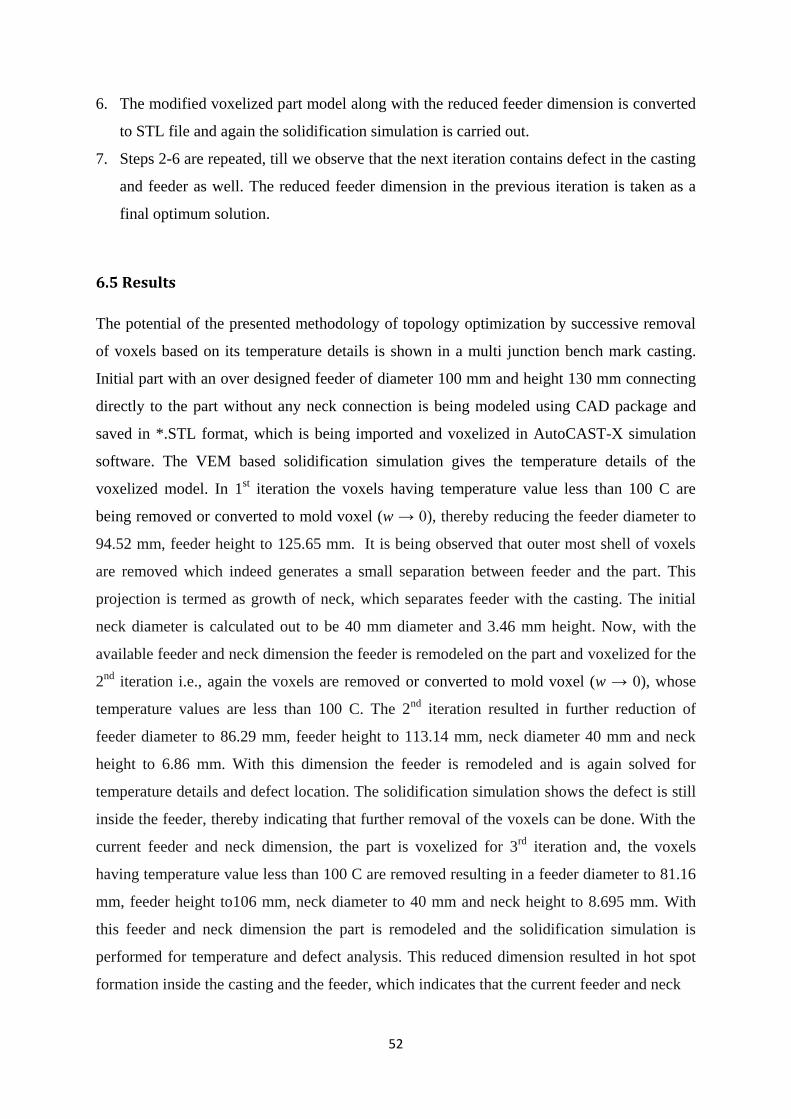
52
6. The modified voxelized part model along with the reduced feeder dimension is converted
to STL file and again the solidification simulation is carried out.
7. Steps 2-6 are repeated, till we observe that the next iteration contains defect in the casting
and feeder as well. The reduced feeder dimension in the previous iteration is taken as a
final optimum solution.
6.5 Results
The potential of the presented methodology of topology optimization by successive removal
of voxels based on its temperature details is shown in a multi junction bench mark casting.
Initial part with an over designed feeder of diameter 100 mm and height 130 mm connecting
directly to the part without any neck connection is being modeled using CAD package and
saved in *.STL format, which is being imported and voxelized in AutoCAST-X simulation
software. The VEM based solidification simulation gives the temperature details of the
voxelized model. In 1st iteration the voxels having temperature value less than 100 C are
being removed or converted to mold voxel (w → 0), thereby reducing the feeder diameter to
94.52 mm, feeder height to 125.65 mm. It is being observed that outer most shell of voxels
are removed which indeed generates a small separation between feeder and the part. This
projection is termed as growth of neck, which separates feeder with the casting. The initial
neck diameter is calculated out to be 40 mm diameter and 3.46 mm height. Now, with the
available feeder and neck dimension the feeder is remodeled on the part and voxelized for the
2nd
iteration i.e., again the voxels are removed or converted to mold voxel (w → 0), whose
temperature values are less than 100 C. The 2nd
iteration resulted in further reduction of
feeder diameter to 86.29 mm, feeder height to 113.14 mm, neck diameter 40 mm and neck
height to 6.86 mm. With this dimension the feeder is remodeled and is again solved for
temperature details and defect location. The solidification simulation shows the defect is still
inside the feeder, thereby indicating that further removal of the voxels can be done. With the
current feeder and neck dimension, the part is voxelized for 3rd
iteration and, the voxels
having temperature value less than 100 C are removed resulting in a feeder diameter to 81.16
mm, feeder height to106 mm, neck diameter to 40 mm and neck height to 8.695 mm. With
this feeder and neck dimension the part is remodeled and the solidification simulation is
performed for temperature and defect analysis. This reduced dimension resulted in hot spot
formation inside the casting and the feeder, which indicates that the current feeder and neck

53
Figure 6.2: Iteration steps in topology based feeder optimization method

54
dimension is undersized for the part and it cannot be further reduced. Thus the feeder
dimension obtained by the previous iteration (feeder diameter 86.29 mm, feeder height
113.14 mm, neck diameter 40 mm and neck height 6.86 mm) is taken as final optimal
solution. The overall casting yield observed to be 57%. Although the optimal feeder diameter
and feeder height obtained from feed based optimization and RSM method (described in
chapter 4 and 5 respectively) are approximately 75 mm and 100 mm respectively. The error
observed is justified, as after each successive iteration the reduced feeder dimension is being
remodeled in STL format which causes some dimensional inaccuracy. The main advantage of
the above mentioned technique over the previously mentioned technique of feed path based
optimization is that it can easily be implemented in 3D complex parts, and can be automated
using the algorithm mentioned in section 6.4, thus can be implemented for an automated
feeder system design and its optimization.

55
Chapter 7
Summary and Future Work
7.1 Summary of Work Done
Casting feeding system design has a direct influence on the quality and efficiency of
overall quality of casting, as it takes care for majority of solidification related defects,
which accounts for maximum casting rejections.
Casting defects elimination and thereby production of defect free casting, can be achieved
by optimizing and controlling process parameters.
An optimal methods design is highly iterative in nature, requiring considerable technical
skills, effort and time, with the advancement in computer technology and use of high end
simulation programs; it is now easy to evaluate the effect of feeding system design.
Temperature gradient maps are generated by plotting temperatures along the center line of
sections from hot spot in part to the feeder, which gives a better picture about directional
solidification and evaluation of various feeding parameters and thereby optimization of
feeding system.
Feed-paths generated by VEM also provides a convenient and reliable visualization of
directional solidification inside a casting, enabling prediction of shrinkage related defects,
which in turn is employed as an tool for feeder design and its optimization.
An algorithm for feeder design optimization driven by solidification simulation based on
feed path interpretation is presented, which gives an insight on how feeding system
design and optimization can be achieved.
The proposed approach of feed path based optimization technique overcomes major
limitation of using FEM based solidification simulation which generates only temperature
profiles indicating location of hotspot inside the casting, but not the direction of feeding
of molten metal.

56
Application of Response Surface Method for feeder optimization by the usage of feed
path based technique helps in analyzing and comparing the feed path based optimization
approach, which further eases the assessment of feeder design.
The topology based optimization method starts with an over-designed feeder dimension
and gradually improves casting yield, simultaneously ensuring defect free casting at each
iteration of voxel removal.
Growth of neck region is being observed in initial design is an over-designed feeder
dimension, with feeder directly connecting to the part.
The ease of implementation of the methodology indicates a good degree for using it as a
tool for automatic feeding system design and its optimization.
7.2 Limitations and Future Work
The feed path based optimization tool can only be evaluated for symmetric parts in which
a cross section is analyzed for feeder optimization. This approach can be implemented on
a 3D environment thereby addressing more complex part geometry.
The methodology is currently employed for part having single hot spot, although it can be
further refined so that it can address the problem of multiple feeders optimization that has
multiple hot spots locations.
Regression analysis is a powerful tool in optimization field that can implemented to
deeply analyze the sensitivity of the feeding parameters, so as to obtain a detailed
comparative study for an optimal feeder solution.
Topology based optimization which is currently based on temperature details of the part
and feeder, can be extended or combined with feed path based technique so as to achieve
more accurate optimal results.
This methodology of feeder optimization based on topology optimization approach
resulted in growth of feeder-neck, which needs further explanation based on computer
aided geometric reasoning, for an automatic approach for feeder-casting connection.
Effect of various other boundary conditions which includes different feed aids (sleeves,
covers on feeder, chills etc.) can be incorporated with the topology based optimization
coupled with feed path based algorithm as these are important parameters to be analyzed.
57
References:
1. Bendsoe M. and Kikuchi N. “Generating optimal topologies in structural design using
a homogenization method,” Computer Methods Application Mechanical Engineering,
71, 197–224, 1988.
2. Bishop E.F. and Pellini W.S., “The Contribution of Risers and Chill-Edge Effects to
Soundness of Cast Steel Plates,” AFS Transactions, 58, 185-197, 1950.
3. Bishop E.F., Myskowski E.T. and Pellini W.S., “The Contribution of Risers and Chill-
Edge Effects to Soundness of Cast Steel bars,” AFS Transactions, 59, 185-197, 1951.
4. Box, G. E. P., Wilson, K. B., “On the Experimental Attainment of Optimal
Conditions,” Journal of the Royal Statistical Society, 13 (1), 1-45, 1951.
5. Carlos A. S., Jaime A. S. Jr., Maria C.F. and Amauri G., “The use of artificial
intelligence technique for the optimization of process parameters used in the
continuous casting of steel,” Applied Mathematical Modeling, 26, 1077-1092, 2002.
6. Carlson K., Ou S. and Hardin R., “Development of new feeding-distance rules using
casting simulation: part I methodology”, Metallurgical Material Transaction, 33, 731-
740, 2002.
7. Dellino, G., Kleijnen, J. P. C., Meloni, C., “Robust Optimization in Simulation:
Taguchi and Response Surface Methodology,” International Journal of Production
Economics, 125 (1), 52-59, 2010.
8. E-Foundry Academy, “Casting Design and Simulation Video Lecture,” http://
http://efoundry.iitb.ac.in 2011.
9. Ebrahimi S.A., Tortorelli D.A., and Dantzig J.A., “Sensitivity Analysis and Nonlinear
Programming Applied to Investment Casting Design,” Applied Mathematical
Modeling, 21 (2), 113–123, 1997.
10. Girma B., Joshi S.S., Raghuram M.V.G.S., Balasubramaniam R., “An experimental
analysis of magnetic abrasives finishing of plane surfaces,” Machining Science and
Technology, 10, 323-340, 2006.

58
11. Guleyupoglu S., “Casting process design guidelines” American Foundry Society
Transactions, 77, 869-876, 1969.
12. Heine R.W. “Feeding Paths for Risering casting,” American Foundry Society
Transactions, 76, 463-469, 1968.
13. Jacob E, Roschen S, Praveen B. and Gopalakrishna V., “Intelligent Design of Feeders
for Castings by Augmenting CAD with Genetic Algorithms,” Journal of Intelligent
Manufacturing,15, 299-305, 2004.
14. Jong C., Park and Kunwoo L., “Computer aided design of mold cavity with proper
rigging system for casting processes” Journal of Engineering for Industry, 113 (58)
1991.
15. Kor J., Chen X., Sun., Hu H., "Casting design through multi-objective optimization,"
IEEE Computer Society 156, 428-433, 2009.
16. Kuyucak, S., “A Review of the Feeding Distances in Current Use for Steel Castings,”
American Foundry Society Transactions, 110, 1273-1279, 2002.
17. Lewis R.W., Manzari M.T., Gethin D.T., and Ransing R.S., “Casting shape
optimization via process modeling,” Materials and Design, 21, 381-386, 2000.
18. Lewis R.W., Ransing R.S., “The optimal design of interfacial heat transfer coefficients
via a thermal stress model,” Finite Elements in Analysis and Design, 34, 193-209,
2000.
19. Morthland T.E., Byrne P.E., Tortorelli D.A., and Dantzig J.A., “Optimal Riser Design
for Metal Castings,” Metallurgical and Materials Transactions, 26, 871- 885, 1995.
20. Ransing R.S. and Mood S.P., “Optimization in castings: An overview of relevant
computer technologies and future challenges,” Metallurgical and Material
Transactions, 37 (B), 905-911, 2006.
21. Ravi B. and Joshi D., “Feedability Analysis and Optimization Driven by Casting
Simulation,” The Indian Foundry Journal, 1(2), 44-50, 2010.
22. Ravi B. and Srinivasan M. N., “Casting solidification analysis by modulus vector
method,” Int. Journal of Cast Metals Research, 9, 1-7, 1996.
59
23. Shouzhu O, Carlson K. D., Hardin R. A., and Beckermann C., “Development of new
feeding-distance rules using casting simulation: part I. Methodology,” Metallurgical
and Materials Transactions, 33, 731-740, 2002.
24. Shukri M.I. and Elbasheer A. M., “An expert system for designing gates and risers for
small and medium size castings,” Sudan Engineering Society Journal, 52(46), 39-47,
2006.
25. Smith, D. E., 1973, “An Empirical Investigation of Optimum-Seeking in the Computer
Simulation,” Operations Research, 21(2): 475-497.
26. Sutaria M., “Vector Element Method: A geometry driven approach for casting
solidification simulation,” PhD APS-III, IIT Bombay 2010.
27. Sutaria M., Joshi D., Jagdishwar M., Ravi B., "Automatic optimization of casting
feeders using feed paths generated by VEM," American Society of Mechanical
Engineering, 2011.
28. Sutaria M., Joshi D., Jagdishwar M., Ravi B., "Feeding system design and evaluation
using temperature gradient (feed path) maps," American Foundry Society
Transactions, 119, 2011.
29. Sutaria M., Gada V.H., Sharma A., Ravi B., "Computation of feed paths for casting
solidification using level set-method," Journal of Materials Processing Technology,
212 (6), 1236-1249, 2012.
30. Tavakoli R. and Davami P., “Automatic optimal feeder design in steel casting
process,” Computer Methods Application for Mechanical Engineering, 197, 921-932,
2008.
31. Tavakoli R. and Davami P., “Optimal riser design in sand casting process by topology
optimization with SIMP method I: Poisson approximation of nonlinear heat transfer
equation,” Structural Multidiscipline Optimization, 36 , 193–202, 2007.
32. Tortorelli D.A., Tomasko J.A., Morthland T.E. and Dantzig J.A., “Optimal design of
nonlinear parabolic systems. Part II: Variable spatial domain with applications to
casting optimization,” Computer Methods Application Mechanical Engineering, 113,
157-172, 1994.

60
33. Wu M. H., Wang, Y. X., Guo, T. and Zhang, Q. X. “Computer-aided chill design for
steel castings” American Foundry Society Transactions, 100, 27-35, 1992.
34. Wolf J., Ehlen G., Sahm P.R., “Modeling of Casting, Welding and Advanced
Solidification Processes-(VIII)” TMS, Warrendale, 975-82, 1998.
35. Xie Y, Steven G “Simple evolutionary procedure for structural optimization,”
Computer Structure 49, 885–896, 1993.

61
Bibliography:
1. Campbell J., “Casting practice the 10 rules of casting,” Elsevier Butterworth-
Heinemann, Oxford, 1st edition, 2004.
2. Campbell J., “The new metallurgy of cast metals: Casting,” Elsevier Butterworth-
Heinemann,Oxford, 3rd
edition, 2003.
3. Joshi M.C. and Moudgalya K.M., “Optimization Theory and Practice,” Narosa
Publishing House, New Delhi, 2004.
4. Kreith F., and Black W. Z., “Basic heat transfer”, Harper and Row, 1980
5. Kunzi H.P., Tzschach H.G., and Zehnder C.A., “Numerical Methods of Mathematical
Optimization,” Academic Press, New York, 1971.
6. Mukherjee P. C., “Fundamentals of Metal Casting Technology,” Oxford and IBH
publishing co, New Delhi, 1988.
7. Ravi B., “Metal Casting: Computer aided Design and Analysis,” Prentice-Hall of
India Pvt. Ltd., New Delhi, 1st Edition, 2010.
8. Singiresu S. Rao, “Engineering Optimization Theory and Practice,” A Wiley-
Interscience Publication, New York, 3-rd Edition, 1996.
9. Xie Y, Steven G, “Evolutionary Structural Optimization,” Springer Publication,
Springer, Heidelburg, 1997.

62
Acknowledgement
I would like to express my deepest gratitude to Prof. B. Ravi, my research supervisor, for
being a great mentor to me. I am grateful to him for his patience, constant support and,
inculcating motivational thoughts to me.
I am thankful to Mr. Mayur Sutaria, Mr. Maxwel D’souza, Mr. Renukananda K.H.
and Mr. Vasudev Shinde who shares the same research domain and helped me with their
valuable knowledge whenever needed.
I am also grateful to the Mr. Akash Chavan, Mr. Rupesh Ghyar and Mr. Onkar
Paradkar my lab-mate for being a great support.
M. Jagdishwar
IIT Bombay